
Direct from Development: Tech Notes

Empowering Server Power Efficiency Profiles: Unleashing Power Savings in Bills & Usage


Tue, 16 Apr 2024 15:48:44 -0000
|Read Time: 0 minutes
Introduction
Over the last few years, the cost of power has continued to increase alongside the amount of power used in most data centers. Given these trends, customers are searching for strategies to reduce both the economic and environmental footprint of powering their server estates.
Simple strategies include virtualization and consolidation to reduce the number of physical servers, identifying zombie servers to be retired, and replacing older, less efficient servers with newer servers offering improved performance per watt.
BIOS System Profile Settings
Beyond the aforementioned strategies, Dell PowerEdge server customers can increase their power savings by selecting CPU power management and energy efficient policy settings in the system BIOS. These settings configure a collection of the rules that relate to server chip set behavior, including CPU C-state and CPU turbo mode, to increase power usage efficiency.
Selecting the most relevant setting can reduce CPU power demands while continuing to meet performance requirements to produce significant long-term cost savings. For example, in Intel®-based PowerEdge servers, customers can enable Dynamic Application Power Management (DAPC), which allows the BIOS to manage processor power states in order to achieve maximized performance per watt at all utilization levels. The full details of BIOS System Profile Settings can be found in the white paper, Set-up BIOS on the 16th Generation of PowerEdge Servers.
Testing and results
To demonstrate the effectiveness of the various profiles on power efficiency and server performance settings, SPEC Power® 2008 version 1.11.0 benchmarking was run for each setting. The SPEC Power® benchmark exercises the server at ten workload levels and combines power and performance into a single metric that measures power efficiency in operations per watt.
Table 1. SPEC Power® benchmark results
Max Perf Performance | DAPC Performance | DAPC Balanced Perf | DAPC Balanced Energy | DAPC Energy Efficient | |
SPEC Power® Score | 8621 | 10311 | 10378 | 11105 | 11564 |
SPEC Power® 100% OP/s | 8,383,505 | 8,380,816 | 8,399,796 | 8,402,421 | 8,451,740 |
SPEC Power® 100% Watts | 602 | 602 | 602 | 602 | 602 |
SPEC Power® 100% Score PPR | 13924 | 13921 | 13943 | 13956 | 14036 |
SPEC Power® 60% OP/s | 5,052,076 | 5,047,622 | 5,068,899 | 5,051,143 | 5,066,320 |
SPEC Power® 60% Watts | 549 | 488 | 477 | 392 | 360 |
SPEC Power® 60% Score PPR | 9198 | 10343 | 10624 | 12890 | 14084 |
SPEC Power® Idle Watts | 269 | 125 | 125 | 121 | 122 |
We selected a Dell PowerEdge server with dual Intel® 6448Y 2.1GHz 32 cores with 256GB ram for the test. The SPEC Power® benchmark was run by the Dell Technologies Server Performance Analysis (SPA) team in the Dell Technologies Austin Server Performance lab. The summary of the results in Table 1 shows that using DAPC/Energy Efficient policy delivered the best overall SPEC Power® score with comparable performance. Looking at the individual results more closely, a server at 100% utilization has the same power usage irrespective of the BIOS profile. However, given that most customers are not running their servers at 100%, the 60% results have been highlighted, demonstrating the power savings available for a representative customer.
Substantial energy efficiency delivered
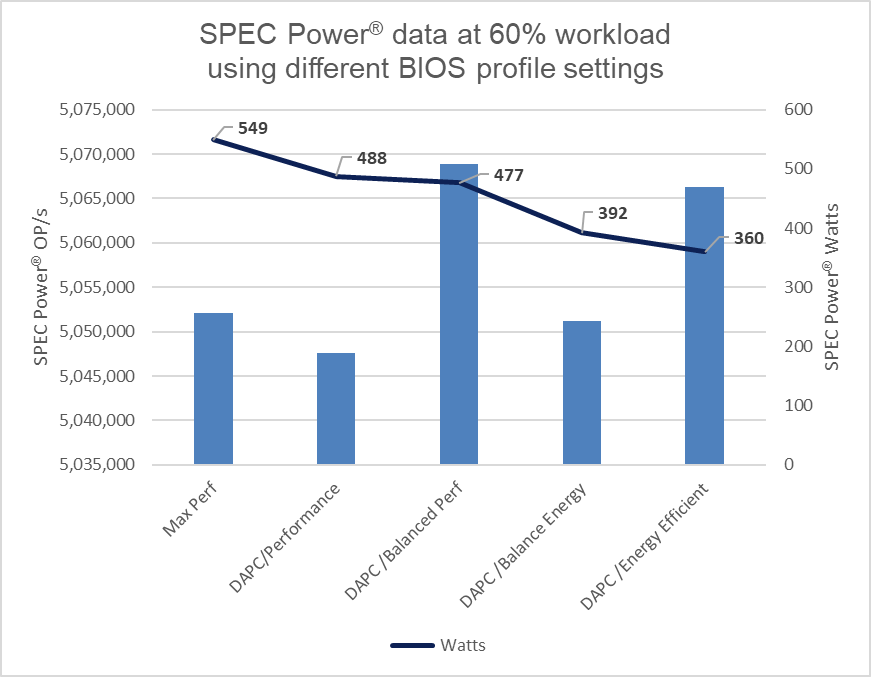
Figure 1. SPEC Power® results at 60%
The DAPC/Energy Efficient policy delivered 35% more savings in power usage as compared to the Max Performance profile.
Considering the average EU energy costs of $0.21[1] for an estate of 100 servers running at 60% load, there is a potential savings of $380,797 in energy costs over four years when comparing the Max Performance profile to the Energy Efficient policy. For a 1000-server estate, these potential savings increase to $1,523,188, all while maintaining server performance.
Those who have purchased an electric car in the last few years know that the range advertised by the manufacturer can differ to the mileage delivered in the real world. Treat these Dell Technologies results as guidance. It is recommended that customers run their own testing using their workloads.
These results are from Dell Technologies in-house testing as of January 2024. The cost of power was sourced from Consumer Energy Prices in Europe (qery.no). The full spec2008 results are posted on spec.org.
Changing BIOS profiles
BIOS profiles can be set several ways, the simplest being from the server BIOS access at boot using the <F2> key. That said, when faced with more than a few servers, this method becomes very time-consuming. There are a number of methods to automate this process, including running a script at the iDRAC API level or using a server configuration profile. A server configuration profile (SCP) is sometimes referred to as a template and can be used to bundle the system profile setting into the server firmware configuration. Using a tool such as OpenManage Enterprise (OME), a server template can then be deployed to each server’s iDRAC—or Dell remote access controller—to streamline and automate the application of these BIOS settings.
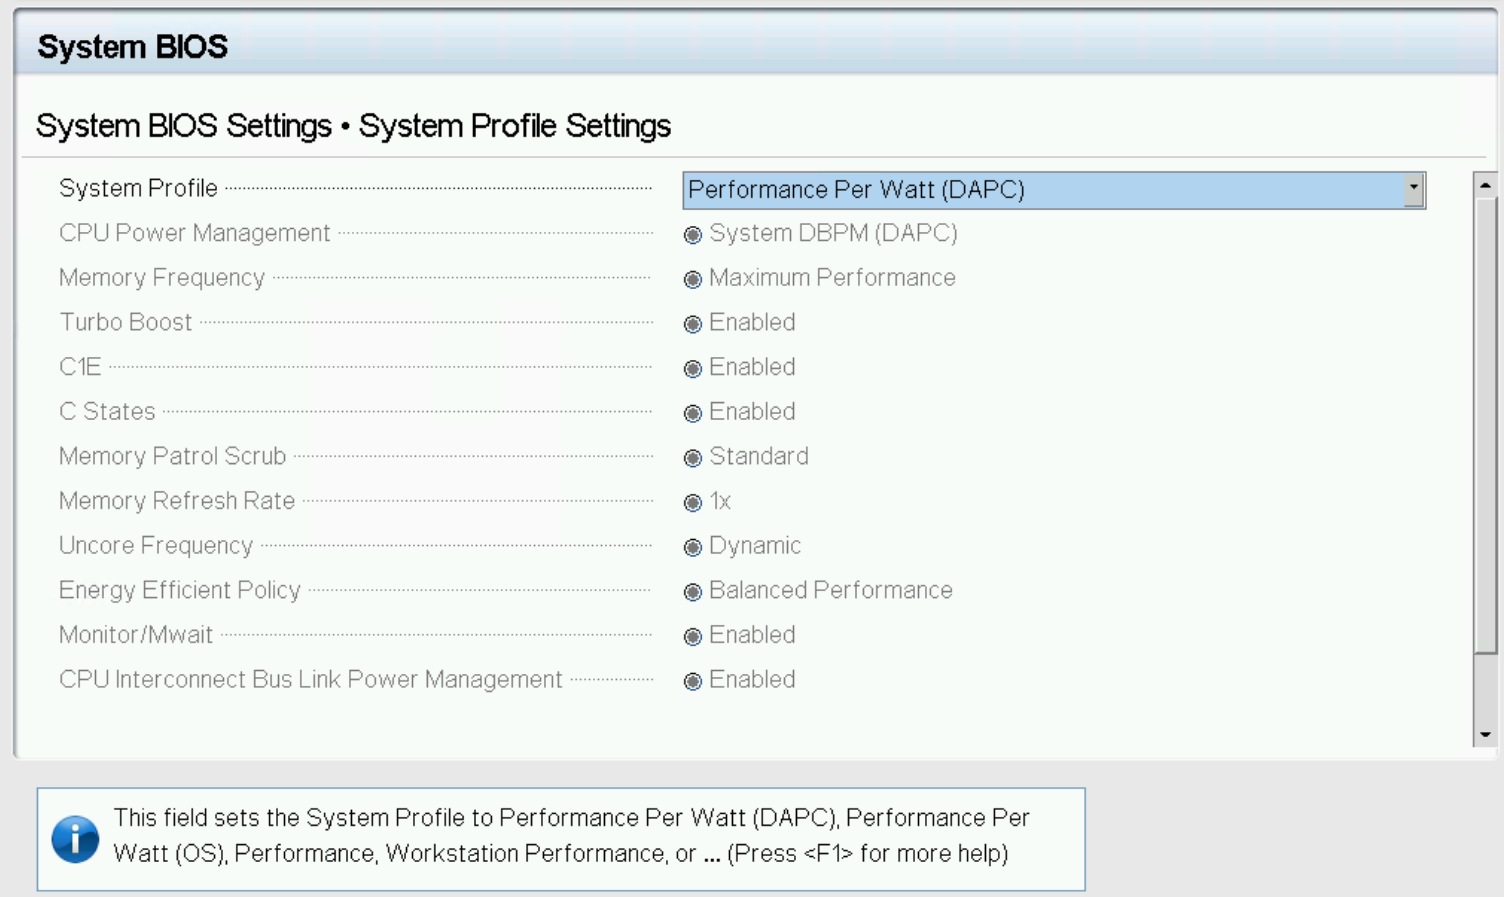
Figure 2. System profile in BIOS setup
For customers who want to track and report these settings on Dell PowerEdge servers, the Dell OME Power Manager plugin for OpenManage Enterprise enables the automatic grouping of servers by profile, displaying this information on the GUI as shown in Figure 3. The Power Manager plugin also offers a ready-to-run report template that breaks down the entire server estate, grouped by server profile. This report can be scheduled or run ad hoc.
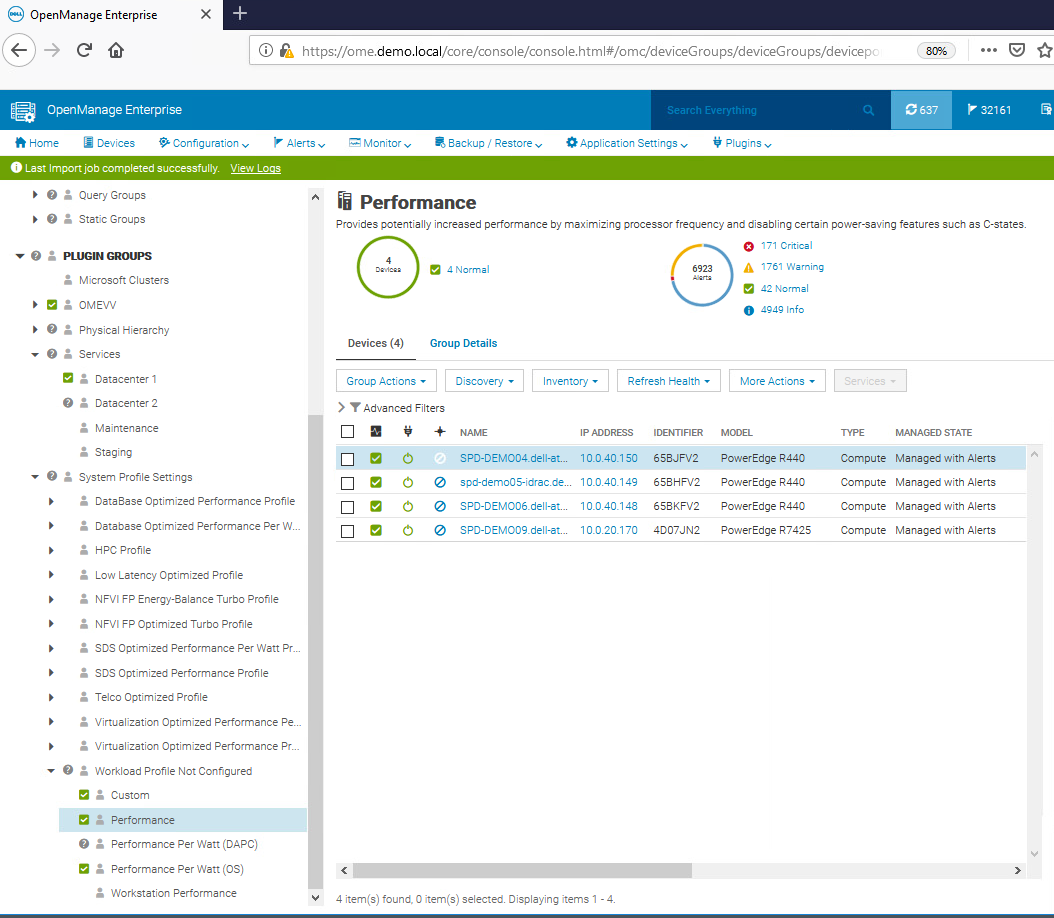
Figure 3. OpenManage Enterprise displaying BIOS profiles
System profiles and BIOS settings in detail
The following tables provide detailed background information about each system profile and the BIOS settings they alter for Intel®- and AMD-based PowerEdge servers.
Table 2. Intel® Platform System Profile
System Profile Settings | Performance Per Watt Optimized (DAPC) | Performance Per Watt Optimized (OS) | Performance | Workstation Performance |
CPU Power Management | System DBPM (DAPC) | OS DBPM | Maximum Performance | Maximum Performance |
Memory Frequency | Maximum Performance | Maximum Performance | Maximum Performance | Maximum Performance |
Turbo Boost | Enabled | Enabled | Enabled | Enabled |
Energy Efficient Turbo | Enabled | Enabled | Disabled | Disabled |
C1E | Enabled | Enabled | Disabled | Disabled |
C-States | Enabled | Enabled | Disabled | Enabled |
Memory Patrol Scrub | Standard | Standard | Standard | Standard |
Memory Refresh Rate | 1x | 1x | 1x | 1x |
Uncore Frequency | Dynamic | Dynamic | Maximum | Maximum |
Energy Efficient Policy | Balanced Performance | Balanced Performance | Performance | Performance |
Monitor/Mwait | Enabled | Enabled | Enabled | Enabled |
CPU Interconnect Bus Link Power Management | Enabled | Enabled | Disabled | Disabled |
PCI ASPM L1 Link Power Management | Enabled | Enabled | Disabled | Disabled |
Workload Configuration | Balance | Balance | Balance | Balance |
Table 3. AMD Platform System Profile
System Profile Settings | Performance Per Watt Optimized (OS) | Performance |
CPU Power Management | OS DBPM | Maximum Performance |
Memory Frequency | Maximum Performance | Maximum Performance |
Turbo Boost | Enabled | Enabled |
C-States | Enabled | Disabled |
Memory Patrol Scrub | Standard | Standard |
Memory Refresh Rate | 1x | 1x |
PCI ASPM L1 Link Power Management | Enabled | Disabled |
Determinism Slider | Power Determinism | Power Determinism |
Power Profile Select | High Performance Mode | High Performance Mode |
PCIE Speed PMM Control | Auto | Auto |
EQ Bypass To Highest Rate | Disabled | Disabled |
DF PState Frequency Optimizer | Enabled | Enabled |
DF PState Latency Optimizer | Enabled | Enabled |
Host System Management Port (HSMP) Support | Enabled | Enabled |
Boost FMax | 0 - Auto | 0 - Auto |
Algorithm Performance Boost Disable (ApbDis) | Disabled | Disabled |
Dynamic Link Width Management (DLWM) | Unforced | Unforced |
Conclusion
When implementing strategies for increasing server energy efficiency, selecting a BIOS system profile can result in significant power savings with minimal or no server performance degradation. The power cost savings for a 1000-server estate could potentially be $1,390,737 over four years. Additionally, as a result of low processor power consumption, the load on the cooling system in the data center is reduced, increasing savings on energy costs and power. Customers running an estate of Dell PowerEdge servers should review their use of these BIOS settings for their server workloads to better understand how these profiles can help to reduce power usage and lower energy bills.
References
- SPEC Power® benchmark details
- Dell Server BIOS attributes
- Infographic: Save energy and save money with Dell OpenManage Enterprise Power Manager
[1] For non-household consumers such as industrial, commercial, and other users not included in the households sector, average electricity prices in the EU stood at €0.21 per kWh (excluding VAT and other recoverable taxes and levies) for the first half of 2023 according to the latest Eurostat data, Consumer Energy Prices in Europe (qery.no)
Authors: Mark Maclean, PowerEdge Technical Marketing Engineering; Kevin Locklear, ISG Sustainability; Donald Russell, Senior Performance Engineer, Solution Performance Analysis

Dell 277V AC & HVDC Power Supplies
Wed, 25 Oct 2023 21:40:08 -0000
|Read Time: 0 minutes
Introduction
This Direct from Development (DfD) tech note describes how mixed-mode 277V AC & HVDC (260-400V DC) power supplies are important, and how they can benefit our customers.
Data center power and high voltages
Although 208V AC is the traditional voltage used in US data centers, there has been a shift towards higher voltages in recent years. Some modern data centers are adopting 415V AC or even 480V AC 3-phase, to further enhance energy efficiency.
480V AC 3-phase is becoming increasingly popular due to its many advantages over traditional 415V AC 3-phase or 240V AC single-phase:
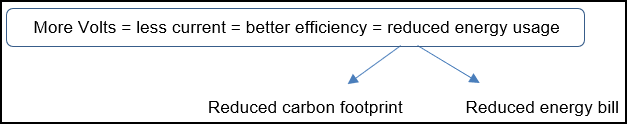
- Less current is needed to deliver the same amount of power as 415V or 240V. Less resistance means less energy loss in cables and electrical components.
- Reduced wiring costs: 480V allows the use of higher gauge, thinner, cheaper wires. This also means reduced installation costs.
- Increased power density: By using 480V, data centers can increase their power density, because more power can be delivered using the same amount of space.
Data centers that are getting 480V 3-phase power from the utility typically convert it to 208V/120V single-phase. To do that, they use transformers. But even with the most efficient transformer, there are power losses during the conversion (around 3%). This is where PSUs that can support voltages higher than 240V AC become relevant.
About 277V AC
To avoid transformer losses and bring single-phase high-voltage directly to the server PSU, a convenient option exists: splitting 480V AC 3-phase into 277V AC single-phase lines.
To do that, data centers typically use Line-to-Neutral Power Distribution Units (PDUs), which divide the 480V AC 3-phase power into three separate 277V AC single-phase lines, by using “Wye” (Y) wiring:
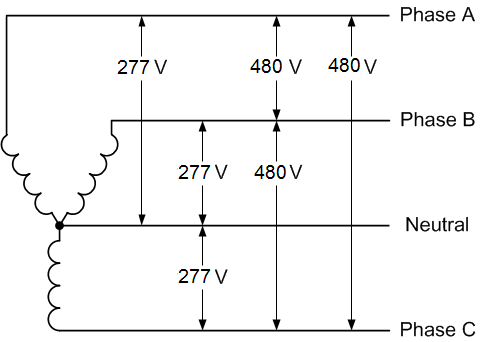
In simple words, 277V AC is derived from 480V AC. If the PSU can directly support 277V AC, there is no need for conversion and no need for a transformer.
That is the first benefit of high-voltage PSUs: they help data centers reduce their energy consumption at the power distribution level.
The advantages of 277V AC
To understand how higher voltage can bring better efficiency, we must look at the basic principle of Power transmission.
Power, measured in watts, is the rate at which energy is transferred. It is proportional to Voltage multiplied by Current:
- Power (Watts) = Electric Tension (Volts) x Current (Amps)
Therefore, if the voltage is increased, the current required to transmit a given amount of power can be reduced. For example, to transmit 10kW of power:
- at 230V AC, the current required is 10kW / 230V = 43.5A
- at 277V AC, the current required is only 10kW / 277V = 36.1A
When transmitting power at 277V AC, the energy loss due to resistance is lower than at 230V AC. Less current (Amps) is needed, resulting in higher efficiency, and potentially significant energy savings.
Less current also means we can use higher gauge (thinner) wires, which use less copper. This can help with space optimization, by either reducing the overall volume of wires or increasing the power density.
So, although 200V-240V AC is the most common voltage range in data centers nowadays, using 277V AC brings considerable advantages:
- Reduced energy losses, resulting in Opex savings
- Reduced equipment expenses and reduced copper
- Reduced space requirements and fewer cable runs in the plenum
- Fewer breakers at the Remote Power Panel (RPP)
- Increased capacity
277V AC business opportunities
Here are the most common business opportunities for 480V AC at the rack and 277V AC at the PSU:
- Large RFPs from the US Federal Government
- HPC customers (optimized power delivery to the cluster and lower energy cost)
- AI/ML customers with high-end GPU-dense platforms
- Any customer looking for more efficiency, energy savings, and carbon footprint reduction
HVDC (260V to 400V DC)
Our high-voltage mixed-mode power supplies support these two input voltages:
- 277V AC
- HVDC (High-Voltage 260-400V DC), this voltage is mostly used by Telecommunications customers.
The advantages of HVDC
High Voltage DC has many advantages over AC and -48V DC in the Telco space:
1. Higher Efficiency:
- vs AC: DC power distribution is usually more efficient than AC power distribution, and higher voltages can improve this efficiency further. Also, fewer conversion stages are needed with HVDC (typically two instead of four).
- vs -48V DC: by increasing the voltage from -48V DC to 400V DC, power losses due to electrical resistance in cables and other components can be reduced, resulting in higher overall efficiency.
2. Lower Cost:
- vs AC: Less Capex with simplified installation and gradual investments compared to traditional AC UPS. Less Opex because easier maintenance leads to lower maintenance costs. HVDC also requires less cooling than AC due to fewer conversions.
- vs -48V DC: Less Capex because 400V DC requires fewer cables (less copper) and smaller/fewer components. Less current is needed compared to -48V DC for the same amount of power, and fewer joules are lost in the distribution.
3. Smaller Footprint:
- Because 400V DC requires fewer cables and electrical components, it can be easier to install. It can also use less physical space within the data center. This can be especially advantageous in high-density environments where space is at a premium.
HVDC business opportunities
Here are the most common business opportunities for HVDC 260-400V DC power:
- Telecom customers who are modernizing their infrastructure, either at the data center level, or at the mobile network level (antennas) where -48V DC is being replaced by 400V DC.
- The adoption of 400V DC power in telecommunications is also driven by standardization efforts. Organizations such as the Telecommunications Industry Association (TIA) and the International Electrotechnical Commission (IEC) have developed standards for higher-voltage DC power distribution in telecommunication applications.
- Renewable energy systems: solar photovoltaic installations, for example, can use 400V DC power.
- Electric Vehicle Charging Stations: EV charging stations can employ 400V DC power for fast charging capabilities. DC charging allows for direct power transfer to the vehicle's battery, reducing charging time and minimizing energy losses.
Conclusion
Modern workloads such as Generative AI or HPC require more and more power, but energy costs are rising at the same time. Therefore, companies all over the world must solve new technical and economic challenges, to power and cool down their infrastructure.
Different solutions are available today to reduce power consumption, such as using more efficient PSUs. For example, 80Plus Titanium PSUs can reach up to 96% efficiency, with only 4% of the electricity lost into heat. This type of PSU can significantly reduce power consumption and cooling costs.
Better efficiency is also achievable by right-sizing the PSU. Overloading and underloading will have a negative impact. A 50% load is considered optimal to get the best efficiency.
For example, when tested at 240V AC, a Dell 1100W Titanium PSU has the following efficiencies:
Dell 1100W Titanium PSU | ||||
PSU load in % | 10% | 20% | 50% | 100% |
PSU load in Watts | 110W | 220W | 550W | 1100W |
PSU efficiency at 240V AC | 90% | 94% | 96% | 91.5% |
But as we look at other ways to maximize power efficiency, we must also consider input voltages and the power distribution itself.
Data centers can achieve massive savings if:
- They can avoid using transformers to convert the high-voltage they get from the power utility, down to the traditional 208-240V AC
- The servers can directly take 277V AC or HVDC with appropriate PSUs
So, as we focus on sustainability, using higher voltages is an impactful way to achieve better power efficiency, reduce energy costs, and reduce the overall carbon footprint.
As data centers continue to grow, in size and number, the impact on the environment increases as well. Therefore, it is important for companies to consider not only the economic implications of their energy usage but also the environmental implications, and work towards more sustainable practices.
Dell is convinced that 277V AC & HVDC voltages can help customers solve some of the complex problems related to power distribution and achieve better sustainability overall.
We are expecting a growing market and infrastructure renewals to support high voltages in the upcoming years. For this reason, our plan is to expand our portfolio of 277V AC & HVDC PSUs and progressively increase the number of compatible platforms.

Choosing the Most Appropriate Server SDD Interfaces: E3.S, NVMe, SAS, or SATA
Sun, 10 Sep 2023 15:32:11 -0000
|Read Time: 0 minutes
Summary
This document is a straightforward guide to help PowerEdge customers choose the most appropriate SSD type, based on their business needs and goals.
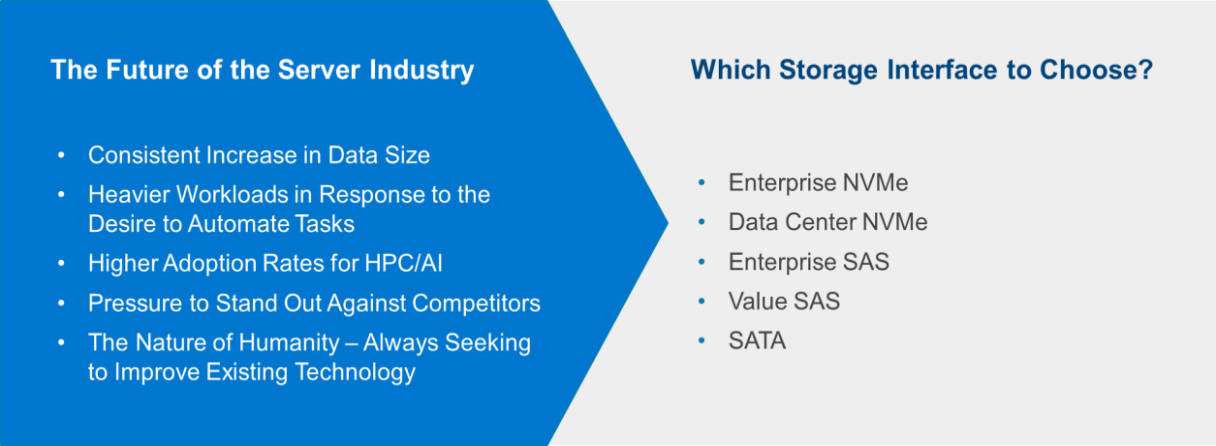
As new generations of CPUs and servers are released, they frequently bring new technologies such as increased PCIe bus speeds and new storage formats, such as the EDSFF E3.S form factor for NVMe PCIe 5 Solid State Drives (SSDs), as released in early 2023. PowerEdge customers can optimize their local storage configurations based on their applications and business needs. Multiple factors must be taken into consideration to make an informed decision, such as workload demands, budget, scale, and even roadmap. Still, when all of these factors are understood, it can be difficult to determine the best choice of SSD interface among NVMe, SAS, Value SAS, and SATA.
This DfD (Direct from Development) tech note is provided to simplify and guide customers in their choice of SSD. We hope customers will find it to be a valuable resource when it becomes unclear which storage medium is the optimal choice. First, let’s summarize the history and architecture of the NVMe, SAS, Value SAS, and SATA SSD interfaces:
NVMe (Non-Volatile Memory Express)
Since it came to market in 2011, the NVMe interface remains the class of flash storage with the highest performance. The driving architectural differentiator of NVMe is that it uses the PCIe interface bus to connect directly to the CPU and streamline the data travel path. This design contrasts with SAS and SATA, which require data to first traverse to an HBA disk controller before reaching the CPU. By removing a layer from the stack, the travel path is optimized and produces reduced latency and improved performance. Scalability is also significantly improved, because NVMe drives can go beyond the traditional four lanes by using lanes from the same “pool” of lanes connected to the CPU. EDSFF including EDSFF E3.S are the next generation of NVMe SSDs. These form factors enable higher server storage density. Furthermore, NVMe performance continually improves as each new generation of the PCIe standard becomes available.
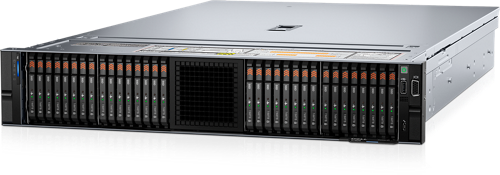
Figure 1. Latest Dell PowerEdge R7625 with 32 x E3.S drives
SAS (Serial Attached SCSI)
The SAS interface was released a few years after SATA and introduced new features that are beneficial for modern workloads. Instead of building upon the ATA (Advanced Technology Attachment) standard used in SATA, SAS serialized the existing parallel SCSI (Small Computer System Interface) standard. SAS cable architecture has four wires within two cables, creating more channels available for moving data and more connectors available for use by other devices. Furthermore, the channels are full duplex, allowing for reads and writes to traverse concurrently. Improved reliability, error reporting, and longer cable lengths were also introduced with SAS. Value SAS is often alongside SAS using the same interface but using lower performance devices, giving customers the technical benefit of SAS at a lower a price point. SAS improvements are made to this day, with SAS4 (24G) now available in certain supported PERC 12 (PowerEdge Raid Controller) configurations. For this reason, SAS still remains valuable and relevant within the market.
SATA (Serial Advanced Technology Attachment)
The SATA interface was released in 2000 and is still commonly adopted within modern servers because it is the most affordable of the SSD interface options. It replaced parallel ATA with serial ATA, which resolved various performance and physical limitations at that time. The SATA cable architecture has four wires within one cable—two for sending data and two for receiving data. These four channels are half-duplex, so data can only move in one direction at a time. At 6Gb/s, SATA write speeds are sufficient for storing information, but its read speeds are slow compared to more modern interfaces, which limits its application use for modern workloads. The last major SATA revision was in 2008, and SATA will not see further advancement in the future.
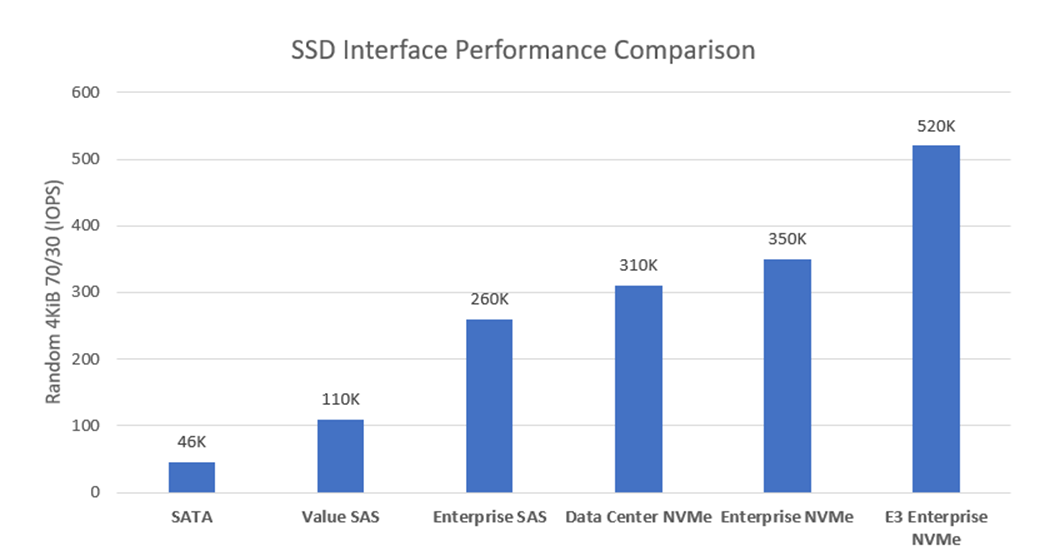
Figure 2. Random 4KiB 70% read / 30% write IOPS variances for each storage interface
Table 1 lists key metrics for five storage-drive types most commonly attached to PowerEdge servers: Enterprise NVMe, Data Center (DC) NVMe, Enterprise SAS, Value SAS, and SATA. This comparison helps clarify which storage interface type is most applicable to specific business needs and goals.
Table 1. Ranking performance metrics of Enterprise NVMe, DC NVMe, Enterprise SAS, Value SAS, and SATA drives
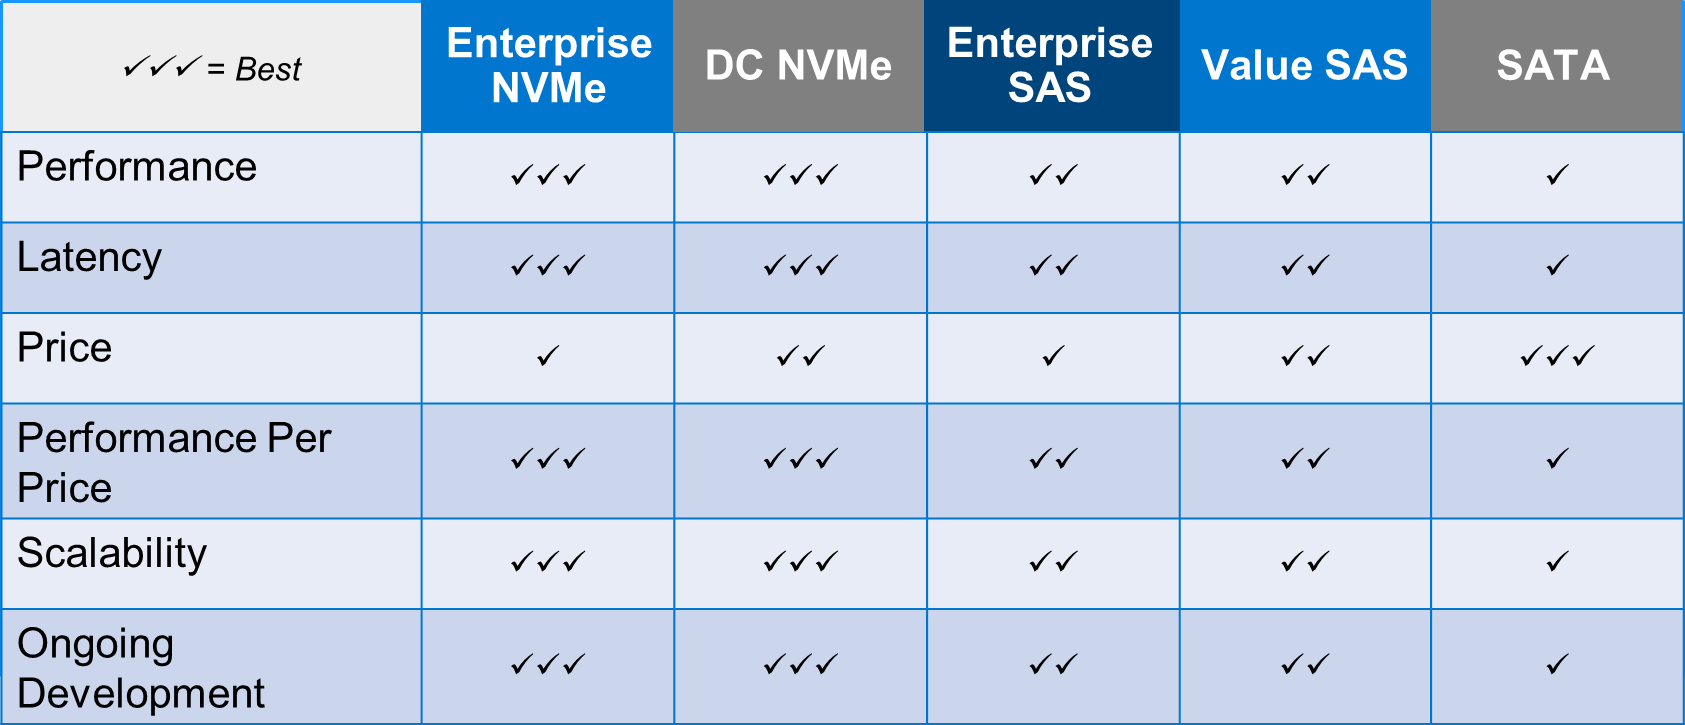
Performance: Performance can be measured in various ways. For this example, Random 4 KiB 70/30 (70% reads, 30% writes) data was compared and published here by Dell, with higher IOPS being better. Figure 2 illustrates the following IOPS performance variances:
- E3.s NVMe Enterprise class drives produce 1.48x more IOPS than Enterprise NVMe SSDs.
- Enterprise NVMe SSDs produce 1.13x more IOPS than DC NVMe SSDs.
- DC NVMe SSDs produce 1.99x more IOPS than Enterprise SAS SSDs.
- Enterprise SAS SSDs produce 1.42x more IOPS than Value SAS SSDs.
Lastly, Value SAS SSDs produce 2.39x more IOPS than SATA. Random 4KiB 70% read / 30% write IOPS variances for each storage interface
Latency: The NVMe protocol reduces the number of touchpoints that data must travel (bypassing the HBA) to reach the CPU. It also has less overhead, giving it significantly lower latency than SAS and SATA. The SAS protocol is full-duplex (as opposed to half-duplex) and offers two channels (as opposed to one) for data to use, giving it over 50% lower latency than SATA.
Price: According to Dell pricing in Q1 2022, SATA SSDs are the least expensive storage interface, at ~0.9x the price of Value SAS SSDs. Value SAS SSDs are ~0.85x the price of DC NVMe SSDs. DC NVMe SSDs are ~0.85x the price of Enterprise SAS SSDs. Enterprise SAS SSDs are ~0.97x the price of Enterprise NVMe SSDs. Pricing is volatile and these number variances are subject to change at any time.
Performance per price: PowerEdge customers who have not identified which metric is most important for their business goals should strongly consider performance (IOPS) per price (dollar) to be at the top of the list. Because NVMe has such a significant performance lead over SAS and SATA, it is easily the golden standard for performance per price. DC NVMe SSDs have the best performance per price, followed closely by Enterprise DC NVMe SSDs, followed by Value SAS SSDs, followed closely by SAS SSDs, followed by SATA SSDs. This tech note gives more performance/price detail.
Scalability: Currently, NVMe shows the greatest promise for wider-scale implementation due to the abundance of lanes that can be available with low overhead. However, it can be a costly investment if existing data center infrastructures must be upgraded to support the NVMe I/O protocol. SAS is more flexible, because SAS expanders are cost-effective, and most data center infrastructures already have the required hardware to support it. However, SAS does not have the potential to scale out as aggressively as NVMe. SATA does not scale well with SSDs.
Ongoing development: The NVMe interface has consistent and substantial advancements year-over-year, including updates such as NVMe 2.0b (released in Oct. 2022) and PCIe 5.0 (released on Intel CPUs in Jan. 2023). The SAS interface also has regularly cadenced updates, but the impact is mostly marginal, except for the recent SAS4 (24G) update. There are no plans to extend the capabilities of the SATA interface beyond the current limitations.
Assigning these ranks for each storage interface and metric, and explaining why the rank was given, will make it easier to understand which drive type will be the most valuable in relation to business needs and goals.
Guidance in accordance with business goals
Each business is unique and will have different requirements for their storage drives. Factors such as intended workload, business size, plan to scale, budget, and so on, should be considered to make a confident investment decision. Although this decision is ultimately up to each business, we provide the following guidelines to help businesses that are still undecided to make an educated choice:
Enterprise NVMe SSD: Businesses that desire maximum performance and have a flexible budget should consider purchasing Enterprise NVMe SSDs. Storage I/O heavy workloads such as HPC or AI will immediately benefit from the additional cache gained from the non-volatile nature of this storage interface. The fast-paced performance growth seen in Enterprise NVMe SSDs will also allow smaller workloads like databases or collaboration to easily keep up with the ever-increasing size of data. Ultimately, because Enterprise NVMe undergoes consistent valuable changes every year, such as performance increases and cost reduction/optimization, we recommend futureproofing your data center with it.
DC NVMe SSD: Businesses that desire a budget conscious NVMe solution, in addition to the greatest value, should consider purchasing DC NVMe SSDs. These drives have the same value proposition as for Enterprise NVMe SSDs, but with a sizeable price reduction (0.83x) and performance hit (0.86x). Businesses that want to get the best value will be pleased to know that DC NVMe drives have the best performance-per-price.
Enterprise SAS: Businesses that desire to continue using their existing SCSI-based data center environment and have maximum SAS performance should consider purchasing Enterprise SAS SSDs. Although the Enterprise SAS interface does not currently have any ranking leadership for performance or pricing, it is established in the industry as highly reliable, cost-effective to scale, and shows promise for the future, with 24G available. Enterprise SAS SSDs will adequately handle medium-duty workloads, such as databases or virtualization, but will operate best when mixed with NVMe SSDs if any heavy-duty workloads are included.
Value SAS: Businesses that desire a budget-conscious SAS solution should consider purchasing Value SAS SSDs. These drives have the same value proposition as for Enterprise SAS SSDs, but with both a sizeable price reduction (0.73x) and performance hit (0.71x). For this reason, it has a slightly lower performance-per-price than Enterprise SAS, and is therefore more of a “value” play when compared to SATA. This storage interface has a purpose for existing though, because small-to-medium businesses with a smaller budget can leverage this lower-cost solution while still receiving the many benefits of the SAS interface.
SATA: Businesses that desire the lowest price storage interface should consider purchasing SATA SSDs. However, caution should be applied with this statement, because there is currently no other value proposition for SATA SSDs, and the price gap for these flash storage interfaces has been shrinking over time, which may eventually remove any valid reason for the existence of SATA. With that said, SATA is currently still a solid choice for light workloads that are not read-heavy.
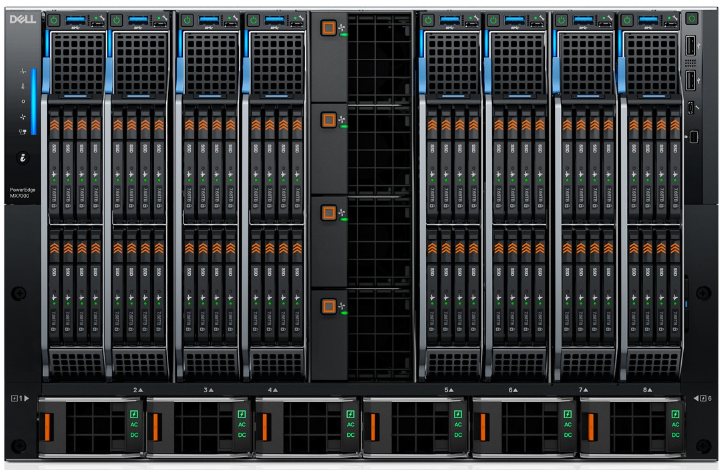
Figure 3. Latest Dell PowerEdge MX760c with 8 x E3.S drives per sedge
Conclusion
The story of competing NVMe, SAS, and SATA storage interfaces is still being written. Five or more years ago, analysts made the argument that although NVMe has superior performance, its high cost warranted SAS the title of ‘best value for years to come’. What we see today is a rapidly shrinking price gap for all of these interfaces. We observe that SATA performance has fallen far behind SAS, and very far behind NVMe, with no plan to improve its current state. We also see NVMe optimizing its performance and price-point to yield more market share every year. Most importantly, we expect rapid growth in the industry adoption of heavier workloads and ever-increasing data requirements. Both storage drive and industry trends lead us to believe that the best option for any business desiring to build a future-proofed data center would be to begin making the investment in NVMe storage. However, the remaining types of storage still hold value for varying use cases. It is the customer’s choice about which storage type is best for their business goals. We hope this guide has helped to clarify the available options.
Firmware Device Order for PERC H750, H755, H350, and H355 Storage Controllers (Linux Only)
Thu, 20 Jul 2023 20:10:45 -0000
|Read Time: 0 minutes
Summary
Dell Technologies provides a feature to the PERC 11 family of controllers that gives users the limited ability to influence the ordering of devices within Linux operating systems.
This DfD tech note is intended to educate customers about this feature and its caveats. It also provides the necessary background about device enumeration.
Introduction
PERC 11-series controllers provide a feature called Firmware Device Order that provides limited operator control of the order of host-visible SCSI devices in compatible Linux distributions[1]. A This feature is called Firmware Device Order (FDO). When enabled, this feature influences the Linux kernel’s SCSI device enumeration (that is, the /dev/sdXX ordering).
This feature is particularly targeted to customers transitioning from PERC 9/10 controllers to PERC 11 on Dell’s 14G PowerEdge servers, while looking to maintain a consistent device order enumeration.
This document describes the design, control, and limitations of this feature.
Background
Linux device enumeration
The PERC device driver presents to the Linux kernel a pseudo-SCSI (Small Computing System Interface) adapter where the configured Virtual Drives (VDs) and Non-RAID drives are individual SCSI targets.
The PERC device driver does not directly control the SCSI disk drive enumeration. It is the kernel’s prerogative, for example, to use /dev/sda to refer to the first discovered drive. The feature in this DfD will enforce an ordering in the revealing of SCSI disk drives to the kernel.
PERC 11
PERC 11-series controllers support the concurrent existence of Non- RAID and Virtual Drives (VDs).
Under Linux, without Firmware Device Order enabled, the PERC driver enumerates any configured Non-RAID drives first, followed by VDs. This results in the Non-RAID drives having lower /dev/sdXX device assignments than VDs when listed alphabetically.
The ordering logic within the two groups – Non-RAID and Virtual Drives – differs between PERC H75x and PERC H35x. For details, see the following table:
Table 1. PERC 11-series default Linux enumeration
Group | Property | PERC H75x | PERC H35x |
1st | Type | Non-RAID | Non-RAID |
Ordering | Enclosure/Slot position order | Discovery order, | |
2nd | Type | Virtual Drives | Virtual Drives |
Ordering | Reverse creation order | Order of creation |
Although creating VDs while the OS is running is a supported PERC operation, note that newly created devices may not adhere to the ordering rules in Table 1. After a restart, those rules apply.
Creating a new VD after deleting Virtual Disks out-of-order might alter the presentation order (that is, deleting a VD other than the last VD, then creating a new VD).
The following table represents an example configuration where a PERC H75x controller has two VDs created and two Non-RAID drives. This ordering is what will appear in a Linux-based operating system enumeration after booting the system.
Table 2. PERC H75x default Linux enumeration example
Type | Description | Block Device |
Non-RAID
| Non-RAID in backplane slot 6 | /dev/sda |
Non-RAID in backplane slot 7 | /dev/sdb | |
Virtual Drives | Second VD created | /dev/sdc |
First VD created | /dev/sdd |
Note that for demonstration purposes, the block device enumeration is assumed to start as /dev/sda. That may not be the case in your system if the Linux kernel discovered other SCSI attached devices prior to enumeration of the drives attached to PERC.
Introducing the Firmware Device Order feature
Functionality
Firmware Device Order (FDO) alters the order of device presentation to the Linux kernel. It adds a third type - the designated boot volume. When enabled, the following order is used:
- Designated boot device
- Virtual Drives (VDs)
- Non-RAID drives
Table 3. PERC 11-series FDO Linux enumeration
Order | FDO enabled |
1st | Boot device |
2nd | Virtual Drives |
3rd | Non-RAID |
Firmware Device Order requires supported PERC 11-series controller firmware and a FDO aware Linux device driver. See the section Minimum required component versions.
Boot device
The boot device specified in the PERC controller will be presented first to the Linux kernel. The boot device may be chosen by the operator, or if none is chosen, the PERC controller automatically determines its designated boot device. Either a Virtual Drive or a Non-RAID drive can be a boot device. The PERC controller and driver use this information regardless of the system’s current boot mode and independent of whether the boot device was used to boot the current running operating system.
See the PERC 11 User’s Guide for further instructions about how to designate a boot device.
Virtual drives
After the optional boot device, the configured Virtual Drives will be presented to the Linux kernel in the order of creation (that is, the 1st VD created is presented 1st, the 2nd VD created is presented second, and so on).
Non-RAID drives
Non-RAID drives are presented after the VDs. Non-RAID drives are presented in the order of PERC’s discovery of the drives during system boot. This may not be the same as the ordering of enclosure/slot position of the drives.
Summary
The following table summarizes the Firmware Device Order behavior for PERC H75x and PERC H35x.
Table 4. PERC 11-series Firmware Device Order Linux enumeration
Group | Property | PERC H75x | PERC H35x |
1st | Type | Boot device | Boot device |
2nd | Type | Virtual Drives | Virtual Drives |
Ordering | Creation order | Creation order | |
3rd | Type | Non-RAID | Non-RAID |
Ordering | Discovery order, Not based on slot | Discovery order, Not based on slot |
How to enable Firmware Device Order
Overview
Firmware Device Order (FDO) is disabled by default. To enable FDO you can use the PERC System Setup Utility or the perccli utility. Note that FDO requires:
- Using or installing a compatible Linux-based operating system
- Using a compatible PERC Linux device driver
- Selecting a preferred boot device (see the Boot device section)
System setup
The PERC 11-series firmware includes a new Human Interactive Interface (HII) setting to enable the Firmware Device Order feature. This setting is on the Advanced Controller Properties page.
- Open the Dell PERC 11 Configuration Utility.
- Select Main Menu > Controller Management > Advanced Controller Properties.
- Select Firmware Device Order, then select the option desired.
- Confirm the change by selecting Apply Change.
Note that a system restart is necessary for an FDO enable or disable operation to take effect. See the section Manage PERC 11 Controllers Using HII Configuration Utility of the User's Guide for steps to enter and navigate in HII.
The perccli utility
You can use the perccli utility to query the current Firmware Device Order setting, and to enable/disable the feature (see the Minimum required component versions section).
To query the current setting:
# perccli /cx show deviceorderbyfirmware
To enable Firmware Device Order:
# perccli /cx set deviceorderbyfirmware=on
To disable Firmware Device Order:
# perccli /cx set deviceorderbyfirmware=off
where x is the controller instance for the PERC 11-series controller being targeted.
Note: A system restart is necessary for an FDO enable or disable operation to take effect.
Operating system support
Overview
The Firmware Device Order feature is only supported on Linux distributions. Enabling the feature on systems that run other operating systems, such as Microsoft Windows or VMware ESXi, will result in no VDs nor Non-RAID drives being visible in these operating systems. If this is attempted, disable the feature, and reboot your system. The contents on the underlying storage/devices are not affected by the setting.
Linux
A Firmware Device Order compatible device driver must be used on Linux-based distributions. Using an incompatible driver causes both VDs and Non-RAID drives to be hidden from the host.
The following table lists the minimum versions of the major Linux distributions that support the Firmware Device Order feature.
Table 5. FDO enabled distributions
Distribution | Inbox driver version |
RHEL 8.2 | 07.710.50.00-rh1 |
RHEL 7.8 | 07.710.50.00-rh1 |
SLES 15 SP2 | 07.713.01.00-rc1 |
Ubuntu 20.04 LTS | 07.710.06.00-rc1 |
Notes:
Not all operating system distribution release versions listed in Table 5 may be supported by your specific system and controlled combination. See the Linux OS Support Matrix on Dell.com to confirm the supported Linux distributions for your system and PERC controller.
Linux 5.x kernels and above probe for block devices asynchronously. Device ordering can be inconsistent because of this, even with FDO enabled. See the OS documentation for custom persistent device alternatives.
Unsupported operating systems
Attempting to boot into an operating system running a device driver that does not support Firmware Device Order will result in no storage being presented to the operating system. If PERC is your boot controller, the OS will fail to start correctly. After the system reboots, the PERC 11- series will display a warning indicating that an incompatible operating system driver was detected.
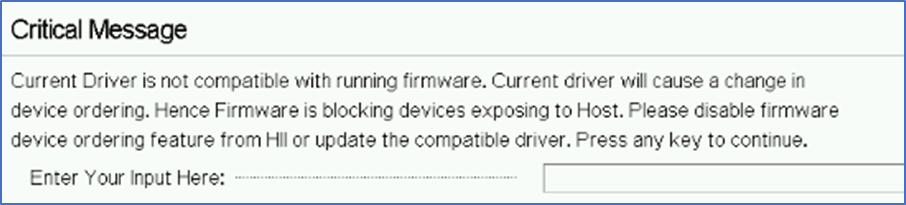
Figure 1. Critical message displayed with incompatible operating system
If this message appears on your system, it means that you are running an incompatible operating system with Firmware Device Order enabled. (To disable Firmware Device Order, see the System setup section).
Windows
Microsoft Windows is not supported with Firmware Device Order.
VMware ESXi
VMware ESXi is not supported with Firmware Device Order.
Minimum required component versions
This section lists the minimum PERC 11-series component versions required to use the Firmware Device Order (FDO) feature.
Table 6. FDO minimum component versions
Component | PERC H75x | PERC H35x |
Controller Firmware | 52.16.1-4074 | 52.19.1-4171 |
Linux Device Driver | 07.707.51.00-rc1 | 07.707.51.00-rc1 |
perccli Utility | 7.1604.00 | 7.1604.00 |
Note: Not all firmware, driver, and utility version combinations may be supported by your system and controller combination. Visit support.dell.com for the latest component releases for your system and PERC controller.
Summary
The new PERC series-11 Firmware Device Order (FDO) feature enables an alternate presentation order of Virtual Drives and Non-RAID drives. This feature is particularly targeted to those customers on Dell’s 14G PowerEdge who want to transition to PERC 11 from PERC 9/PERC 10. The FDO feature requires a supporting PERC 11-series firmware, an aware device driver, and that the system be running a Linux-based operating system. If you prefer, the feature can be turned off at any time to resume traditional enumeration, or to transition from a Linux environment to another operating system
[1] Includes PERC H750, PERC H755, PERC H350, and PERC H355 storage controllers. See the Minimum required component versions section.

Memory Bandwidth for Next-Gen PowerEdge Servers Significantly Improved with Sapphire Rapids Architecture
Mon, 17 Apr 2023 19:07:00 -0000
|Read Time: 0 minutes
Summary
New PowerEdge servers fueled by 4th Generation Intel® Xeon® Scalable Processors can support eight DIMMs per CPU and up to 4800 MT/memory speeds. This document compares memory bandwidth readings observed on new PowerEdge servers with Sapphire Rapids CPU architecture against prior-gen PowerEdge servers with Ice-Lake CPU architecture.
Sapphire Rapids CPU architecture
4th Generation Intel® Xeon® Scalable Processors, known as Sapphire Rapids processors, are the designated CPU for new Dell PowerEdge servers.
Compared to prior-gen 3rd Generation Intel® Xeon® Scalable Processors, Sapphire Rapids Architecture supports up to 50% higher memory bandwidth (4800MTS (1DPC)/4400MTS(2DPC) on 4th Gen Intel® Xeon® Scalable Processors vs 3200MT/s on Ice Lake Processors).
Performance Data
To quantify the impact of this increase in memory support, we performed two studies. The first study[1] (see Figure 1) measured memory bandwidth determined by the number of DIMMs per CPU populated. To measure the memory bandwidth, we used the STREAM Triad benchmark. STREAM Triad is a synthetic benchmark that is designed to measure sustainable memory bandwidth (in MB/s) and a corresponding computation rate for four simple vector kernels. Of all the vector kernels, Triad is the most complex scenario. It was run on previous generation Dell PowerEdge R750 powered by Intel® Ice Lake CPU populated with eight DDR4 3200MT/s DIMMs per channel and the latest generation Dell PowerEdge R760 powered by Intel’s latest Sapphire Rapids populated with eight DDR5 4800MT/s DIMMs per channel. As a result, we saw a performance increase of 53% for 6 DIMMs per channel and 46% for 8 DIMMS per channel.
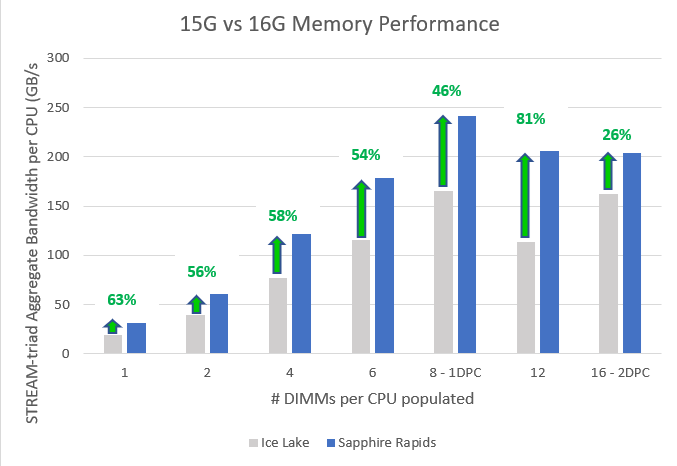
Figure 1. Sapphire Rapids and Ice Lake bandwidth comparison by # of DIMMs per CPU
The second study[1][2] (see Figure 2) measured memory bandwidth determined by the number of CPU thread cores. Both STREAM bandwidth benchmarks have Sapphire Rapids populated with eight DDR5 4800MT/s DIMMs per channel, and Ice Lake populated with eight DDR4 3200 MT/s DIMMs per channel. This resulted in up to 50% more aggregate bandwidth available for 32+ core threads, which is ideal for memory applications such as SAP HANA, MSFT SQL, and VDI.
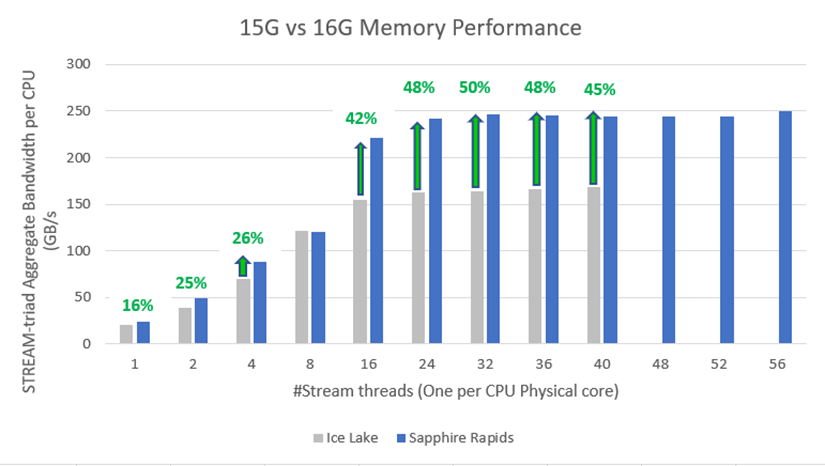
Figure 2. Sapphire Rapids and Ice Lake bandwidth comparison by # of CPU core threads
Conclusion
With improved bandwidth, and continuous improvements for providing a quality customer experience on memory, all provided in a dense form factor of DDR5, Dell Technologies continues to provide best-in-class features and specifications for its constantly evolving better and faster PowerEdge server portfolio.
[1] These tests have been performed in the Solutions and Performance Analysis Lab at Dell Technologies on December 19, 2022.
[2] Performance numbers are based on per CPU, not aggregated or two-socket system.

Dell PowerEdge RAID Controller 12
Wed, 10 May 2023 17:18:18 -0000
|Read Time: 0 minutes
Summary
Dell Technologies’ newest RAID controller iteration, PERC 12, which is using the new Broadcom SAS4116W series chip, has increased support capabilities, including 24 Gbps SAS drives, increased cache memory speed to 3200 Mhz, 16-lane host bus type, and, most notably, only one front controller that supports both NVMe and SAS.
PERC 12 card management applications include Comprehensive Embedded Management (CEM), Dell OpenManage Storage Management, The Human Interface Infrastructure (HII) configuration utility, and the PERC command line interface (CLI). These applications enable you to manage and configure the RAID system, create and manage multiple disk groups, control and monitor multiple RAID systems, and provide online maintenance.
Introduction
As storage demands expand and processing 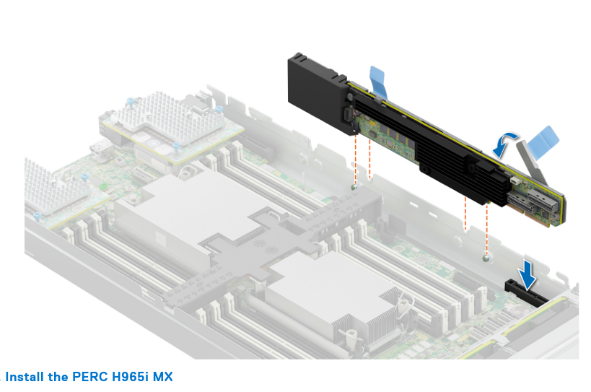 loads grow, RAID (Redundant Array of Independent Disks) data protection has become a necessary staple for proper enterprise storage management. Dell PowerEdge RAID Controller (PERC) provides a RAID solution that is powerful and easy-to-manage for enterprise storage data protection needs.
Dell Technologies’ newest RAID controller iteration, PERC 12, has increased support capabilities: 24 Gbps SAS drives, an increased cache memory speed of 3200 Mhz, 16-lane host bus type, and a single front controller that supports both NVMe and SAS.
PERC12 PowerEdge Support
H965i Adapter controller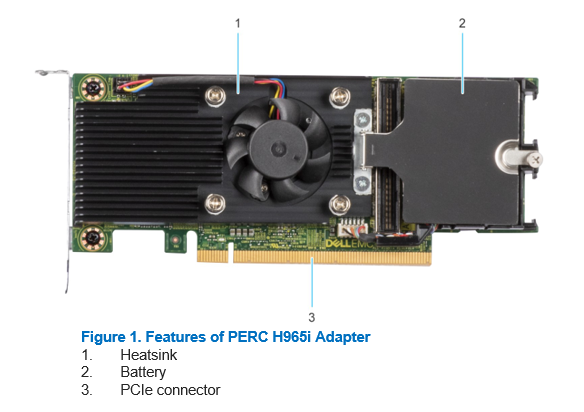
PERC12 Adapter Card adds an Active Heat Sink (Fan) on the controller, providing additional cooling capabilities, to ensure that the controller is always running at optimum temperature and does not compromise on performance because of overheating. The controller connects directly on the motherboard using a PCIe slot and uses a SlimLine connector (or a NearStack connector) for the SAS/NVMe interfaces.
H965i Front controller
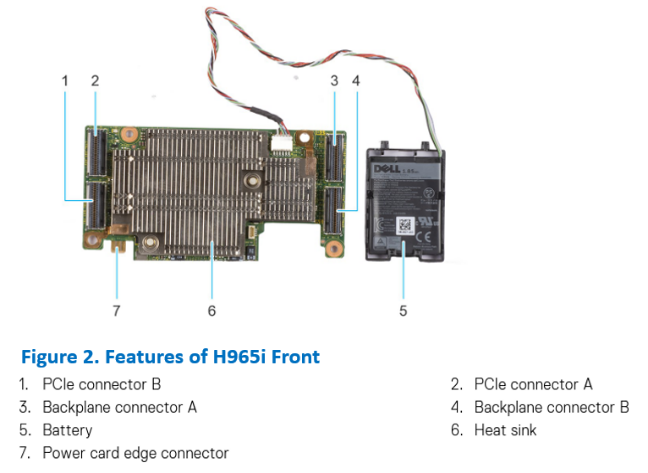 PERC12 Front Card upgrades the hardware design when compared to the previous generation controller. It combines SAS and NVMe support with a single card, eliminating the need to use different controllers for SAS and NVMe supported servers. The controller has a SlimLine connector (or a NearStack connector) for both PCIe and SAS/NVMe interfaces.
H965i MX controller
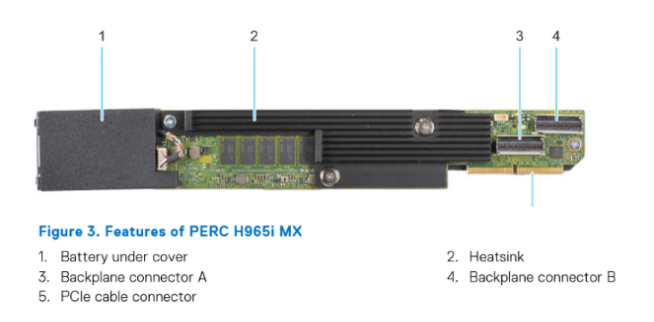 PERC12 MX Card is designed specifically for MX chassis servers and includes an energy pack similar to other form factors for power backup in case of power loss. This helps ensure proper customer cache offload to avoid any data loss. The controller connects directly on the motherboard using a PCIe slot and uses a SlimLine connector (or a NearStack connector) for the SAS/NVMe interfaces.
PERC 12 Supported Operating Systems
Windows Server
- Windows Server 2019
- Windows Server 2022
Linux
- RHEL 8.6
- RHEL 9.0
- SLES 15 SP4
- Ubuntu 22.04
VMware
- ESXi 7.0 U3
- ESXi 8.0
See Dell Technologies Enterprise operating systems support for a list of supported operating systems by specific server for the PERC 12 cards.
Hardware RAID Performance
NVMe Key RAID Metrics (PERC11 / PERC12)
Table 1. Latency / Rebuild
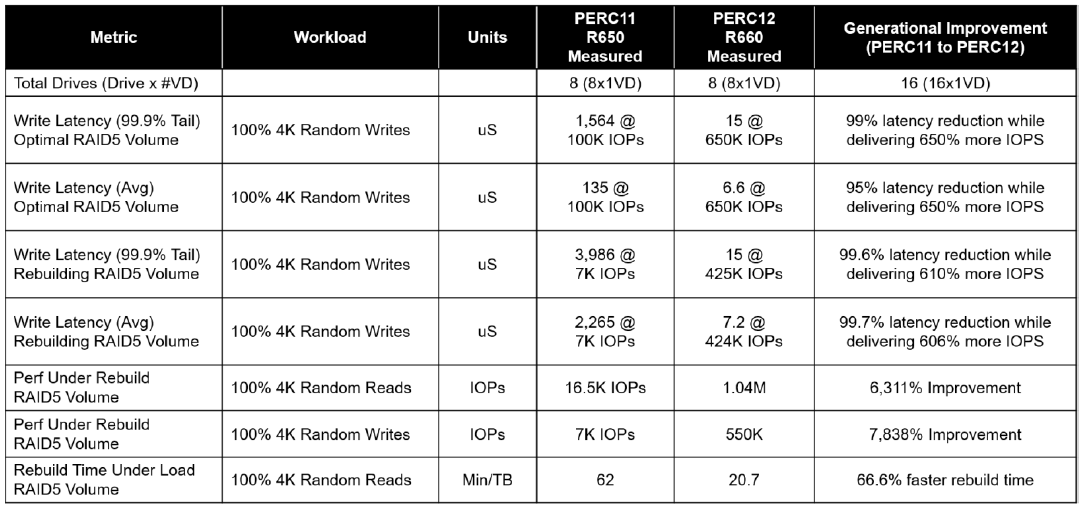
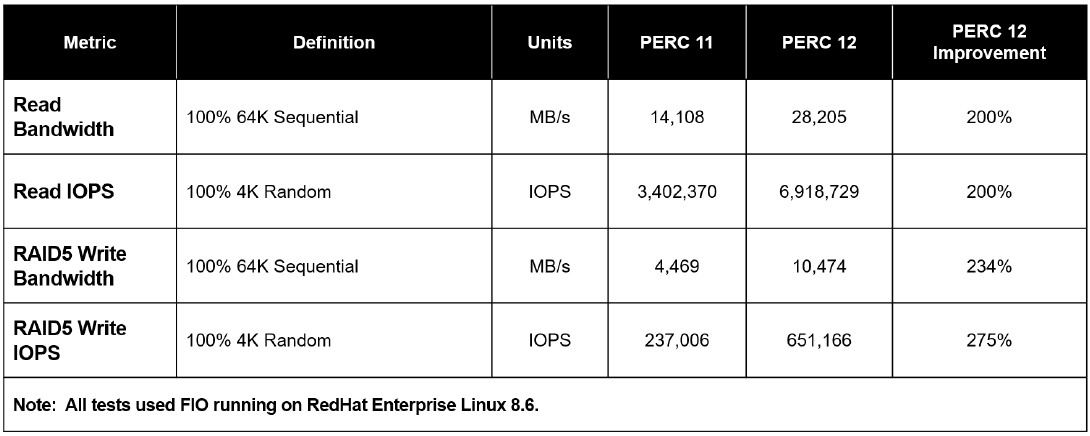
Key NVMe RAID 5 Metrics (PERC11 / PERC12)
Table 2. IOPS / Bandwidth
Key SAS RAID Metrics (PERC10 / PERC11 / PERC12)
Table 3. IOPS / Latency Reduction During Rebuild
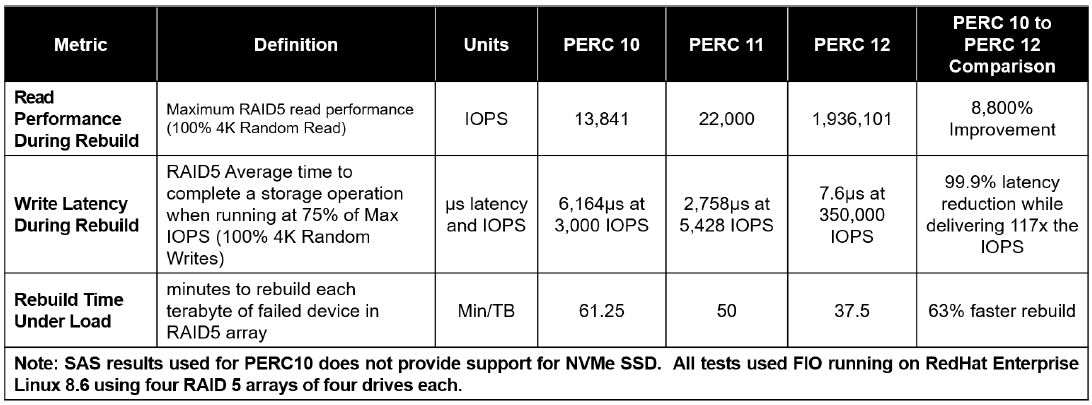
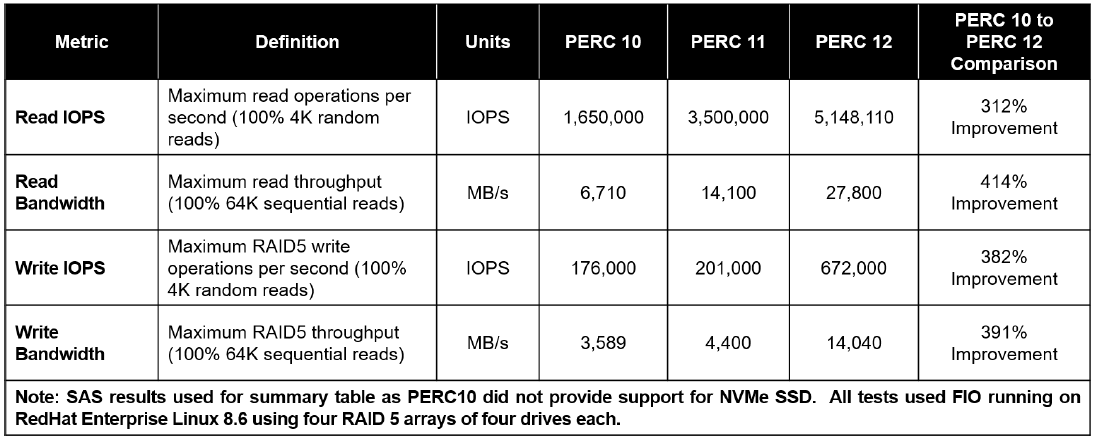
Key SAS RAID Metrics (PERC10 / PERC11 / PERC12)
Table 4. IOPS / Bandwidth
Conclusion
Dell PowerEdge RAID Controller 12 or PERC 12 continues to innovate by supporting hardware RAID for NVMe drives. The PERC 12 series consists of PERC H965i Adapter, PERC H965i Front, and PERC H965i MX.

Dell Next Generation PowerEdge Servers: Designed with DDR5 to Deliver Future-Ready Bandwidth
Fri, 03 Mar 2023 17:38:38 -0000
|Read Time: 0 minutes
Summary
This Direct from Development (DfD) tech note describes the DDR5 Memory technology for Dell’s latest generation PowerEdge Server portfolio. This document provides a high-level overview for DDR5, including information about generational performance improvement.
Overview
DDR5 Memory technology is the next big advancement in the world of DRAM Memory and is launching on the latest generation PowerEdge Servers.
DDR SDRAM (Dual Data Rate Synchronous Dynamic Random Access Memory) is a DRAM package on a DIMM. DDR means that the data is transferred at both the rising and falling edge of the clock signal. SDRAM is different from Asynchronous RAM because it is synchronized to the clock of the processor and hence the bus. Today, virtually all SDRAM is manufactured in compliance with standards established by JEDEC, an electronics industry association that adopts open standards to facilitate the interoperability of electronic components. This makes DDR5 an important spec for any standard server.
DDR5 is the fifth major iteration of this standard. Compared to its predecessors, DDR5 provides higher bandwidth and increased bandwidth efficiency.
The core counts are growing with every new generation of CPU. DDR4 has reached its limit in terms of memory bandwidth and density. It can only support up to 16GB Density and 3200MT/s speed. This is where DDR5 technology offers solutions to meet customer needs for greater memory capacity per core, and bandwidth per core.
DDR5 offers a 50% increase in the bandwidth with 4800MT/s as compared to DDR4 with 3200MT/s[1]. It also supports a maximum of up to 32Gb density (a density that is not available in the latest PowerEdhe generation launch), as compared to 16Gb in the previous generation. DDR5 also offers 2x the burst length, 2x bank groups, 2x banks, Decision Feedback Equalization, two independent 40-bit channels per DIMM, and optimized power management on DIMM.
The following table provides information about the latest Dell PowerEdge portfolio for DDR5, including capacity, bandwidth, DIMM type, and Dell part numbers. Note that Dell does not support DIMM capacity mixing on the latest generation. These represent maximum bandwidth at ideal configurations. CPU vendors may reduce bandwidth capability based on their respective DIMM population rules. Total system bandwidth is expected to vary between platforms based on population capability, such as on 8 x 1 DPC Intel® CPU- based platforms.
Table 1. Details about the latest Dell PowerEdge portfolio for DDR5
DIMM Capacity (GB) | DIMM Speed (MT/s) | DIMM Type | Dell PN* | Ranks per DIMM | Data Width | Density | Technology |
16 | 4800 | RDIMM | 1V1N1 | 1 | x8 | 16Gb | SDP |
32 | 4800 | RDIMM | W08W9 | 2 | x8 | 16Gb | SDP |
64 | 4800 | RDIMM | J52K5 | 2 | x4 | 16Gb | SDP |
128 | 4800 | RDIMM | MMWR9 | 4 | x4 | 16Gb | 3DS |
256 | 4800 | RDIMM | PCFCR | 8 | x4 | 16Gb | 3DS |
* Part numbers are subject to change. Additional part numbers may be required.
Dell Customer Experience improvement for PowerEdge Servers
Beginning in March 2022 on previous PowerEdge generation platforms, Dell Technologies began a journey to improve the customer experience related to memory errors. The following key improvements were made at that time, which are also included in the latest generation of PowerEdge servers.
- Single-Bit Correctable Error Messaging – This style of the message has been removed. Working with vendor partners across the industry and studying our own field performance, we could find no relationship between correctable error reporting and subsequent uncorrectable errors on the same DIMM in the same system. To avoid concerning alert messaging and potential unnecessary downtime, we have eliminated this messaging.
- Uncorrectable Error Messaging – Previously we would recommend after an uncorrectable error to perform memory self-healing. That is still a recommended action that will occur automatically on the next reset after the error is detected. We have now determined that having an uncorrectable error causes a loss of confidence in the long-term health of the memory hardware. Customer data on this hardware is always critical and for that reason, we recommend scheduling a replacement as soon as an uncorrectable error is detected, to avoid any doubt of future system health.
- Self-Health Messaging – Previous messaging gave a notification recommending scheduling a reset to perform self-healing. However, customers notified us that we did not give an adequate indication of the urgency of the reset, and it is very costly to take down the server for this action. Upon further consideration, we schedule the self-healing to occur in the background opportunistically on the next reset because the action is typically not urgent and can wait until scheduled downtime. We will no longer send self-heal messaging in logs requesting a customer action for this reason.
- Revise Diagnostic Messaging – Certain benign system events in the prior design would trigger a MEM5100 “OEM Diagnostic Event” message with encoded details. When this occurs frequently in customer logs it can cause concern. What do these messages mean? Should I replace the DIMM? These events do not indicate a degradation of DIMM health or an early indication of DIMM failure, but the messaging was left too ambiguous for customers.
We have updated the language to clearly state the action and intent. For example, such a message might be “An event has been completed successfully in the memory device at <location>. The server and device are operating normally; no action is required.” An extended ID code is then provided for internal terms to reference when required.
The latest generation of PowerEdge improvements
Quality and a premier customer experience with Dell PowerEdge servers continues to be a focus in our latest generation design. Our specific goals to achieve this are to reduce log chattiness and give clear crisp messaging on the health of the memory hardware. With that in mind, we have continued to refine our messaging strategy so that we can act swiftly to identify and diagnose issues without filling customer logs with verbose diagnostic memory error messages. Here are a few additional changes exclusive to the latest PowerEdge server design:
- Debug logging to TSR/Support Assist – We have enabled a new pipeline of diagnostic data that only displays in the Support Assist log. This data is collected in real-time as it occurs by our iDRAC BMC but is only harvested and logged when Support Assist is requested. This eliminates the need to log continuous “bread crumb” type information into the SEL and LC logs and while maintaining the diagnosability when we need it most.
- Enhanced SPD Error Logging – The SPD for DDR5 is significantly bigger than for DDR4. Dell Technologies has a proprietary logging format that resides on each Dell DIMM device. Expanding beyond what was possible in DDR4, we have enhanced logging to include new events such as detail about the health of the on-DIMM PMIC and more robust logging of CPU data when memory errors occur. When problems arise, we understand it can be chaotic and memory could be swapped between systems or labeled in the wrong box by mistake when returning to Dell for diagnosis. This enhanced logging will help us see the history of the DIMM itself. We can identify trends and previous problems to get to a solution quickly.
- Out-of-Band Access Improvement – The information provided by iDRAC has always been available out-of-band, but beginning in this latest generation of PowerEdge server it is also available even when the system is off with the power cord plugged in. This is strategically useful for diagnosing memory health because memory is often one of the most critical components for a successful power-up sequence. What if the system hangs for some reason in the OS? What if you need to keep the system offline due to rack power constraints but you need detail about the health and history of the memory? In the latest PowerEdge servers you can still remote into the iDRAC BMC of the system and collect health and status information while the system is offline.

Figure 1. DDR5 inserted in the Dell PowerEdge Chassis
Conclusion
With improved bandwidth and continuous improvements for providing a quality customer experience on memory — all provided in a dense form factor of DDR5, Dell Technologies continues to provide best-in-class features and specifications for its constantly evolving better and faster PowerEdge Server portfolio.
References
[1] These tests were performed in the Solutions and Performance Analysis Lab at Dell Technologies in December 2022.

Dell PowerEdge Boot Optimized Storage Solution – BOSS-N1
Fri, 27 Jan 2023 21:58:02 -0000
|Read Time: 0 minutes
Summary
Our latest generation HW RAID BOSS solution (BOSS-N1) incorporates NVMe Enterprise class M.2 NVMe SSDs. It includes important RAS features such as rear or front facing drives on our new rack servers and full hot-plug support, so a server does not need to be taken offline in case of an SSD failure. When operating a RAID 1 mirror, a surprise removal and addition of a new SSD automatically kicks off a rebuild on the new RAID 1 member SSD that was added, so there is no need to halt server operations.
Available on the newest generation of PowerEdge systems, BOSS-N1 provides a robust, redundant, low-cost solution for boot optimization.
Introduction
The Boot Optimized Storage Solution (BOSS-N1) provides key, generational feature improvements to the highly popular BOSS subsystem and its existing value proposition. It incorporates an NVMe interface to the M.2 SSDs to ensure high performance and the latest technology. BOSS was originally designed to provide a highly reliable, cost-effective solution for separating operating system boot drives from data drives on server-internal storage. Many customers, particularly those in the Hyperconverged Infrastructure (HCI) arena and those implementing Software Defined Storage (SDS), require separating their OS drives from data drives. They also require hardware RAID mirroring (RAID 1) for their OS drives. The main motivation for this is to create a server configuration optimized for application data. Providing a separate, redundant disk solution for the OS enables a more robust and optimized compute platform.
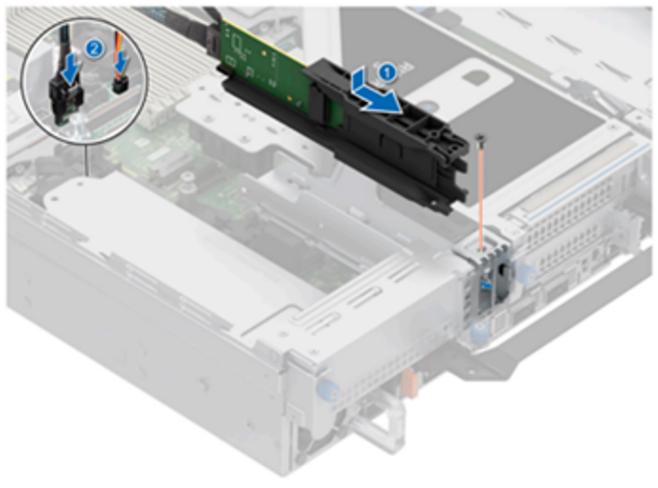
Figure 1. Installing the BOSS-N1 monolithic controller module
The Boot Optimized Storage Solution (BOSS-N1) is a simple, highly reliable and cost-effective solution to meet the requirements of our customers. The NVMe M.2 devices offer similar performance as 2.5” SSDs and support rear or front facing drive accessibility with full hot-plug support on monolithic platforms and includes surprise removal. Our design frees up and maximizes available drive slots for data requirements.
BOSS-N1 provides a secure way of updating the controller firmware
- Each of the firmware components is authenticated before being stored to firmware slot
- Authentication requires the use of public and private asymmetric key pair. This protected key pair is uniquely generated for Dell through a hardware security module (HSM) server.
- BOSS-N1 firmware updates can be updated using DUP from both In-band (Operating System) and Out-of-band (iDRAC) interfaces
You can manage BOSS-N1 with standard well-known management tools such as iDRAC, OpenManage Systems Administrator (OMSA), and the BOSS-N1 Command Line Interface (CLI).
BOSS-N1 hardware components
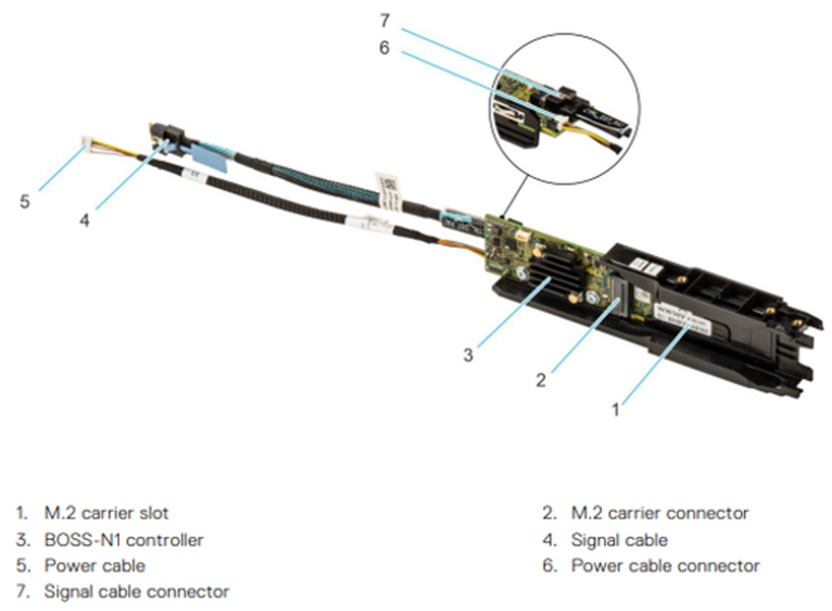
Figure 2. BOSS-N1 monolithic card
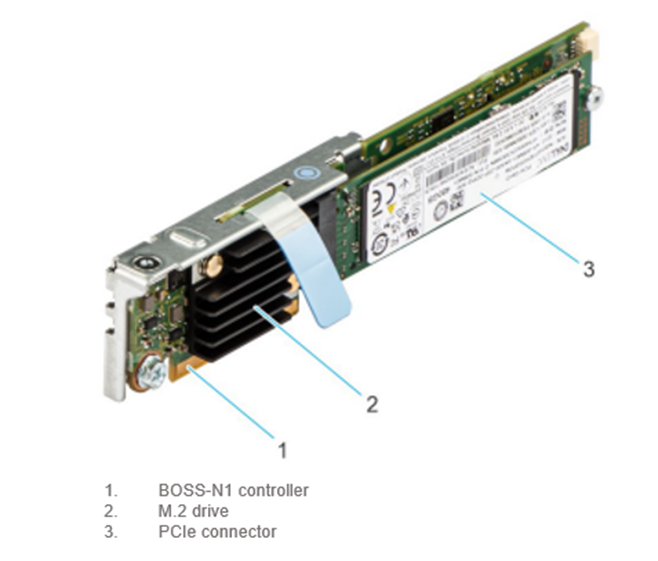
Figure 3. BOSS-N1 modular
Key features of BOSS-N1:
- Supports one (1) or two (2) 80 mm M.2 Enterprise Class NVMe SSDs
- M.2 devices are read-intensive (1 DWPD) with 480GB or 960GB capacity
- Fixed function hardware RAID 1 (mirroring) or single drive RAID 0
- Rear or front facing module for quick and easy accessibility to the M.2 SSDs on monolithic platforms
- Full hot-plug support on monolithic platforms
- M.2 drive LED functionality on monolithic platforms
- Managing BOSS-N1 is accomplished with standard, well-known management tools such as iDRAC, OpenManage Systems Administrator (OMSA), and the BOSS-N1 Command Line Interface (CLI)
BOSS-N1 supported operating systems
Windows Servers
- Windows Server 2019
- Windows Server 2022
Linux
- RHEL 8.6
- SLES 15 SP4
- Ubuntu 20.04.4
VMware
- ESXi 7.0 U3
- ESXi 8.0
References
- For more information about BOSS-N1, see the BOSS-N1 User’s Guide.
- For more information about iDRAC, such as the iDRAC User’s Guide and the iDRAC Release Notes, see the Dell Support site.
- For more information about OpenManage Server Administrator, see the OMSA 9.5 User’s Guide.

Improved PowerEdge Server Thermal Capability with Smart Flow
Fri, 03 Mar 2023 20:12:37 -0000
|Read Time: 0 minutes
Introduction
New PowerEdge Smart Flow chassis options increase airflow to support the highest core count CPUs and DDR5 in an air-cooled environment within current IT infrastructure.
What is Smart Flow?
One way to increase the thermal capacity of an air-cooled server is to increase airflow that exhausts heat generated by components. Dell PowerEdge addresses this in several ways: high-performance fans, air baffles to direct airflow within the chassis, and intelligent thermal controls that monitor temperature sensors and dynamically adjust fan speeds.
With Smart Flow, our thermal engineers have increased server thermal capacity by reducing impedance to fresh air intake on select server configurations. Servers with Smart Flow replace middle storage slots with centralized airflow inlets to maintain balanced airflow distribution within the server. This is made possible by new backplane configurations that allow larger air intake capacity. Smart Flow enables expanded CPU and memory configurations for lower storage needs in our next generation 1U and 2U air-cooled PowerEdge servers. Gains in thermal efficiency are also realized with Smart Flow implementations and will be explored in a subsequent paper. Examples for four different servers are shown here:
PowerEdge R660
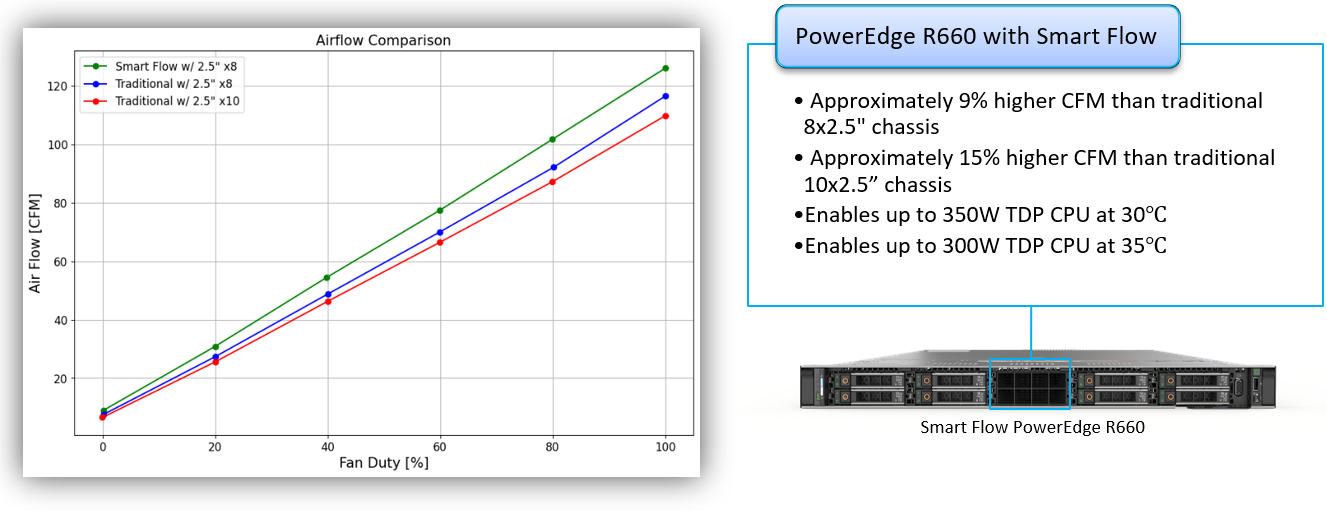
Figure 1. PowerEdge R660 airflow increase with Smart Flow
PowerEdge R760
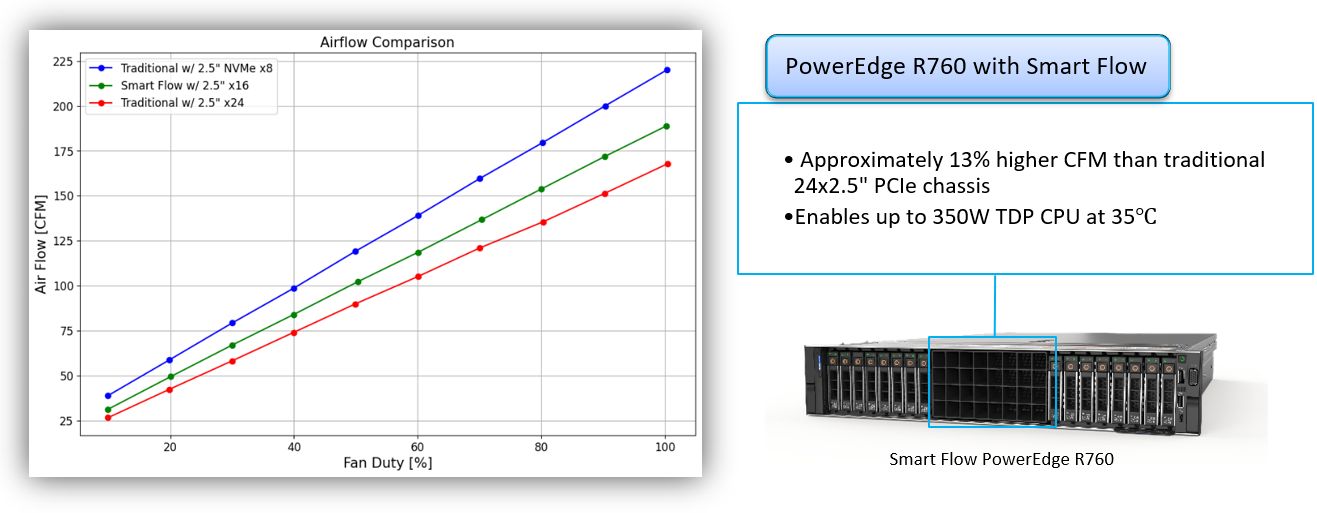
Figure 2. PowerEdge R760 airflow increase with Smart Flow
PowerEdge R6625
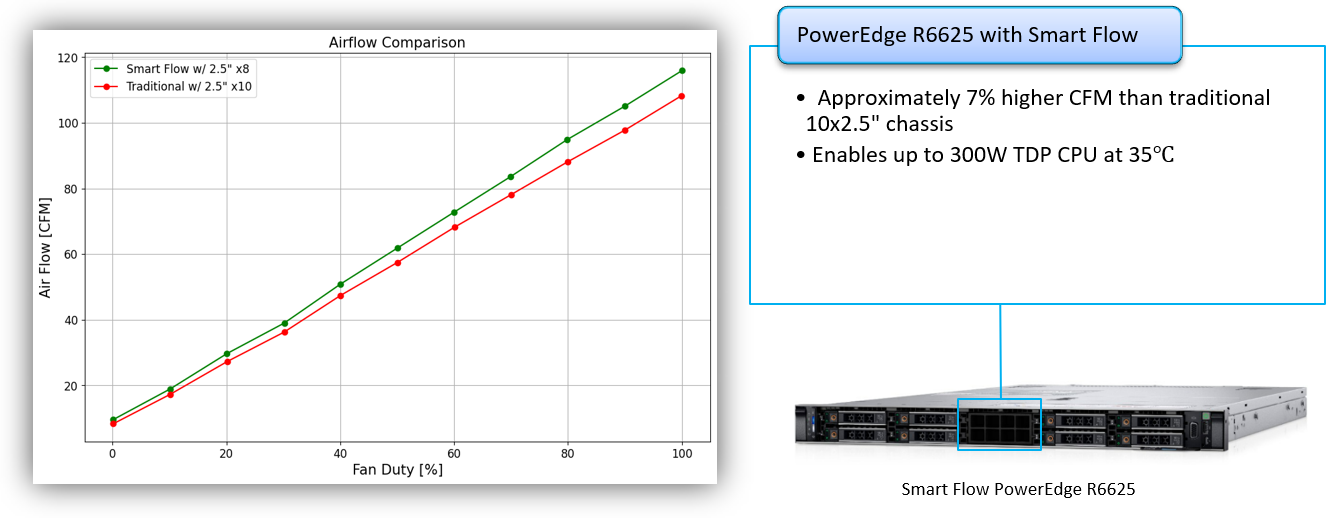
Figure 3. PowerEdge R6625 airflow increase with Smart Flow
PowerEdge R7625
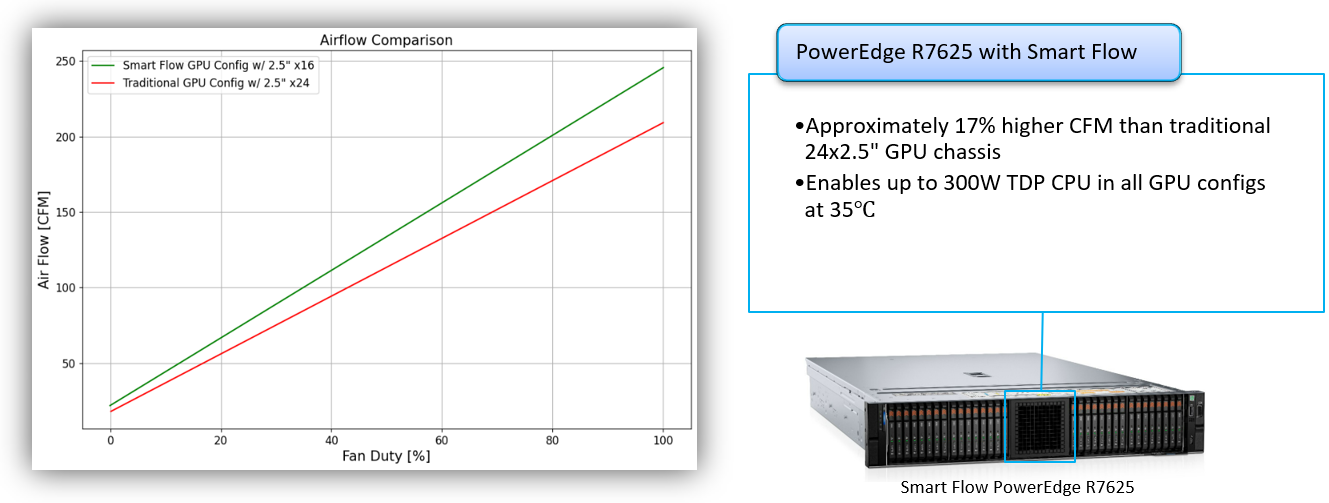
Figure 4. PowerEdge R7625 airflow increase with Smart Flow
Conclusion
Dell PowerEdge Smart Flow increases select servers' thermal capacity, enabling high-power CPUs and GPUs, at increased ambient temperatures, for the most demanding workloads in air-cooled data centers.

Next-Generation Dell PowerEdge Servers: Designed with PCIe Gen 5 to Deliver Future-Ready Bandwidth
Fri, 03 Mar 2023 17:38:40 -0000
|Read Time: 0 minutes
Summary
This Direct from Development tech note describes PCIe Gen 5 for next-generation Dell PowerEdge servers. This document provides a high-level overview of PCIe Gen 5 and information about its performance improvement over Gen 4.
PCIe Gen 4 and Gen 5
PCIe (Peripheral Component Interconnect Express) is a high-speed bus standard interface for connecting various peripherals to the CPU. This standard is maintained and developed by the PCI Special Interest Group (PCI-SIG), a group of more than 900 companies. In today’s world of servers, PCIe is the primary interface for connecting peripherals. It has numerous advantages over the earlier standards, being faster, more robust, and very flexible. These advantages have cemented the importance of PCIe.
PCIe Gen 4, which was the fourth major iteration of this standard, can carry data at the speed of 16 gigatransfers per second (GT/s). GT/s is the rate of bits (0’s and 1’s) transferred per second from the host to the end device or endpoint. After considering the overhead of the encoding scheme, Gen 4’s 16 GT/s works out to an effective delivery of 2 GB/s per lane in each direction. A PCIe Gen 4 slot with x16 lanes can have a total bandwidth of 64 GB/s.
The fifth major iteration of the PCIe standard, PCIe Gen 5, doubles the data transfer rate to 32 GT/s. This works out to an effective throughput of 4 GB/s per lane in each direction and 128 GB/s for an x16 PCIe Gen5 slot.
PCIe generations feature forward and backward compatibility. That means that you can connect a PCIe 4.0 SSD or a PCIe 5.0 SSD to a PCIe 5.0 slot, although speed is limited to the lowest generation. There are no pinout changes to from PCIe 4.0 for x16, x8, x4 packages.
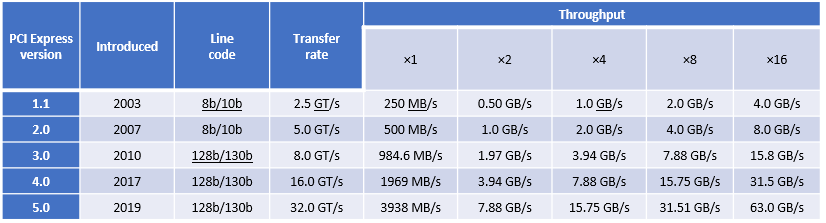
Figure 1. PCIe bandwidth over time
Advantages of increased bandwidth
With the increased bandwidth of PCIe 5.0, devices might be able to achieve the same throughput while using fewer lanes, which means freeing up more lanes. For example, a graphics card that requires x16 bandwidth to run at full speed might now run at the same speed with x8, making an additional eight lanes available. Using fewer lanes is important because CPUs only provide a limited number of lanes, which need to be distributed among devices.
PCIe bandwidth improvements bring opportunities for high-bandwidth accelerators (FPGA, for example). The number of storage-attached and server-attached SSDs using PCIe continues to grow. PCIe 5.0 provides foundational bandwidth, electricals, and CEM slots for Compute Express Link (CXL) devices such as SmartNICs and accelerators. The new standard will be much more useful for machine learning and artificial intelligence, data centers, and other high performance computing environments, thanks to the increase in speeds and bandwidth. In addition, a single 200 Gb network is expected to saturate a PCIe 4.0 link in certain conditions, creating opportunities for PCIe 5.0 connectivity adapters. This unlocks opportunities for 400 Gb networking. The Intel PCIe 5.0 test chip is heavily utilized for interoperability testing.
Next-generation PowerEdge servers and PCIe Gen 5
Next-generation Dell PowerEdge servers with 4th Gen Intel® Scalable processors are designed for PCIe Gen 5. The 4th Gen Intel® Xeon® series processors support the PCIe Gen 5 standard, allowing for the maximum utilization of this available bandwidth with the resulting advantages.
Single-socket 4th Gen Intel® Scalable processors have 80 PCIe Gen 5 lanes available for use, which allows for great flexibility in design. Eighty lanes also give plenty of bandwidth for many peripherals to take advantage of the high-core-count CPUs.
Conclusion
PowerEdge servers continue to deliver the latest technology. Support for PCIe Gen 5 provides increased bandwidth and improvements to make new applications possible.

NVMe, SAS, and SATA

Mon, 16 Jan 2023 13:44:19 -0000
|Read Time: 0 minutes
Summary
PowerEdge customers optimize their server configurations based on their applications and business needs. Multiple factors must be taken into consideration to make an informed decision, such as workload, budget, scale, and even roadmap. Still, when all of the factors are understood, it can be difficult to discern whether the optimized Solid State Drive (SSD) is NVMe, SAS, or SATA. This DfD (Direct from Development) tech note was written to simplify and guide customers in their choice of SSD. We hope customers will find this document to be a valuable reference guide when it becomes unclear which storage medium is the optimized decision. This paper can be used as a reference guide to help PowerEdge customers make an informed decision on which SSD interface will presumably bring the greatest value in relation to their intended business needs and goals. First, let’s summarize the history and architecture around the NVMe, SAS, and SATA SSD interfaces:
NVMe (Non-Volatile Memory Express)
The NVMe interface is the newest type of flash storage with the highest performance. The driving architectural differentiator of NVMe is that it uses the PCIe interface bus to connect directly to the CPU and streamline the travel path. This design contrasts with SAS and SATA, which require data to first traverse to an HBA before reaching the CPU. By removing a layer from the stack, the travel path is optimized and produces reduced latency and improved performance. Scalability is also significantly improved, because NVMe drives can go beyond the traditional four lanes by using lanes from the same “pool” of lanes connected to the CPU. Furthermore, NVMe performance will continually improve as each new generation of the PCIe standard becomes available.
SAS (Serial Attached SCSI)
The SAS interface was released a few years after SATA and introduced new features that are beneficial for modern workloads. Instead of building upon the ATA (Advanced Technology Attachment) standard used in SATA, it serialized the existing parallel SCSI (Small Computer System Interface) standard. SAS cable architecture has four wires within two cables, creating more channels available for moving data and more connectors available for use by other devices. Furthermore, the channels are full duplex, allowing for reads and writes to traverse concurrently. Improved reliability, error reporting, and longer cable lengths were also introduced with SAS. SAS improvements are made to this day, with 24GB/s available soon, so it still remains valuable and relevant within the market.
SATA (Serial Advanced Technology Attachment)
The SATA interface was released in 2000 and is still commonly adopted within modern servers since it is the most-affordable of the three. It replaced parallel ATA with serial ATA, which resolved various performance and physical limitations at that time. The SATA cable architecture has four wires within one cable—two for sending data and two for receiving data. These four channels are half-duplex, so data can only move in one direction at a time. SATA write speeds are sufficient for storing information, but its read speeds are slow compared to more modern interfaces, which limits its application use for modern workloads. The last major SATA revision occurred in 2008, and will not see further advancement in the future.
Table 1. Ranking performance metrics of Enterprise NVMe, DC NVMe, Enterprise SAS, Value SAS, and SATA drives

Table 1 lists key metrics for five storage-drive types most commonly attached to PowerEdge servers: Enterprise NVMe, Data Center (DC) NVMe, Enterprise SAS, Value SAS, and SATA. This comparison helps clarify which storage interface type is most applicable in relation to business needs and goals.
Performance: Performance can be measured in various ways. For this example, Random 4 KiB 70/30 (70% reads, 30% writes) data was compared and published by Dell, with higher IOPS being better. Enterprise NVMe SSDs produce 1.13x more IOPS than DC NVMe SSDs. DC NVMe SSDs produce 1.99x more IOPS than Enterprise SAS SSDs. Enterprise SAS SSDs produce 1.42x more IOPS than Value SAS SSDs. Lastly, Value SAS SSDs produce 2.39x more IOPS than SATA. Figure 1 below illustrates the IOPS performance variances on a bar graph for a visual representation:
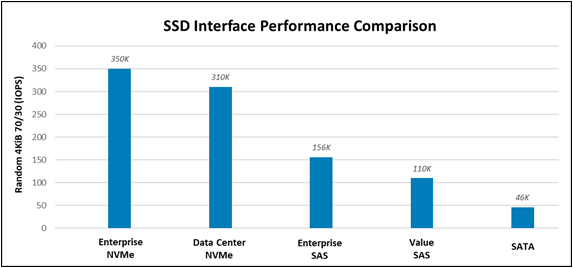
Figure 1. Random 4KiB 70/30 IOPS variances for each storage interface
Latency: The NVMe protocol reduces the number of touchpoints data must travel to (bypassing the HBA) before reaching the CPU. It also has less overhead, giving it significantly lower latency than SAS and SATA. The SAS protocol is full- duplex (as opposed to half-duplex) and offers two channels (as opposed to one) for data to use, giving it over 50% lower latency than SATA.
Price: According to Dell pricing in Q1 2022, SATA SSDs are the least expensive storage interface, at ~0.9x the price of Value SAS SSDs. Value SAS SSDs are ~0.85x the price of DC NVMe SSDs. DC NVMe SSDs are ~0.85x the price of Enterprise SAS SSDs. And Enterprise SAS SSDs are ~0.97x the price of Enterprise NVMe SSDs. Pricing is volatile and these number variances are subject to change at any time.
Performance per price: PowerEdge customers that have not identified which metric is most important for their business goals should strongly consider performance (IOPS) per price (dollar) to be at the top of the list. Because NVMe has such a significant performance lead over SAS and SATA, it is easily the golden standard for performance per price. DC NVMe SSDs have the best performance per price, followed closely by Enterprise DC NVMe SSDs, followed by Value SAS SSDs, followed closely by SAS SSDs, followed by SATA SSDs. This tech note gives more performance/price detail.
Scalability: Currently, NVMe shows the greatest promise for wider-scale implementation due to the abundance of lanes that can be available with low-overhead. However, it can be a costly investment if existing data center infrastructures must be upgraded to support the NVMe I/O protocol. SAS is more flexible, since SAS expanders are cost-effective and most data center infrastructures already have the required hardware to support it. However, SAS does not have the potential to scale out as aggressively as NVMe. SATA does not scale well with SSDs.
Ongoing development: The NVMe interface has consistent and substantial advancements year-over-year, including updates like NVMe 2.0b (released in Jan. 2022) and PCIe Gen5 (released on Intel CPUs in Nov. 2021). The SAS interface also has regularly cadenced updates, but the impact is marginal, with the exception of upcoming updates like 24Gb/s and 48Gb/s. The SATA interface has no plan to extend capabilities beyond its current limitations.
Assigning these ranks for each storage interface and metric, and explaining why the rank was given, will make it easier to understand which drive type will be the most valuable in relation to business needs and goals.
Guidance in accordance with business goals
Every business is unique and will have different requirements for their storage drives. Factors such as intended workload, business size, plan to scale, budget, and so on, should be considered to confidently make an investment decision. Although this decision is ultimately up to each business, we have provided some guidelines below to help businesses that are still on the fence to make an educated choice:
Enterprise NVMe: Businesses that desire maximum performance and have a flexible budget should consider purchasing Enterprise NVMe SSDs. Heavy workloads like HPC or AI will immediately benefit from the additional cache gained from the non-volatile nature of this storage interface. The fast-paced performance growth seen in Enterprise NVMe SSDs will also allow smaller workloads like databases or collaboration to easily keep up with the ever-increasing size of data. Ultimately, because Enterprise NVMe undergoes consistent valuable changes with every passing year, such as performance increases and cost reduction/optimization, we recommend futureproofing your data center with it.
DC NVMe: Businesses that desire a budget-conscious NVMe solution, in addition to the greatest value, should consider purchasing DC NVMe SSDs. These drives have the exact same value proposition as stated above for Enterprise NVMe SSDs, but with a sizeable price reduction (0.83x) and performance hit (0.86x). Businesses that want to get the best value will be pleased to know that DC NVMe drives have the best performance-per-price.
Enterprise SAS: Businesses that desire to continue using their existing SCSI-based data center environment and have maximum SAS performance should consider purchasing Enterprise SAS SSDs. Although the Enterprise SAS interface does not currently have any ranking leadership for performance or pricing, it is established in the industry as highly reliable, cost- effective to scale, and it shows promise for the future, with 24Gb/s available soon and 48Gb/s on the horizon. Enterprise SAS SSDs will adequately handle medium-duty workloads, like databases or virtualization, but will operate best when mixed with NVMe SSDs if any heavy-duty workloads are at play.
Value SAS: Businesses that desire a budget-conscious SAS solution should consider purchasing Value SAS SSDs. These drives have the same value-proposition as stated above for Enterprise SAS SSDs, but with both a sizeable price reduction (0.73x) and performance hit (0.71x). For this reason, it actually has a slightly lower performance-per-price than Enterprise SAS, and therefore is more of a “value” play when compared against SATA. This storage interface has a purpose for existing though, as small-to-medium businesses with a smaller budget can leverage this lower-cost solution while still receiving the many benefits of the SAS interface.
SATA: Businesses that desire the lowest price storage interface should consider purchasing SATA SSDs. However, caution should be applied with this statement, as there is currently no other value proposition for SATA SSDs, and the price gap for these flash storage interfaces has been shrinking over time, which may eventually remove any valid reason for the existence of SATA. With that being said, SATA is currently still a solid choice for light workloads that are not read-heavy.
Conclusion
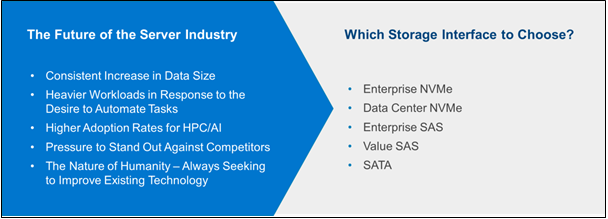
The story of competing NVMe, SAS, and SATA storage interfaces is still being written. Five plus years ago, analysts made the argument that although NVMe has superior performance, its high-cost warranted SAS the title of ‘best value for years to come’. What we see today is a rapidly shrinking price gap for all of these interfaces. We observe that SATA performance has fallen far behind SAS, and very far behind NVMe, with no plan to improve its current state. We also see NVMe optimizing its performance and price-point to yield more market share every year. Most importantly, we expect rapid growth in the industry adoption of heavier workloads and ever-increasing data requirements. Both storage drive and industry trends incline us to believe that the best option for any business desiring to build a future-proofed datacenter would be to begin making the investment in NVMe storage. However, the remaining types of storage still hold value for varying use cases, and it is the customer’s choice to decide which storage type is best for their business goals. We hope this guide has helped that decision become more apparent.

Top 3 Networking Utilities for PowerEdge Servers with 3rd Generation Intel® Xeon® Scalable Processors
Mon, 16 Jan 2023 13:44:19 -0000
|Read Time: 0 minutes
Summary
The latest Dell EMC PowerEdge servers with 3rd generation Intel® Xeon® scalable processors will need to be reinforced with ample networking utilities to ensure that maximum performance is achieved. This DfD will list the top three networking utilities customers can consider implementing to ensure their networking bandwidth and speeds are adequate for PowerEdge servers with 3rd generation Intel® Xeon® scalable processors.
New Processor Functionality
With the recent release of the 3rd generation Intel® Xeon® scalable processors, new PowerEdge servers, such as the R650, R750 and R750xa, will greatly benefit from the CPU upgrades received. This includes having up to 40 cores per processor, eight channel memory, 3200MT/s memory speeds, support for PCIe Gen4 and more. With these features further enhancing compute capabilities, it is critical that networking speeds and bandwidth are not a system bottleneck.
Here are three networking capabilities you won’t find on previous Intel PowerEdge platforms that will ensure the data center network is optimized for the latest PowerEdge servers with 3rd Generation Intel® Xeon® scalable processors:
Up to 200GbE Bandwidth with PCIe Gen4
Migrating from PCIe Gen3 to Gen4 will double server networking bandwidth. This increase in bandwidth is significant for data center networking because densely sized data has become normalized and the bandwidth increase with PCIe Gen4 will allow the network to rapidly move this data from the server to the internet. Components like GPUs, NVMe SSDs and VMs are key drivers for this increase in data size.
| Raw Data Rate | Theoretical Link Bandwidth (x16) | Practical Max Bandwidth (x16) |
PCIe Gen3 | 8 GT/s | 128Gb/s | 100GbE |
PCIe Gen4 | 16 GT/s | 256Gb/s | 200GbE |
Figure 1 - PCIe Gen4 speed and bandwidth increases over Gen3
To stay ahead of the data curve, our top recommendation for growing datacenters is to increase ethernet connectivity speeds from 10GbE to 25GbE. With the inclusion of PCIe Gen4 capabilities, moving to 25GbE will provide the following benefits:
- 200GbE bandwidth on a dual port 100GbE network card, fully utilizing both ports
- 4x25GbE is now possible in a x8 slot with PCIe Gen4
- 200Gb HDR InfiniBand on a single slot is now possible with PCIe Gen4
- Optimized cost-per-bit and power consumption
OCP3.0
Dell Technologies actively collaborated in the development of the OCP3.0 (Open Compute Project) form factor, providing various test fixtures and architecture design contributions. Therefore, it is of no surprise that support for the OCP3.0 network adapter card is included in the latest PowerEdge servers. The OCP3.0 networking adapter card merges the best practices from various proprietary technologies to create a flexible networking solution that provides PowerEdge users the following benefits:
- Higher networking speeds with PCIe Gen4 support
- A compact SFF mechanical specification, allowing for servers to stack PCIe and OCP3 slots in a 1U server design
- High-speed sideband management (NC-SI) which enables iDRAC shared LOM functionality
- Fully replaces the PowerEdge rNDC (rack network daughter card) functionality with industry standard form factor
Figure 2 - OCP3 adapter card
SNAP I/O with InfiniBand
The SNAP I/O card with InfiniBand technology is a solution created to balance I/O performance while decreasing the TCO. It allows two CPUs to share one SNAP I/O network adapter (instead of requiring two adapters) so data can avoid traversing the UPI inter-processor link when accessing remote memory.
The SNAP I/O card with InfiniBand is a great solution for environments where low latency is a priority, two- card redundancy is not needed and single-NIC bandwidth is unlikely to bottleneck. PowerEdge customers who adopt this technology will gain the following benefits:
- Reduced TCO (one less adapter, cable and switchport)
- Balanced I/O (producing higher network bandwidth and lower latency)
- Increased UPI bandwidth
- Decreased CPU utilization
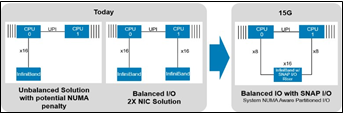
Figure 3 - Diagram explaining how the SNAP I/O card balances network I/O and removes the need for a second NIC and it’s supporting infrastructure
Conclusion
The release of new Dell EMC PowerEdge servers with 3rd generation Intel® Xeon® scalable processors will create opportunities to increase the PowerEdge servers computing capabilities. These three network utilities will help to ensure the data center network is optimized to meet future computing goals.

Persistent Memory for PowerEdge Servers Increase Memory Capacity and Reduce Memory TCO
Mon, 16 Jan 2023 13:44:19 -0000
|Read Time: 0 minutes
Summary
When Intel® launched their Optane™ persistent memory (PMEM) modules in 2019, we were eager to understand how they would perform when mixed with traditional DRAM DIMMs. Now that sufficient testing and analysis has been completed, we know that both memory types, PMEM and DRAM, have similar performance readings. This means that PowerEdge customers can increase total capacity or reduce TCO without impacting the total system performance. This DfD will discuss our test study conducted for PMEM and DRAM performance readings, and explain what opportunities this creates for PowerEdge customers.
Introduction
Dell Technologies offers support for Intel® Optane™ PMEM (Persistent Memory) for previous-generation and current-generation PowerEdge servers. This support for mixing PMEM with DRAM allows customers to increase their total memory capacity or lower TCO, while having memory persistence in application direct mode.
However, customers were concerned that mixing DRAM and PMEM would cause performance degradation. Dell Technologies decided to conduct internal testing to better understand if there is a negative performance impact when these two memory types are mixed.
Test Setup
A 4-socket PowerEdge R940 was configured with the following:
- 4 Intel Xeon 8280L CPUs
- PERC H740P adapter with 8GB of cache
- OS on 5 1.8TB HDDs (RAID 5)
- HANA on 12x800GB SAS SSD (RAID 5)
- SLES 15 OS
- HANA 2.0 Revision 41
As for the memory populated, the PowerEdge R940 supports up to 48 memory slots; 24 of which support PMEM drives. Therefore, the first 24 memory slots consist of 128GB DRAM, and the remaining 24 memory slots were divided into 3 test cases:
- Test Case 1: 128 GB DRAM
- Test Case 2: 128 GB PMEM
- Test Case 3: 512 GB PMEM
Results were achieved with SAP BW Edition for performance test based on the scenario defined in the SAP BW edition for SAP HANA Standard Application Benchmark [sap.com]. Measurements from 5+ test runs were normalized to avoid fluctuation.
Test Results – Relative Performance
Two test phases were performed. The first test phase measured the completion times required to load test data from the drives to the database. The times required to load over 2.5 billion records into an empty database were nearly identical, with PMEM taking only 1.8% longer to load than DRAM. This establishes that the load speeds of both memory types are nearly identical.
The second test phase measured the number of queries per hour performed in SAP HANA. As seen in Figure 1, the configuration loaded with 100% 128GB DRAM performed the best and is our baseline for PMEM comparison. The next
two configurations with 50% 128GB PMEM and 50% 512GB PMEM trailed closely behind, with only a -8.89% and -7.56% performance hit for each PMEM drive config, respectively. These readings establish that DRAM and PMEM have similar performance, so customers investigating PMEM as an alternative to DRAM should only see marginal performance degradation.
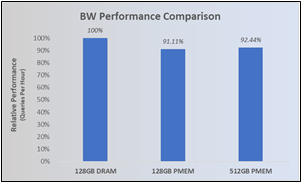
Figure 1 – Bar graph illustrating queries per hour in relative percentages for 128GB DRAM, 128GB PMEM and 512GB PMEM
PMEM Advantages
Reduce TCO
Customers can explore mixing DRAM and PMEM quantities to optimize the $/GB for their server needs. DRAM typically ranges from $41/GB - $64/GB, while PMEM ranges from $12/GB - $20GB, based on capacity size and current market pricing. This means that customers can reduce costs by up to 71% when populating the open 24 memory slots with supported PMEM modules! Figure 2 below illustrates the $/GB of various mixed DRAM and PMEM configurations in the PE R940:
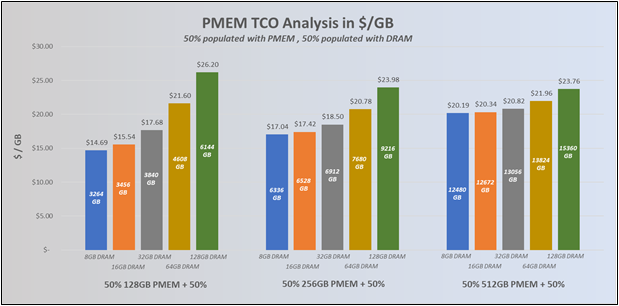
Figure 2 – Bar graph illustrating the $/GB and total capacities of various mixed DRAM and PMEM configurations on the PowerEdge R940
Increase Memory Capacity
Because PMEM has higher capacities than DRAM, users can boost their total memory capacity by populating their memory slots with 256GB or 512GB PMEM. In the case of our PE R940 test study, 24 memory slots are already occupied by 128GB DRAM. So, if the remaining 24 memory slots are populated with 256GB or 512GB PMEM, customers would see capacity gains of up to 50% and 150%, respectively.
Increase Memory Capacity AND Reduce TCO
Even more enticing is the fact that customers can increase their memory capacity, while also lowering their TCO. There are many mixed memory configurations that will give this “best of both worlds” return, but Figure 3 below shows one example on the PE R940. By replacing 24 of the 128GB DRAM with 512GB PMEM, users can increase total memory capacity by up to 150% while reducing memory TCO by up to 41.6%. Again, please keep in mind that TCO percentages are subject to change depending on capacity size and the current market pricing.
Calculations |
| Calculations |
| ||||||||||
GB (DRAM) | GB (PM) | PRICE | QTY | TOTAL GB | TOTAL $ | GB (DRAM) | GB (PM) | PRICE | QTY | TOTAL GB | TOTAL $ | ||
8 |
| $ 499.00 | 0 | 0 | $ - | 8 |
| $ 499.00 | 0 | 0 | $ - | ||
16 |
| $ 739.00 | 0 | 0 | $ - | 16 |
| $ 739.00 | 0 | 0 | $ - | ||
32 |
| $ 1,329.00 | 0 | 0 | $ - | 32 |
| $ 1,329.00 | 0 | 0 | $ - | ||
64 |
| $ 2,649.00 | 0 | 0 | $ - | 64 |
| $ 2,649.00 | 0 | 0 | $ - | ||
128 |
| $ 5,209.00 | 24 | 3072 | $125,016.00 | 128 |
| $ 5,209.00 | 48 | 6144 | $250,032.00 | ||
| 128 | $ 1,499.00 | 0 | 0 | $ - |
| 128 | $ 1,499.00 | 0 | 0 | $ - | ||
| 256 | $ 3,999.00 | 0 | 0 | $ - |
| 256 | $ 3,999.00 | 0 | 0 | $ - | ||
| 512 | $ 9,999.00 | 24 | 12288 | $239,976.00 | $ / GB |
| 512 | $ 9,999.00 | 0 | 0 | $ - | $ / GB |
Totals | 15360 | $364,992.00 | $ 23.76 | Totals | 6144 | $250,032.00 | $ 40.70 | ||||||
Figure 3 – Bar graph illustrating the $/GB and total capacities of various mixed DRAM and PMEM configurations on the PowerEdge R940
Conclusion
By conducting studies that highlight the performance impact of mixing DRAM and PMEM, Dell Technologies was able to conclude that the performance of each memory type was very similar, with nearly identical load times and only a slight performance hit for the number of queries run in SAP HANA. These findings provide customers adequate reassurance to invest in PMEM modules that can increase memory capacity, reduce TCO, or even both!

Full Redundancy vs. Fault Tolerant Redundancy for PowerEdge Server PSUs
Mon, 16 Jan 2023 13:44:19 -0000
|Read Time: 0 minutes
Summary
Understanding the power supply redundancy options to facilitate your server is important for users seeking to prioritize certain use cases over others, such as full, consistent performance during fault conditions or higher performance and capabilities during normal operating conditions. This DfD will discuss two PSU redundancy options; Full Redundancy (FR) and Fault Tolerant Redundancy (FTR), and explain when it may be advantageous for a user to adopt one of these solutions over the other.
Introduction
Customers need power redundancy to maintain application uptime. However, few know that there is more than one type of redundancy to consider, and the best option depends on several factors. This DfD will explain two power supply unit (PSU) redundancy options – Full Redundancy (FR) and Fault Tolerance Redundancy (FTR). Dell Technologies now enables customers to select between these at point of sale for select platforms. Understanding these PSU redundancy options is critical as the selection will determine the minimum PSU capacity required to support the targeted PowerEdge server configuration.
FR configurations run at full performance during normal operating conditions and after PSU redundancy loss (if a PSU goes down due to input loss or fault). FR is optimized for consistent performance, thus the minimum PSU capacity allowed will ensure that the platform configurations full performance power requirements can be supported. In summary – PowerEdge users looking to adopt FR gain consistent PSU performance during normal and fault operating conditions, but will require a PSU capacity capable of supporting full performance power requirements.
FTR configurations run at full performance during normal operating conditions, but after PSU redundancy loss, intelligent platform power control loops may dynamically reduce system performance to limit the platform’s power consumption within the capacity of the healthy PSU. FTR is optimized to enable support for richer platform configurations within a target PSU capacity that provides additional performance and capabilities during normal operations. The target PSU capacity is driven by multiple potential factors, such as:
- A larger PSU capacity is not available
- PSU capacity is right sized for a typical workload for CapEx and/or OpEx savings
- Require configuration support within the capacity of PSUs with C14 inlet connector
- Require configuration support within the low-line AC (110V) power limits of C14 and C20 inlet connectors
- Require PSU efficiency level and/or input type that is only available in limited PSU capacities
To support richer configurations with more perfomance and capability during normal operation, FTR takes advantage of the additional PSU capacity from the redundant PSU during normal operation. However, when the redundant PSU fails, FTR must take away performance to compensate for loss of additional power capacity that enabled the additional perfomance and capability. In summary – PowerEdge users looking to adopt FTR will have richer platform configuration options within a PSU capacity limit , but must assess the potential impact of performance degradation to their workload.
Addressing the Negative Stereotype
Historically, FR has been deemed as the superior PSU redundancy option. Customers viewed FTR concepts as a “trick” to compensate for a design limitation. Dell Technologies was originally opposed to supporting FTR due to the negative stigma associated with it.
Eventually, Dell Technologies added support for FTR to PowerEdge platforms because platform power requirements were increasing faster than PSU technology advancements. FTR was not advertised or marketed despite being an essential technology to support platform configurations that customers wanted. Only limited references were made in technical white papers.
As FTR concepts have become standard within the industry, it is now seen as a minor trade-off for a greater upside – a solution to various modern-day datacenter power challenges that will not require additional PSUs, greater PSU capacity, or a loss in redundancy. As component density and quantity continues to increase with each generation, customers now require more and more power yet still have the same mechanical (limited space) or electrical (power budget) constraints. FTR resolves these challenges by allowing the total load to exceed the capacity of a single PSU during normal operation by utilizing the additional capacity of the redundant PSU, which results in a considerable increase in power standards and peaks during normal operating conditions.
That is what is so ironic about FTR – its “fatal flaw” of throttling has also become its “saving grace”. FR does not allow for performance variations while FTR does, and this creates use cases where users can leverage FTR to support richer configurations without upgrading their PSU infrastructure. Figure 1 illustrates power, performance, and capability during normal operating conditions, while Figure 2 illustrates how power, performance, and capability during a PSU redundancy loss event:
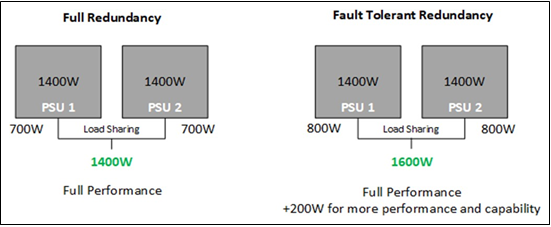
Figure 1 – Example of FR/FTR performance during normal operating conditions
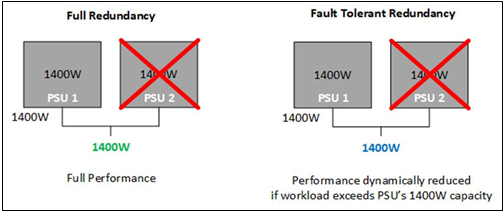
Figure 2 – Example of FR/FTR performance after PSU redundancy loss occurs
User Navigation Example
The latest-generation of PowerEdge servers (15G) support the option to choose Full Redundancy or Fault Tolerant Redundancy via PSU options at point of sale. Users can configure their servers via the sales portal on www.dell.com and have the option to click a step deeper via the Dell Enterprise Infrastructure Planning Tool (EIPT) for more granular guidance, as shown in Figure 3. Reviewing the PSU options in the PSU Guide and workload power details in EIPT will help PowerEdge users fine-tune their PSU configuration.
- Gray – PSU capacity options cannot support the platform configuration
- White – FTR. PSU capacity options can support the platform configuration, but peformance may be degraded after PSU redundancy loss
- Green – FR. Minimum PSU capacity that can support the configuration with full performance during normal and fault operating conditions. Capacities greater than this capacity are also FR
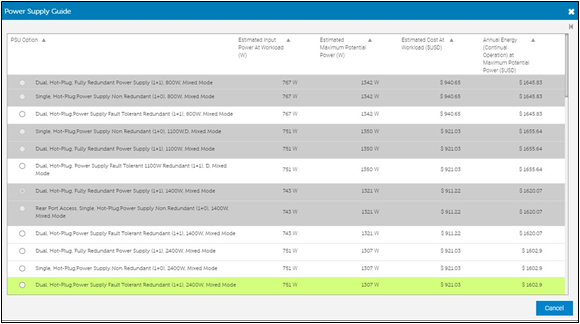
Figure 3 – Dell EIPT tool displaying various power and cost metrics based on configured PowerEdge server
For example, as seen in Figure 3, 2400W is required for FR. FTR enables the configuration to be supported with 1400W, 1100W, or 800W PSUs. If the platform were the R650 instead of the R750, the 2400W would not be an available option because it is the larger 86mm form factor which is not supported in the 1U 650. FTR enables this configuration to be supported when it could not be otherwise.
If the customer required the PSU input voltage to be low line AC (110V), the 1400W and 1100W PSUs would be limited to a 1050W output. The 2400W PSU would be limited to 1400W. Since 2400W is required for FR, this configuration could not be supported with FR. FTR enables this configuration to be supported with low line AC input.
EIPT estimates the typical power consumption with the 2400W PSU for the target workload to be 751W. The Maximum Potential Power (power virus) is estimated to be 1307W. Note, these are input power estimates, thus they are a little higher than the output power estimate and vary based on capacity due the PSU efficiency curves. The 2400W is the FR recommendation over the 1400W despite the worst case 1307W sustained power estimate because there are short duration power transie nts that exceed the 1400W power delivery capability.
FTR enables the customer to optimize CapEx and OpEx by right sizing their PSU capacity. 1400W could be an option to right size and still provide significant capacity to eliminate or minimize any potential performance degradation. With an estimated 751W typical power, the 1100W and 800W would be more aggress PSU right size options that provides the needed power for the user’s workload assuming the workload does not change. If the workload or environment changes AND PSU redundancy is lost, FTR will manage the load increase to avoid unexpected shutdown and potential data loss.
Pros, Cons and Use Cases
Full Redundancy
- Pros
- Consistent performance during normal operating conditions and PSU redundancy loss
- No PSU throttling
- Cons
- Maximum sustained power is constrained to the specifications of one PSU
- Does not utilize the additional capacity of the redundant PSU during normal operation
- Use Cases
- Configurations that meet power requirements with only one PSU
- Workloads that are sensitive to performance variations, such as HPC
- Platforms that do not have mechanical constraints, such as limited space for more PSUs
- Data centers that do not have electrical constraints, such as low-line AC
Fault Tolerant Redundancy
- Pros
- Allows for increased sustained perfomance during normal operating conditions
- Utilizes the additional capacity of the redundant PSU during normal operation
- Eliminates cost of purchasing additional or higher capacity PSU
- Does not require giving up PSU redundancy
- Does not require down-grading platform configuration to fit within target PSU capacity
- Cons
- Performance may be reduced during PSU redundancy loss
- Use Cases
- Configurations that would meet power requirements with the performance increase coming from the redundant PSU
- Platforms that have mechanical constraints, such as limited space for more PSUs
- Data centers that have electrical constraints, such as low-line AC
Conclusion
Dell Technologies supports both Full Redundancy (FR) and Fault Tolerant Redundancy (FTR) options for the latest-generation (15G) of PowerEdge servers. By understanding the pros and cons of each redundancy type, users can optimize their server by upgrading or downgrading their configuration infrastructure based on what type of power redundancy they desire.

Why Buy DellEMC Drives?
Mon, 16 Jan 2023 13:44:20 -0000
|Read Time: 0 minutes
Summary
Dell Technologies offers its own DellEMC drives as an alternative to traditional drive manufacturers. But why should PowerEdge customers choose DellEMC drives over other drives? This brief DfD will discuss various requirements set in place to ensure DellEMC drives are high quality components that are fully compatible with DellEMC product lines, and as a result, why choosing these drives will provide users the highest-quality solution for their server needs.
Dell-branded hard drive disks (HDD’s) and solid-state drives (SSD’s) are high quality components that are fully compatible with DellEMC PowerEdge servers. We suggest that our customers buy these drives for the following reasons:
- DellEMC drives are manufactured by premium, selective partners that Dell Technologies has strong relationships with, including Samsung, Kioxia, Western Digital, Seagate, Hynix, Intel, and Toshiba. These drive suppliers have been thoroughly vetted to ensure that Dell is able to specify premium bill-of-materials, manufacturing process control of hardware subcomponents, and control the firmware development to ensure best-in-class interoperability. There is also a Dell advantage for continuous process improvements to enhance quality and reducing the costs of maintenance. As a result, customers receive improved performance and drive reliability frequently higher than the reliability of generic or channel drives.
- Stringent component testing is enforced to ensure DellEMC drives meet quality standards in all operational environments. Dell Technologies requires high-quality manufacturing processes, including long test times and burn-in, ongoing sample testing, component stress testing, firmware interoperability testing, and reliability testing. As a result, DellEMC drives are extremely high- quality components that customers can consistently rely on.
- All DellEMC drives have been developed and validated to function as designed on the Dell platforms for which they are offered. Dell Technologies defines and controls the operational capabilities of DellEMC drives with the complete storage subsystem in mind. In short – these drives are designed for Dell products resulting in specific capabilities, including the following:
- Quality tracking and monitoring
- Material traceability to the supplier manufacturing line
- Continuous firmware improvements, faster bug fixes, and integrated update packages
- Performance optimization for various DellEMC product lines

Instant Scramble Erase
Mon, 16 Jan 2023 13:44:20 -0000
|Read Time: 0 minutes
Summary
The ability to erase a storage drive both quickly and completely is critical for customers looking to retire or repurpose their server’s hardware. Instant Scramble Erase (ISE) is an easy-to- use feature that lets users instantly erase their storage drives so they can be retired or repurposed for future use. This DfD will discuss the technology behind ISE, why it is the superior solution for erasing storage drives, and how Dell EMC PowerEdge servers support this feature.
ISE Technology
Instant Scramble Erase (ISE), or Instant Secure Erase, is a feature that allows users to erase content instantly and permanently from their hard drive disks (HDDs) and solid state drives (SSDs), so they can be repurposed for future use or retirement altogether. This erasure process was historically done by overwriting the data, which writes zeros or other data patterns across the drive. However, the overwriting process requires a massive amount of time to complete, especially for higher drive capacities, which prompted the development of ISE.
ISE introduces a built-in encryption/decryption engine for each drive to encrypt data on its way into the internal magnetic storage media (or flash memory) and to decrypt data on its way out. This function is always on and is totally transparent to the user.
For encryption to work, an encryption key is required. This “media encryption key” is kept entirely within the drive, with no way of getting to it from the outside. The manufacturer sets the key when each drive is built, and the key is safeguarded through protection mechanisms. If this key were to get corrupted or destroyed, the user could not properly retrieve any data written to the media. If the decryption key does not match the key used for encryption, any data read by the user looks like meaningless, random bytes that are unusable.
Erasing all the data on an ISE drive is simple! The user tells the drive to permanently throw away its original internal media encryption key and self-generate a new, unrelated key to be used for any new data written from that point forward. The key mismatch makes any existing data on the drive indecipherable. Depending on the type of drive, the controller either returns meaningless bytes until new data is written or it returns an initialization pattern containing zeros, like a new drive.
Dell EMC PowerEdge servers have ISE support for all storage interface mediums, including SATA, SAS and NVMe. In fact, ISE drives are sold as the default offering. These ISE drives follow the NIST SP 800-88r1 standard and are NIST purge compliant, meaning any and all “old data” is irretrievable upon erasure. The ISE feature can be accessed through the Lifecycle Controller GUI.
Comparison of ISE Drive Types
Storage drives that do not support ISE are missing one critical element – an encryption engine. Figure 1 below highlights and compares the various forms of ISE and non-ISE drives:
- Non-Encrypting drives have no encryption engine and can only support the overwrite function. Dell has phased out this older generation drive type.
- ISE drives automatically encrypt data using an internal media encryption engine and an internal data encryption key. This type of drive supports the T10 or T13 cryptographic sanitize commands, but does not support TCG (Trusted Computing Group) functionality. Dell sells this drive type as the default offering.
- SED (Self-Encrypting) drives use a TCG security architecture and command set to manage their data encryption and data access functions. Dell currently ships this drive.
- FIPS drives are SED drives that have received certification to the FIPS-140 (Federal Information Processing) standard. Dell currently ships this drive.
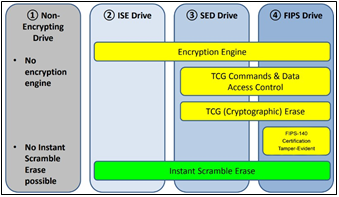
Figure 1 – Four drive types with reference to encryption capabilities
Benefits of ISE
- Speed - the execution time required for any capacity ISE drive to be repurposed would be in the scope of seconds, whereas a non-ISE drive may require hours depending on the drive capacity. The time to scramble an ISE drive is independent of the drives’ capacity.
- Simplicity - One standard command is used (no specialized security protocol is required).
- Thoroughness - Even the physical locations of reassigned logical blocks are scrambled (in the rare chance that previously unrecoverable data can somehow be recovered). The next best erasure practice, overwriting the entire drive several times, cannot touch these physical locations.
- Repurposing - Drives can be quickly “recycled” into new uses in the data center with no residual data left over from previous use.
Conclusion
The Instant Scramble Erase (ISE) feature significantly shortens the time required to repurpose storage drive content by using cryptographic erase procedures. With no drawbacks, PowerEdge customers planning to repurpose their storage drives should take full advantage of this supported feature.

Multi Vector Cooling 2.0 for Next-Generation PowerEdge Servers

Mon, 16 Jan 2023 13:44:20 -0000
|Read Time: 0 minutes
Summary
Next-generation PowerEdge servers (15G) support the latest compute, storage and networking technologies with the help of innovation in hardware and thermal controls design that builds on the foundations of the previous-generation (14G) MVC 1.0 solution. This DfD outlines the new MVC 2.0 innovations on both the hardware thermal design and system thermal controls front that enables maximum system performance, with an eye on thermal efficiency and key customizations desired by customers to tune the system to their deployment needs and challenges.
Introduction
Next-generation PowerEdge servers (15G) support higher-performance CPUs, DIMMs and networking components that will greatly increase the servers’ capabilities. However, as capabilities increase, so does the need for continued innovation to keep the system cool and running efficiently.
Multi Vector Cooling (MVC) is not any specific feature – rather it is a term that captures all of the thermal innovations implemented onto PowerEdge platforms. MVC 2.0 for next-generation PowerEdge servers builds upon existing innovations with additional support in hardware design, improved system layout, and cutting-edge thermal controls. These improvements address the needs of an ever-changing compute landscape, demanding a ‘green performance’, low carbon footprint, as well adding customization levers to optimize not only at the server level, but also at the data center level, generally with airflow handling and power delivery.
Hard Working Hardware
While most of the innovations for MVC 2.0 center around optimizing thermal controls and management, the advancement of physical cooling hardware and its architecture layout is clearly essential:
- Fans - In addition to the cost-effective standard fans, multiple tiers of high performing, Dell-designed fans are supported to increase system cooling. The high performance silver and gold fans can be configured into next-generation PowerEdge servers for supporting increased compute density. Figure 1 below depicts the airflow increase (in CFM) for these high performance fans when compared to baseline fans.
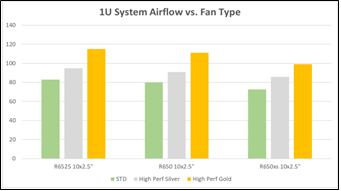
Figure 1 – Comparison of airflow output in CFM
- Heatsinks - The improved CPU heatsink design not only improves CPU cooling capability, but also helps in streamlining airflow and air temperature distribution across the chassis. Innovative heatsink ‘arms’ with high performance heat pipes and optimized fin spacing achieve this goal.
- Layout - The T-shape system motherboard layout, along with PSUs that are now located at each corner of the chassis, allows improved airflow balancing and system cooling, and consequently, improved system cooling efficiency. This layout also improves PSU cooling due to reduced risk from high pre-heat coming from CPU heatsinks, and the streamlined airflow helps with PCIe cooling as well enabling support for PCIe Gen4 adapters. Lastly, this layout creates a better cable routing experience on the PDU side of the racks where power cables are generally separated by grid assignments for redundancy.
AI Based Thermal Controls
To best supplement the improved cooling hardware, the PowerEdge engineering team focused on developing a more autonomous environment. Key features from prior-generations were expanded upon to deliver thermal autonomous solutions capable of cooling next-generation PowerEdge servers. Our AI based proprietary and patented fuzzy logic driven adaptive closed loop controller has been expanded to not just do fan speed control based on thermal sensor input but is now utilized for power management. This allows for the optimization of system performance, especially in transient workloads and systems operating in challenging thermal environments by automating power management that is required beyond fan speed control for thermal management.
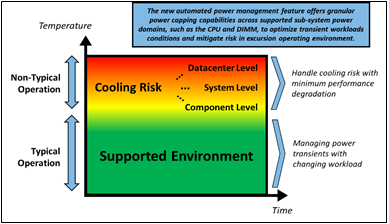
Figure 2 – Each operating environment has unique challenges
This automation with granular power capping capability across various supported sub -system power domains (more specifically CPU and DIMM) ensures thermal compliance with minimum performance impact in challenging thermal conditions. See Figure 2 for illustrates area where new controls solution optimize system performance and uptime.
iDRAC Datacenter Thermal Management Features and OME
With introduction of iDRAC Datacenter license and OME’s power manager one-to-many capabilities, customers can monitor and tackle challenges associated to server customizations as well as deployment in their datacenter (power and airflow centric). Below list highlights some of the key features:
- System Airflow Consumption - Users can view real-time system airflow consumption (in CFM), allowing airflow balancing at the rack and datacenter level with newly added integration in the OME Power Manager
- Custom Delta-T - Users can limit the air temperature rise from the inlet to exhaust to right-size their infrastructure level cooling
- Custom PCIe inlet temperature - Users can choose the right input inlet temperature to match 3rd party device requirements
- Exhaust Temperature Control - Users can specify the temperature limit of the air exiting the server to match their datacenter hot aisle needs or limitations (personnel presence, networking/power hardware)
- PCIe airflow settings - Users are provided a comprehensive PCIe devices cooling view of the server that informs and allows cooling customization of 3rd party cards
Figure 3 illustrates how the features previously mentioned work together at a system level:
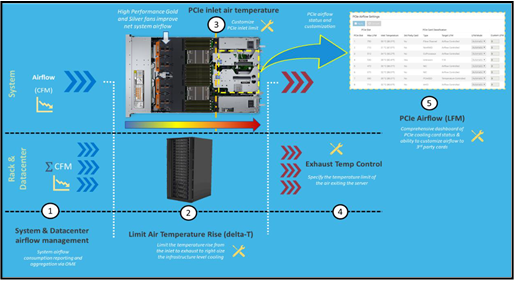
Figure 3 – iDRAC thermal management features and customizations
Channel Card Support
Dell Technologies also offers flexibility for customers wanting to implement non-Dell channel cards. Comprehensive support for PCIe communication standards like PLDM, NC-SI and custom implementations by vendors for GPUs and accelerators, such as Nvidia, AMD, Intel for temperature monitoring and closed loop system fan control. Channel cards that follow these standards will therefore have optimal thermal and power management behavior in PE Servers. Future updates would also include suppo rt of new open loop cooling levels defined in latest release of PCIe-SIG standards document.
Conclusion
The Dell Technologies MVC 2.0 solution enables next-generation (15G) PowerEdge servers to support dense configs and workloads with higher-performance cooling hardware, increased automation, simplified but advanced management and channel card flexibility. By expanding upon the existing MVC 1.0 design strategy, the MVC 2.0 solution resolves new thermal challenges so that PowerEdge customers can fully utilize their datacenters while managing the deployment constraints like airflow and power delivery in an optimal fashion.

Next-Generation PowerEdge Servers: Thoughtful Thermal Design
Mon, 16 Jan 2023 13:44:20 -0000
|Read Time: 0 minutes
Summary
Next-Generation Intel and AMD PowerEdge servers will support internal components with increased capabilities, such as higher CPU core counts and memory frequencies. These new features bring with them increased power consumption. Dell Technologies has refined its thermal design to optimize cooling of these enhanced hardware ingredients. This DfD will explain what changes were made to the thermal architecture of next- generation Intel and AMD PowerEdge servers, as well as the key benefits each change will bring to the end user.
Introduction
The installment of 3rd Generation Intel and AMD processors will give next- generation PowerEdge servers ample computing capacity. The newest PowerEdge servers are packed full of dense heat-producing semiconductors that must be adequately managed to stay below the recommended operating temperatures. The Dell Technologies thermal engineering team has tailored new thermal solutions and designs to address these concerns.
Increased Power Means Increased Heat
The most significant driver for the thermal redesign is the increase in power (Watts) being consumed by internal components. For example, Intel Ice Lake processors can now support up to 40 cores of processing power, but this at the toll of consuming up to 270W. Additionally, Intel also has a 33% increase in memory channels that support 9% higher speeds, amongst other new heat- producing features below:
- 2x PCIe performance with Gen4
- 33% more I/O lanes
- NVMe HW RAID
- Hot-Plug BOSS (2x M.2) for boot
These features create a dense server that can consume more power than previous generations. To keep the system cool, the following thermal design changes have been made to next-generation (15G) PowerEdge servers:
Thoughtful Thermal Design Changes
High Performance Fans – New higher performance fans have been added to increase the amount of cool air pushed through the system, targeted at higher power semiconductors (CPUs, GPUs and NVMe drives). A 3-tier approach to fan performance is employed to address the trend of increasing total power. This includes standard fans and high performance silver and gold fans, which increase the airflow capability versus the previous-generation fans (see Figure 1).
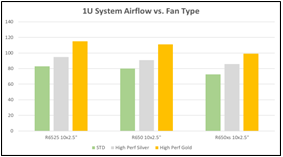
Figure 1 – Graph illustrating the increased fan airflow (in CFM) for high performance silver and gold fans compared to baseline fans
In 2U systems, the gold fan features a dual rotor design in a larger form factor and spacers implemented for the standard and silver fans. Both Intel and AMD next-generation PowerEdge servers will support the silver and gold fans. The fan type is predetermined according to the server platform and hardware configuration.
Smaller PSU Form Factor and Location – To create space for a thermal architecture redesign, PSUs have been relocated to the outside edges of the 1U and 2U server chassis. This provides purposeful exhaust lanes for hot airflow from the CPUs to prevent overheating of downstream hardware components such as PCIe cards, OCP or PSUs. In the 1U systems a new, narrower, 60mm form factor PSU is implemented to further increase the exhaust path space. The new PSU layout and form factors are supported for both Intel and AMD next-generation PowerEdge servers. See Figure 2 below for illustrations of this new PSU layout.
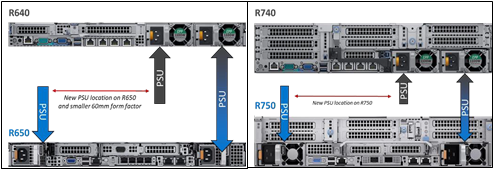
Figure 2 – PowerEdge R650/R750 PSU architecture compared to R640/R740
Balanced Airflow Design – Perhaps the most impactful change is having a more balanced airflow design. Figure 3 illustrates that the R650 motherboard layout is more symmetrical than the R640. The R640 layout was challenged due to PSU and PCIe cards located directly downstream of the CPU exhaust paths creating PSU and PCIe cooing challenges and an imbalance in airflow across the width of the system. The R650 virtually eliminates these bottlenecks by moving the PSUs out of the CPU exhaust path, balancing the airflow, and creating the purposeful paths for CPU exhaust airflow to the rear of the chassis. The R750 features the same split PSU layout and purposeful CPU exhaust paths in addition to a dedicated duct design that delivers fresh air to the rear PCIe slots for high power GPU configurations.
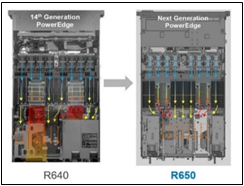
Figure 3 – The PowerEdge R650 has a more balanced airflow design compared to the PowerEdge R640
Conclusion
Dell Technologies PowerEdge servers with 3rd generation Intel® and AMD processors delivers a thoughtful total solution that accommodates semiconductor thermal requirements by improving the internal thermal design. By implementing higher performance fans, new PSUs and purposeful airflow pathways, PowerEdge customers can maximize their work output without having to worry about overheating their system.

Memory Bandwidth for New PowerEdge Servers is Significantly Improved with Ice Lake Architecture
Mon, 16 Jan 2023 13:44:20 -0000
|Read Time: 0 minutes
Summary
New PowerEdge servers fueled by 3rd Generation Intel® Xeon® Scalable Processors can support sixteen DIMMs per CPU and 3200 MT/s memory speeds. This DfD will compare memory bandwidth readings observed on new PowerEdge servers with Ice Lake CPU architecture against prior-gen PowerEdge servers with Cascade Lake CPU architecture.
Ice Lake CPU Architecture
3rd Generation Intel® Xeon® Scalable Processors, known as Ice Lake processors, are the designated CPU for new Dell EMC Intel PowerEdge servers, like the R650 and R750. Compared to prior-gen 2nd Generation Intel® Xeon® Scalable Processors, Ice Lake architecture will support 33.3% more channels per CPU (an increase from six to eight) and 9.1% higher memory speeds (an increase from 2933 MT/s to 3200 MT/s.)
Performance Data
To quantify the impact of this increase in memory support, two studies were performed. The first study (see Figure 1) measured memory bandwidth determined by the number of DIMMs per CPU populated. The second study (see Figure 2) measured memory bandwidth determined by the number of CPU thread cores. Both STREAM bandwidth benchmarks have Ice Lake populated with eight 3200 MT/s DIMMs per channel, and Cascade Lake populated with six 2933 MT/s DIMMs per channel.
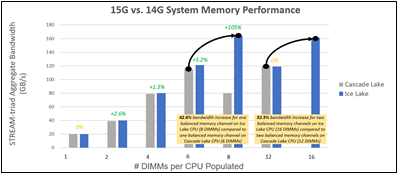
Figure 1 – Ice Lake and Cascade Lake bandwidth comparison by # of DIMMs per CPU
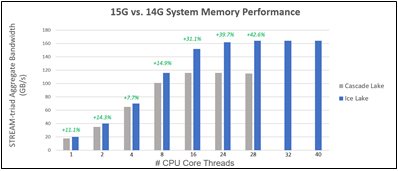
Figure 2 – Ice Lake and Cascade Lake bandwidth comparison by # of CPU core threads
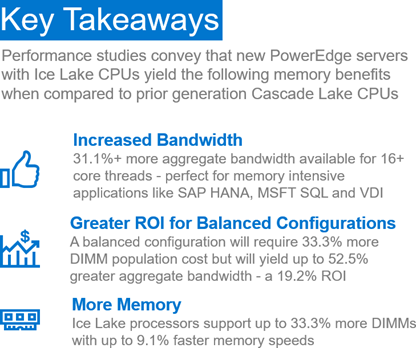

NVMe Performance Increases for Next-Generation PowerEdge Servers with PERC11 Controller
Mon, 16 Jan 2023 13:44:21 -0000
|Read Time: 0 minutes
Summary
Dell Technologies newest RAID iteration, PERC11, has undergone significant change - most notably the inclusion of hardware RAID support for NVMe drives. To better understand the benefits that this will bring, various metrics were tested, including NVMe IOPS, disk bandwidth and latency. This DfD compares NVMe performance readings of the next-generation Dell EMC PowerEdge R650 server, powered by pre-production 3rd Generation Intel® Xeon® Scalable processors, to the prior-generation PowerEdge R640 server, powered by 2nd Generation Intel® Xeon® Scalable processors.
Introduction
With support for NVMe hardware RAID now available on the PERC11 H755N front, H755MX and H755 adapter form factors, we were eager to quanitfy how big of a performance boost next-generation PowerEdge servers with hardware RAID would obtain. Dell Technologies commissioned Principled Technologies to execute various studies that would compare the NVMe Input/Output Per Second (IOPS), disk bandwidth and latency readings of next-geneation PowerEdge servers (15G) with NVMe hardware RAID support against prior-generation PowerEdge servers (14G) without NVMe hardware RAID support.
Test Setup
Two servers were used for this study. The first was a PowerEdge R650 server populated with two 3rd Gen Intel® Xeon® Scalable processors, 1024GB of memory, 3.2TB of NVMe storage and a Dell PERC H755N storage controller. The second was a PowerEdge R640 server populated with two 2nd Gen Intel® Xeon® Gold Scalable processors, 128GB of memory, 1.9TB of SSD storage and a Dell PERC H730P Mini storage controller.
A tool called Flexible Input/Output (FIO) tester was used to create the I/O workloads used in testing. FIO invokes the production of threads or processes to do an I/O action as specified by the user. This test was chosen specifically because it injects the smallest system overhead of all the I/O benchmark tools we use. This in turn allows it to deliver enough data to the storage subsystem to reach 100% utilization. With the tool, five workloads were run at varied thread counts and queue depths on RAID 10, RAID 6, and RAID 5 levels of the Dell EMC PowerEdge R650 server with PERC H755n RAID controller and NVMe drives and the Dell EMC PowerEdge R640 server with a PERC H730P Mini controller and SATA SSD drives.
Read-heavy workloads indicate how quickly the servers can retrieve information from their disks, while write-heavy workloads indicate how quickly the servers can commit or save data to the disk. Additionally, random and sequential in the workload descriptions refer to the access patterns for reading or writing data. Random accesses require the server to pull data from multiple disks in a non-sequential fashion (i.e., visiting multiple websites), while sequential accesses require the server to pull data from a single continuous stream (i.e., streaming a video).
Performance Comparisons
IOPS
IOPS indicates the level of user requests that a server can handle. Based on the IOPS output seen during testing, upgrading from the prior-generation Dell EMC PowerEdge R640 server to the latest-generation Dell EMC PowerEdge R650 server could deliver performance gains for I/O-intensive applications. In all three RAID configurations tested, the PowerEdge R650 with NVMe SSDs delivered significantly more IOPS than the prior-generation server. Figures 1, 2 and 3 show how many average IOPS each configuration handled during testing:
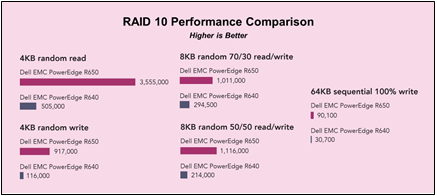
Figure 1: IOPS comparison for RAID 10 configurations
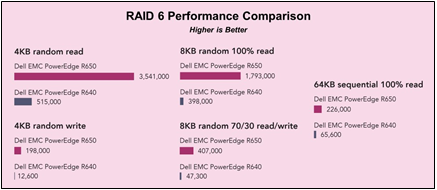
Figure 2: IOPS comparison for RAID 6 configurations
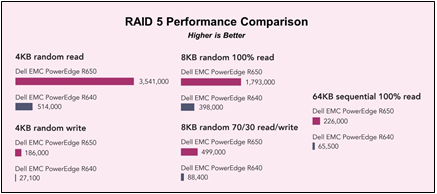
Figure 3: IOPS comparison for RAID 5 configurations
Disk Bandwidth
Disk bandwidth indicates the volume of data a system can read or write. A server with high disk bandwidth can process more data for large data requests, such as streaming video or big data applications. At all three RAID levels, the latest-generation Dell EMC PowerEdge R650 server with NVMe storage transferred significantly more MB per second than the prior-generation server. Figure 4 shows the disk bandwidth that each of the two servers supported for each RAID level:
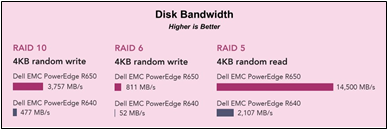
Figure 4: Disk bandwidth comparison for RAID 10, 6 and 5 configurations
Latency
Latency indicates how quickly the system can respond to a request for an I/O operation. Longer latency can impact application responsiveness and could contribute to a negative user experience. In addition to greater disk bandwidth, the Dell EMC PowerEdge R650 server delivered lower latency at each of the three RAID levels than the prior-generation server. Figure 5 shows the latency that each server delivered while running one workload at each RAID level.
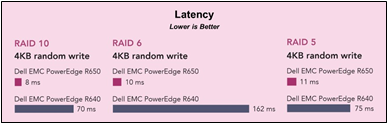
Figure 5: Latency comparison for RAID 10, 6 and 5 configurations
Conclusion
The next-generation PowerEdge R650 server with NVMe HW RAID support increased IOPS by up to 15.7x, disk bandwidth by up to 15.5x, and decreased latency by up to 93%. With the inclusion of NVMe HW RAID support on Dell Technologies’ new PERC11 controllers, now is a great time for PowerEdge customers to migrate their storage medium over to NVMe drives and yield the higher-performance that comes with it!
For more details, please read the full PT report Accelerate I/O with NVMe drives on the New PowerEdge R650 server

NVMe Hot-Plug and Industry Adoption
Mon, 16 Jan 2023 13:44:21 -0000
|Read Time: 0 minutes
Summary
Dell EMC understands that hot- plug operations for NVMe SSDs while the server is running are essential to reducing and preventing costly downtime. The latest PowerEdge servers support a wide variety of hot- plug serviceability features, including: Surprise insertion, which enables addition of NVMe SSDs to the server without taking the server offline. Surprise removal on OSes that support it, which allows a user to quickly remove a faulty, damaged, or worn out NVMe SSD.
The latest Dell EMC PowerEdge servers (15G) and previous generations (14G, 13G) support a wide variety Reliability, Availability, Serviceability, and Manageability (RASM) features designed to enhance server uptime and reduce total cost of ownership, as shown in Figure 1 below:
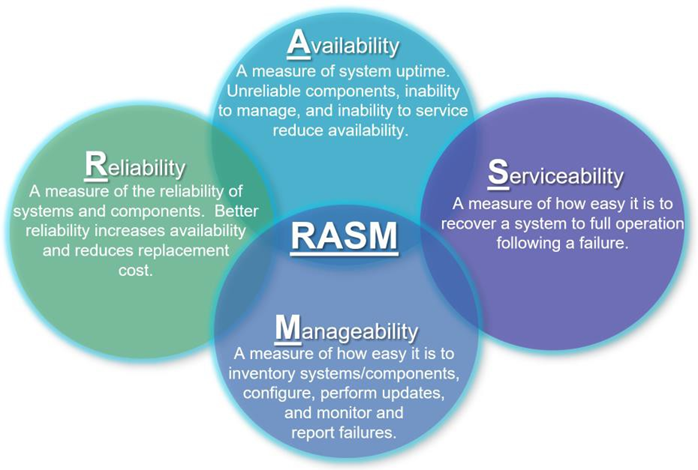
Figure 1 - Reliability, Availability, Serviceability, and Manageability
One notable RASM feature supported on PowerEdge servers is the serviceability of Hard Disk Drives (HDDs) and Solid-State Drives (SSDs) and most recently NVM Express (NVMe) solid-state drives (SSDs). NVMe is an industry standard storage protocol designed to optimize performance of solid-state drives. Serviceability features allow NVMe SSDs to be added, removed, or replaced without the server having to be opened or turned off. This allows for easy replacement and/or re-provisioning.
NVMe SSDs in the U.2 2.5” form-factor are typically located in the front of PowerEdge servers which enables the easiest accessibility, however there are designs where these devices reside in the rear of the server. Refer to the Installation and Service Manual for your PowerEdge server for more details on the location and servicing of NVMe SSDs.
Serviceability is further enhanced by allowing U.2 2.5” NVMe SSD mounted in the front or rear of the server to be serviced while the server is powered on and running using an industry feature referred to as hot-plug which maximizes availability by minimizing costly server downtime. Hot-plug is broken down into two operations:
- Hot Insert: You insert an NVMe SSD into a running server.
- Surprise Insertion: Prior to physically inserting the NVMe SSD, you do not notify the system that the NVMe SSD is about to be inserted.
- Hot Removal: You remove an NVMe SSD from a running server.
- Surprise Removal: Prior to physically removing the NVMe SSD, you do not notify the system that the device is about to be removed.
- There are also orderly operations where operating system commands are used.
- Orderly Insertion: Prior to physically inserting the NVMe SSD, you notify the system that the NVMe SSD is about to be inserted.
- Orderly Removal: Prior to physically removing the NVMe SSD, you notify the system that the NVMe SSD is about to be removed.
PowerEdge servers and the operating systems supported on them support surprise insertion. There is no need to notify the system before hot-inserting an NVMe SSD.
Note: For surprise removal of any storage device (SAS, SATA, USB, NVMe, etc.), the user must ensure the data is not critical to the functioning of the system before removing the storage device. For example, a non-RAID boot storage device or swap file storage device could typically not be removed from a running system as doing so would likely crash the operating system.
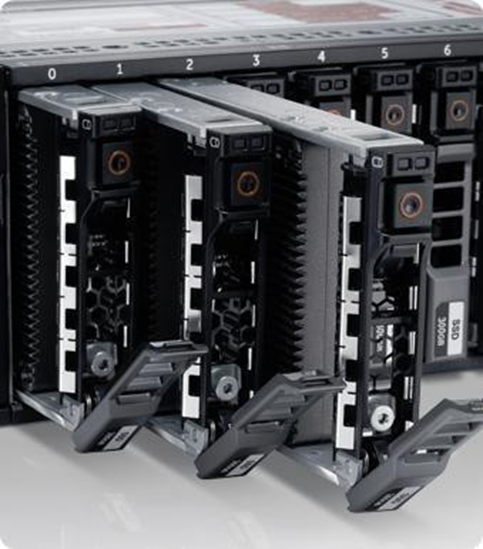 Figure 2 - Hot-Pluggable NVMe SSDs
The factors below also impact the ability to successfully hot-plug NVMe SSDs on PowerEdge servers:
- Form Factor – Hot-plug is only supported on U.2 2.5” form factor NVMe SSDs externally accessible in the front or rear of the server. PCIe Adapter Card NVMe devices do not support hot-plug.
- Mechanicals – PowerEdge servers are designed with high insertion count connectors on our backplane designs as well as the NVMe SSDs we use. For hot insertions, the NVMe SSD needs to be fully inserted. For hot removals, the NVMe SSD needs to be fully removed.
- Number of NVMe SSDs supported – All NVMe U.2 2.5” SSDs are hot pluggable, but only one at a time should be hot plugged.
- Operational Times – Hot-plug operations are only supported once the operating system has loaded. Hot plug operations are not supported when the OS is shutting down or in pre-boot.
- Timing – Hot-plug operations should be performed in a timely manner. Removal and insertion should be completed within 1 second.
We’ve discussed above what hot-plug is and why it is important to users. We will now go into details on the inter- dependencies of the operating system and BIOS to support hot-plug operations with NVMe SSDs.
For many storage device protocols, such as SAS, SATA, and USB, there is no need for orderly removal operations provided the data on the drives is not critical for continued operation of the system. For these protocols, surprise remove will suffice. Many operating systems, NVMe device drivers, and applications may not support surprise removal of NVMe SSDs.
Operating systems, drivers, and applications have many years of hardening to be able to reliably handle surprise removal of SAS, SATA, and USB storage devices. In all of these cases, there is a storage controller that acts as an intermediary between the storage device and the operating system, drivers, and applications. While the drives themselves are removed, the SAS, SATA, and USB storage controllers that the operating system, drivers, and applications talk to remain in place and are never removed. These controllers are shown above the hot-plug barrier in Figure 3.
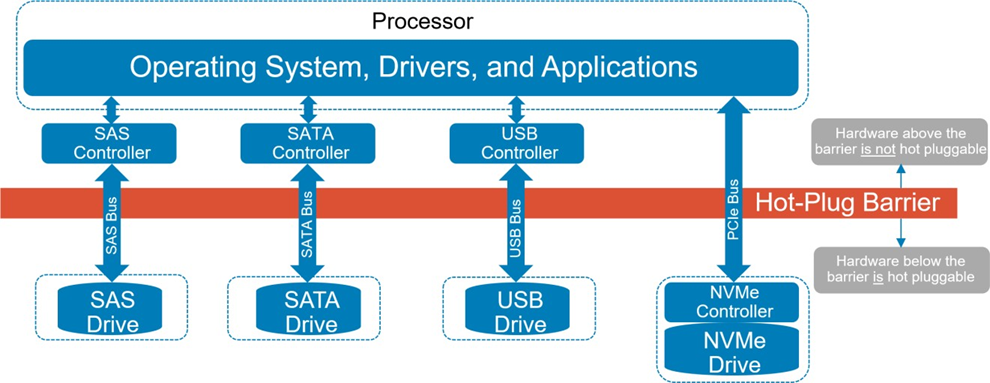 Figure 3 - Storage Controller Hot-Plug Comparison
In NVMe, the storage controller was moved down on to the storage device below the hot-plug barrier as shown in Figure 3. An advantage of this approach is that it removes an added component layer when compared to the other storage solutions and helps NVMe to achieve such low latency accesses. However, this introduces a new model that operating systems, drivers, and applications had not dealt with before: the storage controller itself is removed when the storage device is removed.
Also note in Figure 3 that SAS, SATA, and USB have their own dedicated bus that have been architected for hot- plug. NVMe SSDs sit on the PCIe bus. The Conventional PCI bus architecture created in the 90s had no support for hot-plug. Afterwards, a hot-plug model referred to as the Standard Hot-Plug Controller (SHPC) model (https://members.pcisig.com/wg/PCI-SIG/document/download/8236) was added to Conventional PCI but required orderly removal and orderly insertion. When PCIe was introduced (the follow-on to the Conventional PCI/PCI-X busses) it adopted the SHPC orderly insert/remove model.
There was some rudimentary support for hot-plug added to PCIe initially, but it was not architected with the complexities of NVMe SSDs in mind. Many OSes have supported hot-plug of PCIe devices with orderly removal for a while, but only recently has there been strong market demand for hot-plug with surprise removal due to the emergence of technologies that require it like NVMe SSDs and Thunderbolt. As a result, operating system vendors and application developers have only recently invested effort into supporting the surprise removal use case. As of the writing of this paper, Dell EMC supports hot-plug with surprise removal of NVMe SSDs on PowerEdge servers starting with the following operating system releases:
- Microsoft Windows Server 2019
- VMware ESXi 7.0, Patch Release ESXi 7.0b (Build 16324942). However, hot-plug and surprise removal is limited to specific configurations as outlined in this white paper.
Linux server distributions: (For additional Linux requirements, reference this white paper)
- Red Hat Enterprise Linux 8.2
- SUSE Linux Enterprise Server 15 SP2
- Ubuntu Server 20.4
Many aspects of the system need to be modified in order to support surprise removal of NVMe SSDs. Dell EMC has made the changes at the server level (BIOS/UEFI System Firmware, iDRAC, backplanes, cables, etc.) and to Dell EMC applications/drivers (OpenManage Server Administrator, Dell Update Package, S140 Software RAID and newer, etc.) to support surprise removal of NVMe SSDs. Dell EMC has also worked with the PCIe silicon vendors that provide PCIe root ports and PCIe switches used in PowerEdge servers to ensure they support surprise removal of NVMe SSDs.
Dell EMC qualified NVMe SSDs also support features needed for surprise removal such as power-loss protection (PLP) which ensures they can commit data in volatile memory buffers on the NVMe SSD to persistent memory on a power loss due to surprise removal or other conditions. When using NVMe SSDs not qualified by Dell EMC, the user should check with the vendor of those NVMe SSDs to ensure they support surprise removal.
For operating systems or applications that do not support surprise removal of NVMe SSDs, Dell EMC management tools such as OpenManage Server Administrator and iDRAC provide the user with an option to do an orderly removal via the “Prepare to Remove” task. Figure 4 on the following page shows the “Prepare to Remove” task for an NVMe SSD in OpenManage Server Administrator. For more details on the “Prepare to Remove” task, please refer to the User’s Guide for OpenManage Server Administrator and iDRAC on the Dell Technologies support page, as well as the Dell PowerEdge Express Flash NVMe PCIe SSD 2.5 inch Small Form Factor user guide. These management tools will attempt to determine if the NVMe SSD is in use and warn the user if so. They cannot detect all cases where an NVMe SSD is in use and so the user should verify the NVMe SSD is no longer in use prior to removing it. Some operating systems may prevent orderly removal of NVMe SSDs that are still in use.
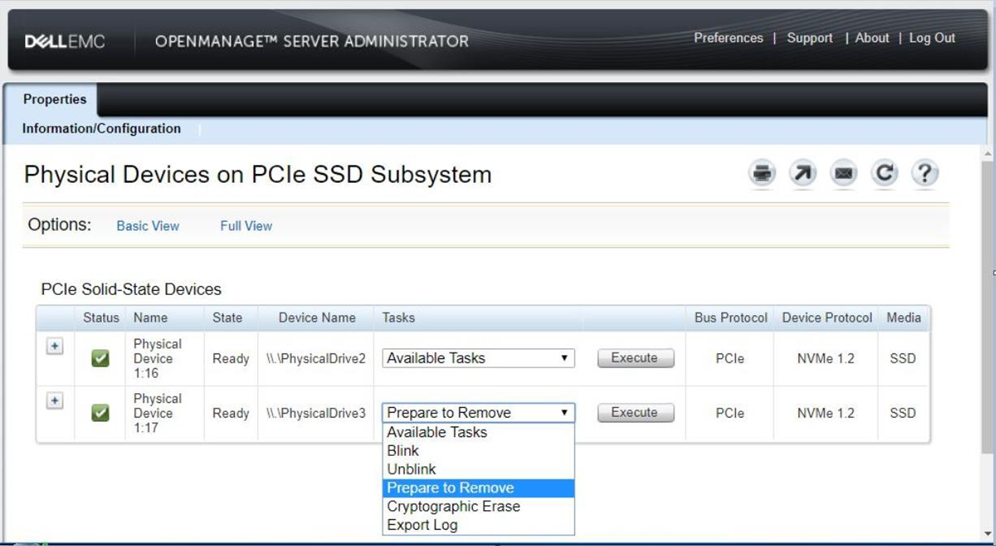
Figure 4 - Prepare to Remove NVMe SSD
Users will need to check with the vendor of any operating system or third-party application that accesses NVMe SSDs to determine if it supports surprise removal of NVMe SSDs. For operating systems or third-party applications that do not support surprise removal of NVMe SSDs, users should perform an orderly removal as described above.
Dell EMC is also working with various industry standards bodies such as PCI-SIG (https://pcisig.com/) and the ACPI Specification Working Group (https://www.uefi.org/workinggroups), silicon providers, operating system vendors, and other OEMs to define new industry standard mechanisms to further improve support for NVMe hot-plug operations in the future.
Conclusions
The latest Dell EMC PowerEdge servers (15G) and previous generations (14G, 13G) support a wide variety of hot- plug serviceability features for NVM Express (NVMe) Solid-State Drive (SSDs) that address RASM and improve TCO. Surprise insertion is supported to allow adding NVMe SSDs to the server without taking the server offline. For operating systems that support it, surprise removal is supported to allow a user to quickly remove faulty, damaged, or worn out NVMe SSDs. Dell EMC understand that hot-plug operations for NVMe SSDs while the server is running reduces costly downtime and are driving the industry to improve user experience.

Sustainability Improvements for Next-Generation (15G) Dell EMC PowerEdge Servers
Mon, 16 Jan 2023 13:44:21 -0000
|Read Time: 0 minutes
Summary
Dell Technologies relentlessly focuses on improving server sustainability. Designing the PowerEdge product portfolio to work more efficiently allows server technology to continue to advance while simultaneously preserving our environment. This brief DfD will highlight a few key improvements implemented on next-generation (15G) Dell EMC PowerEdge servers.
Overview
While server technology typically becomes more powerful with each passing year, Dell Technologies takes pride in designing PowerEdge servers that are more efficient and sustainable generation-over-generation. Below are a few sustainability improvements for next-generation (15G) PowerEdge servers:
Key Improvements
- Next-generation (15G) PowerEdge servers have an Energy Intensity (EI) reduction of 83% over the past 8 years
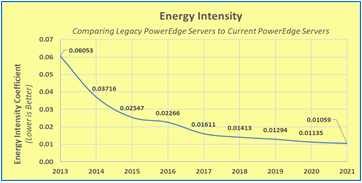
Figure 1 – The average EI for PowerEdge servers has decreased dramatically over the past eight years, largely due to power, thermal and processor improvements
- Next-generation (15G) Intel PowerEdge servers have increased Energy Efficiency (EE) by 20%-60% over previous Intel PowerEdge servers
15G Energy Efficiency Improvements over 14G | ||
Performance Measurement | Intel Gold 6x30 CPU | Intel Platinum 8x80 CPU |
Idle Power | 23.39% | 59.71% |
Max Power | 36.91% | 19.36% |
PERFCPU | 51.86% | 50.18% |
EffServer | 22.48% | 29.43% |
Perfserver | 47.81% | 55.02% |
Pwrserver | 20.68% | 19.77% |
Figure 2 – The average EE for PowerEdge servers has increased dramatically over the prior-generation, largely due to power, thermal and processor improvements
- 30% of black plastic used in PowerEdge servers is from recycled plastic
- Hardware like latches, air shrouds and casings have been targeted

Dell Technologies Direct Liquid Cooling Support for New PowerEdge Servers
Mon, 16 Jan 2023 13:44:21 -0000
|Read Time: 0 minutes
Summary
Liquid cooling is a very effective method of capturing heat commonly produced by semi- conductors, such as processors and memory, and transferring it to an isolated region to dissipate. For the release of the new Intel and AMD-based PowerEdge servers, Dell Technologies is offering a direct liquid cooling solution to ensure that customer cooling needs are met. This DfD will educate readers on how the Dell Technologies direct liquid cooling solution works, which PowerEdge servers support them, and why this solution is advantageous for data centers.
Introduction
New 15G PowerEdge platforms will offer CPUs with higher power than ever before. Dell is introducing new Direct Liquid Cooling (DLC) solutions to effectively manage these growing thermal challenges. Dell DLC solutions cool the CPU with warm liquid which has much greater (~4x) heat capacity versus air. Thus, DLC is a higher performance cooling solution for managing the CPU temperature while also enabling higher performance and better reliability. Because DLC solutions are more efficient at extracting heat, this reduces the burden on server system fans as well as the data center’s cooling infrastructure, improving sustainability and saving customers money.
New PowerEdge Server Support
Dell is expanding our portfolio of platforms with factory-installed DLC solution, from dense compute C-series to our 1U and 2U rack-mount servers. The PowerEdge servers below offer DLC cooling on the newest Intel and AMD processors:
- C6520
- C6525
- R6525
- R7525
- R650
- R750
- R750XA
Figure 1 - Multiple PowerEdge servers with new Intel and AMD processors will support the Dell Technologies DLC
Direct Liquid Cooling Technology
DLC uses the exceptional thermal capacity of liquid to absorb and remove heat created by new high-power processors. Cold plates are attached directly to the processors (see Figure 2), and then coolant captures and removes the heat from the system to a heat exchanger located in the rack or row. This heat load is removed from the datacenter via a warm water loop, potentially bypassing the expensive chiller system. By replacing (or supplementing) conventional air-cooling with higher-efficient liquid cooling, the overall operational efficiency of the data center is improved.
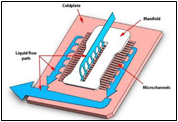
Figure 2 - DLC example of a cold plate and coolant loop
New Features and Solutions
Leaking Sensing Technology
Leak Sense technology is a new feature now included with all Dell DLC solutions, providing customers with the knowledge that potential issues will be found and reported quickly. If a coolant leak occurs, the system’s leak sensor will log an alert in the iDRAC system. Three errors can be reported: small leak (warning), large leak (critical), leak sensor error (warning – indicates the issue with the leak detection board). These error detections can be configured to take meaningful actions, such as raise an alert or power-off a server.
POD Solution
Whereas a node-level DLC solution captures between 50%-60% of a server’s internal heat (depending on the configuration), the Dell Technologies rack-level POD solution concept is designed for total heat capture. The POD solution contains front and back containment for racks of DLC servers, plus an InRow Cooler integrated between the IT racks to capture any remaining heat. Figure 3 illustrates a POD solution example.
Figure 3 - Pod solution containing two outer racks with node-level DLC and one middle InRow Cooler
Benefits of Liquid Cooling Implementation
- Increased System Cooling Capacity – DLC enables system configurations that may not possible with air cooling alone, such as high TDP CPUs, dense storage and/or add-in cards.
- Improved Energy Efficiency (PUE) – The DLC cold plate solution reduces energy costs by up to 45% relative to cooled air 1, and helps extend the life of existing air infrastructure
- Higher Compute Density – For the Ice Lake based C6520 system, DLC cooling supports of up to 25% more cores per rack. For the Milan based C6525 system (with backplane configuration supporting storage drives), DLC cooling enables 2x the core count over air-cooling alone.
- 3.1x ROI Within 4 Years – The cost of pairing DLC with existing PowerEdge cooling tower infrastructure typically breaks even within 1.3 years and yields a 3.1x payback within 4 years 2
- Swift Serviceability – The CPU DLC cold plate solution attaches with four screws, making service quick and simple.
Conclusion
The Dell Technologies DLC solution enables PowerEdge server components to take on dense workloads while staying within their required thermal limits. Customers can maximize the utilization of their datacenters with confidence knowing they have the best efficiency, ROI and flexibility that a thermal design has to offer.
- Based on Dell EMC internal analysis, March 2021, comparing hypothetical air-cooled data center with a cooling PUE of 0.62 to a hybrid data center with a cooling PUE of 0.34. A PUE of 0.21 was assigned to all overhead not attributed to cooling. Operating costs and other factors will cause results to vary. RS Means industry standards cost basis was used to measure typical cooling infrastructure costs and determine projected savings.
- Based on Dell EMC internal analysis, March 2021 comparing a hypothetical air-cooled data center to a hybrid data center. Assuming 1244 nodes, the air cooled data center uses 1825 kW whereas the hybrid uses 1544 kW. Individual operating costs and other factors will vary the results. RS Means industry standards cost basis was used to measure typical cooling infrastructure costs and determine projected savings. Based on Dell EMC internal analysis, calculating the capital cost of DLC minus the amount of CRAH, pumps, chiller, and tower to equal the net cost of DLC, and examining the operational costs of a hypothetical air-cooled data center and a hybrid data center to determine ROI. Assumes a high wattage CPU. Schneider Electric developed an analytical model that ascribes operating costs to the various types of facility infrastructure equipment. Electricity costs and other factors will vary the results. RS Means industry standards cost basis was used to estimate cooling infrastructure costs and determine projected savings.

Intel® Ethernet 800 Series Network Adapters for New PowerEdge Servers
Mon, 16 Jan 2023 13:44:21 -0000
|Read Time: 0 minutes
Summary
New PowerEdge servers with 3rd Generation Intel Xeon scalable processors were made to support dense workloads, such as machine learning, data analytics and supercomputing. These types of heavy-duty computing require strong networking performance to deliver a fast and consistent I/O experience. Intel has released 800 Series network adapters to supplement these high-caliber workloads. This 1-page DfD will explain what the 800 Series network adapters are, and how they provide premium networking performance to the datacenter.
Overview
Intel has released the Ethernet 800 Series network adapters alongside their 3rd Generation Intel® Xeon® scalable processors. The 800 Series adapters on new Dell EMC PowerEdge servers provide storage performance over the network that approaches performance readouts of direct-attached storage. PowerEdge customers seeking to support dense workloads, such as ML/DL, data analytics and supercomputing, should consider using the 800 Series network adapters over RDMA protocols for adequate networking performance.
Key Features
• ADQ (Application Device Ques) allows users to assign ques to key workloads. ADQ technology increases throughput/predictability and reduces latency/jitter for assigned que groups
• DDP (Dynamic Device Personalization) allows users to customize packet filtering for Cloud and NFV workloads- improving packet processing efficiency
• RDMA iWARP and RoCEv2 support provides high speed and low latency connectivity by eliminating three major sources of overhead; TCP/IP stack process, memory copies and application context switches
• PCIe Gen4 support allows network bandwidth to increase by ~2x
• 25GbE dual port support to increase networking speeds and bandwidths
Performance for 100Gb 800 Series Network Adapter
A performance study was conducted to compare the networking IOPS for NVMe drives on a PowerEdge R740xd. The study compared locally attached NVMe drives with network attached NVMe drives mounted through NVMe over Fabrics using RDMA over Ethernet on Intel E810 network adapters. Figure 1 shows that for four NVMe drives, the IOPS readouts are nearly identical. Six and eight drive configurations have up to ~15 percent networking performance variation. This indicates that although locally attached storage typically yields the best performance, NVMe over Fabrics network attached storage using the E810 network adapter is an excellent alternative when PCIe lanes cannot be dedicated for a locally attached NVMe connection.
*To learn more about the Intel Ethernet 800 Series, visit intel.com/ethernet
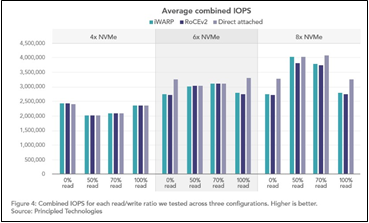
Figure 1 – NVMe IOPS for E810 adapter (over iWARP/RoCEv2) vs. direct attached

U.2 – Still the Industry Standard in 2.5” NVMe SSDs
Mon, 16 Jan 2023 13:44:22 -0000
|Read Time: 0 minutes
Summary
This DfD is an informative technical paper meant to educate readers about the initial intentions around the U.3 interface standard, how it proceeded to fall short upon development, and why server users may want to continue using U.2 SSDs for their server storage needs.
Introduction
In our world of technology, we expect to see multiple generations of devices and standards, with each successive generation being faster and more feature-rich than the previous. We have seen this pattern so often that we expect version N+1 of anything to be better than version N in nearly all respects.
So, what about the new U.3 interface standard compared to U.2? Surprisingly, U.3 is not the next generation since it was not intended to replace U.2. It was originally conceived as a low-cost NVMe replacement for the SATA SSD. A lot has changed since the inception of U.3 and eventually the standard required U.3 SSDs to be backwards compatible to existing x4 U.2 SSDs. This requirement forced SSD vendors to either develop flash controller silicon with 6 PCIe lanes or to add mux chips to steer the existing PCIe lanes on the SSD. By doing so, U.3 SSDs have the following disadvantages:
- U.3 SSDs do not hit the same cost points as SATA SSDs
- U.3 SSDs do not have any cost advantage over U.2 SSDs (and may end up being more expensive)
- U.3 SSDs lost their ability to differentiate themselves from U.2 SSDs
U.3 has been touted as a way to enable a tri-mode backplane that will support SAS, SATA and NVMe drives to work across multiple use-cases. The tri-mode backplane claim was to reduce system costs, while providing an upgrade path so that users can later replace their existing SAS and SATA drives with higher performance NVMe SSDs. While a tri-mode backplane can technically support SAS, SATA, and NVMe drives, mixing SAS and SATA virtual disks behind a single controller is rarely done. Adding NVMe to the mix makes even less sense because NVMe SSDs are much higher performing than SAS or SATA drives.
Even an upgrade path from SAS or SATA drives to all NVMe SSDs is severely limited by the tri-mode controller. A high-performance controller has 16 lanes that can support, for example, 16 x1 devices. Replacing 16 x1 SATA SSDs with 16 x1 NVMe SSDs as originally envisioned by U.3 would make sense. However, because U.3 matched U.2 and with support for up to a x4 link, customers will likely not want to give up the higher performance the additional lanes provide. A 16-lane tri-mode controller could support only 4 x4 U.3 SSDs – not very many for such an expensive controller.
A SAS expander would normally be used to increase the number of SAS devices, but it cannot support PCIe as there are no tri-mode expanders. Additionally, a PCIe switch would normally be used to increase the number of NVMe devices, but it cannot support SAS or SATA devices. The result is that the system either suffers poor
U.3 performance or must incur the cost of additional tri-mode controllers. Thus, because U.3 combines the SAS and SATA lanes with the NVMe lanes, it is much more difficult and expensive to scale out the tri-mode solution to achieve high performance. The argument that U.3 allows system designers to develop a common set of backplanes that work across multiple use cases does not hold, as the difference in link widths and the inability to scale will push users to continue adopting solutions tailored to their specific needs.
U.2 keeps the SAS and SATA lanes separate from the NVME lanes, allowing system designers to scale solutions independently with readily available SAS expanders and PCIe switches. Dell Technologies recognizes a wide range of customer requirements and provides solutions that are tailored to each market as opposed to a one-size-fits-all solution. To that end, Dell Technologies has developed high-performance, universal x4 drive bays that have been shipping on Dell PowerEdge servers for the last two generations. Dell Technologies also provides SAS and SATA-only solutions to reduce cost in entry-level systems. Next generation backplanes enable NVMe HWRAID which connects up to 8 NVMe SSDs at PCIe Gen4 x2. Direct connect solutions remain at PCIe Gen4 x4.
Conclusion
U.3 enables a tri-mode backplane which allows simple upgrades from SAS or SATA to NVMe, yet increases the base cost of a SAS or SATA solution. Moreover, unless the system is designed with sufficient lanes for the NVMe SSDs, the performance will be poor. The additional hardware required to obtain full NVMe performance negates any system cost benefits of the U.3 architecture.
Dell Technologies has demonstrated that the wide range of customer requirements can be met with SAS, SATA and U.2 drives, using designs targeted individually for performance or cost. Dell’s universal U.2 backplane takes advantage of the separation of SAS and SATA lanes from NVMe lanes to maximize NVMe performance, while maintaining SAS and SATA compatibility in a universal bay. This high-performance, universal U.2 backplane avoids the confusion and complexity brought by U.3. However, it is important to remember that the key is the backplane architecture, not the drive type. Dell’s backplane will work with U.3 SSDs, as well as U.2 SSDs, since U.3 SSDs are required to be compatible. Dell has also designed next generation backplanes to enable NVMe HWRAID which connects up to 8 NVMe SSDs at PCIe Gen4 x2. All of Dell’s direct-connect solutions remain at PCIe Gen4 x4.

The AMD MI100 GPU on the PowerEdge R7525 Will Accelerate HPC and ML Workloads
Mon, 16 Jan 2023 13:44:22 -0000
|Read Time: 0 minutes
Summary
AMD will be releasing their next-gen GPU, the MI100, in December 2020. This new technology targets to accelerate HPC and ML workloads across various industries. This DfD will discuss the performance metrics and general improvements to the MI100 GPU with the intention of educating customers on how they can best utilize the technology to accelerate their own needs and goals.
PowerEdge Support and Performance
The AMD Instinct MI100 GPU will be best powered by the PowerEdge R7525, which can currently support 3 MI100s. The R7525 with MI100 is the only platform with PCIe Gen4 capability, making it ideal for HPC workloads. Both the MI100 GPUs and Rome processors have a large number of cores, making them a great fit for related computing workloads like AI/ML/DL. Furthermore, using the PE R7525 to power MI100 GPUs will offer increased memory bandwidth from the support of up to eight memory channels. Overall, customers can expect great SP performance and leading TCO from the AMD MI100.
Multiple benchmarks were performed and observed with MI100 GPUs populated in a PowerEdge R7525 server. The first is the LAMMPS benchmark, which measures the performance and scalability of parallel molecular dynamic simulations. Figure 1 below shows very fast atom- timesteps per second across four datasets that scale mostly linearly as the number of populated MI100 GPUs increase from one to three.
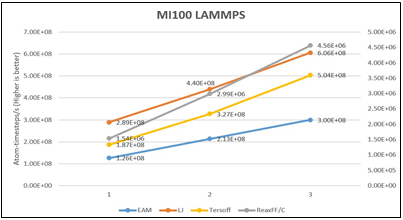
Figure 1 – LAMMPS benchmark performance for 1, 2 and 3 GPUs on four datasets
Figure 2 below highlights the results of the NAMD benchmark; a parallel molecular dynamics system designed to stress the performance and scaling aspects of the MI100 on the R7525. Because NAMD 3.0 does not scale beyond one GPU, three replica simulations were launched on the same server, one on each GPU, in parallel. The ns/day metric represents the number of MD instances that can be completed in a day (higher is better). Additionally, we observe how this data scales across all datasets.
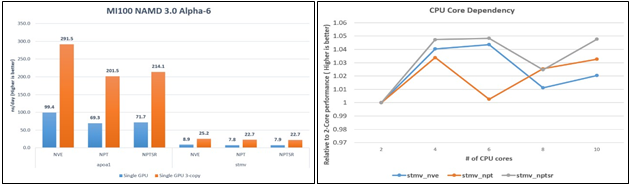
Figure 2 – NAMD benchmark performance Figure 3 – CPU core dependency on NAMD
Lastly, the NAMD CPU Core Dependency line graph in Figure 3 shows the relative performance differences (shown as a multiplier) for a range of CPU cores. We see that for the STMV dataset, the MI100 exhibited an optimum configuration of four CPU cores per GPU.
User Implementation Use Cases
HPC Workloads – Scientific computing simulations are typically so complex that FP64 double-precision models are required to translate the mathematics into accurate numeric models. The AMD Instinct™ MI100 is the first GPU to break the 11TF computing barrier (FP64) at 11.3TFLOPs. When these high speeds are coupled with the high bandwidth memory and I/O capabilities offered, the AMD MI100 GPU powered by the Dell EMC PowerEdge R7525 allows for a giant leap in computing performance; perfect for HPC workloads.
AI Workloads – Artificial Intelligence applications typically require FP32 single-precision models to determine high level features from raw input. The AMD Instinct™ MI100 boasts 3.5x the FP32 performance compared to the previous-gen MI50, and nearly a 7x boost for FP16 performance compared to the MI50. Additionally, new matrix core technology offers superior performance for a full range of mixed precision operations (including BF16, INT4, INT8, FP16, FP32 and FP32 matrices) that provides the capability to work with large models and enhance memory-bound operation performance for all AI system requirements.
Price/Performance – The MI100 GPU has positioned itself for optimal price/performance over maximum performance. Although pricing is volatile, at the time of entry to market the MI100 GPU has a leading price per performance for FP64 and FP16 models when compared to competitors. This increase in price per performance will appeal to price-sensitive customers.
MI100 Specifications
At the heart of AMDs Instinct MI100 GPU is the 1st Gen CDNA (Compute DNA) ‘Arcturus’ architecture, which focuses on computing improvements for HPC and AI server workloads. The number of compute units has effectively double over the previous generation MI50 from 60 to 120. Similarly, the number of stream processors has doubled from 3840 to 7680, allowing for significant increases of FP64 and FP32 performance. At a peak of 11.5 TFLOPS, the FP64 precision model has gained up to a 75% performance increase over the previous MI50. FP32/FP16 precision models have gained a ~70% performance increase. Furthermore, the MI100 supports 32GB of high-bandwidth memory (HBM2) that enables up to 1.2TB/s memory bandwidth. This is 1.23x higher memory bandwidth over the MI50. See Figure 4 for full details:
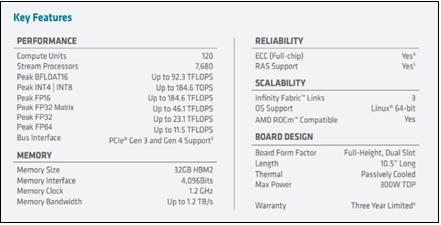
Figure 4 – Official MI100 specifications pulled from the AMD website
New Feature Sets
In addition to the product specification improvements noted above, the AMD MI100 introduces several key new features that will further accelerate HPC and AI workloads:
- New Matrix Core Technology
- FP32 Matrix Core for nearly 3.5x faster HPC & AI workloads vs AMD prior gen
- FP16 Matrix Core for nearly 7x faster AI workloads vs AMD prior gen
- Support for newer ML operators like bfloat16
- Enhanced RAS for consistent performance & uptime while offering remote manageability capabilities
- AMD ROCm™ Open ecosystem maximizes developer flexibility and productivity
Conclusion
The AMD MI100 GPU offers significant performance improvements over the prior-gen MI50, as well as new feature sets that were designed to accelerate HPC and ML workloads. The PowerEdge R7525 configured with MI100 GPUs will be enabled to utilize these new capabilities working in concert with other system components to yield best performance.
For additional information on the MI100, please refer to the Dell Technologies blog HPC Application Performance on Dell EMC PowerEdge R7525 Servers with the AMD MI100 Accelerator

MLPerf Inference v0.7 Benchmarks on Dell EMC PowerEdge R740xd and R640 Servers

Mon, 16 Jan 2023 13:44:22 -0000
|Read Time: 0 minutes
Summary
MLPerf Consortium has released the second round of results v0.7 for its machine learning inference performance benchmark suite. Dell EMC has been participated in this contest in collaboration with several partners and configurations, including inferences with CPU only and with accelerators such as GPU’s and FPGA’s. This blog is focused on the submission results in the closed division/datacenter category for the servers Dell EMC PowerEdge R740xd and PowerEdge R640 with CPU only, in collaboration with Intel® and its Optimized Inference System based on OpenVINO™ 2020.4.
In this DfD we present the MLPerf Inference v0.7 results submission for the servers PowerEdge R740xd and R640 with Intel® processors, using the Intel® Optimized Inference System based on OpenVINO™ 2020.4. Table 1 shows the technical specifications of these systems.
Dell EMC PowerEdge R740xd and R640 Servers
Specs Dell EMC PowerEdge Servers
System Name | PowerEdge R740xd | PowerEdge R640 |
Status | Commercially Available | Commercially Available |
System Type | Data Center | Data Center |
Number of Nodes | 1 | 1 |
Host Processor Model Name | Intel®(R) Xeon(R) Platinum 8280M | Intel®(R) Xeon(R) Gold 6248R |
Host Processors per Node | 2 | 2 |
Host Processor Core Count | 28 | 24 |
Host Processor Frequency | 2.70 GHz | 3.00 GHz |
Host Memory Capacity | 384 GB 1 DPC 2933 MHz | 188 GB |
Host Storage Capacity | 1.59 TB | 200 GB |
Host Storage Type | SATA | SATA |
Accelerators per Node | n/a | n/a |
2nd Generation Intel® Xeon® Scalable Processors
The 2nd Generation Intel® Xeon® Scalable processor family is designed for data center modernization to drive operational efficiencies and higher productivity, leveraged with built-in AI acceleration tools, to provide the seamless performance foundation for data center and edge systems. Table 2 shows the technical specifications for CPU’s Intel® Xeon®.
Intel® Xeon® Processors
Product Collection | Platinum 8280M | Gold 6248R |
# of CPU Cores | 28 | 24 |
# of Threads | 56 | 48 |
Processor Base Frequency | 2.70 GHz | 3.00 GHz |
Max Turbo Speed | 4.00 GHz | 4.00 GHz |
Cache | 38.5 MB | 35.75 MB |
Memory Type | DDR4-2933 | DDR4-2933 |
Maximum memory Speed | 2933 MHz | 2933 MHz |
TDP | 205 W | 205 W |
ECC Memory Supported | Yes | Yes |
Table 2 - Intel Xeon Processors technical specifications
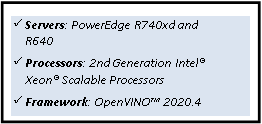
OpenVINO™ Toolkit
The OpenVINO™ toolkit optimizes and runs Deep Learning Neural Network models on Intel® Xeon CPUs. The toolkit consists of three primary components: inference engine, model optimizer, and intermediate representation (IP). The Model Optimizer is used to convert the MLPerf inference benchmark reference implementations from a framework into quantized INT8 models, optimized to run on Intel® architecture.
MLPerf Inference v0.7
The MLPerf inference benchmark measures how fast a system can perform ML inference using a trained model with new data in a variety of deployment scenarios. There are two benchmark suites, one for Datacenter systems and one for Edge as shown below in Table 3 with the list of six mature models included in the official release v0.7 for Datacenter systems category.
Area | Task | Model | Dataset |
Vision | Image classification | Resnet50-v1.5 | ImageNet (224x224) |
Vision | Object detection (large) | SSD-ResNet34 | COCO (1200x1200) |
Vision | Medical image segmentation | 3D UNET | BraTS 2019 (224x224x160) |
Speech | Speech-to-text | RNNT | Librispeech dev-clean (samples < 15 seconds) |
Language | Language processing | BERT | SQuAD v1.1 (max_seq_len=384) |
Commerce | Recommendation | DLRM | 1TB Click Logs |
The above models serve in a variety of critical inference applications or use cases known as “scenarios”, where each scenario requires different metrics, demonstrating production environment performance in the real practice. Below is the description of each scenario in Table 4 and the showing the scenarios required for each Datacenter benchmark.
Offline scenario: represents applications that process the input in batches of data available immediately, and don’t have latency constraint for the metric performance measured as samples per second.
Server scenario: this scenario represents deployment of online applications with random input queries, the metric performance is queries per second (QPS) subject to latency bound. The server scenario is more complicated in terms of latency constraints and input queries generation, this complexity is reflected in the throughput-degradation compared to offline scenario.
Area | Task | Required Scenarios |
Vision | Image classification | Server, Offline |
Vision | Object detection (large) | Server, Offline |
Vision | Medical image segmentation | Offline |
Speech | Speech-to-text | Server, Offline |
Language | Language processing | Server, Offline |
Commerce | Recommendation | Server, Offline |
Results
For MLPerf Inference v0.7, we focused on computer vision applications with the optimized models resnet50- v1.5 and ssd-resnet34 for offline and server scenarios (required for data center category). Figure 1 & Figure 2 show the graphs for Inference results on Dell EMC PowerEdge servers.
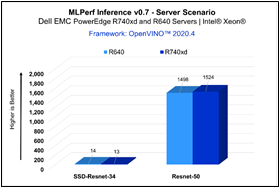
Figure 2 - Server Scenario
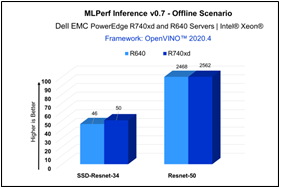
Figure 2 - Offline Scenario
| Resnet-50 | SSD-Resnet-34 | ||
Offline | Server | Offline | Server | |
PowerEdge R740xd | 2562 | 1524 | 50 | 13 |
PowerEdge R640 | 2468 | 1498 | 46 | 14 |
The results above demonstrate consistent inference performance using the 2nd Gen Intel® Xeon Scalable processors on the PowerEdge R640 and PowerEdge R740 platforms. The models Resnet-50 and SSD- Resnet34 are relatively smaller compared to other benchmarks included in the MLPerf Inference v0.7 suite, and customers looking to deploy image classification and object detection inference workloads with Intel CPUs can rely on these servers to meet their requirements, within the target throughput-latency budget.
Conclusion
Dell EMC PowerEdge R740xd and R640 servers with Intel® Xeon® processors and leveraging OpenVINO™ toolkit enables high-performance deep learning inference workloads for data center modernization, bringing efficiency and improved total cost of ownership (TCO).
Citation
@misc{reddi2019mlperf,
title={MLPerf Inference Benchmark},
author={Vijay Janapa Reddi and Christine Cheng and David Kanter and Peter Mattson and Guenther Schmuelling and Carole-Jean Wu and Brian Anderson and Maximilien Breughe and Mark Charlebois and William Chou and Ramesh Chukka and Cody Coleman and Sam Davis and Pan Deng and Greg Diamos and Jared Duke and Dave Fick and J. Scott Gardner and Itay Hubara and Sachin Idgunji and Thomas B. Jablin and Jeff Jiao and Tom St. John and Pankaj Kanwar and David Lee and Jeffery Liao and Anton Lokhmotov and Francisco Massa and Peng Meng and Paulius Micikevicius and Colin Osborne and Gennady Pekhimenko and Arun Tejusve Raghunath Rajan and Dilip Sequeira and Ashish Sirasao and Fei Sun and Hanlin Tang and Michael Thomson and Frank Wei and Ephrem Wu and Lingjie Xu and Koichi Yamada and Bing Yu and George Yuan and Aaron Zhong and Peizhao Zhang and Yuchen Zhou}, year={2019},
eprint={1911.02549}, archivePrefix={arXiv}, primaryClass={cs.LG}
}

NVIDIA A100 GPU Overview
Mon, 16 Jan 2023 13:44:22 -0000
|Read Time: 0 minutes
Summary
The A100 is the next-gen NVIDIA GPU that focuses on accelerating Training, HPC and Inference workloads. The performance gains over the V100, along with various new features, show that this new GPU model has much to offer for server data centers.
This DfD will discuss the general improvements to the A100 GPU with the intention of educating customers on how they can best utilize the technology to accelerate their needs and goals.
PowerEdge Support and Benchmark Performance
The A100 will be most impactful on PCIe Gen4 compatible PowerEdge servers, such as the PowerEdge R7525, which currently supports 2 A100s and will support up to 3 A100s within the first half of 2021. PowerEdge support for the A100
GPU will roll out on different Dell EMC next-gen server platforms over the course of H1 CY21.
Figure 1 – PowerEdge R7525
Benchmarking data comparing performance on various workloads for the A100 and V100 are shown below:
Inference
Figure 2 displays the performance improvement of the A100 over the V100 for two different inference benchmarks – BERT and ResNet-50. The A100 performed 2.5x faster than the V100 on the BERT inference benchmark, and 5x faster on the RN50 inference benchmark. This will translate to significant time reductions spent on inferring trained neural networks to classify and identify known patterns and objects.
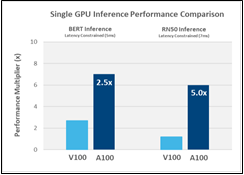
Figure 2 – Inference comparison between A100 and V100 for BERT and RN50 benchmarks
HPC
Figure 3 displays the performance improvement of the A100 over the V100 for four different HPC benchmarks. The A100 performed between 1.4x – 1.9x faster than the V100 for these benchmarks. Users looking to process data and perform complex HPC calculations will benefit from reduced completion times when using the A100 GPU.
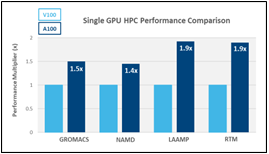
Figure 3 – HPC comparison between A100 and V100 for GROMACS, NAMD, LAAMP and RTM benchmarks
Training
Figure 4 displays the performance improvement of the A100 over the V100 for two different training benchmarks – BERT Training TF32 and BERT Training FP16. The A100 performed 5x faster than the V100 on the BERT TF32 benchmark, and 2.5x faster on the BERT FP16 benchmark. Users looking to swiftly train their neural networks will greatly benefit from the A100 GPUs improved specs, as well as new features (such as TF32), which are further discussed below.
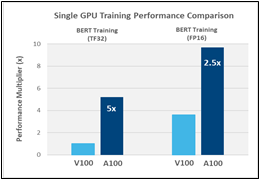
Figure 4 – Training comparison for BERT TF32 and FP16 benchmarks
A100 Specifications
At the heart of NVIDIA’s A100 GPU is the NVIDIA Ampere architecture, which introduces double-precision tensor cores allowing for more than 2x the throughput of the V100 – a significant reduction in simulation run times. The double-precision FP64 performance is 9.7 TFLOPS, and with tensor cores this doubles to 19.5 TFLOPS. The single-precision FP32 performance is 19.5 TFLOPS and with the new Tensor Float (TF) precision this number significantly increases to 156 TFLOPS; ~20x higher than the previous generation V100. TF32 works as a hybrid of FP16 and FP32 math models that uses the same 10-bit precision mantissa as FP16, and 8-bit exponent of FP32, allowing for speedup increases on specific benchmarks.
Furthermore, the A100 supports a massive 40GB of high-bandwidth memory (HBM2) that enables up to 1.6TB/s memory bandwidth. This is 1.7x higher memory bandwidth over the previous generation V100 (see Figure 5).
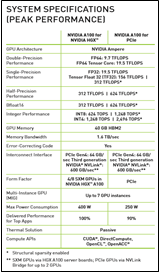
Figure 5 – A100 GPU specs
New Features
In addition to the product specification improvements noted above, the NVIDIA A100 introduces 3 key new features that will further accelerate High-Performance Computing (HPC), Training and Artificial Intelligence (AI) Inference workloads:
- 3rd Generation NVIDIA NVLink™ – The new generation of NVLink™ has 2x GPU-to-GPU throughput over the previous generation V100.
- Multi-Instance GPU (MIG) – This feature enables a single A100 GPU to be partitioned into as many as seven separate GPUs, which benefits cloud users looking to utilize their GPUs for AI inference and data analytics workloads
- Structural Sparsity – This feature supports sparse matrix operations in tensor cores and increases the throughput of tensor core operations by 2x (see Figure 6)
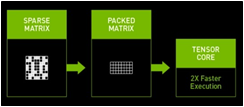
Figure 6 – The A100 introduces sparse matrices to accelerate AI inference tasks
User Implementation
It is important to know how the A100 can accelerate varying HPC, Training and Inference workloads:
HPC Workloads – Scientific computing simulations are typically so complex that FP64 double-precision models are required to translate the mathematics into accurate numeric models. At nearly 20 TFLOPs of double-precision performance, simulation run times are reduced by half with A100 double-precision tensor cores, allowing for 2x the normal FP64 output.
Training Workloads – Learning applications, such as recognition and training, typically require FP32 single-precision models to extract high level features from raw input. This means that the Tensor Float (TF32) computational model is an excellent alternative to FP32 for these types of applications. Running TF32 will grant up to 20x greater performance than the V100, allowing for significant train time reductions. Applications that need higher performance offered by a single server can do so by leveraging efficient scale- out techniques using low latency and high-bandwidth networking supported on the R7525. Additionally, specific training applications will also benefit from an additional 2x in performance with the new sparsity feature enabled.
Inference Workloads – Inference workloads will greatly benefit from the full range of precision models available, including FP32, FP16, INT8 and INT4. The Multi-Instance GPU (MIG) feature allows multiple networks to operate simultaneously on a single GPU so server users can have optimal utilization of compute resources. Structural sparsity support is also ideal for inference and data analytics applications, delivering up to 2x more performance on top of A100’s other inference performance gains.
Conclusion
The NVIDIA A100 GPU offers performance improvements and new feature sets that were designed to accelerate HPC, Training and AI Inference workloads. A server configured with A100 GPUs will be enabled to utilize these capabilities working in concert with other system components to yield best performance.

Understanding the Value of AMDs Socket to Socket Infinity Fabric
Mon, 16 Jan 2023 13:44:23 -0000
|Read Time: 0 minutes
Summary
AMD socket-to-socket Infinity Fabric increases CPU-to-CPU transactional speeds by allowing multiple sockets to communicate directly to one another through these dedicated lanes. This DfD will explain what the socket-to-socket Infinity Fabric interconnect is, how it functions and provides value, as well as how users can gain additional value by dedicating one of the x16 lanes to be used as a PCIe bus for NVMe or GPU use.
Introduction
Prior to socket-to-socket Infinity Fabric (IF) interconnect, CPU-to-CPU communications generally took place on the HyperTransport (HT) bus for AMD platforms. Using this pathway for multi-socket servers worked well during the lifespan of HT, but developing technologies pushed for the development of a solution that would increase data transfer speeds, as well as allow for combo links.
AMD released socket-to-socket Infinity Fabric (also known as xGMI) to resolve these bottlenecks. Having dedicated IF links for direct CPU-to- CPU communications allowed for greater data-transfer speeds, so multi-socket server users could do more work in the same amount of time as before.
How Socket-to-Socket Infinity Fabric Works
IF is the external socket-to-socket interface for 2-socket servers. The architecture used for IF links is a combo of serializer/deserializer (SERDES) that can be both PCIe and xGMI, allowing for sixteen lanes per link and a lot of platform flexibility. xGMI2 is the current generation available and it has speeds that reach up to 18Gbps; which is faster than the PCIe Gen4 speed of 16Gbps. Two CPUs can be supported by these IF links. Each IF lane connects from one CPU IO die to the next, and they are interwoven in a similar fashion, directly connecting the CPUs to one- another. Most dual-socket servers have three to four IF links dedicated for CPU connections. Figure 1 depicts a high- level illustration of how socket to socket IF links connect across CPUs.
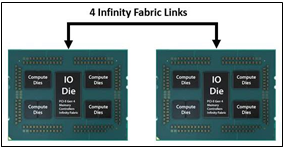
Figure 1 – 4 socket to socket IF links connect two CPUs
The Value of Infinity Fabric Interconnect
Socket to socket IF interconnect creates several advantages for PowerEdge customers:
- Dedicated IF lanes are routed directly from one CPU to the other CPU, ensuring inter-socket communications travel the shortest distance possible
- xGMI2 speeds (18Gbps) exceed the speeds of PCIe Gen4, allowing for extremely fast inter-socket data transfer speeds
Furthermore, if customers require additional PCIe lanes for peripheral components, such as NVMe or GPU drives, one of the four IF links are a cable with a connector that can be repurposed as a PCIe lane. AMD’s highly optimized and flexible link topologies enable sixteen lanes per socket of Infinity Fabric to be repurposed. This means that 2S AMD servers, such as the PowerEdge R7525, have thirty-two additional lanes giving a total of 160 PCIe lanes for peripherals. Figure 2 below illustrates what this would look like:
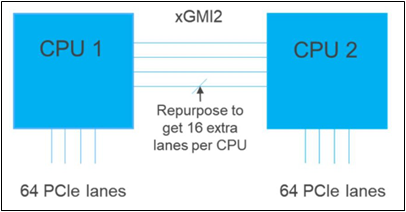
Figure 2 – Diagram showing additional PCIe lanes available in a 2S configuration
Conclusion
AMDs socket-to-socket Infinity Fabric interconnect replaced the former HyperTransport interconnect in order to allow massive amounts of data to travel fast enough to avoid speed bottlenecks. Furthermore, customers needing additional PCIe lanes can repurpose one of the four IF links for peripheral support. These advantages allow AMD PowerEdge servers, such as the R7525, to meet our server customer needs.

Dell Technologies Focuses on Standardizing EDSFF Form Factor for Future Servers
Mon, 16 Jan 2023 13:44:23 -0000
|Read Time: 0 minutes
Summary
As new technologies have developed over time, server adoption has broadened into a wide spectrum of new environments that dictate more efficient flash drive packaging. While the 2.5” SSD form factor retains its value for many applications, these emerging domains have driven the development of a new standard – EDSFF. This DfD will explain why the EDSFF family of form factors was designed, what the specific design of each drive form factor targets, and how EDSFF resolve challenges faced within the server industry.
Addressing Modern Industry Requirements
Server adoption has greatly expanded over the last decade and many of these new environments are very challenging from a density standpoint and space (size) perspective. Data centers and smaller distributed edge deployments call for specific enhancements to the current ubiquitous storage device form factor for SSDs, such as the 2.5”, U.2 NVMe SSD. This isn’t to say that the existing U.2 form factor is outlived, as it has earned its reputation as the industry standard for a reason, but rather that server technology is advancing at a rapid pace and we must ensure that new flash storage form factors are being developed to address future enterprise architectural requirements.
The Enterprise Datacenter Small Form Factor (EDSFF), or E3 family of form factors, was designed to accommodate future enterprise needs and requirements to address the below challenges:
- Signal Integrity (SI) - A new form factor must be able to support next generation high frequency interfaces. The connector system must support PCIe Gen 5 and PCIe Gen 6, and ideally would support interfaces beyond PCIe Gen 6.
- Multiple Device Types - A new form factor would ideally support multiple device types. These device types include NAND based SSDs, CXL storage class memory (SCM), computational storage devices, low end accelerators, and front facing I/O devices.
- Link Width - A new form factor must be able to support multiple host connection link widths. Different device types will require different link widths including PCIe x2, PCIe x4, PCIe x8, and PCIe x16 connections.
- Size - The size of a new form factor should work well in both 1U and 2U platforms. The size must be large enough to work with multiple device types, but not so large that it breaks traditional server architectures. The size should also be large enough to accommodate high performance NAND controllers, but not so large that it limits the total number of supported devices.
- Power - A new form factor must support a reasonable range of power envelopes. For NAND based SSDs, 25W is required to saturate a PCIe Gen4 x4 link. For low end accelerators a minimum of 70W is required. It should be able to scale to higher power devices that may be required in the future.
- Thermal - A new form factor must provide significant thermal benefit over previous form factors.
E3 Family of Form Factors
The E3 family of devices currently consists of four different form factors that are defined by a group of SNIA Small Form Factor (SFF) specifications. The SFF specifications that define the E3 family include:
- SFF-TA-1002 Protocol Agnostic Multi-Lane High Speed Connector
- SFF-TA-1008 Enterprise and Datacenter Device Form Factor
- SFF-TA-1009 Enterprise and Datacenter SSD Pin and Signal Specification
- SFF-TA-1023 Thermal Requirements for Enterprise and Datacenter Form Factors
The E3 family of devices also supports dual port which is an important feature for high availability storage applications. Figure 1 below shows a 3D view of the E3 form factors and describes each device variant in detail, from right to left:
- E3 Short Thin (E3.S) - This form factor is well suited for NAND based SSDs with a x4, x8 and x16 PCIe link width. This will be the primary form factor for server storage subsystems as it can be used across a wide variety of platforms including modular and short depth chassis.
- E3 Short Thick (E3.S 2T) - This form factor is well suited for SCM or front I/O implementations and may support either a x4, x8, or a x16 PCIe link width. *Note that one 2T (thick) device will fit in two thin slots.
- E3 Long Thin (E3.L) - This form factor is well suited for high capacity NAND based SSDs or SCM devices and may support either a x4, x8, or a x16 PCIe link width. This will be the primary form factor for storage subsystems and server platforms that support a deeper chassis.
- E3 Long Thick (E3.L 2T) - This form factor is well suited for FPGAs or accelerators and may support either a x4, x8, or a x16 PCIe link width.
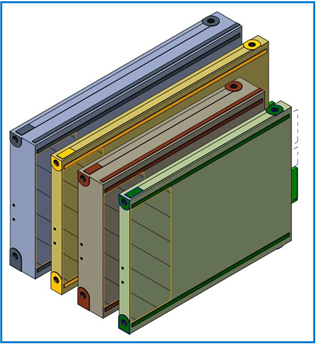
Figure 1 – The E3 family of form factors (from right to left): E3.S, E3.S 2T, E3.L, E3.L 2T
Figure 2 identifies some of the mechanical characteristics of each E3 form factor:
Device Variation | Height | Length | Width | Recommended Max Power |
E3.S | 76mm | 112.75mm | 7.5mm | 25W |
E3.S 2T | 76mm | 112.75mm | 16.8mm | 40W |
E3.L | 76mm | 142.2mm | 7.5mm | 40W |
E3.L 2T | 76mm | 142.2mm | 16.8mm | 70W |
Figure 2 – Height, length, width and recommended max power of each E3 form factor
System Design
System designers and platform architects will have more flexibility to control how the storage subsystem is constructed. Space at the front of the server can be divided and utilized more effectively because there are four unique form factors to choose from. However, most server users will likely adopt the E3.S/E3.S 2T form factors as they are compatible with the more common short-depth chassis.
The E3.S should support half of the NAND capacity of a U.2 SSD, and the E3.L should have equal NAND capacity to a U.2 SSD. This means system designers have the freedom to choose between equal capacities and nearly double the performance with a fully loaded E3.S design (Figure 3) or double the capacity and performance with a fully loaded E3.L design (Figure 4).
Figure 3 – 1U chassis with 20 front loading E3.S or E3.L thin devices
Figure 4 – 2U chassis with 44 front loading E3.S or E3.L thin devices
Furthermore, several platform challenges have been targeted with the E3 family. One challenge is the increasing amount of platform power consumed through modern CPUs, memory and GPUs. This rise in power consumption translates to a higher thermal output, which can be countered by creating effective airflow pathways for optimal cooling. A second challenge to account for is the changing role of the server storage subsystem. Future server architectures will share front-end server space, which was traditionally dedicated to storage drives, with a multitude of devices such as NVMe NAND SSDs, CXL SCM devices, accelerators, computational storage devices and front facing I/O devices. The fact that the E3 family can support multiple mechanical sizes, host link widths, and power profiles with a family of interchangeable form factors makes it an ideal choice for supporting multiple system use cases. See Figure 5 and Figure 6 below:
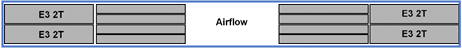
Figure 5 – Illustration of a 1U system supporting four alternate device types and eight SSD slots, while still providing enough airflow for optimal cooling
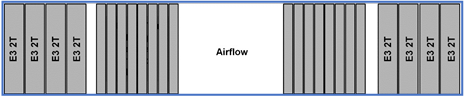
Figure 6 – Illustration of a 2U system supporting eight alternate device types and sixteen SSD slots, while still providing enough airflow for optimal cooling
Providing Value to PowerEdge Platforms
Dell Technologies is driving the adoption and standardization of the E3 family to address specific design challenges PowerEdge platforms are expected to encounter in the future:
- Increasing System Thermals - As total platform power continues to increase with the advancement of server technology the E3 form factor provides a systematic approach to platform thermal characterization as defined by the SFF-TA-1023 thermal requirements specification.
- Decreasing Physical Volume - Systems that have limited space, such as modular systems, mini- racks, and Edge platforms, have more options to better utilize the limited physical space using E3 devices.
- Higher Storage Density - Higher system storage densities can be achieved by using the denser and more efficient E3 form factors.
Conclusion
Dell Technologies is focused on standardizing the E3 family of form factors to better accommodate future technologies for optimized server solutions. Although the 2.5” U.2 flash SSD form factor is still the universal, ubiquitous form factor for most PowerEdge platforms today, the E3 family accommodates for future emerging environments by optimizing system thermals, better utilizing limited design space and increasing storage density. Furthermore, it will be compatible with PCIe Gen 5 & 6, support multiple device types and link widths, and contain various form factors that will work well in both 1U and 2U platforms.
To learn more about this Kioxia proof of concept, read the Kioxia article below:
KIOXIA Demonstrates New EDSFF SSD Form Factor Purpose-Built for Servers and Storage

Analyzing How Gen4 NVMe Drive Performance Scales on the PowerEdge R7525
Mon, 16 Jan 2023 13:44:23 -0000
|Read Time: 0 minutes
Summary
Gen4 NVMe drives double the PCIe speeds of Gen3 from 1GB/s to 2GB/s per lane, effectively increasing the performance capability by two times. However, users also need to understand how Gen4 NVMe performance scales when more than one drive is loaded into a populated server running workloads. This DfD will analyze how various IO profiles scale when more than one Gen4 NVMe drive is loaded into a PowerEdge R7525.
PCIe 4.0 History and Gen4 NVMe Scaling
PCIe 4.0 was released in 2019, following its predecessor with double the bandwidth (up to 64GB/s), bit rate (up to 16GT/s) and frequency (up to 16GHz). AMD released the first motherboards to support PCIe
4.0 in early 2020, while Intel motherboards with PCIe 4.0 support are scheduled to begin releasing by the end of 2020. Gen4 NVMe drives were introduced shortly after the release of PCIe 4.0 to capitalize on its specification improvements; allowing performance metrics to double (if the same number of lanes are used).
Although these numbers look enticing at first glance, very little data has been gathered around how Gen4 NVMe drives perform when scaled in a datacenter server running workloads. What is the sweet spot? When does the performance curve begin to plateau? The Dell Technologies engineering team constructed an in-house test setup to obtain data points that will help users understand IOPS and bandwidth trends when scaling Gen4 NVMe drives.
Test Setup
The PowerEdge R7525 was used as the host server, as it s one of the first Dell EMC servers to support PCIe 4.0.
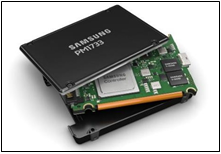
Figure 1 - Samsung PM1733 Gen4 NVMe
The Samsung PM1733 Gen4 NVMe drive was connected using CPU direct attach and then scaled. Measurements were taken for 1, 2, 4, 8, 12 and 24 drives. The IOmeter benchmark was used to simulate data center workloads running on NVMe drives to achieve the maximum raw performance data. FIO was used as a supplemental benchmark as well. *Note that these benchmark results are not directly applicable to file systems or application workloads.
Random reads (RR) and writes (RW) were measured in Input/Output operations per second (IOPS). Online Transaction Processing (OLTP), useful for measuring database workloads, is also measured in IOPS. Sequential reads (SR) and writes (SW) were measured in mebibyte per second (MiBPs).
Test Results
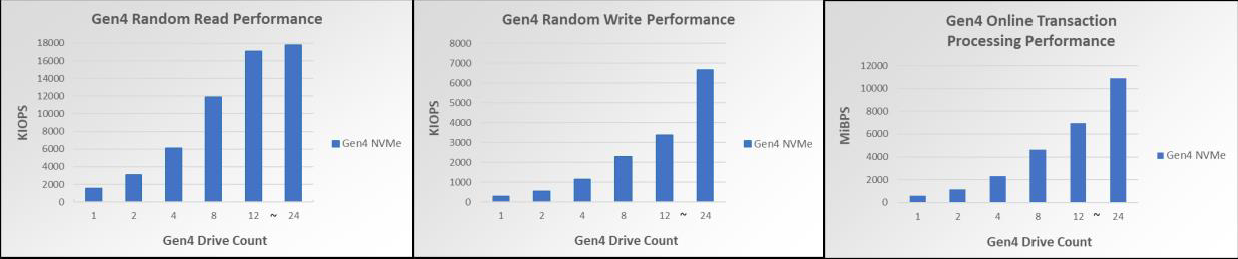
Figure 2 – Gen4 NVMe RR perf scaling for up to 24 drives Figure 3 –Gen4 NVMe RW perf scaling for up to 24 drives Figure 4 – Gen4 NVMe OLTP perf scaling per drive for up to 24 drives
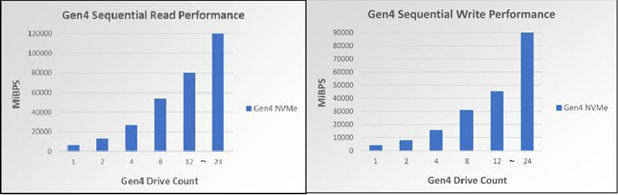
Figure 5 –Gen4 NVMe SR perf scaling for up to 24 drives Figure 6 –Gen4 NVMe SW perf scaling for up to 24 drives
As seen in Figures 2-6, the Gen4 NVMe drives have remarkable performance. One Gen3 NVMe drive commonly has 4K RR performance in the triple-digit KIOPS, but one Gen4 NVMe drive is within the quad-digit KIOPS for 4K RR. Scaling to 12 Gen4 NVMe drives shows 17M 4KiB RR IOPS, allowing for extraordinary amounts of data to be read randomly from the disk at one time. Scaling to 12 Gen4 NVMe drives also has a notable 80.41GiBs at 128KiB, a number very close to the theoretical maximum line rate of 94.5 128K SR GBPS. Lastly, 4K OLTP benchmark speeds are also nearly 2 times faster than Gen3 NVMe drives.
Furthermore, these bar graphs demonstrate that each profile scales linearly for up to 12 drives. The benchmarked synthetic workloads received linear performance improvements with up to 12 NVMe drives scaled, and each performance readout also scaled very closely to its theoretical maximum. However, once the jump from 12 to 24 drives is made, two of the IO profiles (in particular, the RR and SR profiles) stop scaling linearly and become less optimized. When accounting for the fact CPU utilization is at 90%, it is to be expected that scaling beyond 12 drives will not give linear performance increases for all IO profiles.
Conclusion
Customers seeking to scale their Gen4 NVMe drives will be pleased to know that all IO Profile performance readings scaled linearly for up to 12 drives, while only some of the IO Profiles did for up to 24 drives. Servers and systems running workloads like data analytics, AI, ML, DL and databases can greatly benefit from this increase in IOPS and throughput when scaling Gen4 NVMe devices for up to 12 drives.

Dell EMC PowerEdge R940xa Server is the Leader in Price/Performance for SQL Server 2019
Mon, 16 Jan 2023 13:44:24 -0000
|Read Time: 0 minutes
Summary
The Transaction Processing Performance Council (TPC) published that the Dell EMC PE R940xa is the leader in Price per Performance for SQL Server 2019 in the 4S and 10TB category.1 This DfD will educate readers of what this means, and why this is so important for today’s compute intensive workloads.
Leader in Price/Performance
The Dell EMC PowerEdge R940xa 4 socket (4S) server ranked #1 in price/performance in the 10TB SQL Server category, as published by the Transaction Processing Performance Council (TPC). The analysis showed that the PowerEdge R940xa delivered $0.67 USD per query-per-hour for a 10TB SQL Server 2019 database in a non-clustered environment. This metric was computed by dividing the R940xa server price by the TPC-H Composite Query-per-Hour (QphH) performance. 1
The PowerEdge R940xa delivers these results with powerful performance from the combination of four CPUs and four GPUs to drive database acceleration at a competitive price point. This performance is ideal for compute-intensive workloads like SQL Server and allows users to scale business-critical workloads with:
• Up to four 2nd Generation Intel Xeon Scalable processors and up to 112 processing cores
• Up to four double-width GPUs or up to four double-width or eight single-width FPGAs to accelerate workloads
• Up to 48 DIMMs (24 of which can be DCPMMs) and up to 15.36TB of memory for large data sets
• 32 2.5” HDDs/SSDs, including four NVME drives
• Up to 12 PCIe slots for external connections
Impact to Server Users
This superior price per performance means that PowerEdge R940xa server users have optimized returns per dollar for compute-intensive workloads. Datacenter owners can also reinvest their financial savings into alternative segments to achieve their desired goals.
*To see the official TPC website results please click here.

MLPerf Inference v0.7 Benchmarks on Dell EMC PowerEdge R740xd with Xilinx FPGA
Mon, 16 Jan 2023 13:44:24 -0000
|Read Time: 0 minutes
Summary
MLPerf Consortium has released the second round of results v0.7 for its machine learning inference performance benchmark suite. Dell EMC has been participated in this contest in collaboration with several partners and configurations, including inferences with CPU only and with accelerators such as GPU’s and FPGA’s. This blog is focused on the submission results in the open division/datacenter & open division/edge category for the server Dell EMC Power Edge R740xd with Xilinx FPGA, in collaboration with Xilinx.
Introduction
Last week the MLPerf organization released its latest round of machine learning (ML) inference benchmark results. Launched in 2018, MLPerf is made up of an open-source community of over 23 submitting organizations with the mission to define a suite of standardized ML benchmarks. The group’s ML inference benchmarks provide an agreed upon process for measuring how quickly and efficiently different types of accelerators and systems can execute trained neural networks.
This marked the first time Xilinx has directly participated in MLPerf. While there’s a level of gratification in just being in the game, we’re excited to have achieved a leadership result in an image classification category. We collaborated with Mipsology for our submissions in the more rigid “closed” division, where vendors receive pre-trained networks and pre-trained weights for true “apples-to-apples” testing.
The test system used our Alveo U250 accelerator card based on a domain-specific architecture (DSA) optimized by Mipsology. The benchmark measures how efficiently our Alveo-based custom DSA can execute image classification tasks based on the ResNet-50 benchmark with 5,011 image/second in offline mode. ResNet-50 measures image classification performance in images/seconds.
We achieved the highest performance / peak TOP/s (trillions of operations per second). It’s a measure of performance efficiency that essentially means, given a X amount of peak compute in hardware, we delivered the highest throughput performance.
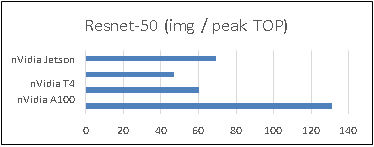
Figure 1: Performance Comparison
The MLPerf results also showed that we achieved 100% of the available TOP/s compared to our published data sheet performance. This impressive result showcases how raw peak TOP/s on paper are not always the best indicator of real-world performance. Our device architectures deliver higher efficiencies (effective TOP/s versus Peak TOP/s) for AI applications. Most vendors on the market are only able to deliver a fraction of their peak TOPS, often maxing out at 40% efficient. Our leadership result was also achieved while maintaining TensorFlow and Pytorch framework programmability without requiring users’ have hardware expertise.
Specs Server Dell EMC Power Edge R740xd
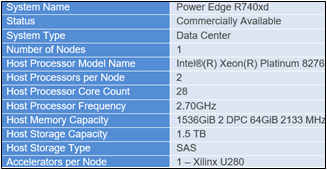
Figure 2: Server Configuration Details
Xilinx VCK5000
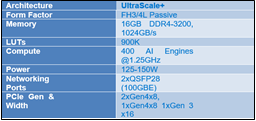
Figure 3: Xilinx VCK5000 Details
Xilinx U280 Accelerator
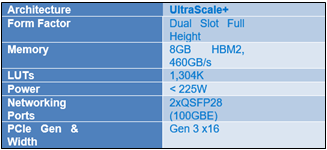
Figure 4: Xilinx FPGA Details
Vitis AI
The Vitis™ AI development environment is Xilinx’s development platform for AI inference on Xilinx hardware platforms, including both edge devices and Alveo cards. It consists of optimized IP, tools, libraries, models, and example designs. It is designed with high efficiency and ease of use in mind, unleashing the full potential of AI acceleration on Xilinx FPGA and ACAP.
MLPerf Inference v0.7
The MLPerf inference benchmark measures how fast a system can performs ML inference using a trained model with new data in a variety of deployment scenarios, see Table 1 with the list of seven mature models included in the official release v0.7
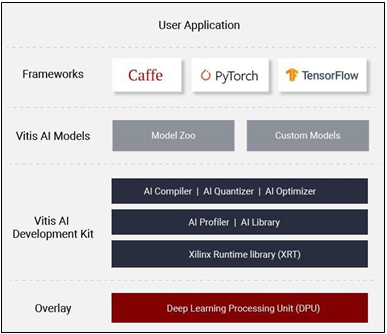
Figure 5: Xilinx Vitis AI stack
Model | Reference Application | Dataset |
resnet50-v1.5 | vision / classification and detection | ImageNet (224x224) |
ssd-mobilenet 300x300 | vision / classification and detection | COCO (300x300) |
ssd-resnet34 1200x1200 | vision / classification and detection | COCO (1200x1200) |
bert | language | squad-1.1 |
dlrm | recommendation | Criteo Terabyte |
3d-unet | vision/medical imaging | BraTS 2019 |
rnnt | speech recognition | OpenSLR LibriSpeech Corpus |
Table 1 : Inference Suite v0.7
The above models serve in a variety of critical inference applications or use cases known as “scenarios”, each scenario requires different metrics, demonstrating production environment performance in the real practice. MLPerf Inference consists of four evaluation scenarios: single-stream, multistream, server, and offline.
Scenario | Example Use Case | Throughput |
SingleStream | cell phone augmented vision | Latency in milliseconds |
MultiStream | multiple camera driving assistance | Number of Streams |
Server | translation site | QPS |
Offline | photo sorting | Inputs/second |
Results
Figure 6 and 7 below show the graphs with the inference results submitted for Xilinx VCK5000 and Xilinx U280 FPGA on Dell EMC PowerEdge R740xd:
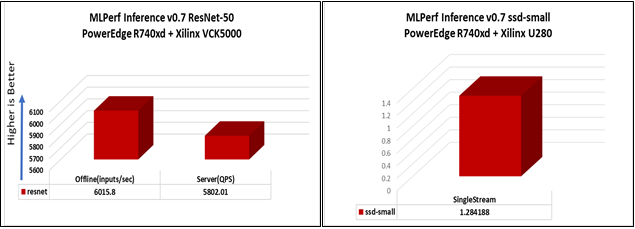
Figure 6: ResNet-50 Benchmark Figure 7: SSD-Small benchmark
Offline scenario: represents applications that process the input in batches of data available immediately, and don’t have latency constraint for the metric performance measured as samples per second.
Server scenario: this scenario represents deployment of online applications with random input queries, the metric performance is queries per second (QPS) subject to latency bound. The server scenario is more complicated in terms of latency constraints and input queries generation, this complexity is reflected in the throughput-degradation compared to offline scenario.
Conclusion
This was a milestone in terms of showcasing where FPGAs as accelerators can be used and optimized for Machine learning. It demonstrates the close partnership that Dell Technologies & Xilinx have established in exploring FPGA applications in the field of Machine learning.
Citation
@misc{reddi2019mlperf,
title={MLPerf Inference Benchmark},
author={Vijay Janapa Reddi and Christine Cheng and David Kanter and Peter Mattson and Guenther Schmuelling and Carole-Jean Wu and Brian Anderson and Maximilien Breughe and Mark Charlebois and William Chou and Ramesh Chukka and Cody Coleman and Sam Davis and Pan Deng and Greg Diamos and Jared Duke and Dave Fick and J. Scott Gardner and Itay Hubara and Sachin Idgunji and Thomas
B. Jablin and Jeff Jiao and Tom St. John and Pankaj Kanwar and David Lee and Jeffery Liao and Anton Lokhmotov and Francisco Massa and Peng Meng and Paulius Micikevicius and Colin Osborne and Gennady Pekhimenko and Arun Tejusve Raghunath Rajan and Dilip Sequeira and Ashish Sirasao and Fei Sun and Hanlin Tang and Michael Thomson and Frank Wei and Ephrem Wu and Lingjie Xu and Koichi Yamada and Bing Yu and George Yuan and Aaron Zhong and Peizhao Zhang and Yuchen Zhou}, year={2019},
eprint={1911.02549}, archivePrefix={arXiv}, primaryClass={cs.LG}

Efficient Machine Learning Inference on Dell EMC PowerEdge R7525 and R7515 Servers using NVIDIA GPUs
Mon, 16 Jan 2023 13:44:24 -0000
|Read Time: 0 minutes
Summary
Dell EMC™ participated in the MLPerf™ Consortium v0.7 result submissions for machine learning. This DfD presents results for two AMD PowerEdge™ server platforms - the R7515 and R7525. The results show that Dell EMC with AMD processor-based servers when paired with various NVIDIA GPUs offer industry-leading inference performance capability and flexibility required to match the compute requirements for AI workloads.
MLPerf Inference Benchmarks
The MLPerf (https://mlperf.org) Inference is a benchmark suite for measuring how fast Machine Learning (ML) and Deep Learning (DL) systems can process inputs and produce results using a trained model. The benchmarks belong to a very diversified set of ML use cases that are popular in the industry and provide a need for competitive hardware to perform ML-specific tasks. Hence, good performance under these benchmarks signifies a hardware setup that is well optimized for real world ML inferencing use cases. The second iteration of the suite (v0.7) has evolved to represent relevant industry use cases in the datacenter and edge. Users can compare overall system performance in AI use cases of natural language processing, medical imaging, recommendation systems and speech recognition as well as different use cases in computer vision.
MLPerf Inference v0.7
The MLPerf inference benchmark measures how fast a system can perform ML inference using a trained model with new data in a variety of deployment scenarios, see below Table 1 with the list of seven mature models included in the official v0.7 release:
Model | Reference Application | Dataset |
resnet50-v1.5 | vision / classification and detection | ImageNet (224x224) |
ssd-mobilenet 300x300 | vision / classification and detection | COCO (300x300) |
ssd-resnet34 1200x1200 | vision / classification and detection | COCO (1200x1200) |
bert | language | squad-1.1 |
dlrm | recommendation | Criteo Terabyte |
3d-unet | vision/medical imaging | BraTS 2019 |
rnnt | speech recognition | OpenSLR LibriSpeech Corpus |
The above models serve in a variety of critical inference applications or use cases known as “scenarios”. Each scenario requires different metrics, demonstrating production environment performance in real practice. MLPerf Inference consists of four evaluation scenarios: single-stream, multi-stream, server, and offline. See Table 2 below:
Scenario | Sample Use Case | Metrics |
SingleStream | Cell phone augmented reality | Latency in milliseconds |
MultiStream | Multiple camera driving assistance | Number of streams |
Server | Translation site | QPS |
Offline | Photo sorting | Inputs/second |
Executing Inference Workloads on Dell EMC PowerEdge
The PowerEdge™ R7515 and R7525 coupled with NVIDIA GPus were chosen for inference performance benchmarking because they support the precisions and capabilities required for demanding nference workloads.
Dell EMC PowerEdge™ R7515
The Dell EMC PowerEdge R7515 is a 2U, AMD-powered server that supports a single 2nd generation AMD EPYC (ROME) processor with up to 64 cores in a single socket. With 8x memory channels, it also features 16x memory module slots for a potential of 2TB using 128GB memory modules in all 16 slots. Also supported are 3-Dimensional Stack DIMMs, or 3-DS DIMMs.
SATA, SAS and NVMe drives are supported on this chassis. There are some storage options to choose from depending on the workload. Chassis configurations include:
- 8 x 3.5-inch hot plug SATA/SAS drives (HDD)
- 12 x 3.5-inch hot plug SATA/SAS drives (HDD)
- 24 x 2.5-inch hot plug SATA/SAS/NVMe drives
The R7515 is a general-purpose platform capable of handling demanding workloads and applications, such as data warehouses, ecommerce, databases, and high-performance computing (HPC). Also, the server provides extraordinary storage capacity options, making it well-suited for data-intensive applications without sacrificing I/O performance. The R7515 benchmark configuration used in testing can be seen in Table 3.
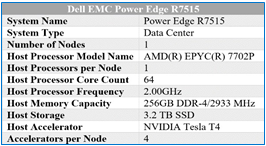
Table 3 – R7515 benchmarking configuration
Dell EMC PowerEdge™ R7525
The The Dell EMC PowerEdge R7525 is a 2-socket, 2U rack-based server that is designed to run complex workloads using highly scalable memory, I/O capacity, and network options. The system is based on the 2nd Gen AMD EPYC processor (up to 64 cores), has up to 32 DIMMs, PCI Express (PCIe) 4.0-enabled expansion slots, and supports up to three double wide 300W or six single wide 75W accelerators.
SATA, SAS and NVMe drives are supported on this chassis. There are some storage options to choose from depending on the workload. Storage configurations include:
- Front Bays
- Up to 24 x 2.5” NVMe
- Up to 16 x 2.5” SAS/SATA (SSD/HDD) and NVMe
- Up to 12 x 3.5” SAS/SATA (HDD)
- Up to 2 x 2.5” SAS/SATA/NVMe (HDD/SSD)
- Rear Bays
- Up to 2 x 2.5” SAS/SATA/NVMe (HDD/SSD)
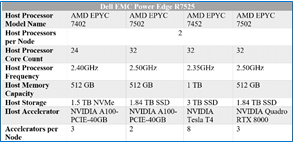
Table 4 – R7525 benchmarking configuration
The R7525 is a highly adaptable and powerful platform capable of handling a variety of demanding workloads while also providing flexibility. The R7525 benchmark configuration used in testing can be seen in Table 4.
NVIDIA Technologies Used for Efficient Inference
NVIDIA® Tesla T4
The NVIDIA Tesla T4, based on NVIDIA’s Turing™ architecture is one of the most widely used AI inference accelerators. The Tesla T4 features NVIDIA Turing Tensor cores which enables it to accelerate all types of neural networks for images, speech, translation, and recommender systems, to name a few. Tesla T4 is supported by a wide variety of precisions and accelerates all major DL & ML frameworks, including TensorFlow, PyTorch, MXNet, Chainer, and Caffe2.
For more details on NVIDIA Tesla T4, please refer to https://www.nvidia.com/en-us/data-center/tesla-t4/
NVIDIA® Quadro RTX8000
NVIDIA® Quadro® RTX™ 8000, powered by the NVIDIA Turing™ architecture and the NVIDIA RTX platform, combines unparalleled performance and memory capacity to deliver the world’s most powerful graphics card solution for professional workflows. With 48 GB of GDDR6 memory, the NVIDIA Quadro RTX 8000 is designed to work with memory intensive workloads that create complex models, build massive architectural datasets and visualize immense data science workloads.
For more details on NVIDIA® Quadro® RTX™ 8000, please refer to https://www.nvidia.com/en-us/design- visualization/quadro/rtx-8000/
NVIDIA® A100-PCIE
The NVIDIA A100 Tensor Core GPU is the flagship product of the NVIDIA data center platform for deep learning, HPC, and data analytics. The platform accelerates over 700 HPC applications and every major deep learning framework. It’s available everywhere, from desktops to servers to cloud services, delivering both dramatic performance gains and cost-saving opportunities.
For more details, please refer to https://www.nvidia.com/en-us/data-center/a100/
NVIDIA Inference Software Stack for GPUs
At its core, NVIDIA TensorRTTM is a C++ library designed to optimize deep learning inference performance on systems which contains NVIDIA GPUs, and supports models that are trained in most of the major deep learning frameworks including, but not limited to, TensorFlow, Caffe, PyTorch, MXNet. After the neural network is trained, TensorRT enables the network to be compressed, optimized and deployed as a runtime without the overhead of a framework. It supports FP32, FP16 and INT8 precisions. To optimize the model, TensorRT builds an inference engine out of the trained model by analyzing the layers of the model and eliminating layers whose output is not used, or combining operations to perform faster calculations. The result of all these optimizations is improved latency, throughput and efficiency. TensorRT is available on NVIDIA NGC.
MLPerf v0.7 Performance Results and Key Takeaways
Figures 1 and 2 below show the inference capabilities of the PowerEdge R7515 and PowerEdge R7525 configured with different NVIDIA GPUs. Each bar graph indicates the relative performance of inference operations completed meeting certain latency constraints. Therefore, the higher the bar graph is, the higher the inference capability of the platform. Details on the different scenarios used in MLPerf inference tests (server and offline) are available at the MLPerf website. Offline scenario represents use cases where inference is done as a batch job (using AI for photo sorting), while server scenario represents an interactive inference operation (translation app). The relative performance of the different servers are plotted below to show the inference capabilities and flexibility that can be achieved using these platforms:
Offline Performance
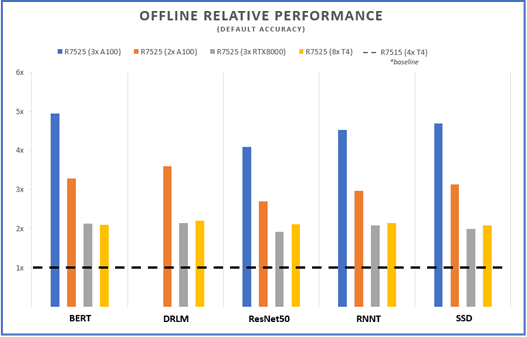
Figure 1 – Offline scenario relative performance for five different benchmarks and four different server configs, using the R7515 (4 xT4) as a baseline
Server Performance
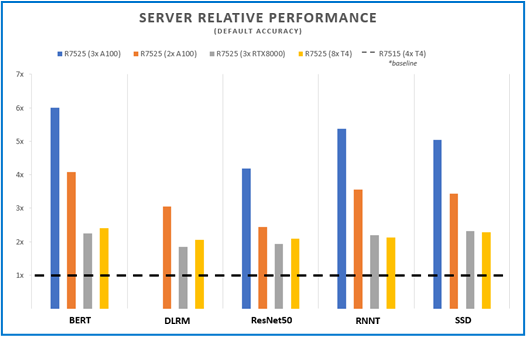
Figure 2 – Server scenario relative performance for five different benchmarks and four different server configs, using the R7515 (4 xT4) as a baseline
The R7515 and R7525 offers configuration flexibility to address inference performance and datacenter requirements around power and costs. Inference applications can be deployed on AMD single socket system without compromising accelerator support, storage and I/O capacities or on double socket systems with configurations that support higher capabilities. Both platforms support PCIe Gen4 links for latest GPU offerings like the A100 and also upcoming Radeon Instinct MI100 GPUs from AMD that are PCIe Gen 4 capable.
The Dell PowerEdge platforms offer a variety of PCIe riser options that enable support for multiple low- profile (up to 8 T4) or up to 3 full height double wide GPU accelerators (RTX or A100). Customers can choose the GPU model and number of GPUs based on the workload requirements and to fit their datacenter power and density needs. Figure 3 shows a relative compare of the GPUs used in the MLPerf study from a performance, power, price and memory point of view. The specs for the different GPUs supported on Dell platforms and server recommendations are covered in previous DfDs (link to the 2 papers)
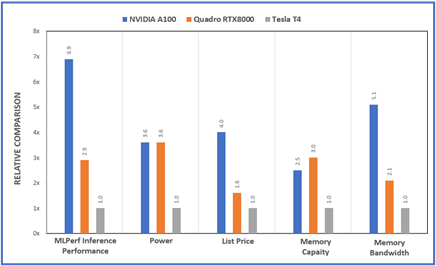
Figure 3 – Relative comparisons between the A100, RTX800 and T4 GPUs for various metrics
Conclusion
As demonstrated by MLPerf performance, Inference workloads executed on Dell EMC PowerEdge R7515 and Dell EMC PowerEdge R7525 performed well in a wide range of benchmark scenarios. . These results can server a guide to help identify the configuration that matches your inference requirements.

Dell EMC PowerEdge Boot Optimized Storage Solution – BOSS-S2

Mon, 16 Jan 2023 13:44:24 -0000
|Read Time: 0 minutes
Summary
Our 2nd generation SATA HW RAID BOSS solution (BOSS- S2) was enhanced to provide critical RAS features that include the rear facing drives on our new rack servers, so a server does not need to be taken offline in case of a SSD failure and full hot-plug support for our Enterprise class M.2 SATA SSDs. When operating a RAID 1 mirror, a surprise removal and addition of a new SSD will automatically kickoff a rebuild on the new RAID 1 member SSD that was added without ever having to halt the operations. Available on PowerEdge YX5X systems, BOSS-S2 is a robust, redundant, low-cost solution for boot optimization.
Introduction
New for Dell EMC PowerEdge R6525 & R7525 and future servers, the Boot Optimized Storage Solution (BOSS-S2) provides key, generational feature improvements to the existing value proposition and highly popular BOSS-S1. BOSS was originally designed to provide a highly reliable, cost effective solution for segregating operating system boot drives from data on server-internal storage. Many customers, particularly those in the Hyper-Converged Infrastructure (HCI) arena and those implementing Software Defined Storage (SDS), require separating their OS drives from data drives, and require hardware RAID mirroring (RAID 1) for their OS drives. The main motivation for this is to create a server configuration optimized for application data. Providing a separate, redundant disk solution for the OS enables a more robust and optimized compute platform.
The Boot Optimized Storage Solution (BOSS-S2) is a simple, highly reliable and cost-effective solution to meet the requirements of our customers. The M.2 devices offer the same performance as 2.5” SSDs and support rear facing drive accessibility with full hot-plug support to include Surprise Remove. Our design frees up and maximizes available drive slot for data requirements.
BOSS-S2 also enables a Secure method to update the Firmware and prevents any unauthorized threats to the firmware. The firmware payload is verified using a cryptographic digital signature, offering a secure update. By default, the BOSS-S2 controller state is secure and locked, which is unlocked only during the firmware update process. Following the update, the controller automatically returns to the default, locked state to prevent any unauthorized updates to the firmware.
Managing BOSS-S2 is accomplished with standard, well-known management tools such as iDRAC, OpenManage Systems Administrator (OMSA), and Command Line Interface (CLI).
Key features of BOSS-S2
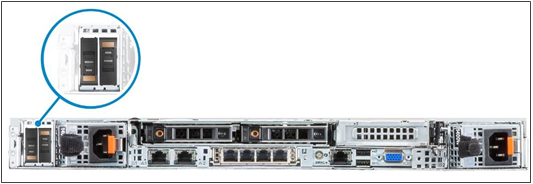
Figure 1: Rear view of the system
- Supports One (1) or Two (2) 80 mm M.2 Enterprise Class SATA SSDs
- M.2 devices are read-intensive (1 DWPD) with 240 GB or 480 GB capacity
- Fixed function hardware RAID 1 (mirroring) or pass-through
- Rear facing module for quick and easy accessibility to the M.2 SSDs
- Full Hot-Plug support
- M.2 drive LED functionality
- Managing BOSS-S2 is accomplished with standard, well-known management tools such as iDRAC, OpenManage Systems Administrator (OMSA), and Command Line Interface (CLI).
Conclusion
For more information on BOSS-S2 User’s Guide, see https://dl.dell.com/topicspdf/boss-s2_ug_en-us.pdf
For general information on iDRAC User’s Guide, see https://topics-cdn.dell.com/pdf/idrachaloug_en-us.pdf
For general information on iDRAC 4.30.30.30 Release notes, see https://topics-cdn.dell.com/pdf/idrac9- lifecycle-controller-v4x-series_release-notes43_en-us.pdf
For general information on OMSA 9.5 User’s Guide, see https://topics-cdn.dell.com/pdf/openmanage-server- administrator-v95_users-guide_en-us.pdf

Life After SATA: Value SAS as the Replacement for SATA SSDs
Mon, 16 Jan 2023 13:44:25 -0000
|Read Time: 0 minutes
Summary
Value SAS SSD creates a new way of optimizing your enterprise. With faster data transfer rates and near price parity with SATA, customers can now boost performance at a significantly lower price point. Dell EMC examines the performance of value SAS by comparing the Kioxia Memory RM5 Series SSD operational analytics to enterprise SATA, under various workload applications. With the transition over to more affordable, unified SAS infrastructure, users can now rest assured in knowing that value SAS delivers incomparable performance per dollar.
Introduction to the Technology
Kioxia, an independent spin-off company of Toshiba, created vSAS, short for Value Serial Attached SCSI, to be the storage technology capable of completely phasing out the SATA (Serial Advanced Technology Attachment) interface for SSDs. The transition to SAS-only has been slow because traditional SAS SSD drive pricing has typically been higher than SATA SSD drive pricing. Despite its throughput limitations, SATA proved to be the most cost-effective way to build dense server storage.
| SATA | SAS |
Advantages | Inexpensive | Performance |
Used When | Price is priority | Performance is priority |
Finally, after years of development, Kioxia has introduced the RM5-series value SAS SSD: a unique storage drive with SAS interface that will be priced close to typical SATA pricing. To reduce the total cost Kioxia thoughtfully simplified the architecture of value SAS; low-impact, non- critical features were removed from the typical SAS SSD.
Reducing the SAS Feature Set
The primary focus of the vSAS redesign was to reduce SAS drive pricing to SATA levels while maintaining a higher performance, latency consistency and higher reliability. Note that vSAS does not replace standard server/storage SAS, which continues with a higher performance, albeit at a higher price. Three cost-reduction exercises were run on vSAS to remove features not required for SAS functionality:
1. Dual port support was removed
a. Drives are only compatible with a single controller
2. Sector size support has been limited to 512 bytes
a. The data transfer size is limited to the traditional 512 bytes
3. T10 Data Integrity Field (DIF) support was removed
a. T10 DIF protection from data corruption is removed
Comparing vSAS Performance to SATA
Customers have been requesting more aggressive SAS pricing for years, so once the value SAS solution had been developed, Dell EMC contracted an independent third party to prove that vSAS SSDs provided notable performance gains over the SATA SSDs. Three unique trials were exercised to evaluate performance characteristics among different PowerEdge servers and application workloads. All tests concluded a significant increase in performance per dollar, as shown below:
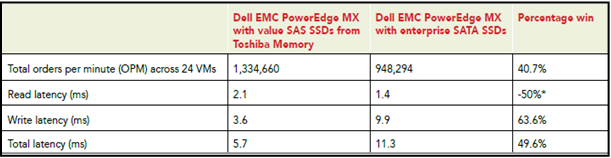
Figure 2: Test #1 had DVD Store 2 VMs performed on PowerEdge MX showing 49.6% latency reduction when using vSAS.
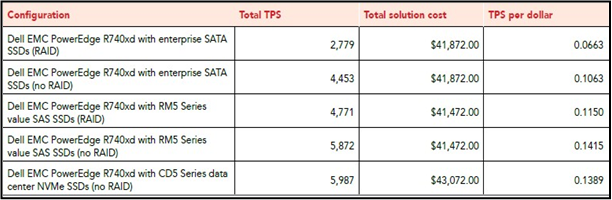
Figure 3: Test #2 had Benchmark Factory VMs performed on PowerEdge R740xd showing 71.6% more transactions per second when using vSAS.
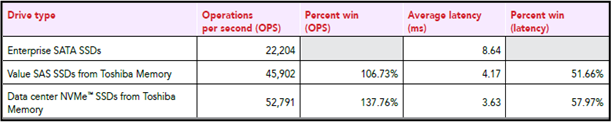
Figure 4: Test #3 had YCSB (Yahoo! Cloud Serving Benchmark) VMs performed on PowerEdge R840 showing 106.7% more operations per second when using vSAS.
The exceptional performance of vSAS among such a broad array of test configurations accentuates the consistent superiority of the SAS interface compared to SATA. Furthermore, SAS speeds are forecasted to improve over time with a technology roadmap spanning throughout the next decade. Conversely, the SATA-IO (Serial ATA International Organization) has announced on multiple occasions that they have no plans to extend SATA bandwidth beyond the current 6Gbps rate. The SAS interface is also known to be more reliable and robust. At the other end of the scale, NVMe outperforms vSAS, but its higher price warrants it to be primarily used when peak performance is required.
In Conclusion
Kioxia markets their value SAS SSD to enable a “life after SATA” and, so long as pricing remains competitive across all storage capacities, their campaign seems very fitting. All three PowerEdge configurations tested prove that value SAS SSDs deliver significant performance gains when compared to SATA SSDs, while also retaining the more reliable and robust SAS protocol. These transparent benefits should encourage users looking to optimize their workload performance to consider the advantages of replacing SATA SSDs with the innovative value SAS SSD.

Dell Technologies Collaborative Contributions to OCP NIC 3.0 Development
Mon, 16 Jan 2023 13:44:25 -0000
|Read Time: 0 minutes
Summary
After the release of OCP2.0, Dell Technologies collaborated with various technology leaders to design the all-inclusive OCP3.0 adapter card. This DfD shares the story of how Dell Technologies contributed to the OCP3.0 design and will explain how this design is superior to alternate adapter card form factors such as OCP2.0 and PCI.
History Briefing
The Open Compute Project (OCP) is a non-profit organization consisting of technology leaders working together to define and standardize superior data center product designs. In 2015 the group released the first standard OCP2.0 adapter card and soon after decided to focus development around improving the network interface of the next-gen OCP3.0 adapter card. In 2017, Dell Technologies began actively participating with OCP3.0 collaborators to produce the superior NIC adapter card.
Figure 1 - OCP3 Card Figure 2 - Electrical test fixture that Dell Technologies contributed for the 2020 Virtual OCP Summit. *Note that you must register online to access videos*
Key Contributions to OCP3.0
By sharing and making public proprietary test fixtures and design concepts from the existing rack network daughter card (rNDC), Dell Technologies was a key contributor in defining the OCP3.0 architecture in various ways:
1. Designing and manufacturing many of the compliance test fixtures required for compliance testing; this includes PCIe electrical compliance (as seen in Figure 2), systems management, and thermal tier compliance
2. Architecture design contributions taken from the rNDC design:
a. Simplified power supply
b. Basic systems management
c. Complete compliance specified with the adapter, including fixtures for industry-wide consistency
d. Reliability requirements to simplify system integration
e. Mechanical drawings with tolerances
Why OCP3.0 is Important
Production units of OCP3.0 adapter card solutions arrived on the market in 2019 and outperformed existing alternative solutions in various ways:
1. Open > Proprietary
a. Completely open specifications
b. Dell customizations through software and firmware
c. Decreases time to market with new technologies
2. OCP3.0 > OCP2.0
a. OCP NIC 3.0 has a defined SFF mechanical specification, whereas OCP2 did not have defined tolerances, which enables a seamless integration
b. Simplified power delivery, reducing complexity on the system and allowing more general support for adapters
c. Improved thermal performance and power capability
d. Added Hot-Plug capability, which allows for operation in high-availability systems
e. Host interface forward looking to PCIe Gen 5
f. Adapter includes all necessary mechanical components, allowing for ease of replacement
g. Base systems management allows systems to intelligently power the card or not
3. OCP3.0 > PCI
a. More compact design allowing for users to stack PCIe and OCP3 slots in a 1U server design where two PCIe cards would not fit
b. Full compliance mechanical specifications, as explained in 1a
c. High-speed sideband management (NC-SI)
d. Base systems management requires thermal monitoring
4. General Improvements
a. Forward looking for next 5-7 years of use for mainstream servers, including support to 400G I/O throughput
b. Support for hot-aisle and cold-aisle operation using the same adapter
c. Base systems management requires thermal monitoring
Dell Technologies currently supports OCP3.0 on the PowerEdge R6525, R7525 and C6525, and will include support for many future platforms, including the PowerEdge R650, R750 and C6520.
The OCP3.0 NIC adapter card is a standardized data center peripheral that became realized because competing technology leaders, such as Dell Technologies, HPE and Lenovo, were willing to collaborate proprietary information to design a superior innovation together. To learn more about The Open Compute Project, visit www.opencompute.org.

Dell EMC SmartFabric Services for VMware ESXi on PowerEdge Servers
Mon, 16 Jan 2023 13:44:25 -0000
|Read Time: 0 minutes
Summary
The design, validation and deployment process of fabric across VMware ESXi hosts is time-consuming and unpredictable when done manually. This DfD will highlight what SmartFabric technology is and how it granted users the agility required to manage and scale ESXi clusters effectively through automation.
Non-SmartFabric Challenge
Manually configuring fabric for VMware ESXi clusters on PowerEdge servers requires a great deal of administrative work for both onboarding (day 1) and post-onboarding (day 2+) actions. This lack of autonomy will translate to needing a network administrator to make tedious adjustments for desired changes. There is a clear need for a more effective, autonomous approach to deploying scalable fabrics capable of supporting virtualized computing environments.
Two prominent resources are under-optimized when the manual approach is used:
1. Time
a. Company man-hours are spent on IT trouble ticket creation, idle waiting, and ticket management
b. Additional man-hours are required to service IT tickets
c. Coding errors made must be troubleshooted and corrected
d. There is a lengthy qualification process of networking OS and server hardware with network switches
e. Any switch or ESXi end node failure results in manual intervention by network team
2. Cost
a. Hiring a team of network administrators, which will scale as the size of the data center scales (see Figure 1)
b. Inefficiency in the network can lead to decreased efficiency in virtual workloads, causing financial under-optimization
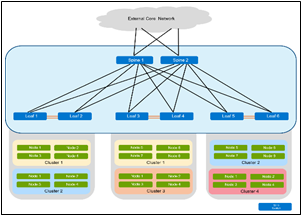
Figure 1 – Manually scaling this ESXi network would require hundreds of lines of code by a team of network administrators
The Solution – SmartFabric Services for ESXi
SmartFabric Services (SFS) optimizes resources by creating a fully integrated solution between the fabric and ESXi on PowerEdge infrastructures. Users need only perform a single manual step per profile; configure the server interface profile to the master switch through a software-based plug-in called OpenManage Network Interface (OMNI) in vCenter. This is simply done by using the ESXi physical NIC MAC address as a server interface ID, and then the creation and application of networks is automated.
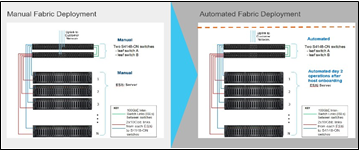
Figure 2 – Manually configuring ESXi clusters (left) is very time-intensive, whereas using SmartFabric Services (right) automates the process and drastically reduces the deployment time for new or modified ESXi clusters
Upon onboarding the ESXi server interfaces, OMNI establishes a zero-touch automation for all day 2+ operations. OMNI, intergrated with VMware’s vCenter, allows the network administrator to easily deploy and manage a large virtual network of VMs and physical underlay. Therefore, the daily operations for Dell networking and virtualization management will all take place within the vCenter Server interface. This is extremely valuable because it replaces any manual work needed, such as connecting leaf switches and writing coding, with a single-pane UI that performs these actions in a more simple and effective manner.
Six Benefits of Using SmartFabric
1. Reduced Complexity – Single and multi-rack deployments are managed in one single-pane solution
2. Agile Modifications – All network port groups are configured on the fabric and the appropriate interfaces associated with that network; eliminating time spent coding and manually configuring
3. One Network Administrator – The automated OMNI infrastructure requires only one network administrator, instead of a dedicated IT team, to manage the solution
4. Affordable Scale-Out – Incrementally scale out the network as needed, with up to 8 racks
5. No User Error – Automated server interfaces remove any chance of human error for day 2+ operations
6. Software Driven Automation – SFS delivers software-drive automation and lifecycle management
A New Way to Network
SmartFabric Services for ESXi on PowerEdge offers network configuration automation for virtualized data centers. By providing 100% zero-touch day 2+ operations, customers can optimize both time and cost when managing the growth of their ESXi solution.

NUMA Configuration settings on AMD EPYC 2nd Generation
Mon, 16 Jan 2023 13:44:26 -0000
|Read Time: 0 minutes
Summary
In multi-chip processors like the AMD-EPYC series, differing distances between a CPU core and the memory can cause Non- Uniform Memory Access (NUMA) issues. AMD offers a variety of settings to help limit the impact of NUMA. One of the key options is called Nodes per Socket (NPS). This paper talks about some of the recommended NPS settings for different workloads.
Introduction
AMD Epyc is a Multi-Chip Module processor. With the 2nd generation AMD EPYC 7002 series, the silicon package was modified to make it a little simpler. This package is now divided into 4 quadrants, with up to 2 Core Complex Dies (CCDs) per quadrant. Each CCD consists of two Core CompleXes (CCX). Each CCX has 4 cores that share an L3 cache. All 4 CCDs communicate via 1 central die for IO called I/O Die (IOD).
There are 8 memory controllers per socket that support eight memory channels running DDR4 at 3200 MT/s, supporting up to 2 DIMMs per channel. See Figure 1 below:
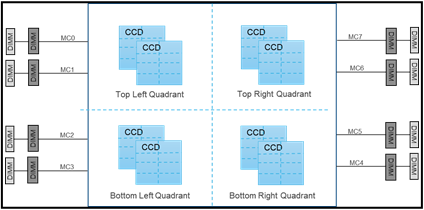
Figure 1 - Illustration of the ROME Core and memory architecture
With this architecture, all cores on a single CCD are closest to 2 memory channels. The rest of the memory channels are across the IO die, at differing distances from these cores. Memory interleaving allows a CPU to efficiently spread memory accesses across multiple DIMMs. This allows more memory accesses to execute without waiting for one to complete, maximizing performance.
NUMA and NPS
Rome processors achieve memory interleaving by using Non-Uniform Memory Access (NUMA) in Nodes Per Socket (NPS). The below NPS options can be used for different workload types:
- NPS0 – This is only available on a 2-socket system. This means one NUMA node per system. Memory is interleaved across all 16 memory channels in the system.
- NPS1 – In this, the whole CPU is a single NUMA domain, with all the cores in the socket, and all the associated memory in this one NUMA domain. Memory is interleaved across the eight memory channels. All PCIe devices on the socket belong to this single NUMA domain.
- NPS2 – This setting partitions the CPU into 2 NUMA domains, with half the cores and memory in each domain. Memory is interleaved across 4 memory channels in each NUMA domain.
- NPS4 – This setting partitions the CPU into four NUMA domains. Each quadrant is a NUMA domain, and memory is interleaved across the 2 memory channels in each quadrant. PCIe devices will be local to one of the 4 NUMA domains on the socket, depending on the quadrant of the IOD that has the PCIe root for the device.
Note: Not all CPUs support all NPS settings
Recommended NPS Settings
Depending on the workload type, different NPS settings might give better performance. In general, NPS1 is the default recommendation for most use cases. Highly parallel workloads like many HPC use cases might benefit from NPS4. Here is a list of recommended NPS settings for some key workloads. In some cases, benchmarks are listed to indicate the kind of workloads.
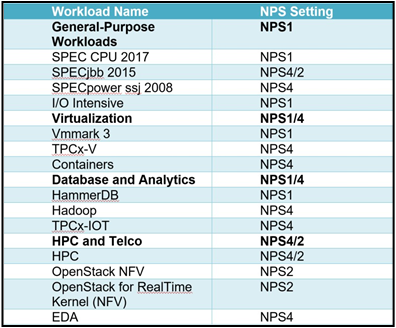
Figure 2 - Table of recommended NPS Settings depending on workload
For additional tuning details, please refer to the Tuning Guides shared by AMD here.
For detailed discussions around the AMD memory architecture, and memory configurations, please refer to the Balanced Memory Whitepaper
In Conclusion
The Dell AMD EPYC based servers offer multiple configuration options to optimize memory performance. Based on workload, choosing the appropriate NPS setting can help maximize performance.

Dell Next Generation PowerEdge Servers: Designed for PCIe Gen4 to Deliver Future Ready Bandwidth
Mon, 16 Jan 2023 13:44:26 -0000
|Read Time: 0 minutes
Summary
PCIe is the primary interface for connecting various peripherals in a server. The Next Generation of Dell PowerEdge servers, and AMD EPYC 7002 processors are designed keeping PCIe Gen4 in mind. PCIe Gen4 effectively doubles the throughput available per lane compared to PCIe Gen3. The Dell PowerEdge R7525 and R6525 servers have up to 160 available PCIe Gen4 lanes maximizing available bandwidth.
The PCIe Interface
PCIe (Peripheral Component Interconnect Express) is a high-speed bus standard interface for connecting various peripherals to the CPU. This standard is maintained and developed by the PCI-SIG (PCI-Special Interest Group), a group of more than 900 companies. In today’s world of servers, PCIe is primary interface for connecting peripherals. It has numerous advantages over the earlier standards, being faster, more robust and very flexible. These advantages have cemented the importance of PCIe.
PCIe Gen 3 was the third major iteration of this standard. Dell PowerEdge 14G systems were designed keeping PCIe Gen 3 in min PCIe Gen3 can carry a bit rate of 8 Gigatransfers per second (GT/s). After considering the overhead of the encoding scheme, this works out to an effective delivery of 985 MB/s per lane, in each direction. A PCIe Gen3 slot with 8 lanes (x8) can have a total bandwidth of 7.8 GB/s.
PCIe Gen 4 is the fourth major iteration of the PCIe standard. This generation doubles the throughput per lane to 16 GT/s. This works out to an effective throughput of 1.97 GB/s per lane in each direction, and 15.75GB/s for a x8 PCIe Gen4 slot.
2nd Gen AMD EPYC 7002 and PCIe
Next Generation Dell PowerEdge servers with AMD processors are designed for PCIe Gen4. The 2nd Generation AMD Epyc 7002 series processors support the PCIe Gen4 standard allowing for the maximum utilization of this available bandwidth. A single socket 2nd Gen AMD EPYC 7002 processor has 128 available PCIe Gen4 lanes for use. This allows for great flexibility in design. 128 lanes also give plenty of bandwidth for many peripherals to take advantage of the high core count CPUs.
The dual socket platform offers an additional level of flexibility to system designers. In the standard configuration, 128 PCIe Gen4 lanes are available for peripherals. The rest of the lanes are used for inter-socket communication. Some of these inter-socket xGMI2 lanes can be repurposed to add an additional 32 lanes. This gives a total of 160 PCIe Gen4 lanes for peripherals (Figure 1). This flexibility allows for a wide variety of configurations and maximum CPU-peripheral bandwidth.
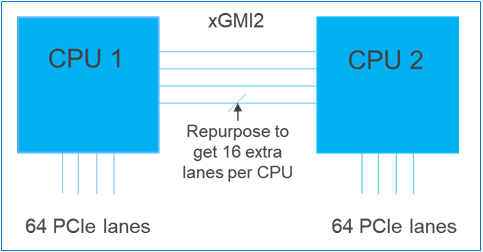
Figure 1 - Diagram showing PCIe lanes in a 2-socket configuration
Designing for PCIe Gen4
The Next Generation of Dell PowerEdge servers were designed with a new PSU Layout. One of the key reasons this was done was to simplify enabling PCIe Gen4.
A key element in PCIe performance is the length of PCIe traces. With the new system layout, a main goal was to shorten the overall PCIe trace lengths in the topology, including traces in the motherboard. By positioning PSU’s at both edges, the I/O traces to connectors can be shortened for both processors. This is the optimal physical layout for PCIe Gen 4 and will enable even faster speeds for future platforms. The shorter PCIe traces translate into better system costs and improved Signal Integrity for more reliable performance across a broad variety of customer applications.
Another advantage of the split PSU is the balanced airflow that results. The split PSU layout helps to balance the system airflow, reduce PSU operating temperatures, and allows for PCIe Gen4 card support and thus an overall more optimal system design layout.
Figure 2 below illustrates how this will look, comparing the 14G series with the next generation of PowerEdge servers.
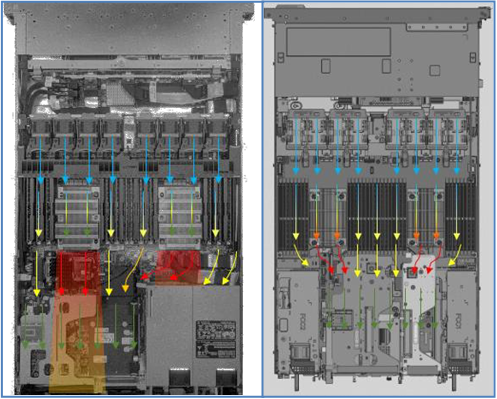
Figure 2 - Figures showing the 14G server layout to the left and the balanced airflow of the next gen AMD platforms to the right.
In Conclusion
PowerEdge servers continue to deliver best-in-class features. The new PowerEdge servers have support for the higher speed PCIe Gen4, with innovative designs to improve signal integrity and chassis airflow.

24 NVMe Drive R7525: Designed for Maximum Storage Bandwidth
Mon, 16 Jan 2023 13:44:26 -0000
|Read Time: 0 minutes
Summary
The PowerEdge R7525 featuring 2nd Gen AMD EPYC 7002 series processors with 24 NVMe drives provides a unique combination non- oversubscribed NVMe storage along with plenty of peripheral options to support applications that require maximum performance.
Introduction
NVMe drives are designed for high speed, low latency access to storage. The NVMe protocol is a lightweight protocol that is built on top of the PCIe bus. Most NVMe devices use x4 PCIe lanes, allowing maximum bandwidth to the device. Since PCIe is the default interface between the CPU and peripherals, NVMe drives can be connected directly to the CPU.
The number of available PCIe lanes usually dictates the number of NVMe devices that can be directly connected to the CPU. In case a system does not have enough free PCIe lanes, one or more PCIe switches can be used to connect more NVMe devices to the CPU. This results in a design that is considered as oversubscribed. For example, if 24 x4 NVMe devices are connected to the CPUs using 32 PCIe lanes, this would be considered as a 3:1 oversubscription.
2nd Gen AMD EPYC 7002 series and PCIe
The 2U 2-socket Dell PowerEdge R7525 featuring 2nd Gen AMD EPYC 7002 series processors has plenty of available PCIe lanes. Each 2nd Gen AMD EPYC processor has 128 available PCIe lanes for use. In the standard 2-socket configuration, 128 PCIe lanes are available for peripherals, with the rest being used for inter-socket communication. However, some of the inter-socket xGMI2 lanes can also be repurposed to add PCIe lanes. In this way, some configurations have an additional 32 lanes giving a total of 160 PCIe lanes for peripherals.
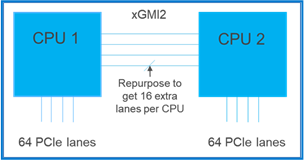
Figure 1 - Diagram showing PCIe lanes in a 2-socket configuration
Dell PowerEdge R7525 with 24 NVMe drives
The Dell Poweredge R7525 24 NVMe configuration takes advantage of the above configuration. All 24 x4 NVMe drives are directly connected to the CPUs using up 96 of the available 160 lanes. This ensures that none of the NVMe drives have any oversubscription. All NVMe drives are directly connected maximizing throughput and reducing latency. The high core count of the 2nd Gen AMD EPYC 7002 series also helps take advantage of this available lanes. The remaining 64 PCIe lanes are split up across 2 x16 slots, 1 x16 OCP 3.0 slot and 2 x8 slots that can be used for other peripherals like network cards.
Figure 2 - R7525 in 24 drive NVMe Configuration
In Conclusion
The 24 NVMe drive R7525 is a very flexible platform. It has support for high powered 2nd Generation AMD EPYC 7002 series processors with up to 64 physical cores per processor, 24 NVMe drives directly connected to the CPUs and multiple PCIe Gen4 slots for peripheral support. This combination provides a platform that is optimized for storage bandwidth yet does not scrimp on additional peripheral support.

3200MT/s DIMM Support for PowerEdge Servers
Mon, 16 Jan 2023 13:44:26 -0000
|Read Time: 0 minutes
Summary
For many years 2666MT/s and 2933MT/s were the standard speeds of memory modules used within servers. Now that 3200MT/s SKUs are ready for public consumption, data center customers have been eager to understand what this transition will look like. This DfD will outline how 3200MT/s DIMMs were validated, what to expect when transitioning them into a new or existing data center, and DIMM/platform support tables.
Validation Process
The Dell Technologies engineering team validated 3200MT/s DIMMs to ensure they performed properly on current-gen platforms, while also integrating seamlessly and without impact to legacy platforms. This 3-step validation process can be seen below:
- Margin Testing - Validation that the transactions routing across the CPU, DRAM, motherboard and BIOS have sufficient margins to ensure a robust signal integrity for reads and writes.
- Mixed Testing - Functional testing is performed to ensure various qualified DIMM vendors, capacities and speeds are operable and compatible with one another within a system.
- Full Functional Testing - Memory stress tests are performed using various industry standard applications, as well as Dell proprietary tests, to ensure DIMM quality is intact for typical user configurations.
What to Expect Upon Transitioning
- 3200MT/s DIMMs are backwards compatible and will automatically downshift to any memory speed to match the capability of the CPU
- 3200MT/s DIMMs can be mixed with slower DIMMs and will automatically downshift and match the speed of the slower DIMM
- 3200MT/s DIMMs are exact replacements in that they have the same capacity, the same number of ranks, the same data width, and the same density as the DIMMs they are replacing
- All BIOS/iDRAC releases for the supported platforms will support the 3200MT/s DIMMs. *Note firmware is not associated with DIMMs
- Dell Technologies support services replaces parts with like or better and they may replace the older 2933MT/S and 2666MT/s parts with the newer 3200MT/s parts since they are backwards compatible
Support for 3200MT/s DIMMS are provided in the tables below:
Compatibility Tables
Older 2666MT/s DIMMs |
| Replacement DIMMs | ||||||||||||
Capacity (GB) | Speed (MT/s) | Type | Ranks | Data Width | Density | Dell Part Number | Capacity (GB) | Speed (MT/s) | Type | Ranks | Data Width | Density | Dell Part Number | |
8 | 2666 | RDIMM | 1 | x8 | 8Gb | 1VRGY | è | 8 | 3200 | RDIMM | 1 | x8 | 8Gb | 6VDNY |
16 | 2666 | RDIMM | 2 | x8 | 8Gb | PWR5T | è | 16 | 3200 | RDIMM | 2 | x8 | 8Gb | M04W6 |
32 | 2666 | RDIMM | 2 | x4 | 8Gb | TN78Y | è | 32 | 3200 | RDIMM | 2 | x4 | 8Gb | 75X1V |
Older 2933MT/s DIMMs |
| Replacement DIMMs | ||||||||||||
Capacity (GB) | Speed (MT/s) | Type | Ranks | Data Width | Density | Dell Part Number | Capacity (GB) | Speed (MT/s) | Type | Ranks | Data Width | Density | Dell Part Number | |
16 | 2933 | RDIMM | 2 | x8 | 8Gb | TFYHP | è | 16 | 3200 | RDIMM | 2 | x8 | 8Gb | M04W6 |
32 | 2933 | RDIMM | 2 | x4 | 8Gb | 8WKDY | è | 32 | 3200 | RDIMM | 2 | x4 | 8Gb | 75X1V |
64 | 2933 | RDIMM | 2 | x4 | 16Gb | W403Y | è | 64 | 3200 | RDIMM | 2 | x4 | 16Gb | P2MYX |
Supported Memory in PowerEdge Platforms
DIMM Platform Support for 1st Generation Intel® Xeon® Scalable Processors | DIMM Platform Support for 2nd Generation AMD® EPYC® Scalable Processors | ||||||||||||||||||||||||||||
Capacity (GB) |
Speed (MT/s) |
Type |
Dell Part Number | R940 | R940xa | R840 | R740 | R740XD | R740XD2 | R640 | R540 | R440 | C6420 | C4140 | MX840c | MX740c | M640 | FC640 | T640 | T440 |
Capacity (GB) |
Speed (MT/s) |
Type |
Dell Part Number | R7525 | R7515 | R6525 | R6515 | C6525 |
8 | 2666 | RDIMM | 1VRGY | ● | ● | ● | ● | ● | ● | ● | ● | ● | ● | ● | ● | ● | ● | ● | ● | ● | 8 | 2666 | RDIMM | 1VRGY |
|
|
|
|
|
16 | 2666 | RDIMM | PWR5T | ● | ● | ● | ● | ● | ● | ● | ● | ● | ● | ● | ● | ● | ● | ● | ● | ● | 16 | 2666 | RDIMM | PWR5T |
|
|
|
|
|
32 | 2666 | RDIMM | TN78Y | ● | ● | ● | ● | ● | ● | ● | ● | ● | ● | ● | ● | ● | ● | ● | ● | ● | 32 | 2666 | RDIMM | TN78Y |
|
|
|
|
|
64 | 2666 | LRDIMM | 4JMGM | ● | ● | ● | ● | ● |
| ● | ● | ● | ● | ● | ● | ● | ● | ● | ● | ● | 64 | 2666 | LRDIMM | 4JMGM |
|
|
|
|
|
128 | 2666 | LRDIMM | 917VK | ● | ● | ● | ● | ● |
| ● |
|
| ● |
| ● | ● | ● | ● | ● |
| 128 | 2666 | LRDIMM | 917VK | ● | ● | ● | ● | ● |
16 | 2933 | RDIMM | TFYHP | ● | ● | ● | ● | ● | ● | ● | ● | ● | ● | ● | ● | ● | ● | ● | ● | ● | 16 | 2933 | RDIMM | TFYHP |
|
|
|
|
|
32 | 2933 | RDIMM | 8W KDY | ● | ● | ● | ● | ● | ● | ● | ● | ● | ● | ● | ● | ● | ● | ● | ● | ● | 32 | 2933 | RDIMM | 8W KDY |
|
|
|
|
|
64 | 2933 | RDIMM | W 403Y | X | X | X | X | X | X | X | X | X | X | X | X | X | X | X | X | X | 64 | 2933 | RDIMM | W 403Y |
|
|
|
|
|
8 | 3200 | RDIMM | 6VDNY | ● | ● | ● | ● | ● | ● | ● | ● | ● | ● | ● | ● | ● | ● | ● | ● | ● | 8 | 3200 | RDIMM | 6VDNY | ● | ● | ● | ● | ● |
16 | 3200 | RDIMM | M04W 6 | ● | ● | ● | ● | ● | ● | ● | ● | ● | ● | ● | ● | ● | ● | ● | ● | ● | 16 | 3200 | RDIMM | M04W 6 | ● | ● | ● | ● | ● |
32 | 3200 | RDIMM | 75X1V | ● | ● | ● | ● | ● | ● | ● | ● | ● | ● | ● | ● | ● | ● | ● | ● | ● | 32 | 3200 | RDIMM | 75X1V | ● | ● | ● | ● | ● |
64 | 3200 | RDIMM | P2MYX | X | X | X | X | X | X | X | X | X | X | X | X | X | X | X | X | X | 64 | 3200 | RDIMM | P2MYX | ● | ● | ● | ● | ● |
DIMM Platform Support for 2nd Generation Intel® Xeon® Scalable Processors | KEY: • Server and DIMM Combination is supported BLANK Server and DIMM Combination is not supported X Server and DIMM Combination will not function and it is not supported | ||||||||||||||||||||||||||||
Capacity (GB) |
Speed (MT/s) |
Type |
Dell Part Number | R940 | R940xa | R840 | R740 | R740XD | R740XD2 | R640 | R540 | R440 | C6420 | C4140 | MX840c | MX740c | M640 | FC640 | T640 | T440 | |||||||||
8 | 2666 | RDIMM | 1VRGY | ● | ● | ● | ● | ● | ● | ● | ● | ● | ● | ● | ● | ● | ● | ● | ● | ● | |||||||||
16 | 2666 | RDIMM | PWR5T | ● | ● | ● | ● | ● | ● | ● | ● | ● | ● | ● | ● | ● | ● | ● | ● | ● | |||||||||
32 | 2666 | RDIMM | TN78Y | ● | ● | ● | ● | ● | ● | ● | ● | ● | ● | ● | ● | ● | ● | ● | ● | ● | |||||||||
64 | 2666 | LRDIMM | 4JMGM | ● | ● | ● | ● | ● |
| ● | ● | ● | ● | ● | ● | ● | ● | ● | ● | ● | |||||||||
128 | 2666 | LRDIMM | 917VK | ● | ● | ● | ● | ● |
| ● |
|
| ● |
| ● | ● | ● | ● | ● |
| |||||||||
16 | 2933 | RDIMM | TFYHP | ● | ● | ● | ● | ● | ● | ● | ● | ● | ● | ● | ● | ● | ● | ● | ● | ● | |||||||||
32 | 2933 | RDIMM | 8W KDY | ● | ● | ● | ● | ● | ● | ● | ● | ● | ● | ● | ● | ● | ● | ● | ● | ● | |||||||||
64 | 2933 | RDIMM | W 403Y | ● | ● | ● | ● | ● | ● | ● | ● | ● | ● | ● | ● | ● | ● | ● | ● | ● | |||||||||
8 | 3200 | RDIMM | 6VDNY | ● | ● | ● | ● | ● | ● | ● | ● | ● | ● | ● | ● | ● | ● | ● | ● | ● | |||||||||
16 | 3200 | RDIMM | M04W 6 | ● | ● | ● | ● | ● | ● | ● | ● | ● | ● | ● | ● | ● | ● | ● | ● | ● | |||||||||
32 | 3200 | RDIMM | 75X1V | ● | ● | ● | ● | ● | ● | ● | ● | ● | ● | ● | ● | ● | ● | ● | ● | ● | |||||||||
64 | 3200 | RDIMM | P2MYX | ● | ● | ● | ● | ● | ● | ● | ● | ● | ● | ● | ● | ● | ● | ● | ● | ● | |||||||||
Supported DIMM Mixing
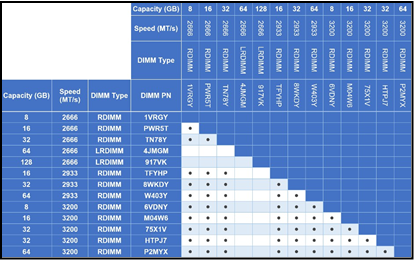
Key:
- Supported
- BLANK Not Supported
![]() This combination is already shown in a different cell in the table
This combination is already shown in a different cell in the table

1S PowerEdge R7515 has Equivalent T4 GPU Performance to 2S PowerEdge R7425
Mon, 16 Jan 2023 13:44:27 -0000
|Read Time: 0 minutes
Summary
The 2nd Gen AMD EPYCTM CPU is a 7nm processor loaded with 64 threads, making it a powerhouse for any server. Its impressive specs give it room for generational growth, as its supporting server hardware progress to become capable of fully utilizing it. This DfD analyzes how one 64-core AMD CPU in a 1S R7515 produces equivalent T4 GPU performance to two 32-core AMD CPUs in a 2S R7425, and why users looking to run ML inference workloads should consider utilizing this 64- core CPU in a 1S server.
Distinguished Next Gen AMD EPYCTM CPU
The launch of AMDs 2nd Generation EPYCTM (Rome) CPUs shook up the CPU industry by refining their proprietary Zen microarchitecture to new limits. With up to 64 cores, twice the amount of its predecessor (Naples), AMD went above and beyond the traditional tech mold by delivering a product truly worth of the term “next-gen”.
Figure 1 – AMD Rome CPU architecture graphic (large I/O die in the center with 8 chip dies containing 8 cores bordering the I/O die)
From a component-spec standpoint, the Rome CPU is 2x as capable as the Naples CPU. However, Dell Technologies wanted to confirm its ability to manage dense workloads that stress the processor. This led to various tests executed on the PowerEdge R7515 server, which supports 1 Rome CPU, and the PowerEdge R7425 server, which supports 2 Naples CPUs, to record and compare the performance of each CPU generation. Object detection, image classification and machine translation workloads were run with the support of NVIDIA T4 GPUs assisting the CPU(s).
VDI, IVA and Inference Studies
By executing tests on both servers (Figure 2) for various workloads (Figures 3-7), two factors are examined:
- How the R7515 (Rome) and R7425 (Naples) solutions performed across various Machine Learning inference workloads. This accounts for the reduction of eight memory modules in the R7515 solution.
- How NVIDIA T4 GPU performance compared between both solutions (QPS and inputs per second).
Server Details
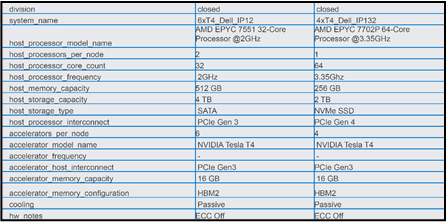
Figure 2 – Server configuration details for the 32-core server (left) and 64-core server (right)
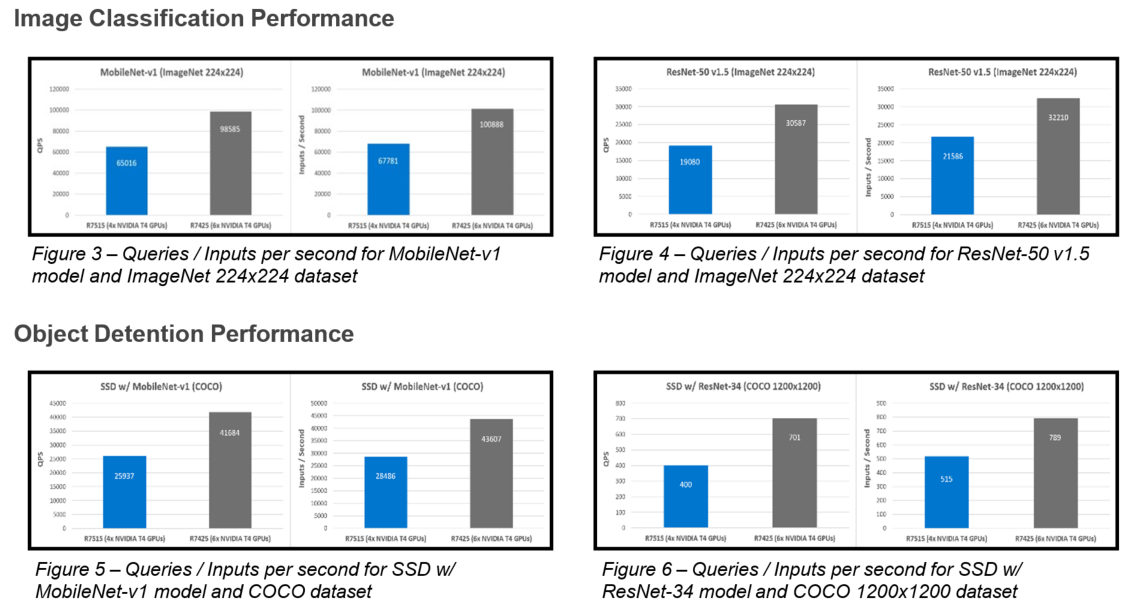

The figures above display the performance comparison of a 1S PowerEdge R7515 configured with 4 NVIDIA T4 GPUs and a 2S PowerEdge R7425 with 6 NVIDIA T4 GPUs. Although the bar graphs may not appear equivalent, once the total queries and inputs per second are divided by the total GPU count, we see that the performance per individual GPU is nearly equivalent (see Figure 8).
MobileNet-v1 (ImageNet (224x224) | ||||
Performance Measurement | R7515 (1x T4) | R7425 (6x T4) | 1S - 2S | % Variance |
QPS (x1 T4) | 16254 | 16431 | -177 | -1.08% |
Input / Second (x1 T4) | 16945 | 16815 | 130 | 0.77% |
ResNet-50 v1.5 (ImageNet (224x224) | ||||
Performance Measurement | R7515 (1x T4) | R7425 (6x T4) | 1S - 2S | % Variance |
QPS (x1 T4) | 4770 | 5098 | -328 | -6.43% |
Input / Second (x1 T4) | 5397 | 5368 | 29 | 0.54% |
SSD w/ MobileNet-v1 (COCO) | ||||
Performance Measurement | R7515 (1x T4) | R7425 (6x T4) | 1S - 2S | % Variance |
QPS (x1 T4) | 6484 | 6947 | -463 | -6.66% |
Input / Second (x1 T4) | 7122 | 7268 | -146 | -2.01% |
SSD w/ ResNet-34 (COCO 1200x1200) | ||||
Performance Measurement | R7515 (1x T4) | R7425 (6x T4) | 1S - 2S | % Variance |
QPS (x1 T4) | 100 | 117 | -17 | -14.53% |
Input / Second (x1 T4) | 129 | 132 | -3 | -2.27% |
GNMT (WMT E-G) | ||||
Performance Measurement | R7515 (1x T4) | R7425 (6x T4) | 1S - 2S | % Variance |
QPS (x1 T4) | 200 | 198 | 2 | 1.01% |
Input / Second (x1 T4) | 341 | 221 | 120 | 54.30% |
Figure 8 – Performance variance percentages for one T4 GPU highlighted in the last row. Note that negative percentages translates to lower performance for R7515 GPUs.
Now that the data is reduced to a common denominator of one GPU, the performance variance becomes easy to interpret. The inputs per second for Image Classification and Object Detection are nearly identical between server configurations; staying within ±3% of one another. Machine Translation numbers, however, are heavily boosted by the AMD Rome CPU. The queries per second (QPS) are a little more variant but are still very similar. All workloads stay within ± 7% of one another, except for the object detection workload ResNet-34, which has a -14.53% loss in performance.
Major Takeaways
This data proves that despite executing the workload on a single socket server, the Rome server configuration is still executing vision and language processing tasks at a nearly equivalent performance to the Naples configuration. Knowing this, Dell Technologies customers can now be informed of the following takeaways upon their next PowerEdge configuration order:
- A single socket 64-core AMD Rome CPU performs at near equivalence to two socket 32-core AMD Naples CPUs for vision and language processing tasks. This means that inference workloads in the AI space will be able to perform effectively with less components loaded in the server. Therefore, customers running workloads such as inference that are not impacted by a reduction in total system memory capacity would be great candidates for switching from 2S to 1S platforms.
- Non-Uniform Memory access (NUMA) memory and I/O performance issues associated with 2S platforms is avoided with the 1S R7515 Rome configuration. This is beneficial to I/O and memory intensive workloads as data transfers are localized to one socket; therefore avoiding any associated latency and bandwidth penalties.
- 64-core single socket servers typically offer better value due to the amortization of system components.
- Reducing the number of CPUs and memory will reduce the total power consumption .
Conclusion
One 2nd Generation AMD EPYCTM (Rome) CPU is capable of supporting AI vision and language processing tasks at near-equivalent performance to two 1st Generation AMD EPYCTM (Naples) CPUs. The advantages attached to this generational performance gap, such as increased cost-effectiveness, will appeal to many PowerEdge users and should be considered for future solutions.

Virtualized GPU Instances on Dell EMC PowerEdge Platforms for Compute Intensive Workloads
Mon, 16 Jan 2023 13:44:27 -0000
|Read Time: 0 minutes
Summary
In this DfD we address a common problem that is faced by IT teams across different organizations – being able to efficiently share and utilize NVIDIA GPU resources across different teams and projects.
AI adoption is growing in many organizations leading to increased demand of GPU accelerated compute instances. We explore how IT teams can leverage existing investment in virtualized infrastructure combined with NVIDIA Virtual GPU software to provide optimized and secure GPU-ready compute environments for AI researcher and engineers.
Motivation for GPU Virtualization
The requirement and demand for GPU accelerated compute instances is steadily rising in all organizations, driven primarily by rise of AI and Deep Learning (DL) techniques to realize increased efficiencies and improve customer interactions. IT environments continue to adopt virtualization to run all workloads and address requirements of providing secure and agile compute capabilities to end users. NVIDIA Virtual GPU software (previously referred to as GRID) enables virtualizing a physical GPU and allows it to be shared across multiple virtual machines. The rising demand for GPU accelerated compute instances can be achieved by virtualizing GPUs and deploying cost effective GPU accelerated VM instances. Enabling a centralized and hosted solution in the data center provides the security and scalability that is critical to enterprise customers.
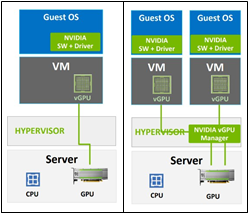
Figure 1. GPU enabled VM instances using GPU Pass-Though and GPU Virtualization (vGPU)
NVIDIA Virtual GPU software enables virtual GPUs to be created on a Dell EMC server with NVIDIA GPUs that can be shared across multiple virtual machines. Better utilization and sharing are achieved by transforming a one-to-one relationship from GPU to user to one- to-many.
Traditionally, the IT best practices for compute-intensive (non-graphical) VM instances leveraged GPU pass-through shown in the left half of Figure 1. In a VMware environment, this is referred to as the VM DirectPath I/O mode of operation. It allows the GPU device to be accessed directly by the guest operating system, bypassing the ESXi hypervisor. This provides a level of performance of a GPU on vSphere that is very close to its performance on a native system (within 4-5%).
The main reasons for using the passthrough approach to expose GPUs on vSphere are:
- Simplicity: It is straightforward to allocate GPUs to a VM using pass-though and offer GPU acceleration benefits to end users
- Dedicated use: there is no need for sharing the GPU among different VMs, because a single application will consume one or more full GPUs
- Replicate public cloud instances: public cloud instances use GPU pass-through, and end user wants the same environment in an on-premises datacenter
- A single virtual machine can make use of multiple physical GPUs in passthrough mode
An important point to note is that the passthrough option for GPUs works without third-party software driver being loaded into the ESXi hypervisor.
Disadvantages of GPU passthrough is as follows:
- The entire GPU is dedicated to that VM and there is no sharing of GPUs amongst the VMs on a server.
- Advanced vSphere features of vMotion, Distributed Resource Scheduling (DRS) and Snapshots are not allowed with this form of using GPUs with a virtual machine.
Overview of NVIDIA vGPU Platform
GPU virtualization (NVIDIA vGPU) addresses limitations of pass-through but was traditionally deployed to accelerate virtualized profession graphics applications, virtual desktop instances or remote desktop solutions. NVIDIA added support for AI, DL and high-performance computing (HPC) workloads in GRID 9.0 that was released in summer 2019. It also changed vGPU licensing to make it more amenable for compute use cases. GRID vPC/vApps and Quadro vDWS are licensed by concurrent user, either as a perpetual license or yearly subscription. Since vComputeServer is for server compute workloads, the license is tied to the GPU rather than a user and is therefore licensed per GPU as a yearly subscription. For more information about NVIDIA GRID software, see http://www.nvidia.com/grid.
Figure 2 shows the different components of the Virtual GPU software stack.
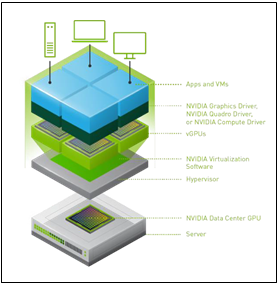
Figure 2. GPU enabled VM instances using GPU Pass- Though and GPU Virtualization (vGPU)
NVIDIA GPU Virtualization software transforms a physical GPU installed on a server to create virtual GPUs (vGPU) that can be shared across multiple virtual machines. The focus in this paper is on the use of GPUs for compute workloads using vComputeServer profile introduced in GRID 9. We are not looking at GPU usage for professional graphics or virtual desktop infrastructure (VDI) that will leverage Quadro vDWS or GRID vPC and vAPP profiles. GRID vPC/vApps and Quadro vDWS are client compute products for virtual graphics designed for knowledge workers and professional graphics use. vComputeServer is targeted for compute-intensive server workloads, such as AI, deep learning, and Data Science.
In an ESXi environment, the lower layers of the stack include the NVIDIA Virtual GPU Manager, that is loaded as a VMware Installation Bundle (VIB) into the vSphere ESXi hypervisor. An additional guest OS NVIDIA vGPU driver is installed within the guest operating system of your virtual machine.
Using the NVIDIA vGPU technology with vSphere provides options during creation of the VMs to dedicate a full GPU device(s) to one virtual machine or to allow partial sharing of a GPU device by more than one virtual machine.
IT admins will pick between the options depending on the application and user requirements:
- Partial GPUs: For AI dev environments a data scientist VM will not need the power of full GPU
- GPU sharing: IT admins want GPUs to be share by more than one team of users simultaneously
- High priority applications: dedicate a full GPU or multiple GPUs to one VM
The different editions of the vGPU driver are described next.
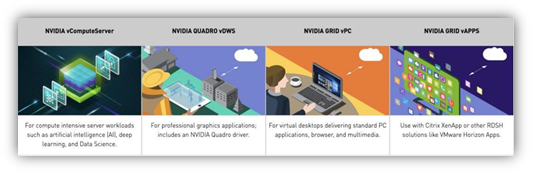
NVIDIA virtual GPU Software is available in four editions that deliver accelerated virtual desktops to support the needs of different workloads.
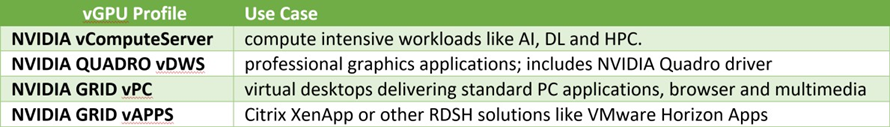
IT administrators can configure VMs using vComputeServer (vCS) profiles to deploy GPU compute instances on top of Dell EMC PowerEdge servers configured with NVIDIA V100 or T4 GPUs. Details of vCS GPU profile and list of Dell EMC Servers that can be used to run VMs accelerated using vCS GPU profiles is provided in the following tables. IT teams have a range of options in terms of vGPU profiles, GPU Models and supported Dell platforms to accommodate the compute requirements of their customer workloads.
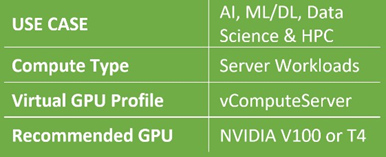
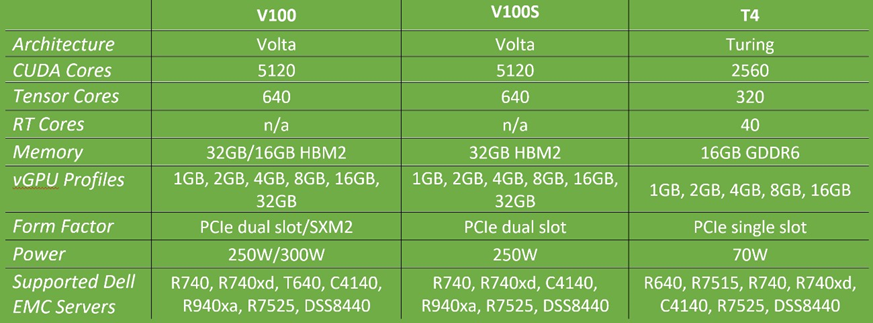
vComputeServer Features and Deployment Patterns
vComputeServer was designed to complement existing GPU virtualization capabilities for graphics and VDI and address the needs of the data centers to virtualize compute-intensive workloads such as AI, DL and HPC. As part of addressing the needs of compute-intensive workloads, vCS introduced GPU aggregation inside a VM (multi vGPU support in a VM), GPU P2P support for NVLink, container support using NGC and support for application, VM, and host-level monitoring. A few of the key features are:
Management and monitoring: Admins can use the VMware management tools like VMware vSphere to manage GPU servers, with visibility at the host, VM and app level. GPU-enabled virtual machines can be migrated with minimal disruption or downtime.
Multi vGPU support: Administrators can now combine management benefits of vGPU and leverage the compute capability of scaling-out jobs across multiple GPUs by leveraging multi vGPU support in vComputeServer. Multiple vGPUs can now be deployed in a single virtual machine to scale application performance and speed up production workflows.
Support for NGC Software: vComputeServer supports NVIDIA NGC GPU-optimized software for deep learning, machine learning, and HPC. NGC software includes containers for the popular AI and data science software, validated and optimized by NVIDIA, as well as fully-tested containers for HPC applications and data analytics. NGC also offers pre-trained models for a variety of common AI tasks that are optimized for NVIDIA Tensor Core GPUs. This allows data scientists, developers, and researchers to reduce deployment times focus on building solutions, gathering insights, and delivering business value.
Deploying Virtualized GPU Instances for Compute Intensive Workloads
In this paper we covered the benefits of deploying virtualized VMs that can leverage GPU compute for accelerating emerging workloads like AI, Deep Learning and HPC. Customers that care about highest performance can leverage virtualized instances of NVIDIA V100 GPU in their VMs and also aggregate multiple vGPUs on Dell PE-C4140 server to get increased performance using GPU aggregation capability of vComputeServer profile. Customers concerned about cost can share a GPU between multiple users by leveraging smaller vGPU profiles (upto 16 vGPU profiles can be created from a single V100 or T4 GPU).

The Value of Using Four-Channel Optimized AMD EPYCTM CPUs in PowerEdge Servers
Mon, 16 Jan 2023 13:44:27 -0000
|Read Time: 0 minutes
Summary
AMD recently launched their 2nd generation of AMD EPYCTM CPUs, and with this launch came the announcement of an additional set of four- channel optimized SKUs. Considering AMD CPUs have eight memory channels, there has been uncertainty as to why these SKUs were created and how they are beneficial. This DfD will educate readers on the architecture modifications made for four-channel optimized AMD EPYCTM CPUs, as well as the suggested use cases and value they bring to PowerEdge servers.
Introduction
Most 2nd generation AMD EPYCTM CPUs contain four memory controllers each with two memory channels; a total of eight memory slots that need to be populated for an optimized configuration. However, several CPU SKUs were modified to optimize performance with only four memory slots populated. These four-channel optimized SKUs require only two memory controllers to be fully populated for an optimized solution, and ultimately provide a lower cost alternative to traditional eight-channel solutions. The remaining channels can always be filled in if more memory is required.
Four-Channel Architecture and Positioning
These four-channel optimized CPUs, such as the AMD EPYCTM 7252 and the AMD EPYCTM 7282, contain a unique architecture that was designed to best support two fully populated memory controllers. Figure 1 below illustrates at a high level the architecture differentiation between four- channel optimized and eight-channel optimized CPUs.
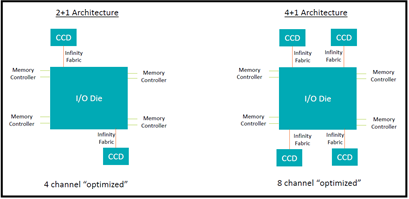
Figure 1 – Block diagram illustrating the distinctions between four-channel optimized and eight-channel optimized architectures
The Core Complex Die, or CCD, count is reduced from four to two per CPU. Both memory controllers closest to the CCD quadrant should be populated with two memory modules so the I/O die can route and distribute data packages across the smallest travel distance possible. Populating this way enables performance similar to eight-channel data transfer speeds for specific workloads. Additionally, reducing the number of CCDs lowers the total solution cost, effectively generating an increased performance per price value proposition.
Positioning
Various workloads were tested to compare performance with the eight-channel optimized SKUs. Most workloads do indeed gain an increased performance per price. Customers that prioritize pricing over everything else should find the cost-savings of four-channel optimized CPUs an attractive feature to consider.
However, there are some limitations and caveats that make this technology inadequate for specific workloads. The most obvious caveat is that by populating only four memory modules per CPU, the memory bandwidth and latency are essentially halved, and this should be considered for customers running memory- dense workloads. Additionally, the CPU base/max clock frequency have been slightly reduced and the total L3 cache has been halved. Please reference Figure 2 below for Dell EMC recommended positioning:
WORKLOAD | AVERAGE PERFORMANCE PER PRICE VARIANCE (7282 4ch vs. 7302 4ch) |
BENCHMARK(S) |
RECOMMENDED POSITIONING |
Collaboration (Conference, Web Conference, IM, Email, Enterprise Social Networks, File Sharing) |
+10% | SPECint 2017 | RECOMMENDED - Exceptional increase in performance per price, with minimal risk of negative impact |
Web Serving (HTTP, PHP, Javascript) | +7% | Apache, PHP Bench | RECOMMENDED - Exceptional increase in performance per price, with minimal risk of negative impact |
Web Based Applications (Java) | +7% | DeCapo, Renaissance | RECOMMENDED - Exceptional increase in performance per price, with minimal risk of negative impact |
Content Creation (Video Encoding, Image Processing) | +6% | Graphics-Magick, gimp, gegl | RECOMMENDED - Exceptional increase in performance per price, with minimal risk of negative impact |
Video Rendering |
+5% | Blender, C-Ray | NOT RECOMMENDED - Despite having marginal increase in performance per price, limited core count can become disadvantageous |
Databases (Excluding Enterprise class) |
+4% | Redis, RocksDB, Cassandra | NOT RECOMMENDED - Despite having averaged increase in performance per price, too much variance occurred for tested DBs, as some DB had large decrease in performance |
Compress |
+4% | 7-Zip, XZ | NOT RECOMMENDED - Despite having marginal increase in performance per price, lower core frequencies can become disadvantageous |
Compile |
+1% | Build GCC, Build LLVM, Build PHP | NOT RECOMMENDED - Despite having marginal increase in performance per price, lower core frequencies can become disadvantageous |
Memory (Bandwidth and Latency) | -1% | STREAM, RAMSPEED | NOT RECOMMENDED - There is limited-to-no increase in performance per price |
HPC | -2% | NPB, NAMD, GROMACS, DGEMM | NOT RECOMMENDED - There is limited-to-no increase in performance per price |
Conclusion
AMD four-channel optimized CPUs can provide great value for various workloads and should be considered by customers that prioritize a lower TCO as an alternative to AMD eight-channel optimized CPUs.

Validation of SNAP I/O Performance on Dual-Socket PowerEdge Rack Servers
Mon, 16 Jan 2023 13:44:27 -0000
|Read Time: 0 minutes
Summary
Using Non-SNAP IO communication paths for one-NIC dual-socket servers increases UPI overhead, which slows down bandwidth and increases latency for CPU applications. Resolving this by adding another NIC card will increase solution TCO. The adoption of SNAP I/O allows a dual-socket server to bypass traversing the UPI lanes when using one- NIC configurations, ultimately increasing performance and TCO for one-NIC dual socket solutions. This DfD will measure the performance readings of SNAP I/O against two Non- SNAP I/O configurations to demonstrate how using SNAP I/O can increase bandwidth, reduce latency and optimize user TCO.
SNAP I/O Value Proposition
Dual-socket servers offer ample compute power to meet the needs of a wide range of workloads. However, if the network adapters in the system are unbalanced, users may be at risk of creating a bottleneck that will reduce bandwidth and increase latency. SNAP I/O is a solution which leverages Mellanox Socket Direct technology to balance I/O performance without increasing the TCO. By allowing both CPUs to share one adapter, data can avoid traversing the UPI inter-processor link when accessing remote memory.
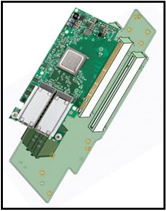
Figure 1: SNAP I/O Card
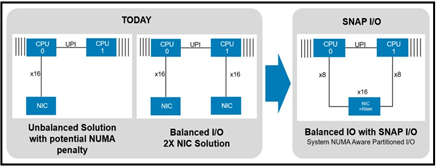
Figure 2: Comparing an unbalanced one-NIC solution and a balanced two-NIC solution to a SNAP I/O one-NIC solution. The SNAP I/O solution on the right allows CPU 0 and 1 to communicate to their corresponding NIC card without traversing the UPI channels, therefore reducing latency/TCO and freeing up UPI bandwidth for applications
As seen in Figure 2, the unbalanced configuration has CPU 0 in direct communication with the NIC through a PCIe x16 slot, while CPU 1 must traverse the UPI channel to CPU 0 first before it can communicate with the NIC. This data travel path adds latency overhead when traversing the UPI channel and can impact total bandwidth at high speeds. One solution to this is to have an additional NIC card connected directly to CPU 1, but this solution will introduce a 2x cost multiplier, including a 2nd NIC card, cable and switch port. Rather than doubling NIC and switch costs, Dell SNAP I/O can bridge the two sockets together by splitting the PCIe x16 bus into two x8 connectors and allowing the OS to see it as two NICs.
Test Scope and Configurations
To characterize performance variances, two testing devices were configured (see Figure 3). The SNAP I/O configuration used the PowerEdge R740 while the unbalanced one-NIC configuration and balanced two-NIC configuration used the PowerEdge R740xd. Aside from the chassis form factor and SNAP I/O riser, both pieces of apparatus were configured identically so the comparison was apples- to-apples.
Two test platforms were used to measure network bandwidth, latency, UPI utilization and CPU utilization. The first set of tests measured performance for an OS test scope, including benchmarks like iperf, qperf, Pcm.x and top. The second set of tests measured performance for a Docker test scope, including benchmarks like iperf3 and qperf.
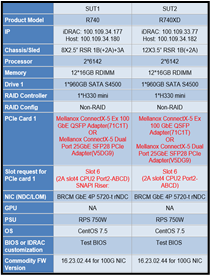
Figure 3: Table displaying the two pieces of apparatus used for testing
Performance Comparisons
Latency
Figure 4 used the OS-level qperf test tool to compare the latency of the SNAP I/O solution against two benchmarks; the first being the NIC connected to the PCIe bus local to the CPU, and the second being the remote CPU that must cross the UPI to connect to the NIC. The graph shows that for both 100GbE and 25GbE NICs, the SNAP I/O latency is reduced by more than 40% compared to the latency experienced by the remote CPU accessing the single NIC.
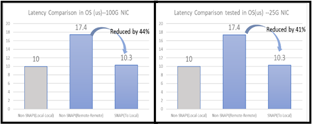
Figure 4: OS latency (in µs) of various configurations; local CPU, remote CPU and SNAP I/O
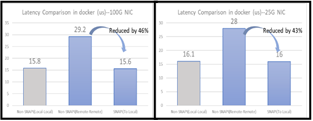
Figure 5: Docker latency (in µs) of various configurations; local CPU, remote CPU and SNAP I/O
Figure 5 compares the latency of the SNAP I/O solution against the same two configurations in the docker environment. Like Figure 3, the graphs show that the latency of the SNAP I/O solution has reduced by more than 40% compared to the latency experienced by the remote CPU.
Bandwidth
Figure 6 to the right compares the bandwidth of the SNAP I/O against the same two configurations by applying 5 stream memory tests to ensure there is enough UPI traffic for accurate iperf bandwidth testing. The graphs show that for 100G NICs, the bandwidth of the SNAP I/O solution compared to the bandwidth of the remote CPU has improved by 24% for OS testing and by 9.2% for docker testing.
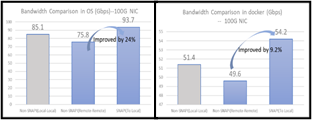
Figure 6: OS/Docker bandwidth (in µs) of various configurations; local CPU, remote CPU and SNAP I/O
UPI Utilization
UPI traffic exists because the CPUs are communicating tasks to each other, constantly working to keep up with user requests. SNAP I/O relieves the UPI of additional overhead by supplying a direct path to both CPUs that doesn’t require UPI traversing, therefore freeing up
UPI bandwidth. It should come as no surprise that SNAP I/O UPI traffic loading utilization is as low as 7%, while standard riser UPI traffic loading utilization is at 63%.
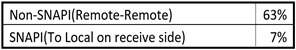
Figure 7: Comparison of UPI traffic loading percentages
CPU Utilization
While iperf was running for latency/bandwidth testing, the CPU utilization was monitored. As we can see in Figure 8, the SNAP I/O and Non-SNAPI sender- remote utilization are identical, so SNAP I/O did not have any impact here. However, the receiver-remote utilization underwent a significant improvement, seeing the Non-SNAPI configuration reduce from 55% use to 32% use when configured with SNAP I/O. This is due to the even distribution of TCP streams reducing the average cache miss count on both CPUs.
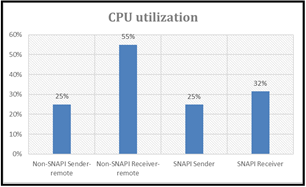
Figure 8: Bar graphs comparing CPU utilization of sender and receiver remotes for non-SNAP I/O and SNAP I/O configurations
Who Will Benefit from SNAP I/O
Using SNAP I/O to improve latency is most useful when the total cost of ownership (TCO) is priority, while maximum bandwidth and card-level redundancy are not. Customers using a 100GbE NIC that need more than 50Gb/s per CPU, or require two-card redundancy, may consider using a two-card solution to achieve the same latency. SNAP I/O should be used in environments where low latency is a priority and single-NIC bandwidth is unlikely to be the bottleneck. Environments such as containers and databases will thrive with SNAP I/O configured, whereas virtualization environments are not yet compatible with the SNAP I/O riser.
Conclusion
Dual-socket servers using a Non-SNAP I/O riser configuration may suffer from unbalanced I/O or a higher TCO. Having data travel from the remote socket across the UPI channel to reach the NIC introduces additional overhead that can degrade performance.
SNAP I/O solution provides an innovative riser that allows data to bypass the UPI channel, achieving a direct connection to a single NIC for two CPUs. As seen throughout this tech note, using a direct connection will deliver higher network bandwidth, lower latency, lower CPU utilization and lower UPI traffic. Additionally, the SNAP I/O solution is more cost-effective than purchasing a second NIC, cable and switch port.

Transactional Database Performance Boosted with Intel® Optane™ DC Persistent Memory
Mon, 16 Jan 2023 13:44:28 -0000
|Read Time: 0 minutes
Summary
An efficient transactional database running large amounts of information requires heavy-duty hardware performance that can support an optimized workload output. Dell EMC PowerEdge R740xd servers configured with Intel® Optane™ DC Persistent Memory were able to execute more transactions per minute than configurations with NAND flash NVMe drives or SATA SSDs.
The Advantage of Application Direct Mode
Intel® Optane™ DC Persistent Memory Modules (DCPMMs) have two different modes with unique advantages; Application Direct mode and Memory mode. Application Direct mode allows for OS and applications to register DCPMMs as persistent memory, while Memory mode allows for increased memory capacity over traditional DIMMs. This technical brief will focus on the advantages of using Application Direct mode.
 Figure 1: The 8Rx4 PC4-2666V DCPMM has a DRAM form factor but functions as both a memory and storage technology
DCPMMs working in Application Direct mode can drive change in the following ways:
- Memory persistence is enabled; In-memory data will remain intact throughout power cycles
- Memory is read as storage; Operations can be directly performed on storage class memory instead of having to go through the time- consuming file system and storage system software layers
- Memory capacity increase; DCPMMs increase memory capacity over traditional DIMMS by roughly 50%, therefore increasing the overall capacity.
Testing was conducted to quantify the value of Microsoft SQL2019 by comparing the performances measured while running DCPMM, NVMe and SATA drive configurations.
The Testing Conditions
A Dell EMC PowerEdge R740xd server ran four storage configurations to compare performance readings:
- 12 Intel D3-S4510 SATA SSDs (capacity of 1.92 TB each)
- 2 Intel P4610 NVMe SSDs (capacity of 1.6 TB each)
- 4 Intel P4610 NVMe SSDs (capacity of 1.6 TB each)
- 12 Intel 8Rx4 PC4-2666V DCPMMs (capacity of 256 GB each)
NVMe SSDs did not exceed four drives because the processor had reached full utilization at four and bottlenecked performance for additional drives. VMware vSphere ESXi™ software was chosen to use the DCPMMs in App Direct mode (as this recognizes the new technology and allows its persistence capabilities). vPMEM mode was chosen to give the OS and applications access to persistence. A TPC-C like workload was derived to simulate a database application that mimics a company with warehouses, parts, orders and customers, with the benchmark reporting performance in transactions per minute.
Each storage configuration ran the number of workloads required to achieve full storage saturation while fully utilizing the CPU. Tests were run and recorded three times with each test running for a total of 45 minutes, while only the last 15 minutes of each run was recorded as the system was at a steady-state. Results were then averaged and compared as transactions per minute (TPM).
The Proof of Concept
Intel® Optane™ DCPMMs showed significant performance gains compared to other storage devices, with
11.3x the TPM of 12 SATA SSDs, 2.2x the TPM of 2 NVMe drives and 1.7x the TPM of 4 NVMe drives. See Figure 2 below for graphical test results:
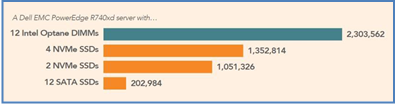
Figure 2: Median TPMs for each storage configuration
The Future Impact of App Direct Mode
The test results validate that using DCPMMs can bring newfound value to the server market that is worth investing in. With persistence and bus lane speeds boosting performance, DCPMMs were proven capable of running 1.7x greater TPMs when compared to four NVMe SSDs and 11.2x greater TPMs when compared to twelve SATA SSDs. MSFT SQL 2019 is a fitting first entry to evangelize the value of DCPMMs, and as the next data decade unfolds, so will more opportunities to push the standards of server technology.
To read the full whitepaper publications, please access the below links:
https://principledtechnologies.com/Dell/PowerEdge-R740xd-Intel-Optane-science-1019.pdf
https://principledtechnologies.com/Dell/PowerEdge-R740xd-Intel-Optane-1019.pdf

The Advantages of Configuring a PowerEdge Server with Agnostic SSD Drives
Mon, 16 Jan 2023 13:44:28 -0000
|Read Time: 0 minutes
Summary
Dell EMC gives customers the option to purchase an Agnostic (Dell Branded), SSD drive with their PowerEdge server configuration. Although some customers prefer specific SSD vendors, most PowerEdge owners do not prefer one brand name over another, especially when they benefit from picking agnostic offerings This DfD debriefs why agnostic drives are included as an option and highlights how PowerEdge customers benefit from going agnostic with their SSD drive selection.
What is an Agnostic Drive?
When configuring a PowerEdge server with components, Dell EMC prefers to give customers ample solid-state drive (SSD) options to meet their server requirements. These choices have traditionally consisted of approved drive vendors, such as Intel or Samsung, but now include one more alternative; agnostic (Dell-branded) SSDs.
The underlying concept is that without an agnostic choice to select, customers may be subject to trade-offs associated with a specific brand, such as prolonged lead times or premium pricing. By purchasing a large pool of SSD hardware from approved vendors, Dell EMC can provide a drive configuration with minimal trade-offs. The primary drawback of agnostic is that customers can’t pick the exact drive brand they want. However, this strategy is advantageous for the 65% of customers who do not prefer one brand name over another or are willing to disregard brand name for the advantages that will be discussed within this paper.
Rigorous Validation
Agnostic SSD drives are put through the same rigorous qualification process as vendor-specific drives. First, the manufacturing process is heavily scrutinized for quality standards, including quality control processes that will confirm every drive is compatible with all other components installed in PowerEdge servers. Then once within a server, each drive must meet the exact specifications for performance, duty cycles, mean time between failure (MTBF) and rotational vibration to pass reliability testing standards and move forward for sales distribution. Additionally, once off the shelf, a full history report for traceability is available in case proactive replacement is needed.
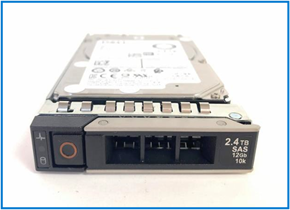
Figure 1: Agnostic (Dell Branded) SSD
Dell Firmware
Similarly, both agnostic and branded drives have Dell firmware installed that enhances PowerEdge servers in the following ways:
- Mode page settings that are compatible with PowerEdge Raid Controller (PERC) & Dell HBA
- Proprietary VPD page for system inventory management and quality tracking
- Support for live firmware updates and compatibility with Dell Update Package (DUP)
- Tuned to PowerEdge hardware for optimal performance, stability and reliability
Improved Supply Chain
The agnostic SSD supply chain model focuses heavily on mitigating the possibility of a supply disruption by purchasing large volumes of SSD drives from approved vendors. Approved SATA drive vendors include Micron, Intel, Kioxia (previously Toshiba), Hynix and
Samsung, while the approved SAS drive vendors include Kioxia, Samsung and Western Digital. By working with multiple vendors, Dell EMC can keep a constant supply of drive configurations in stock, which may enable significantly reduced lead times.
Reduced Price
Purchasing large volumes of SSD drives introduces greater pricing competition between vendors. Because Dell EMC manages all software processes, any major vendor differentiators aside from the hardware are eliminated. This allows for a more aggressive pricing landscape for vendors trying to sell drives in volume.
The pricing reduction of agnostic drives compared to vendor-specific drives presents significant savings. The exact savings will vary based on several factors, such as the drive size, type and market timing. Agnostic SSD prices can range from 10% to 30% less than vendor-specific list prices, with the savings percentage generally increasing with the drive size. Most Dell EMC customers can expect to average about a 15% drive price reduction when choosing agnostic.
Figure 2: Various agnostic drive approved
Conclusion
Dell EMC offers customers more options with the inclusion of agnostic SSD drives. Configuring a PowerEdge server with agnostic SSD drives ensures shortened lead times, significant price reductions, and consistent implementation.
Broadcom Emulex Gen 7 FC HBA has Significantly Improved Performance over Gen 6
Mon, 16 Jan 2023 13:44:28 -0000
|Read Time: 0 minutes
Summary
As the adoption of All-Flash Arrays (AFA) over Fabric for the public cloud continues to grow, server HBA standards must steadily rise to ensure maximum workload performance and security are intact. Dell EMC and Broadcom have partnered together to test the new Gen 7 Emulex HBA and compare its performance to the previous generation. The results serve to be a reminder that data center networking can quickly and critically impact system performance in our rapidly evolving technical climate.
Gen 7 FC HBA
Data centers are undergoing a transformation with the emergence of all- flash arrays (AFAs), faster media types and more efficient ways to access media. These forms of storage deliver record speeds and lower latencies to significantly improve application performance. One key technology that is driving this rapid evolution is NVMe over Fabrics (NVMe-oF). Swift speeds have proven the value of running AFAs over Fabrics, and now networking HBA’s are being further developed to avoid bottlenecking performance. The latest storage networking standard, Gen 7 FC (Fibre Channel) HBA, provides the ideal combination of performance improvements plus features to support this data center transformation, while maintaining backward compatibility with existing Fibre Channel infrastructure.
These bold claims of performance, security and efficiency improvements over the previous generation compelled Dell EMC to dive deeper, in hopes that our latest PowerEdge products would utilize Gen 7 to achieve significant read/write IOPS (I/O Operations per Second) within a flash- oriented datacenter. To determine the latency and read/write performance advantages compared to its Gen 6 predecessor, three tests were conducted with the newest Emulex Gen 7 LPe35000-series HBAs (Host Bus Adapters) by Broadcom.
Figure 1: Emulex Gen 7 LPe35000-series LPe35002
Test Procedure and Results
To measure Gen 7 HBAs latency improvement, two important interfaces of the HBA were prepared: The Fiber Channel port as it connects to the SAN, and the PCIe interface of the host computer. Two protocol logic analyzers were used on each connection with synchronized clocks to ensure that both analyzers measured the timing of a full iteration (from when a FC frame is received at the HBA FC port until it was converted to the PCIe protocol).
To measure Gen 7 HBA write IOPS improvement, both HBA performance metrics were compared in an Oracle Database 12c server with data stored on a NetApp AFF A800 all-flash array. HammerDB benchmark was used to simulate an OLTP client load of 128 virtual SQL transaction users to a 500GB TPC-C- like dataset representing 5000 warehouses.
Gen 7 has ~1/3 latency of Gen 6 (Figure 2)
The fast path hardware architecture design reduces average hardware latency to one third of the latency seen in the previous generation Gen 6 HBA. This dramatic reduction in latency impacts every frame that moves from the SAN to host PCIe bus in either direction as it passes through the HBA.
Gen 7 has ~3x greater read & write IOPS (Figures 3 and 4)
Running synthetic, I/O workloads, Broadcom Emulex Gen 7 HBAs delivered nearly 3x as many IOPS across two ports in both the read and write tests. This serves as an excellent example of the increased application value gained through updating HBA’s on an already existing server and storage investment.
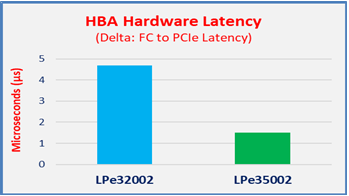
Figure 2: Gen 7 has 1/3 the latency of Gen 6, which is better
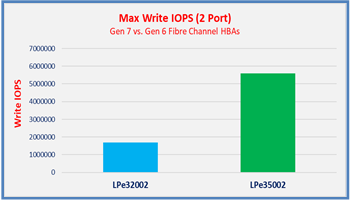
Figure 3: Gen 7 significantly outperforms Gen 6 for Write IOPS
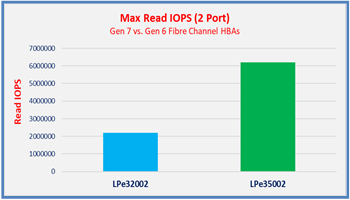
Figure 4: Gen 7 significantly outperforms Gen 6 for Read IOPS
Additional Improvements to Gen 7
- Trunking: Supports up to 64GFC on a single port by aggregating multiple physical ports to form a single, logical, extremely high-bandwidth port.
- Supports PCIe 4.0: Gen 7 is the first HBA with PCIe 4.0 supporting 2x the bit transfer rate compared to PCIe 3.0
- Enhanced security with support for Dell Cyber-resiliency: Checks for authentic firmware every time the system is booted and before installing any new firmware.
In Conclusion
The test results point to the conclusion that servers using a dense number of high speed storage devices, such as Dell EMC AFAs, NVMe devices, or Connectrix 32GFC switches, could be under-optimized if using an outdated HBA. By updating the previous Gen 6 FC HBA to the current Gen 7 FC HBA, users ensure that their networking components are not limiting the optimal performance that the PowerEdge system was built to yield.
Notes:
- ESG, 2019 Data Storage Predictions, 1/7/2019
- Demartek Evaluation, Emulex Gen 7 Fibre Channel HBAs by Broadcom, 12/2018

PowerEdge Servers and Deep Learning Domains: The Impact of Scaling Accelerators
Mon, 16 Jan 2023 13:44:28 -0000
|Read Time: 0 minutes
Summary
With deep learning principles becoming a widely accepted practice, customers are keen to understand how to select the most optimized server, based on GPU count, to accommodate varying machine and deep learning workloads. This tech note delivers test results that portray how scaling NVIDIA GPU’s on PowerEdge server configurations will impact performance for various deep learning domains, and how these results outline general guidelines for constructing an optimized deep learning platform.
Evaluating Performance Using MLPerf Benchmark
To accurately harvest Artificial Intelligence (AI) performance data it is critical to select a benchmark that is qualified to accurately test multiple domain types. MLPerf is a new and broad Machine Learning (ML) and Deep Learning (DL) benchmark suite that is gaining popularity and adoption for its multi-domain capabilities and representative models. The current version (v0.5) covers five domains associated with AI subsets, as seen in Figure 1: image classification, object detection, language translation, reinforcement learning and recommendation.
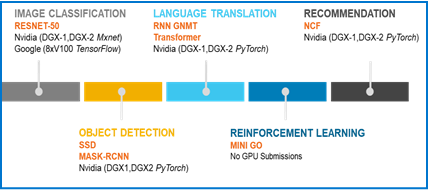
Figure 1: Domains covered within the MLPerf v0.5 benchmark
For each given domain, MLPerf will measure performance by assessing and comparing total training times; the amount of time that it takes to train a neural net model for a given domain to reach target accuracy. Dell EMC team benchmarked various PowerEdge servers that have GPU compatibility to help customers pick the appropriate GPU infrastructure that will achieve their requirements. We used multi-GPU training to highlight the shortest amount of training time needed to reach target accuracy the fastest for the MLPerf.
Server | # of CPU's | # of GPU's | GPU Type | GPU Interconnect |
DSS 8440 | 2 | 8 | V100 (16GB) | PCIe |
PE T640 | 2 | 4 | V100 (32GB) | PCIe |
PE R740 | 2 | 3 | V100 (16GB) | PCIe |
Precision 5820 | 1 | 2 | GV100 (32GB) | PCIe |
Every benchmark ran on single node PowerEdge servers, as seen in Figure 2. Each server was loaded with either 2, 3, 4 or 8 Tesla V100 PCIe GPU’s, and these configurations ran until the unique domain being tested reached the target accuracy. By comparing these configurations, we can deduce the performance increase per domain when additional GPU’s are included.
MLPerf scores were calculated by exhibiting the total training times of each configuration relative to the reference accelerator, one NVIDIA Pascal P100. Each score indicates that the Tesla GV/V100 server is that many times faster than the Pascal P100. This methodology ensure consistency amongst each platform so that each scaled score remains accurate.
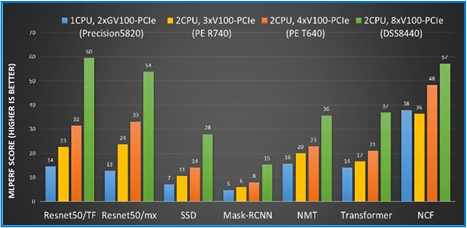
Figure 3: MLPerf benchmark scores calculated against the reference accelerator (one NVIDIA Pascal P100)
The first notable observation is the variance in training times for each domain. Recommendation, Reinforcement Learning and Language Translation DL consistently require the most training time for completion, while Object Detection and Image Classification appear to take half as long. This illustrates the varying learning difficulties associated with each DL domain. Furthermore, we learn from observing Figure 3 that Image Recognition (Resnet50) and Object Detection (Mask-RCNN) domains scale linearly; we can assume that when the GPU count increases than the speedup times decrease at a linear rate. Translation (NMT) and Recommendation (NCF) domains, on the other hand, were not as predictable. The bar graphs for Translation scores almost seems to scale quadratically and the Recommendation scores appear to not scale beyond 2 GPU’s (it is an artifact of the dataset being too small which is being fixed in a later version of MLPerf).
Recommendations
The training times and scaling behavior vary between different domains and models
- Using superior accelerators would be advantageous for the domains that require the most time
- In order to pick the appropriate server and number of GPU’s, it is useful to understand the models and domains being used.
Increasing GPU’s scales performance at a near linear rate for Image Recognition and Object Detection domains
- Servers with higher GPU counts will linearly reduce training time for these domains. Scaling to 4 GPUs using NVLink appears to be the sweet spot from an efficiency stand point.
Increasing GPU’s does not scale performance at a linear rate for Translation and Recommendation domains
- Servers with higher GPU counts will not linearly reduce training times for these domains due to data set or computation/communication ratios. However, using larger GPU counts is still useful to meet time to solution as the training time is reduced across these models.
Conclusion
Optimizing a platform for ML/DL workloads goes far beyond scaling the accelerators; every variable must be considered and there are a plethora of them. Fortunately, Dell EMC is committed to designing PowerEdge servers with GPU counts that cater to specific ML/DL domains, thereby reducing these variables for a smooth and simple customer experience. This tech note provided insight on how the accelerator model, accelerator count, and domain type are influenced by unique PowerEdge server models, and more importantly how customers can make the best decisions to perform their required ML/DL workloads at full throttle.

The Future of Mobile 5G Radio Networks and Why Dell is Looking Ahead
Mon, 16 Jan 2023 13:44:28 -0000
|Read Time: 0 minutes
Summary
Communication service providers are envisioning increased demand for mobile services including media and content delivery, mobile gaming, virtual reality and connected vehicles. To satisfy this emerging demand, the buildout of a 5G cellular infrastructure has commenced. This tech note explores how computing platforms could have an integral impact on the future framework of the mobile 5G cellular infrastructure, as well as how the confluence of FPGA accelerator technologies within Edge servers would enhance computing performance to support these radio network workloads.
The Transition from 4G to 5G
With mobile technology often substituting as the modern day primary computing resource, the demand for increased mobile services has propelled mobile providers to recognize that 4G LTE mobile infrastructure is no longer adequate. A traditional 4G LTE radio access network diagram is shown below in Figure 1. At the heart of this is the baseband unit (BBU), which provides the backhaul interface to the mobile network core and the front haul interface to the remote radio head (RRH).
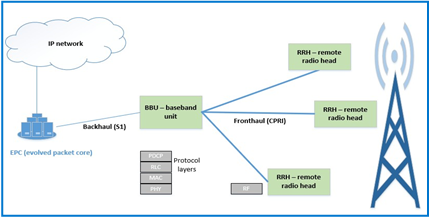
Figure 1: Traditional 4G LTE radio access network infrastructure
One of the obstacles to widespread deployment of new wireless networks is the potential cost of customized equipment. Instead of utilizing standard IT equipment, such as servers or switches, functions in these networks have traditionally been performed by purpose-built devices. Using these proprietary components eliminates a simplified path to increasing performance at a fluid and scalable trajectory.
These insights served as a catalyst to the NFV (Network Functions Virtualization) movement. The goal of NFV is to standardize the telecommunications network infrastructure by steadily introducing an ecosystem of server technology. One of several visions of NFV is to implement the BBU functions using servers. As seen in Figure 2, a C-RAN (Centralized Radio Access Network) can use a Centralized Unit (CU) and distributed Units (DU) for baseband processing.
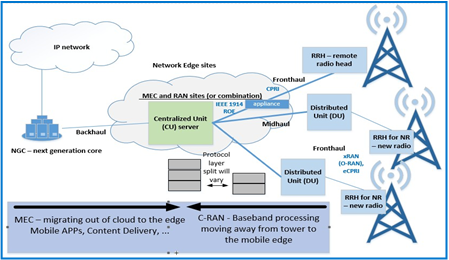
Figure 2: Design concept for 5G; substituting the BBU with C-RAN, composed of a CU (centralized unit) server and multiple DUs (distributed units)
Technical Value Propositions of NFV
Transitioning from a traditional infrastructure to C-RAN would lower the total cost of ownership, improve system capacity utilization, and offer a path to performance improvement at the cell edge. Detailed value propositions explaining the primary design and use case variances between Figures 1 and 2 are listed below:
- The protocol stack implemented by the BBU can be split in different ways between a Centralized Unit (CU) and a Distributed Unit (DU), with different implications and tradeoffs for bandwidth and latency. By moving the Physical (PHY) layer to a DU, bandwidth on the front haul is greatly relieved compared to the Common Public Radio Interference (CPRI) implementation which entails sending time domain radio samples over the interface.
- Because of the various possibilities in splitting the protocol between the CU and DU, emerging standards are evolving to define the new front haul interface. The standard defined by the xRAN consortium, absorbed into the ORAN Alliance, is one example.
- New 5G technology will coexist with 4G LTE radio devices. In places where CPRI is perpetuated with legacy equipment, controllers for these locations will be co-located with controllers for the new technology. One benefit of servers handling this workload is that the same equipment can handle either scenario with different software.
- The development of these centralized sites will provide a means for deployment of Multi-Access Edge Computing (MEC). This will increase the richness and quality of service of the endpoint use cases already cited.
- C-RAN enables Coordinated Multipoint Transmission (CoMP); a technique to increase cell edge coverage and throughput through scheduling. By providing connections to several base stations at once, data can be passed through the least-loaded base stations for better resource utilization. On the receiver side, performance can be increased by using several sites to selectively use the best signal, which can change rapidly due to multipath fading. Also, centralizing mobility and traffic management decisions can lead to fewer handoff failures and less network control signaling, which can also be a potential savings with less need for inter-base station networks.
Despite an array of positive trade-offs, the C-RAN model is still slow to evolve as a mainstream implementation. Of prime importance is the quality of service provided by current and future mobile networks, and with the deployment of servers into these networks, predictable computing performance is required. In most cases, software-based solutions that utilize standard CPUs will be adequate. In some cases, the most efficient use of resources to deliver needed bandwidth and latency may require hardware-assisted acceleration. An example of a computing step performed by the BBU was investigated for suitability in an FPGA (field programmable gate array) peripheral. In house testing at Dell EMC was conducted to quantify the performance gains when using FPGA accelerators for turbo offloads, as shown below:
Performance Gains When Using FPGA for Turbo Offload
Intel’s FlexRAN is a software reference solution that implements Layer 1 of the eNodeB function of an LTE network. At Dell EMC, an end-to-end test platform was created using FlexRAN as the basis for the Layer 1 software of a radio equipment controller baseband unit. The system running FlexRAN was a PowerEdge R740 equipped with a predecessor version of the N3000 network card. For the FPGA offload, patches released in versions 19.03 were introduced along with DPDK patches for BBDev. The complete test apparatus is illustrated in Figure 3:
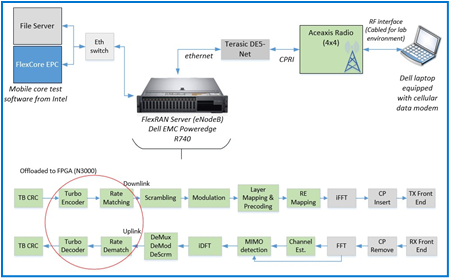
Figure 3: Test apparatus to test CPU utilization with and without offload
As seen in Figure 4, system performance was predictably improved with the FPGA Turbo offload. By enabling system accelerators to perform some of the workload, the CPU experienced nearly half of the cycles required for uplink and downlink layer 1 PHY processing; this implies that the CPU is being utilized twice as much as before. The CPU cycles in the graph were normalized to show the relative quantity used before and after the offload; the exact number of cycles may vary due to several factors; however, it should also be noted that the variation of average to maximum consume cycles in the Turbo Encode operation after the offload was introduced decreased by 86%. The jitter improvement will translate into more predictable latency.
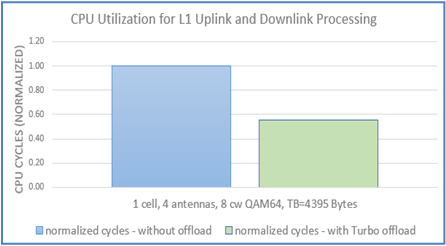
Figure 4: Bar graph demonstrating the improvement of CPU cycles when using FPGA accelerator to offload for various configurations
Conclusion
As the advancement to 5G progresses, it seems undeniable that the improved cost-effectiveness, scalability, flexibility and eventually, performance, of computing platforms will outweigh the trade-offs incorporated with changing an already immense and established infrastructure. Dell EMC is preparing for this inevitable transition from the traditional proprietary Radio Access network (RAN) infrastructure into a NFV server ecosystem by identifying and exploring the benefits, challenges and use cases associated with implementing computing platforms for mobile 5G radio networks.

Next Generation PowerEdge Servers Implement Eco-Friendly DesignStrategies
Mon, 16 Jan 2023 13:44:29 -0000
|Read Time: 0 minutes
Summary
By increasing efficiencies, removing excess material, and standardizing design concepts, Dell EMC has continued to refine how to effectively contribute to the eco-friendly movement. This tech note highlights a few of the design strategies that have been implemented for PowerEdge servers that preserve resources and reduce the overall footprint made when manufacturing products.
Eco-Friendly Strategies
To continue leading the movement for more eco-friendly server designs, the Dell EMC Experience Design Group developed PowerEdge servers focusing on front-to-back efficiency and start-to-finish thoughtfulness. By leveraging collaborative resources and collective energies on following these two ideals, the following achievements were made in server resource preservation and footprint reduction.
Efficient Design; From Front to Back
Efficient design focuses on maximizing the amount of work that can be done with the least amount of resources possible. Following this strategy ensures that no space, energy or opportunity is wasted in each box. Customers benefit from a solution that has been designed to output as much work as possible, therefore optimizing the total number of servers needed to meet their data center needs.
PowerEdge Efficiency Achievements
- Drive carrier rail structures now have thin folded metal edges that allow for increased airflow throughout the server chassis. Additionally, the motherboard design has been modified to a T- shape that better organizes airflow distribution throughout the server structure. These design modifications improve fan and power supply usage which reduces total power consumption.
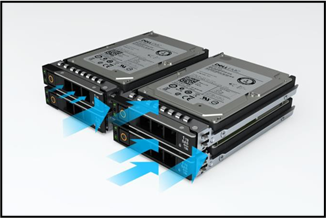
Figure 1: HDD carrier design allows for additional airflow to circulate through the structure
- Refined front-end perforation patterns more effectively prevent the buildup of dust around intake and exhaust vents as well as within the system. This improvement in airflow and fan performance reduces power consumption and enhances energy efficiency. Therefore, PowerEdge products can be further populated with valuable hardware as the efficiency of cool air has increased throughout the box.
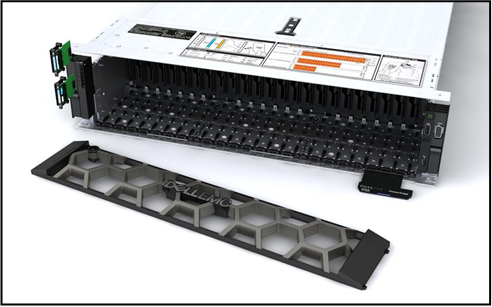
Figure 2: Front facing visual of the perforation patterns and IO port locations for the PowerEdge R740
- I/O ports were relocated from within the chassis to the rack ears. Implementing this design change enabled more drive space within the box that customers can utilize for additional capabilities.
Thoughtful Design; From Start to Finish
Thoughtful design focuses on making conscious efforts to create positive environmental impacts, such as reusing resources to minimize the global footprint. PowerEdge servers prioritize thoughtfulness over inconsequential aesthetics to protect and preserve the environment and its future.
PowerEdge Thoughtful Achievements
- Paint was removed from the front end of the server, hard drive carriers and the rear handles. The front end of the server uses hemmed edges to conceal the metal edges, thereby eliminating any need for paint, enhancing the chassis structure, as well as enabling IO components to relocate to the rack ear. Hard drive carriers use a natural finish stainless steel, which reduces the volume of paint used on each server and improves signal integrity. Lastly, the rear handles utilize a die cast process with a bead blast finish as an alternative to using paint. These design changes allowed harmful paints to be removed from multiple processes, therefore producing less air pollutants.
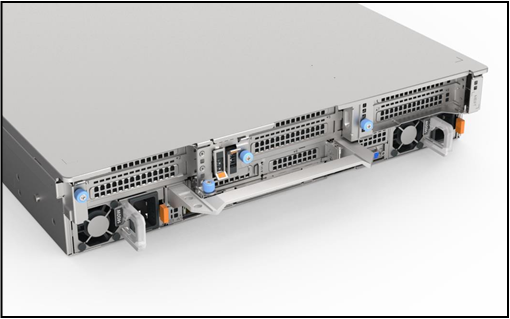
Figure 3: Rear handles are no longer painted, but rather leverage a bead blasted die cast to ensure handle quality remains superb over thousands of cycles.
- Black plastics contain up to 30% recycled resin. Internal components such as latches, air shrouds and casings now use recycled plastics to reduce the production of excess undesired plastics that pollute the oceans and harm our ecosystem.
- Designs are being standardized across the PowerEdge portfolio. Standardizing primary components, such as the chassis, rails and guards, means less prototyping and tooling is required, which must use a small yet significant amount of toxic metal material that will eventually become waste. By moving forwards with a standardization approach, prototyping will be needed much less frequently, and tooling can be reused.
In Conclusion
Dell EMC is committed to manufacturing servers with the future in mind and to make a positive impact on our surroundings. By efficiently and thoughtfully designing PowerEdge products, server technology can continue to advance while simultaneously helping preserve our environment.

Dell PowerEdge Servers: New PSU Layout Delivers Improved Airflow and PCIe Feature Set

Mon, 16 Jan 2023 13:44:29 -0000
|Read Time: 0 minutes
Summary
The next generation of PowerEdge servers brings a new Power Supply layout that allows for improved system cooling and helps enable support for Gen4 PCIe cards. Purchase with confidence, knowing that these system improvements help ensure that the next generation PowerEdge server continues to deliver best-in- class features.
Split Power Supplies
The layout of previous generations of Dell PowerEdge rack servers utilized two power supplies grouped on one side of the chassis. Dell’s next generation of PowerEdge servers improves the mechanical design with the two power supplies split – one on each side of the chassis. This new system and power supply layout offers several tangible benefits over the older system design.
Balanced Airflow
In prior generations, the location of the inner power supply was near the CPU exhaust airflow. Due to the proximity to the CPU, the PSU was continually exposed to air that is heated to high temperatures from moving through the CPU heatsink. With each new CPU refresh, power continues to increase and PSU cooling becomes exponentially more challenging. Additionally, the PSU location compounded the thermal challenges because it was also an obstruction to airflow moving freely through the CPU heatsink.
The split power supply placement in the next generation of PowerEdge servers allows for both low temperature airflow for PSU cooling and less obstruction for cooling high power CPUs. The result is that system airflow is balanced across the width of the system providing more uniform airflow for CPU, Memory, and PCIe cards in the rear of the chassis.
Support for Gen4 PCIe
One of the goals of the new architectures in the next generation of PowerEdge servers is to support faster I/O speeds, such as PCIe Gen 4, and beyond. PCIe Gen 4 doubles the lane speed to 16GT/s from the previous generation. A key element in PCIe performance is the length of PCIe traces. With the new system layout, a main goal was to shorten the overall PCIe trace lengths in the topology, including traces in the motherboard. By positioning PSU’s at both edges, the I/O traces to connectors can be shortened for both processors. This is the optimal physical layout for PCIe Gen 4 and will enable even faster speeds for future platforms. The shorter PCIe traces translate into better system costs and improved Signal Integrity for more reliable performance across a broad variety of customer applications.
Balanced Airflow Illustration
The illustration below shows the 14G Generation Server layout (left image) with PSUs located on one side of the chassis. In this layout it is evident that system airflow and PSU cooling are not optimized. In the 15th Generation layout on the right, the dual power are split, one on each side of the chassis. The split PSU layout helps to balance the system airflow, reduce PSU operating temperatures, and allows for PCIe Gen4 card support and thus an overall more optimal system design layout.
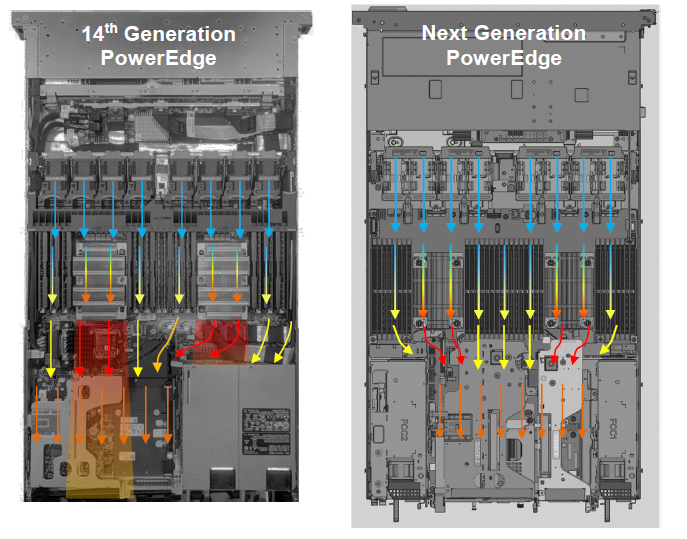
In Conclusion
PowerEdge servers continue to deliver best-in-class features. The new PowerEdge servers have the PSUs on both rear sides of the server, improving chassis airflow, overall thermal efficiency and allows for Gen4 PCIe card support.

New PCIe Gen4 Data Center NVMe Drives Offer Unmatched Value for PowerEdge Servers
Mon, 16 Jan 2023 13:44:29 -0000
|Read Time: 0 minutes
Summary
PCIe Gen4 Data Center NVMe drives challenge the existence of traditional SAS and SATA drives. This entry-level NVMe offering outperforms both SAS and SATA while retaining an affordable price that directly competes with SATA.
The purpose of this DfD is to educate readers on our new Gen4 Data Center NVMe offerings, including a brief history on the technology, a performance data comparison to SAS and SATA, and their value proposition in the market today. With this knowledge we hope our customers can make the best storage investment decision to optimize their PowerEdge servers.
NVMe Market Positioning
The NVMe host controller interface has been rapidly evolving since its inception less than a decade ago. By including high-performance, scalable technologies absent from both SAS and SATA interfaces, such as non-volatile (persistent) memory and the high-speed PCIe bus, NVMe was originally designed only as a premium storage offering and was priced to reflect that for several years. However, this novelty technology has become conventional. The shift inclined suppliers to optimize their processes to create more competitive price points. Now that the Gen4 Data Center NVMe drive has been introduced with both the high-performance and a more affordable price – is it time to start transitioning completely to NVMe?
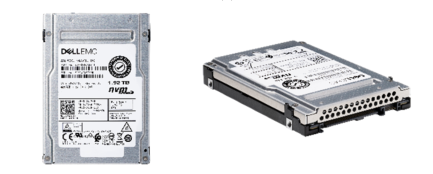
Figure 1 – Dell U.2 PCIe Gen4 NVMe SSD
Enterprise vs. Data Center NVMe
There are two classes of NVMe drives used in servers – Enterprise NVMe and Data Center NVMe SSD. Enterprise NVMe is the premium drive made for enterprise environments that run 24/7. This won’t be discussed, as its performance edge and enterprise features drive the price too high to compete with SAS and SATA at this time.
Instead, we will be focusing on the Data Center NVMe SSD. This vSAN-certified NVMe drive is tailored for scale-out/hyperscale environments where enterprise features, such as dual port and FIPS support, are not needed for the Data Center customer. This more targeted feature set, coupled with a lower-cost eight-channel controller, enables a more attractive price comparable to SATA. This high performance (see Figure 2) and lower price-point creates a clear and distinctive value proposition for this class of NVMe drive.
Interface | Capacity | Class | Seq. Read GB/s | Seq. Write GB/s | Random Reads - (4K) IOPs | Random Writes (4K)- IOPs |
RI NVMe | 1.92TB | Enterprise | 6.2 | 2.3 | 920 | 110 |
RI NVMe | 1.92TB | Data Center | 5.9 | 2.5 | 870 | 120 |
RI NVMe | 3.84TB | Enterprise | 6.2 | 3.45 | 1360 | 130 |
RI NVMe | 3.84TB | Data Center | 5.9 | 3 | 1050 | 150 |
RI NVMe | 7.68TB | Enterprise | 6.2 | 3.45 | 1360 | 130 |
RI NVMe | 7.68TB | Data Center | 5.9 | 3.5 | 1050 | 140 |
Figure 2 – Performance comparison of PCIe Gen4 Enterprise and Data Center NVMe SSDs
When comparing identical capacities of enterprise and data center NVMe drives, we can see that most performance readouts are very similar to one another, at around ±10%. Outliers do seem to exist, but they favor both sides. This indicates that the DC NVMe SSD does not sacrifice any significant amount of performance for its ‘entry-level’ price tag, but primarily its enterprise features. Thus, Gen4 DC NVMe is an excellent NVMe option for users who do not require the enterprise features.
Comparing Performance and Pricing
Here is where it gets really interesting. Pricing for identical NVMe drives remain relatively constant with each new generation. In this case, both PCIe Gen3 and PCIe Gen4 DC NVMe are priced nearly one-to- one, despite seeing significant performance gains with support for PCIe Gen4. This begs for some due diligence – with higher performance at cost parity, will Gen4 DC NVMe now expunge any remaining value proposition that may justify still using SAS or SATA in your PowerEdge servers?
To answer this question, we must first scrutinize the performance data. Figure 3 below shows how the performance readouts stack up and helps us understand the variances (highlighted in orange).
Swimlane |
Interface |
Capacity |
PCIe |
Model | Endurance (DWPD) | Seq. Reads (GB/s) |
| Seq. Writes (GB/s) |
| Random Reads - 4K (IOPs) |
| Random Writes - 4K (IOPs) |
|
Read Intensive | NVMe | 960GB | Gen4 x4 | Data Center Agnostic | 1 | 5.90GB/s |
| 1.40GB/s |
| 550K |
| 50K |
|
Read Intensive | SAS | 960GB | N/A | Dell Brand Agnostic | 1 | 1.02GB/s | 5.8x | 0.84GB/s | 1.7x | 184K | 3.0x | 34K | 1.5x |
Read Intensive | SATA | 960GB | N/A | Dell Brand Agnostic | 1 | 0.48GB/s | 12.3x | 0.44GB/s | 3.2x | 79K | 7.0x | 23K | 2.2x |
Read Intensive | NVMe | 1920GB | Gen4 x4 | Data Center Agnostic | 1 | 5.90GB/s |
| 2.50GB/s |
| 870K |
| 120K |
|
Read Intensive | SAS | 1920GB | N/A | Dell Brand Agnostic | 1 | 1.02GB/s | 5.8x | 0.95GB/s | 2.6x | 186K | 4.7x | 56K | 2.1x |
Read Intensive | SATA | 1920GB | N/A | Dell Brand Agnostic | 1 | 0.47GB/s | 12.6x | 0.44GB/s | 5.7x | 78K | 11.2x | 26K | 4.6x |
Read Intensive | NVMe | 3840GB | Gen4 x4 | Data Center Agnostic | 1 | 5.90GB/s |
| 3.00GB/s |
| 1050K |
| 150K |
|
Read Intensive | SAS | 3840GB | N/A | Dell Brand Agnostic | 1 | 1.02GB/s | 5.8x | 0.96GB/s | 3.1x | 189K | 5.6x | 57K | 2.6x |
Read Intensive | SATA | 3840GB | N/A | Dell Brand Agnostic | 1 | 0.48GB/s | 12.3x | 0.44GB/s | 6.8x | 79K | 13.3x | 25K | 6.0x |
Read Intensive | NVMe | 7680GB | Gen4 x4 | Data Center Agnostic | 1 | 5.90GB/s |
| 3.50GB/s |
| 1050K |
| 140K |
|
Read Intensive | SAS | 7680GB | N/A | Dell Brand Agnostic | 1 | 1.01GB/s | 5.8x | 0.96GB/s | 3.6x | 188K | 5.6x | 47K | 3.0x |
Figure 3 – Table comparing read and write performance for three storage mediums (Gen4 DC NVMe, SAS, and SATA)
Gen4 DC NVMe outperforms its competitors by a longshot for every metric, with a performance increase multiplier ranging from:
- 1.7x - 5.8x when compared to SAS
- 2.2x - 13.3x when compared to SATA
The sequential and random read numbers for Gen4 DC NVMe are excellent as expected, and the write IOPs have significantly improved and are even approaching Enterprise Mixed Use (MU) NVMe IOPs. Additionally, the endurance has also doubled from 0.5 to 1 DWPD (Drive Writes Per Day).
Pricing comparisons are a bit more complex to discuss accurately because they are always shifting and very sensitive. So, for this exercise, we will determine relative pricing percentages for vendor-agnostic models from our Q4 2021 price list. If Gen4 DC NVMe drives are the baseline (1.0x), then for the same capacity you will see an average price multiplier of:
- 1.43x for SAS
- 0.77x for SATA
Based on this performance and pricing we can conclude that there is no benefit in choosing SAS over Gen4 DC NVMe, because it is both more expensive and has much lower performance.
All that is left to determine is the value proposition of SATA. As mentioned earlier, SATA drives are still the most affordable form of storage medium on the market, at around 0.77x the price of Gen4 DC NVMe. However, there is still a bigger picture to craft when the data is analyzed at a deeper level. By calculating the performance-per-dollar (IOPs/$) for each capacity of Gen4 DC NVMe and SATA, we can get a better grasp on how effective each dollar spent really is. See Figure 4 below:
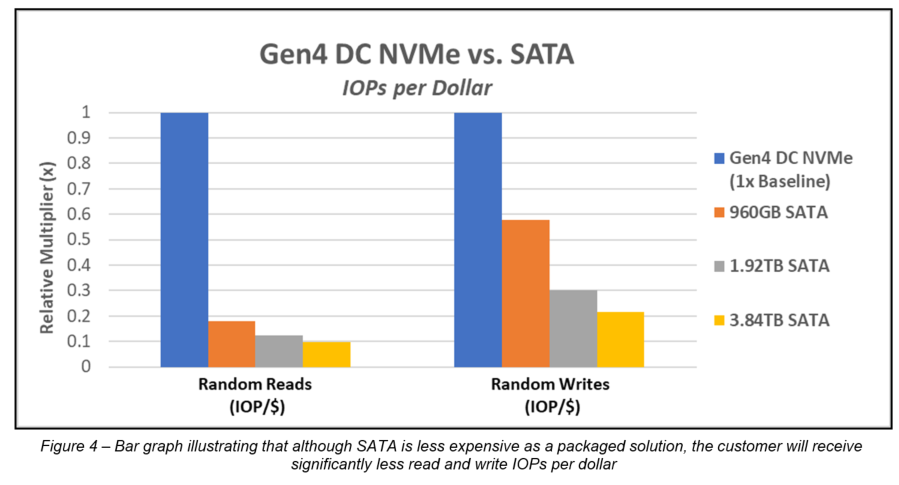
When the data is analyzed at this level, it becomes very apparent that each dollar spent on Gen4 DC NVMe goes way farther than it does with SATA. In the case of random read performance, each dollar spent on SATA will produce 0.1x - 0.2x as many IOPs as Gen4 DC NVMe would. In layman’s terms, this means that every dollar spent on SATA is nearly an order of magnitude less effective than Gen4 DC NVMe!
Final Thoughts
Now that the data has been presented and analyzed we can circle back to the original question - is it time to start transitioning completely to NVMe? Based on the high performance and very attractive price point, we believe that the Data Center NVMe drive has a clear and compelling value proposition for PowerEdge customers looking to invest in a scalable, forward-looking storage medium. However, customers that prioritize the lowest price possible will also find SATA to be a valuable solution.
- PCIe Gen4 Data Center NVMe is strongly recommended for most customer user cases. Budget-conscious customers should also consider that greater performance can be achieved at a lower price than SATA simply by scaling down the total number of Gen4 DC NVMe drives. With a performance output of up to 13.3x more than SATA while only being around 1.3x more expensive, customers can scale down the quantity of NVMe drives for the most cost-effective solution.
- SATA is recommended to customers where the lowest price is most important. As long as SATA holds its extremely low price, there will always be a target audience for this storage type. Customers that neither intend to scale, nor require high-performance, may certainly find this to be the best solution for their needs.
In conclusion, while SATA technology still brings value to the market through its extremely low price point, PCIe Gen4 Data Center NVMe technology has demonstrated that it is certainly the most cost-effective storage solution from a price-per-performance metric. Customers also have more flexibility with the option to increase performance and lower price by scaling down the total number of NVMe drives! Regardless, PCIe Gen4 Data Center NVMe technology has proven that for the time being it offers unmatched value to PowerEdge servers.

The Latest GPUs of 2022
Mon, 16 Jan 2023 13:44:30 -0000
|Read Time: 0 minutes
And How We Recommend Applying Them to Enable Breakthrough Performance
Summary
Dell Technologies offers a wide range of GPUs to address different workloads and use cases. Deciding on which GPU model and PowerEdge server to purchase, based on intended workloads, can become quite complex for customers looking to use GPU capabilities. It is important that our customers understand why specific GPUs and PowerEdge servers will work best to accelerate their intended workloads. This DfD informs customers of the latest and greatest GPU offerings in 2022, as well as which PowerEdge servers and workloads we recommend to enable breakthrough performance.
PowerEdge servers support various GPU brands and models. Each model is designed to accelerate specific demanding applications by acting as a powerful assistant to the CPU. For this reason, it is vital to understand which GPUs on PowerEdge servers will best enable breakthrough performance for varying workloads. This paper describes the latest GPUs as of Q1 2022, shown below in Figure 1, to help educate PowerEdge customers on which GPU is best suited for their specific needs.
GPU Model | Number of Cores | Peak Double Precision (FP64) | Peak Single Precision (FP32) | Peak Half Precision (FP16) | Memory Size / Bus | Memory Bandwidth | Power Consumption |
A2 | 2560 | N/A | 4.5 TFLOPS | 18 TFLOPS | 16GB GDDR6 | 200 GB/s | 40-60W |
A16 | 1280 x4 | N/A | 4.5 TFLOPS x4 | 17.9 TFLOPS x4 | 16GB GDDR6 x4 | 200 GB/s x4 | 250W |
A30 | 3804 | 5.2 TFLOPS | 10.3 TFLOPS | 165 TFLOPS | 24GB HBM2 | 933 GB/s | 165W |
A40 | 10752 | N/A | 37.4 TFLOPS | 149.7 TFLOPS | 48GB GDDR6 | 696 GB/s | 300W |
MI100 | 7680 | 11.5 TFLOPS | 23.1 TFLOPS | 184.6 TFLOPS | 32GB HBM2 | 1.2 TB/s | 300W |
A100 PCIe | 6912 | 9.7 TFLOPS | 19.5 TFLOPS | 312 TFLOPS | 80GB HBM2e | 1.93 TB/s | 300W |
A100 SXM2 | 6912 | 9.7 TFLOPS | 19.5 TFLOPS | 312 TFLOPS | 40GB HBM2 | 1.55 TB/s | 400W |
A100 SXM2 | 6912 | 9.7 TFLOPS | 19.5 TFLOPS | 312 TFLOPS | 80GB HBM2e | 2.04 TB/s | 500W |
T4 | 2560 | N/A | 8.1 TFLOPS | 65 TFLOPS | 16GB GDDR6 | 300 GB/s | 70W |
Figure 1 – Table comparing 2022 GPU specifications
NVIDIA A2
The NVIDIA A2 is an entry-level GPU intended to boost performance for AI-enabled applications. What makes this product unique is its extremely low power limit (40W-60W), compact size, and affordable price. These attributes position the A2 as the perfect “starter” GPU for users seeking performance improvements on their servers. To benefit from the performance inferencing and entry-level specifications of the A2, we suggest attaching it to mainstream PowerEdge servers, such as the R750 and R7515, which can host up to 4x and 3x A2 GPUs respectively. Edge and space/power constrained environments, such as the XR11, are also recommended, which can host up to 2x A2 GPUs. Customers can expect more PowerEdge support by H2 2022, including the PowerEdge R650, T550, R750xa, and XR12.
Supported Workloads: AI Inference, Edge, VDI, General Purpose Recommended Workloads: AI Inference, Edge, VDI Recommended PowerEdge Servers: R750, R7515, XR11
NVIDIA A16
The NVIDIA A16 is a full height, full length (FHFL) GPU card that has four GPUs connected together on a single board through a Mellanox PCIe switch. The A16 is targeted at customers requiring high-user density for VDI environments, because it shares incoming requests across four GPUs instead of just one. This will both increase the total user count and reduce queue times per request. All four GPUs have a high memory capacity (16GB DDR6 for each GPU) and memory bandwidth (200GB/s for each GPU) to support a large volume of users and varying workload types. Lastly, the NVIDIA A16 has a large number of video encoders and decoders for the best user experience in a VDI environment.
To take full advantage of the A16s capabilities, we suggest attaching it to newer PowerEdge servers that support PCIe Gen4. For Intel-based PowerEdge servers, we recommend the R750 and R750xa, which support 2x and 4x A16 GPUs, respectively. For AMD-based PowerEdge servers, we recommend the R7515 and R7525, which support 1x and 3x A16 GPUs, respectively.
Supported Workloads: VDI, Video Encoding, Video Analytics Recommended Workloads: VDI Recommended PowerEdge Servers: R750, R750xa, R7515, R7525
NVIDIA A30
The NVIDIA A30 is a mainstream GPU offering targeted at enterprise customers who seek increased performance, scalability, and flexibility in the data center. This powerhouse accelerator is a versatile GPU solution because it has excellent performance specifications for a broad spectrum of math precisions, including INT4, INT8, FP16, FP32, and FP64 models. Having the ability to run third- generation tensor core and the Multi-Instance GPU (MIG) features in unison further secures quality performance gains for big and small workloads. Lastly, it has an unconventionally low power budget of only 165W, making it a viable GPU for virtually any PowerEdge server.
Given that the A30 GPU was built to be a versatile solution for most workloads and servers, it balances both the performance and pricing to bring optimized value to our PowerEdge servers. The PowerEdge R750, R750xa, R7525, and R7515 are all great mainstream servers for enterprise customers looking to scale. For those requiring a GPU-dense server, the PowerEdge DSS8440 can hold up to 10x A30s and will be supported in Q1 2022. Lastly, the PowerEdge XR12 can support up to 2x A30s for Edge environments.
Supported Workloads: AI Inference, AI Training, HPC, Video Analytics, General Purpose Recommended Workloads: AI Inference, AI Training Recommended PowerEdge Servers: R750, R750xa, R7525, R7515, DSS8440, XR12
NVIDIA A40
The NVIDIA A40 is a FHFL GPU offering that combines advanced professional graphics with HPC and AI acceleration to boost the performance of graphics and visualization workloads, such as batch rendering, multi-display, and 3D display. By providing support for ray tracing, advanced shading, and other powerful simulation features, this GPU is a unique solution targeted at customers that require powerful virtual and physical displays. Furthermore, with 48GB of GDDR6 memory, 10,752 CUDA cores, and PCIe Gen4 support, the A40 will ensure that massive datasets and graphics workload requests are moving quickly.
To accommodate the A40s hefty power budget of 300W, we suggest customers attach it to a PowerEdge server with ample power to spare, such as the DSS8440. However, if the DSS8440 is not possible, the PowerEdge R750xa, R750, R7525, and XR12 are also compatible with the A40 GPU and will function adequately so long as they are using PSUs with adequate power output. Lastly, populating A40 GPUs within the PowerEdge T550 is also a great play for customers who want to address visually demanding workloads outside the traditional data center.
Supported Workloads: Graphics, Batch Rendering, Multi-Display, 3D Display, VR, Virtual Workstations, AI Training, AI Inference Recommended Workloads: Graphics, Bach Rendering, Multi-Display Recommended PowerEdge Servers: DSS8440, R750xa, R750, R7525, XR12, T550
NVIDIA A100
The NVIDIA A100 focuses on accelerating HPC and AI workloads. It introduces double-precision tensor cores that significantly reduce HPC simulation run times. Furthermore, the A100 includes Multi-Instance GPU (MIG) virtualization and GPU partitioning capabilities, which benefit cloud users looking to use their GPUs for AI inference and data analytics. The newly supported sparsity feature can also double the throughput of tensor core operations by exploiting the fine- grained structure in DL networks. Lastly, A100 GPUs can be inter-connected either by NVLink bridge on platforms like the R750xa and DSS8440, or by SXM4 on platforms like the PowerEdge XE8545, which increases the GPU-to- GPU bandwidth when compared to the PCIe host interface.
The PowerEdge DSS8440 is a great server for the A100, as it provides ample power and can hold the most GPUs. If not the DSS8440, we would suggest using the PowerEdge XE8545, R750xa, or R7525. Please note that only the 80GB model is supported for PCIe connections, and be sure to provide plenty of power to accommodate the A100s 300W/400W power requirements.
Supported Workloads: HPC, AI Training, AI Inference, Data Analytics, General Purpose Recommended Workloads: HPC, AI Training, AI Inference, Data Analytics Recommended PowerEdge Servers: DSS8440, XE8545, R750xa, R7525
AMD MI100
The AMD MI100 value proposition is similar to the A100 in that it will best accelerate HPC and AI workloads. At 11.5 TFLOPS, its FP64 performance is industry-leading for the acceleration of HPC workloads. Similarly, at 23.1 TFLOPs, the FP32 specifications are more than sufficient for any AI workload. Furthermore, the MI100 supports 32GB of high-bandwidth memory (HBM2) to enable a whopping 1.2TB/s of memory bandwidth. In a nutshell, this GPU is designed to tackle complex, data-intensive HPC and AI workloads for enterprise customers.
The AMD MI100 is qualified on both the Intel-based PowerEdge R750xa, which supports up to 4x MI100 GPUs, and the AMD- based PowerEdge R7525, which supports up to 3x MI100 GPUs. We highly recommend adopting a powerful PSU for either server, as the MI100 also has a massive power consumption of 300W.
Supported Workloads: HPC, AI Training, AI Inference, ML/DL Recommended Workloads: HPC, AI Training, AI Inference Recommended PowerEdge Servers: R750xa, R7525
Conclusion
The GPUs we are recommending in this list offer a wide variety of features that are designed to accelerate a diverse range of server workloads. A PowerEdge server configured with the most appropriate GPU will enable intended customer workloads to use these features in concert with other system components to yield the best performance. We hope this discussion of the latest 2022 GPUs, as well as our recommendations for Dell PowerEdge servers and workloads, will help customers choose the most appropriate GPU for their data center needs and business goals.
Learn More
Dell PowerEdge Accelerated Servers and Accelerators Dell eBook
Demystifying Deep Learning Infrastructure Choices using MLPerf Benchmark Suite HPC at Dell