


New PCIe Gen4 Data Center NVMe Drives Offer Unmatched Value for PowerEdge Servers
Download PDF
Summary
PCIe Gen4 Data Center NVMe drives challenge the existence of traditional SAS and SATA drives. This entry-level NVMe offering outperforms both SAS and SATA while retaining an affordable price that directly competes with SATA.
The purpose of this DfD is to educate readers on our new Gen4 Data Center NVMe offerings, including a brief history on the technology, a performance data comparison to SAS and SATA, and their value proposition in the market today. With this knowledge we hope our customers can make the best storage investment decision to optimize their PowerEdge servers.
NVMe Market Positioning
The NVMe host controller interface has been rapidly evolving since its inception less than a decade ago. By including high-performance, scalable technologies absent from both SAS and SATA interfaces, such as non-volatile (persistent) memory and the high-speed PCIe bus, NVMe was originally designed only as a premium storage offering and was priced to reflect that for several years. However, this novelty technology has become conventional. The shift inclined suppliers to optimize their processes to create more competitive price points. Now that the Gen4 Data Center NVMe drive has been introduced with both the high-performance and a more affordable price – is it time to start transitioning completely to NVMe?
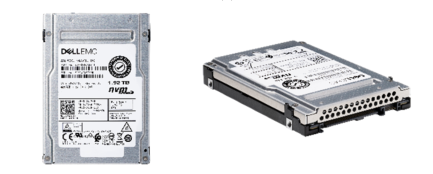
Figure 1 – Dell U.2 PCIe Gen4 NVMe SSD
Enterprise vs. Data Center NVMe
There are two classes of NVMe drives used in servers – Enterprise NVMe and Data Center NVMe SSD. Enterprise NVMe is the premium drive made for enterprise environments that run 24/7. This won’t be discussed, as its performance edge and enterprise features drive the price too high to compete with SAS and SATA at this time.
Instead, we will be focusing on the Data Center NVMe SSD. This vSAN-certified NVMe drive is tailored for scale-out/hyperscale environments where enterprise features, such as dual port and FIPS support, are not needed for the Data Center customer. This more targeted feature set, coupled with a lower-cost eight-channel controller, enables a more attractive price comparable to SATA. This high performance (see Figure 2) and lower price-point creates a clear and distinctive value proposition for this class of NVMe drive.
Interface | Capacity | Class | Seq. Read GB/s | Seq. Write GB/s | Random Reads - (4K) IOPs | Random Writes (4K)- IOPs |
RI NVMe | 1.92TB | Enterprise | 6.2 | 2.3 | 920 | 110 |
RI NVMe | 1.92TB | Data Center | 5.9 | 2.5 | 870 | 120 |
RI NVMe | 3.84TB | Enterprise | 6.2 | 3.45 | 1360 | 130 |
RI NVMe | 3.84TB | Data Center | 5.9 | 3 | 1050 | 150 |
RI NVMe | 7.68TB | Enterprise | 6.2 | 3.45 | 1360 | 130 |
RI NVMe | 7.68TB | Data Center | 5.9 | 3.5 | 1050 | 140 |
Figure 2 – Performance comparison of PCIe Gen4 Enterprise and Data Center NVMe SSDs
When comparing identical capacities of enterprise and data center NVMe drives, we can see that most performance readouts are very similar to one another, at around ±10%. Outliers do seem to exist, but they favor both sides. This indicates that the DC NVMe SSD does not sacrifice any significant amount of performance for its ‘entry-level’ price tag, but primarily its enterprise features. Thus, Gen4 DC NVMe is an excellent NVMe option for users who do not require the enterprise features.
Comparing Performance and Pricing
Here is where it gets really interesting. Pricing for identical NVMe drives remain relatively constant with each new generation. In this case, both PCIe Gen3 and PCIe Gen4 DC NVMe are priced nearly one-to- one, despite seeing significant performance gains with support for PCIe Gen4. This begs for some due diligence – with higher performance at cost parity, will Gen4 DC NVMe now expunge any remaining value proposition that may justify still using SAS or SATA in your PowerEdge servers?
To answer this question, we must first scrutinize the performance data. Figure 3 below shows how the performance readouts stack up and helps us understand the variances (highlighted in orange).
Swimlane |
Interface |
Capacity |
PCIe |
Model | Endurance (DWPD) | Seq. Reads (GB/s) |
| Seq. Writes (GB/s) |
| Random Reads - 4K (IOPs) |
| Random Writes - 4K (IOPs) |
|
Read Intensive | NVMe | 960GB | Gen4 x4 | Data Center Agnostic | 1 | 5.90GB/s |
| 1.40GB/s |
| 550K |
| 50K |
|
Read Intensive | SAS | 960GB | N/A | Dell Brand Agnostic | 1 | 1.02GB/s | 5.8x | 0.84GB/s | 1.7x | 184K | 3.0x | 34K | 1.5x |
Read Intensive | SATA | 960GB | N/A | Dell Brand Agnostic | 1 | 0.48GB/s | 12.3x | 0.44GB/s | 3.2x | 79K | 7.0x | 23K | 2.2x |
Read Intensive | NVMe | 1920GB | Gen4 x4 | Data Center Agnostic | 1 | 5.90GB/s |
| 2.50GB/s |
| 870K |
| 120K |
|
Read Intensive | SAS | 1920GB | N/A | Dell Brand Agnostic | 1 | 1.02GB/s | 5.8x | 0.95GB/s | 2.6x | 186K | 4.7x | 56K | 2.1x |
Read Intensive | SATA | 1920GB | N/A | Dell Brand Agnostic | 1 | 0.47GB/s | 12.6x | 0.44GB/s | 5.7x | 78K | 11.2x | 26K | 4.6x |
Read Intensive | NVMe | 3840GB | Gen4 x4 | Data Center Agnostic | 1 | 5.90GB/s |
| 3.00GB/s |
| 1050K |
| 150K |
|
Read Intensive | SAS | 3840GB | N/A | Dell Brand Agnostic | 1 | 1.02GB/s | 5.8x | 0.96GB/s | 3.1x | 189K | 5.6x | 57K | 2.6x |
Read Intensive | SATA | 3840GB | N/A | Dell Brand Agnostic | 1 | 0.48GB/s | 12.3x | 0.44GB/s | 6.8x | 79K | 13.3x | 25K | 6.0x |
Read Intensive | NVMe | 7680GB | Gen4 x4 | Data Center Agnostic | 1 | 5.90GB/s |
| 3.50GB/s |
| 1050K |
| 140K |
|
Read Intensive | SAS | 7680GB | N/A | Dell Brand Agnostic | 1 | 1.01GB/s | 5.8x | 0.96GB/s | 3.6x | 188K | 5.6x | 47K | 3.0x |
Figure 3 – Table comparing read and write performance for three storage mediums (Gen4 DC NVMe, SAS, and SATA)
Gen4 DC NVMe outperforms its competitors by a longshot for every metric, with a performance increase multiplier ranging from:
- 1.7x - 5.8x when compared to SAS
- 2.2x - 13.3x when compared to SATA
The sequential and random read numbers for Gen4 DC NVMe are excellent as expected, and the write IOPs have significantly improved and are even approaching Enterprise Mixed Use (MU) NVMe IOPs. Additionally, the endurance has also doubled from 0.5 to 1 DWPD (Drive Writes Per Day).
Pricing comparisons are a bit more complex to discuss accurately because they are always shifting and very sensitive. So, for this exercise, we will determine relative pricing percentages for vendor-agnostic models from our Q4 2021 price list. If Gen4 DC NVMe drives are the baseline (1.0x), then for the same capacity you will see an average price multiplier of:
- 1.43x for SAS
- 0.77x for SATA
Based on this performance and pricing we can conclude that there is no benefit in choosing SAS over Gen4 DC NVMe, because it is both more expensive and has much lower performance.
All that is left to determine is the value proposition of SATA. As mentioned earlier, SATA drives are still the most affordable form of storage medium on the market, at around 0.77x the price of Gen4 DC NVMe. However, there is still a bigger picture to craft when the data is analyzed at a deeper level. By calculating the performance-per-dollar (IOPs/$) for each capacity of Gen4 DC NVMe and SATA, we can get a better grasp on how effective each dollar spent really is. See Figure 4 below:
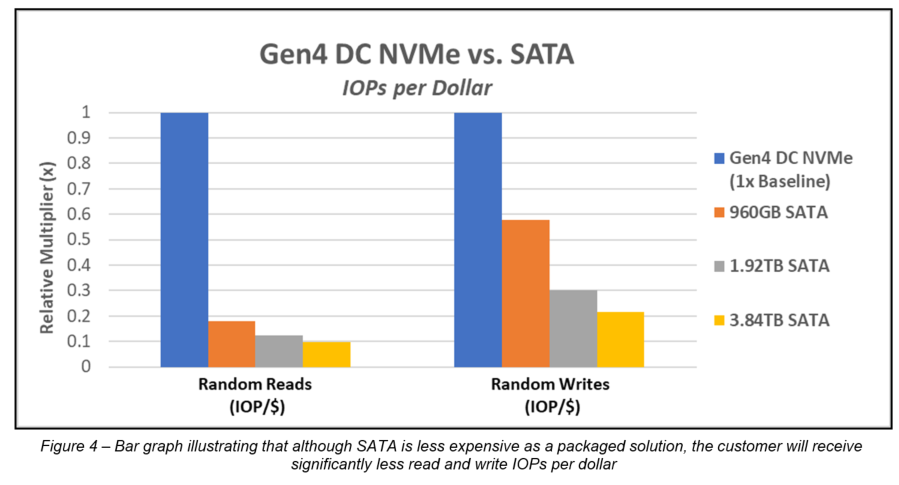
When the data is analyzed at this level, it becomes very apparent that each dollar spent on Gen4 DC NVMe goes way farther than it does with SATA. In the case of random read performance, each dollar spent on SATA will produce 0.1x - 0.2x as many IOPs as Gen4 DC NVMe would. In layman’s terms, this means that every dollar spent on SATA is nearly an order of magnitude less effective than Gen4 DC NVMe!
Final Thoughts
Now that the data has been presented and analyzed we can circle back to the original question - is it time to start transitioning completely to NVMe? Based on the high performance and very attractive price point, we believe that the Data Center NVMe drive has a clear and compelling value proposition for PowerEdge customers looking to invest in a scalable, forward-looking storage medium. However, customers that prioritize the lowest price possible will also find SATA to be a valuable solution.
- PCIe Gen4 Data Center NVMe is strongly recommended for most customer user cases. Budget-conscious customers should also consider that greater performance can be achieved at a lower price than SATA simply by scaling down the total number of Gen4 DC NVMe drives. With a performance output of up to 13.3x more than SATA while only being around 1.3x more expensive, customers can scale down the quantity of NVMe drives for the most cost-effective solution.
- SATA is recommended to customers where the lowest price is most important. As long as SATA holds its extremely low price, there will always be a target audience for this storage type. Customers that neither intend to scale, nor require high-performance, may certainly find this to be the best solution for their needs.
In conclusion, while SATA technology still brings value to the market through its extremely low price point, PCIe Gen4 Data Center NVMe technology has demonstrated that it is certainly the most cost-effective storage solution from a price-per-performance metric. Customers also have more flexibility with the option to increase performance and lower price by scaling down the total number of NVMe drives! Regardless, PCIe Gen4 Data Center NVMe technology has proven that for the time being it offers unmatched value to PowerEdge servers.
Related Documents

Next-Gen Dell PowerEdge Servers Deliver Encryption Protection without a Performance Hit Using KIOXIA PCIe

Tue, 17 Jan 2023 06:21:19 -0000
|Read Time: 0 minutes
Summary
This document is a summary of the performance comparison between SSDs that use encryption enabled vs. encryption disabled in a Dell PowerEdge server with PCIe 4.0 technology. All performance and characteristics discussed are based on performance testing conducted in the Americas Data Center (CET) labs. Results are accurate as of 5/1/21. Ad Ref #PROJ-000072
Introduction
Data encryption has been used for decades in data center computing environments to protect both data in transit and data at rest. In these environments, clients generate data continuously (24 hours per day, 7 days per week), and data collection continues to grow. This massive data generation comes from many different client devices such as desktops and laptops, smartphones and tablets, as well as IoT devices such as robots, drones, machines, and surveillance cameras, whether on-premises or ‘at-the-edge’ of the data center network (where data is captured and processed).
Massive data generation makes it more important than ever for companies to protect what they’ve captured both for short-term use and archival purposes, especially with technologies like artificial intelligence (AI) and machine learning (ML) that can help maximize the value of captured/archived data. Companies are turning more to encrypting data stored in their data centers to protect business-critical and sensitive information from unauthorized parties and hackers.
With each new generation of hardware and software that is produced, coupled with the exponential growth of data, it is critical for encryption methods to keep pace with technological advances. An ideal solution is to enable encryption so that access speed is comparable as if encryption was disabled, thereby delivering optimal system performance. The ability to protect data through encryption without experiencing performance degradation is the basis of this brief.
Data Encryption Performance Issues
Data encryption is the process of taking digital content (such as a document or email) and translating it into an unreadable format so that clients with a ‘secret key’ or password are the only ones that can view, access or read it. This helps protect the confidentiality of digital data stored on computer systems or transmitted over wireless networks and the Internet. A good example is when a smartphone is used for an ATM transaction or online purchase - encryption protects the information being transmitted.
Being a calculation-intensive operation, encryption is limited in use because of the amount of time and CPU cycles which can be lost to encrypting and decrypting data. These limitations may cause reduced system and application-level performance challenges that not only affect the applications themselves, but also the customer experience. To reduce CPU cycles being used for encryption, storage manufacturers have created devices that support encryption protocols inside of the drive itself. These drives are called Self Encrypting Drives1 (SEDs).
An SED implements on-board crypto-processers and uses an AES2-256 cryptographic module and media encryption key to encrypt plain-text data traversing through the SSD to the media inside of the SSD itself. This process ensures that data at rest is encrypted at a hardware layer to prevent unauthorized access.
System and Application Test Scenario
Mainstream servers and SSDs deployed with the PCIe 4.0 interface and NVMe protocol are becoming commercially available and typically deliver significant performance advantages over previous PCIe interface generations. Given the importance of encryption, delivering a solution that provides this capability without compromising performance was an SSD design goal for KIOXIA.
To find out if encryption leads to a performance hit, KIOXIA conducted transactions per minute (TPM) tests in a Dell® PCIe
4.0 server lab environment with and without encryption enabled. The test configuration included a Dell EMC PowerEdge R7525 rack server (with 3rd generation AMD EPYC™ CPUs) deployed with KIOXIA CM6 Series PCIe 4.0 enterprise NVMe SSDs that support the TCG-OPAL3 specification for SEDs. During the initial server boot-up, hardware level encryption was enabled throughout the BIOS on a Dell PowerEdge RAID Card (PERC) Model H755N. The ‘logical volume’ was created as an ‘encrypted volume’ that enables TCG-OPAL encryption across the KIOXIA CM6 Series SSDs, also creating a secured logical device.
The tests utilized an operational, high-performance Microsoft® SQL Server™ database workload based on comparable TPC- C™ benchmarks created by HammerDB software4. Supporting details include a description of the benchmark test criteria and the set-up and associated test procedures, as well as a visual representation of the test results, and a test analysis.
The test results provide a real-world scenario of the effects that encryption has on TPM performance when running a Microsoft SQL Server database using comparable equipment and performing queries against it. In this test configuration, a Dell EMC PowerEdge 7525 server utilizes KIOXIA CM6 Series enterprise SSDs when running this database application to demonstrate performance of a system with and without data encryption.
Test Criteria:
The hardware and software equipment used for these encryption tests included:
- Dell R7525 Server: One (1) dual socket server with two (2) AMD EPYC 7352 processors, featuring 24 processing cores, 2.3 GHz frequency, and 240 gigabytes5 (GB) of DDR4 RAM
- Operating System: Microsoft Windows® Server 2019
- Application: Microsoft SQL Server 2019.150.1600.8 – Database size of 440GB
- Test Software: Comparable TPC-C benchmark tests generated through HammerDB v4.0 test software
- PCIe 4.0 NVMe RAID Card: Dell PERC H755N
- Storage Devices (Table 1): Three (3) KIOXIA CM6-R Series PCIe 4.0 NVMe SSDs with 1.6 terabyte5 (TB) capacities
Specifications | CM6-R Series |
Interface | PCIe 4.0 NVMe U.3 |
Capacity | 1.6TB |
Form Factor | 2.5-inch6 (15mm) |
NAND Flash Type | BiCS FLASH™3D flash memory |
Drive Writes per Day7 (DWPD) | 3 (5 years) |
Power | 18W |
DRAM Allocation | 96GB |
Set-up & Test Procedures
Set-up: The test system was configured using the hardware and software equipment outlined above. An unsecured RAID5 set was created on the Dell H755N PERC using three (3) CM6-R Series SSDs with the SED option. RAID5 was selected because it is commonly used in data center environments. Once the SSD array was initialized, the RAID5 set was formatted to a Microsoft Windows NT file system (NTFS). The Microsoft SQL Server application was then installed and limited to 96GB of memory. A 440GB database was then loaded using HammerDB test software.
Test Procedures: The first test was run with encryption disabled. The comparable TPC-C workload utilized HammerDB software to run the test. The three (3) KIOXIA CM6-R Series SSDs were placed into a RAID5 set and the test was conducted with encryption disabled. Multiple iterations of the test were run on both configurations to determine an optimal configuration of virtual users. Both test scenarios showed the highest TPM performance when running a configuration of 480 virtual users. See Test Results section.
The second test was then run with encryption enabled. The RAID5 set was destroyed and a secure RAID5 set based on the TCG-OPAL specification was created. The three (3) KIOXIA CM6-R Series SSDs were placed into the secure RAID5 set and the same test was conducted with encryption enabled. The objective of this test was to showcase how the application and system provide the same level of performance whether data was encrypted or unencrypted. The comparable TPC-C workload was run using HammerDB test software. The same test process for this configuration was repeated to obtain the TPM performance results with encryption enabled. See Test Results section.
The TPM tests were conducted, with and without encryption enabled, with the performance result recorded. As it relates to TPM, the higher the test value, the better the result.
The CPU utilization tests were also conducted, with and without encryption enabled, with the result recorded. In this test instance, the lower the test value, the better the utilization.
Transactions Per Minute
In an Online Transaction Processing (OLTP) database environment, TPM is a measure of how many transactions in the TPC-C transaction profile are being executed per minute. HammerDB software, executing the HammerDB TPC-C transaction profile, randomly performs new order transactions and randomly executes additional transaction types such as payment, order status, delivery and stock levels. This benchmark simulates an OLTP environment where there are a large number of users that conduct simple, yet short transactions that require sub-second response times and return relatively few records. The TPM test results:
CM6-R Series Tests: SQL Server Comparable TPC-C Workload | Without Encryption | With Encryption |
Transactions per Minute | 720,672 | 720,697 |
Performance Difference | - | 0% |
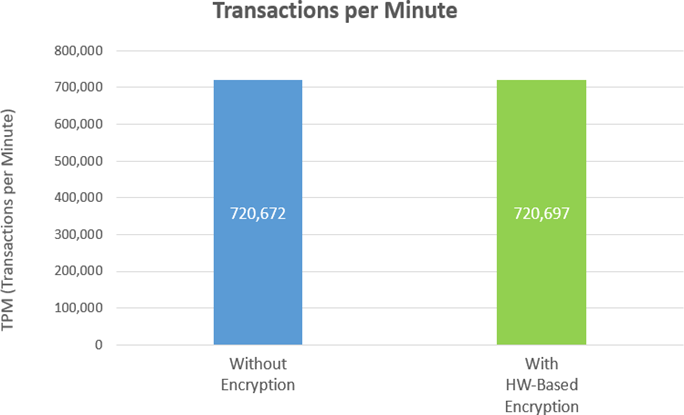
In both test cases, the margin of deviation when measuring the TPM, with or without encryption, was close to 0%, which implies no discernable difference in application level performance between the two approaches.
CPU Utilization
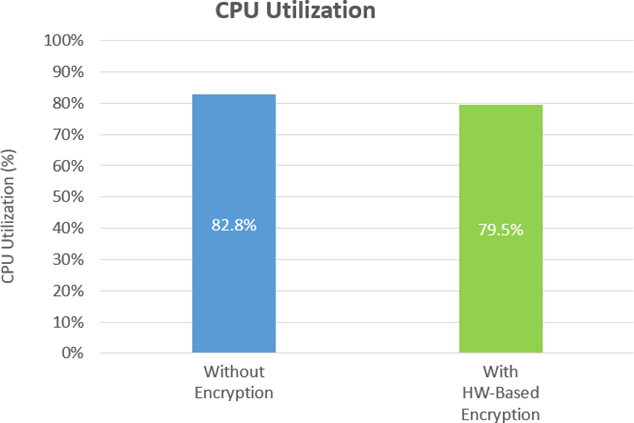
In general, CPU utilization represents a percentage of the total amount of computing tasks that are handled by the CPU, and is another estimation of system performance. Some forms of encryption require CPU cycles to encrypt and decrypt data on the storage media itself which can lead to a performance impact. For these tests, CPU utilization was measured to ensure the CPU was not incurring any extra processing for encryption, which should be handled in hardware at the RAID controller and SSD levels. The hardware based configuration from Dell with KIOXIA CM6-R Series SSDs enables the R7525 server CPU to be utilized for compute tasks instead of encryption. The graphs below show the CPU utilization was comparable (82.8% utilization without encryption and 79.5% utilization with encryption):
Test Analysis
The test results validated that KIOXIA CM6-R Series SSDs enabled the Dell R7525 rack server to deliver nearly identical TPM performance whether encryption was enabled or not. This particular PCIe 4.0 NVMe server/storage configuration was able to deliver more than 720,000 TPM without any TPM-related performance degradation regardless of encryption being enabled or disabled. As a result, systems and applications that use SSDs based on the TCG-OPAL standard are enabled to utilize the CPU for performance tasks instead of encryption tasks.
Whether hardware encryption was enabled or disabled, there was about 3% deviation of the CPU utilization during the testing process which demonstrated that the CPU wasn’t processing any extra workloads for encryption.
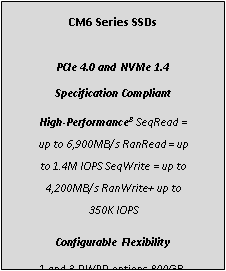
CM6 Series SSD Overview
The CM6 Series is KIOXIA’s 3rd generation enterprise-class NVMe SSD product line that features significantly improved performance from PCIe Gen3 to PCIe Gen4, 30.72TB maximum capacity, dual-port for high availability, 1 DWPD for read-intensive applications (CM6-R Series) and 3 DWPD for mixed use applications (CM6- V Series), up to a 25-watt power envelope and a host of security options – all of which are geared to support a wide variety of workload requirements. The CM6 Series SSD architecture has encryption built into the data path so as the drive is reading and writing from NAND flash memory, the encryption or decryption is performed in a way that it has no material impact to performance9.
Summary
Encryption becomes more important than ever to secure data. An ideal encrypted solution does not impact application or system performance. The test results presented validate that a PowerEdge R7525 PCIe 4.0 enabled server with KIOXIA CM6-R Series SSDs effectively delivered identical TPM performance of more than 720,000 TPM, whether encryption was enabled or not. As data usage scales over time, performance is not affected by encryption no matter how much data is being encrypted at rest. CPU utilization was also comparable with or without encryption enabled which validated that the CPU (at approximately 80% utilization) was not impacted when encryption was enabled. The Dell EMC and KIOXIA server solution delivered encryption protection without a performance hit!!!
Notes
1 Self-Encrypting Drives encrypt all data to SSDs and decrypt all data from SSDs, via an alphanumeric key (or password protection) to prevent data theft. It continuously scrambles and descrambles data written to and retrieved from SSDs.
2 The Advanced Encryption Standard (AES) is a specification for the encryption of electronic data established by the U.S. National Institute of Standards and Technology in 2001.
3 Developed by the Trusted Computing Group (TCG), a not-for-profit international standards organization, the OPAL specification is used for applying hardware-based encryption to solid state drives and often referred to as TCG-OPAL.
4 HammerDB is benchmarking and load testing software that is used to test popular databases. It simulates the stored workloads of multiple virtual users against specific databases to identify transactional scenarios and derive meaningful information about the data environment, such as performance comparisons. TPC Benchmark C is a supported OLTP benchmark that includes a mix of five concurrent transactions of different types, and nine types of tables with a wide range of record and population sizes and where results are measured in transactions per minute.
5 Definition of capacity - KIOXIA Corporation defines a megabyte (MB) as 1,000,000 bytes, a gigabyte (GB) as 1,000,000,000 bytes and a terabyte (TB) as 1,000,000,000,000 bytes. A computer operating system, however, reports storage capacity using powers of 2 for the definition of 1Gbit = 230 bits = 1,073,741,824 bits, 1GB = 230 bytes = 1,073,741,824 bytes and 1TB = 240 bytes = 1,099,511,627,776 bytes and therefore shows less storage capacity. Available storage capacity (including examples of various media files) will vary based on file size, formatting, settings, software and operating system, and/or pre-installed software applications, or media content. Actual formatted capacity may vary.
6 2.5-inch indicates the form factor of the SSD and not the drive’s physical size.
7 Drive Write(s) per Day: One full drive write per day means the drive can be written and re-written to full capacity once a day, every day, for the specified lifetime. Actual results may vary due to system configuration, usage, and other factors.
8 Read and write speed may vary depending on the host device, read and write conditions, and the file size.
9 Variances in individual test queries may occur in normal test runs. Average performance over time was consistent for encryption enabled and encryption disabled.
Trademarks
AMD, EPYC and combinations thereof are trademarks of Advanced Micro Devices, Inc. Dell, Dell EMC and PowerEdge are either registered trademarks or trademarks of Dell Inc. Microsoft, Windows and SQL Server are either registered trademarks or trademarks of Microsoft Corporation in the United States and/or other countries. NVMe is a registered trademark of NVM Express, Inc. PCIe is a registered trademark of PCI-SIG. TPC-C is a trademark of the Transaction Processing Performance Council. All company names, product names and service names may be the trademarks of their respective companies.
Disclaimers
© 2021 Dell, Inc. All rights reserved. Information in this performance brief, including product specifications, tested content, and assessments are current and believed to be accurate as of the date that the document was published, but is subject to change without prior notice. Technical and application information contained here is subject to the most recent applicable product specifications.

NVMe Performance Increases for Next-Generation PowerEdge Servers with PERC11 Controller
Mon, 16 Jan 2023 13:44:21 -0000
|Read Time: 0 minutes
Summary
Dell Technologies newest RAID iteration, PERC11, has undergone significant change - most notably the inclusion of hardware RAID support for NVMe drives. To better understand the benefits that this will bring, various metrics were tested, including NVMe IOPS, disk bandwidth and latency. This DfD compares NVMe performance readings of the next-generation Dell EMC PowerEdge R650 server, powered by pre-production 3rd Generation Intel® Xeon® Scalable processors, to the prior-generation PowerEdge R640 server, powered by 2nd Generation Intel® Xeon® Scalable processors.
Introduction
With support for NVMe hardware RAID now available on the PERC11 H755N front, H755MX and H755 adapter form factors, we were eager to quanitfy how big of a performance boost next-generation PowerEdge servers with hardware RAID would obtain. Dell Technologies commissioned Principled Technologies to execute various studies that would compare the NVMe Input/Output Per Second (IOPS), disk bandwidth and latency readings of next-geneation PowerEdge servers (15G) with NVMe hardware RAID support against prior-generation PowerEdge servers (14G) without NVMe hardware RAID support.
Test Setup
Two servers were used for this study. The first was a PowerEdge R650 server populated with two 3rd Gen Intel® Xeon® Scalable processors, 1024GB of memory, 3.2TB of NVMe storage and a Dell PERC H755N storage controller. The second was a PowerEdge R640 server populated with two 2nd Gen Intel® Xeon® Gold Scalable processors, 128GB of memory, 1.9TB of SSD storage and a Dell PERC H730P Mini storage controller.
A tool called Flexible Input/Output (FIO) tester was used to create the I/O workloads used in testing. FIO invokes the production of threads or processes to do an I/O action as specified by the user. This test was chosen specifically because it injects the smallest system overhead of all the I/O benchmark tools we use. This in turn allows it to deliver enough data to the storage subsystem to reach 100% utilization. With the tool, five workloads were run at varied thread counts and queue depths on RAID 10, RAID 6, and RAID 5 levels of the Dell EMC PowerEdge R650 server with PERC H755n RAID controller and NVMe drives and the Dell EMC PowerEdge R640 server with a PERC H730P Mini controller and SATA SSD drives.
Read-heavy workloads indicate how quickly the servers can retrieve information from their disks, while write-heavy workloads indicate how quickly the servers can commit or save data to the disk. Additionally, random and sequential in the workload descriptions refer to the access patterns for reading or writing data. Random accesses require the server to pull data from multiple disks in a non-sequential fashion (i.e., visiting multiple websites), while sequential accesses require the server to pull data from a single continuous stream (i.e., streaming a video).
Performance Comparisons
IOPS
IOPS indicates the level of user requests that a server can handle. Based on the IOPS output seen during testing, upgrading from the prior-generation Dell EMC PowerEdge R640 server to the latest-generation Dell EMC PowerEdge R650 server could deliver performance gains for I/O-intensive applications. In all three RAID configurations tested, the PowerEdge R650 with NVMe SSDs delivered significantly more IOPS than the prior-generation server. Figures 1, 2 and 3 show how many average IOPS each configuration handled during testing:
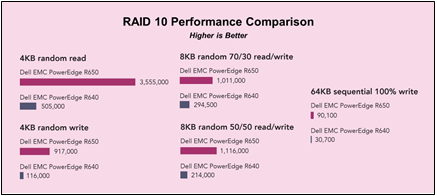
Figure 1: IOPS comparison for RAID 10 configurations
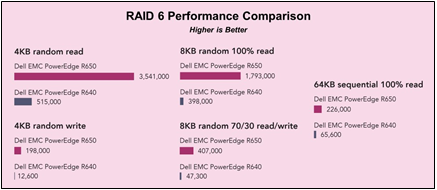
Figure 2: IOPS comparison for RAID 6 configurations
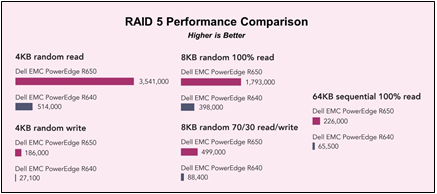
Figure 3: IOPS comparison for RAID 5 configurations
Disk Bandwidth
Disk bandwidth indicates the volume of data a system can read or write. A server with high disk bandwidth can process more data for large data requests, such as streaming video or big data applications. At all three RAID levels, the latest-generation Dell EMC PowerEdge R650 server with NVMe storage transferred significantly more MB per second than the prior-generation server. Figure 4 shows the disk bandwidth that each of the two servers supported for each RAID level:
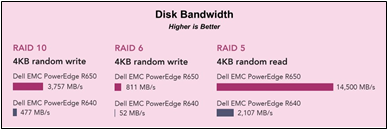
Figure 4: Disk bandwidth comparison for RAID 10, 6 and 5 configurations
Latency
Latency indicates how quickly the system can respond to a request for an I/O operation. Longer latency can impact application responsiveness and could contribute to a negative user experience. In addition to greater disk bandwidth, the Dell EMC PowerEdge R650 server delivered lower latency at each of the three RAID levels than the prior-generation server. Figure 5 shows the latency that each server delivered while running one workload at each RAID level.
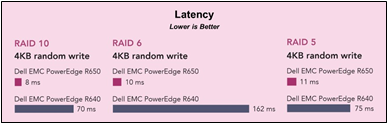
Figure 5: Latency comparison for RAID 10, 6 and 5 configurations
Conclusion
The next-generation PowerEdge R650 server with NVMe HW RAID support increased IOPS by up to 15.7x, disk bandwidth by up to 15.5x, and decreased latency by up to 93%. With the inclusion of NVMe HW RAID support on Dell Technologies’ new PERC11 controllers, now is a great time for PowerEdge customers to migrate their storage medium over to NVMe drives and yield the higher-performance that comes with it!
For more details, please read the full PT report Accelerate I/O with NVMe drives on the New PowerEdge R650 server