
Direct from Development - Tech Notes

Reliability in Dell Technologies PowerEdge Servers
Thu, 25 Apr 2024 18:31:15 -0000
|Read Time: 0 minutes
Introduction
Reliability is defined as the characteristic of a product or system that assures the performance of its intended function over time and assures operation in a defined environment without failure. Reliability is designed into PowerEdge servers, and it is constantly evaluated and improved throughout the product lifecycle. Full in-house test and analysis capabilities allow Dell Technologies to develop and implement robust product qualification and release procedures.
Dell Technologies Design Guidelines
Dell Technologies server design-to-criteria includes:
- Servers to operate continuously at 40C degrees/80% relative humidity, and allow for short term excursions to 45 degrees C and 90% relative humidity
note: 40C/85%RH capability is configuration specific, but the vast majority of PowerEdge server configurations allow for these conditions
- Additional design life margin, and accommodation for the potential of lifetime limited warranty
- Potential deployment in uncontrolled environments – locations with polluted air and dust
- Customer special requests – for example, higher shock and vibration tolerance
Dell Technologies Design for Reliability Process
The Dell Technologies Reliability Engineering team is part of the Server Product Development team and has developed a full suite of procedures. Many are based on industry standards which define DfR: Subsystem Qualification, Ongoing Reliability Testing, Validation, Shock and Vibration, and associated Failure Analysis requirements. This suite must be met and fulfilled before any product is released. Dell Technologies environmental test chambersDell Technologies uses internally developed web-based design for reliability (DfR) tools for systems development. In addition to using these tools at Dell Technologies, we require that our supply base use these tools in their product development processes to ensure our suppliers also design in reliability.
Design for Reliability Starts at the Component Level
Dell Technologies reliability begins with choosing and approving component suppliers. Dell Technologies specifies JEDEC qualified components from all suppliers (JEDEC is a global industry group that creates standards for broad range of technologies). To ensure enterprise-class reliability, Dell Technologies may require qualification testing beyond the standard JEDEC suite depending on the nature of the component – new, unique, different, and difficult or NUDD. Dell Technologies has specific qualification requirements for NUDDs.
Subsystem Level Comes Next
Dell Technologies defines qualification protocol for all subsystems (HDD, SSD, PSU, fans, memory, PCIe cards, PERC, and daughter cards) and ensures that the supply base executes to Dell Technologies requirements. Dell Technologies does this by:
- Defining test requirements, sample sizes, ramp rates, durations, and accept/reject criteria
- Working closely with Suppliers during their product development process
- Reviewing and approving results, and addressing qualification fails, if any
- Auditing product by conducting our own in house testing as appropriate
- Auditing supplier Quality and Assembly/Test processes
- Requiring ongoing reliability testing (ORT) on all subsystems throughout their shipping life
The System is the Third Level of Reliability
Dell Technologies does extensive testing and analysis of all systems during development and prior to release:
- Dell Technologies has developed and refined a suite of multiple environment over-stress validation tests that it executes on every system during its development and prior to release
- Dell Technologies has a separate suite of shock and vibration tests, many of which are industry-standards-based, that we execute on every system prior to release
- Dell Technologies has full internal capability to analyze test fails in our own in-house Failure Analysis Labs
Dell Technologies Reliability is designed in and closes the loop: from the component level to subsystem level to system level. Our product qualification and release systems ensure that design criteria, including deployment life, additional deployment life margin, and accommodation for potential lifetime limited warranty, are met before product is launched. This qualification and release system is based on industry standards and on our own rigorous methods which have been developed and refined over multiple generations of PowerEdge products. This includes Ongoing Reliability Testing (ORT) on components and subsystems which is required to be implemented throughout the shipping life of PowerEdge servers.
Dell Technologies’ focus is on Design for Reliability - using a full suite of internally developed web-based tools, HW Validation Tests, and Shock and Vibration tests. Full in-house capabilities allow Dell Technologies to conduct all phases of product qualification and release in house, including multiple environment overstress tests, shock and vibration tests, and failure analysis.
Dell Technologies also conducts research on long term reliability of our products in expanded operating environments. This research, and associated multimillion-dollar investments in applied research facilities, allow Dell Technologies to continue to improve reliability on PowerEdge products.

Accelerate Genomics Insights and Discovery with High-Performing, Scalable Architecture from Dell and Intel
Thu, 01 Feb 2024 18:47:58 -0000
|Read Time: 0 minutes
Summary
The field of Genomics requires the storage and processing of vast amounts of data. In this brief, Intel and Dell technologists discuss key considerations to successfully deploy BeeGFS based storage for Genomics applications on the latest generation PowerEdge Server portfolio offerings.
Market positioning
The life sciences industry faces intense pressure to speed results and bring in new treatments to market all while lowering costs, especially in genomics. However, life-changing discoveries often depend on processing, storing, and analyzing enormous volumes of genomic sequencing data — more than 20 TB of new data per day by one organization, alone1, with each modern genome sequencer producing up to 10TB of new data per day. Researchers need high-performing solutions built to handle this volume of data and analytics and artificial intelligence (AI) workloadsthat are easy to deploy and scale.
Dell and Intel have collaborated on a bill of materials (BoM) that provides life science organizations with a scalable solution for genomics. This solution features high-performance compute and storage building blocks for one of the leading parallel cluster file systems, BeeGFS. The BoM features four Dell PowerEdge rack server nodes powered by 4th Generation Intel® Xeon® Scalable processors, which deliver the performance needed for faster results and time to production.
The BoM can be tailored for each organization’s architectural needs. For dense configurations, customers can use the Dell PowerEdge C6600 enclosure with PowerEdge C6620 server nodes instead of standard PowerEdge R660 servers (each PowerEdge C6600 chassis can hold up to four PowerEdge C6620 server nodes). If they already have a storage solution in place using InfiniBand fabric, the nodes can be equipped with an additional Mellanox ConnectX-6 HDR100 InfiniBand adapter.
Key Considerations
Key considerations for deploying genomics solutions on Dell PowerEdge servers include:
- Core count: Life sciences organizations often process a whole genome on a cluster, which scales linearly with core count. The Dell PowerEdge solution offers up to 56 cores per CPU to meet performance requirements.
- Memory requirements: This BoM provides 512 GB of DRAM to support specific tasks in workloads that have higher memory requirements, such as running Burrows-Wheeler Aligner algorithms.
- Local and distributed storage: Input/output (I/O) is a big consideration for genomics workloads because datasets can reach hundreds of gigabytes in size. Dell and Intel recommend 3.2 TB of local storage specifically for commonly used genomics tools that read and write many temporary files.
Available Configurations
Feature | Configuration |
Platform | 4 x Dell R660 supporting 8 x 2.5” NVMe drives - direct connection |
CPU (per server) | 2x Intel® Xeon® Platinum 8480+ (56c @ 2.0GHz) |
DRAM | 512GB (16 x 32GB DDR5-4800MT/s) |
Boot device | Dell BOSS-N1 with 2x 480GB M.2 NVMe SSD (RAID1) |
Storage | 1x 3.2TB Solidigm D7-P5620 NVMe SSD (PCIe Gen4, Mixed-use) |
Capacity storage | Dell Ready Solutions for HPC BeeGFS Storage: 500 GB capacity per 30x coverage whole genome sequence (WGS) to be processed; 800 MB/s total (200 MB/s per node). |
NIC | Intel® E810-XXV Dual Port 10/25GbE SFP28, OCP NIC 3.0 |
Software Versions | |
Workload | GATK Best Practices for Germline Variant Calling WholeGenomeGermlineSingleSample_v3.1.6 |
Applications | • WARP 3.1.6 • GATK 4.3.0.0 • Picard 3.0.0 • Samtools 1.17 • Burroughs-Wheeler Aligner (BWA) 0.7.17 • VerifyBamID 2.0.1 • MariaDB 10.3.35 • Cromwell 84 |
Learn more
Contact your Dell or Intel account team for a customized quote at 1-877-289-3355.
Read about Intel Select Solutions for Genomics Analysis: https://www.intel.com/content/dam/www/public/us/en/documents/solution-briefs/select-genomics-analytics.pdf
Read about Dell HPC Ready Architecture for Genomics: https://infohub.delltechnologies.com/static/media/6cb85249-c458-4c06-bcec-ef35c1a363ca.pdf?dgc=SM&cid=1117&lid=spr4502976221&linkId=112053582
Learn more about Dell Ready Solutions for HPC BeeGFS Storage: https://www.dell.com/support/kbdoc/en-us/000130963/dell-emc-ready-solutions-for-hpc-beegfs-high-performance-storage
Learn more about Dell Ready Solutions for HPC BeeGFS High Capacity Storage: www.dell.com/support/kbdoc/en-ie/000132681/dell-emc-ready-solutions-for-hpc-beegfs-high-capacitystorage

Powering TigerGraph with Intel® Xeon® Processors on PowerEdge Servers
Tue, 30 Jan 2024 23:56:48 -0000
|Read Time: 0 minutes
TigerGraph Overview
At the top of this webpage are 3 PDF files outlining test results and reference configurations for Dell PowerEdge servers using both the 3rd Generation Intel Xeon processors and 4th Generation Intel Xeon processors. All testing was conducted in Dell Labs by Intel and Dell Engineers in May and June of 2023.
- TigerGraph DfD ICX – highlights the recommended configurations for Dell PowerEdge servers using 3rd Generation Intel Xeon processors.
- TigerGraph DfD SPR – highlights the recommended configurations for Dell PowerEdge servers using 4th Generation Intel Xeon processors.
- DfD – PowerEdge TigerGraph Test Report – Highlights the results of performance testing on both configurations with comparisons that demonstrate the performance difference between the two platforms.
Solution Overview
TigerGraph was founded in 2012 by programmer Dr. Yu Xu under the name GraphSQL
According to Gartner, by 2025, graph technologies will be used in 80% of data and analytics innovations, up from 10% in 2021. This projection aligns with the explosive growth of TigerGraph’s global customer base, which has increased by more than 100% in the past twelve months as more organizations use graphs to drive better business outcomes.
A graph database is designed to facilitate analysis of relationships in data. A graph database stores data as entities and the relationships between those entities. It is composed of two things: vertices and edges. Vertices represent entities such as a person, product, location, payment, order and so on; edges represent the relationship between these entities, for example, this person initiated this payment to purchase this product with this order. Graph analytics explores these connections in data and reveals insights about the connected data. These capabilities enable applications such as customer 360, cyber threat mitigation, digital twins, entity resolution, fraud detection, supply chain optimization, and much more.
TigerGraph is the only scalable graph database for the enterprise. TigerGraph’s innovative architecture allows siloed data sets to be connected for deeper and wider analysis at scale. Additionally, TigerGraph supports real-time in-place updates for operational analytics use cases.
Below is an outline of the TigerGraph architecture.

As you should note, a TigerGraph instance is designed to process massive pools of data and utilizes a large number of processes to do so. Choosing the correct hardware is critical to a successful deployment.
Reference Deployments
- Four top-tier banks use TigerGraph to improve fraud detection rates by 20% or more.
- Over 300 million consumers receive personalized offers with recommendation engines powered by TigerGraph.
- More than 50 million patients receive care path recommendations to assist them on their wellness journey.
- One billion people depend on the energy infrastructure optimized by TigerGraph to reduce power outages.TigerGraph is a native parallel graph database purpose-built for analyzing massive amounts of data (terabytes).
TigerGraph helps make graph technology more accessible. TigerGraph DB is democratizing the adoption of advanced analytics with Intel’s 4th Generation Intel Xeon Scalable Processors by enabling non-technical users to accomplish as much with graphs as the experts do.
TigerGraph with Dell PowerEdge and Intel processor benefits
The introduction of new server technologies allows customers to deploy solutions using the newly introduced functionality, but it can also provide an opportunity for them to review their current infrastructure and determine if the new technology might increase performance and efficiency. Dell and Intel recently conducted TigerGraph performance testing on the new Dell PowerEdge R760 with 4th Generation Intel Xeon Scalable processors and compared the results to the same solution running on the previous generation R750 with 3rd generation Intel Xeon Scalable processors to determine if customers could benefit from a transition.
Dell PowerEdge R660 and R760 servers with 4th generation Intel Xeon Scalable processors deliver a fast, scalable, portable and cost-effective solution to implement and operationalize deep analysis of large pools of data.
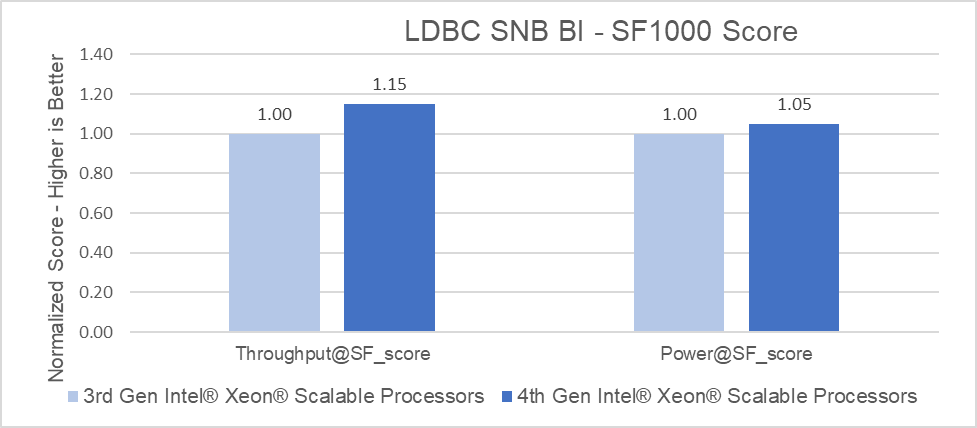
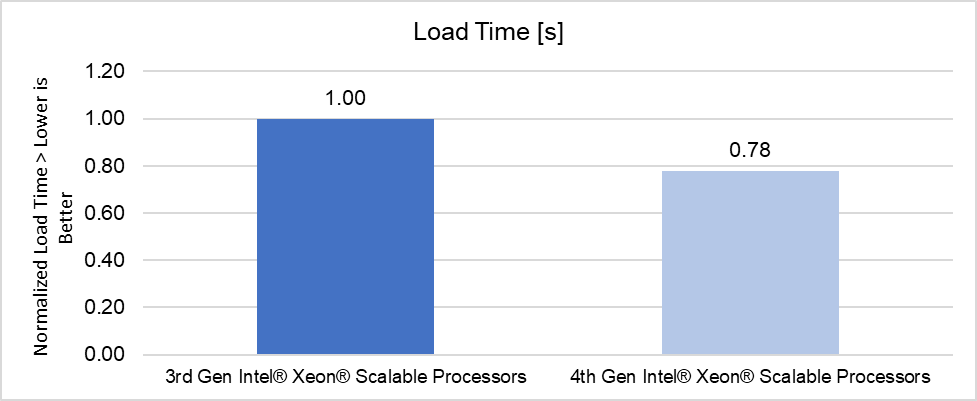
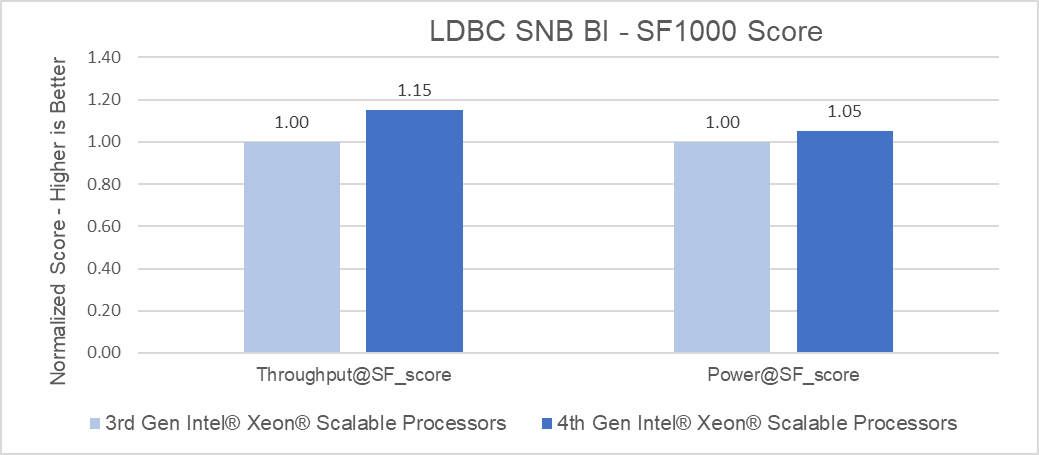
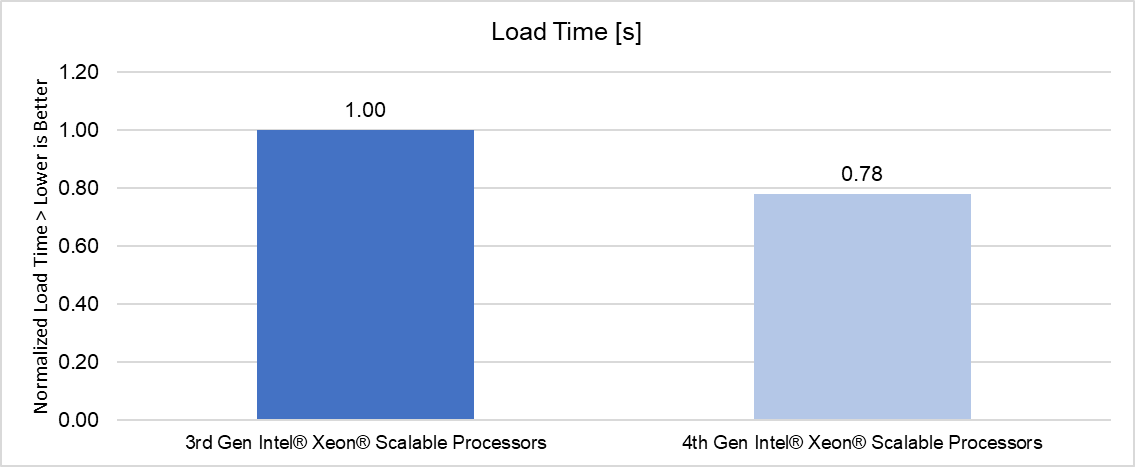
Raw performance: As noted in the report, PowerEdge servers with 4th Generation Intel Xeon Platinum processors delivered up to 1.15x better throughput than 3rd Generation Intel Xeon Platinum processors and were able to load the data set up to 1.27x faster (for TigerGraph in the LDBC SNB BI benchmark).
Benchmark score
Load time
Conclusion
Choosing the right combination of Server and Processor can increase performance and reduce latency. As this testing demonstrated, the Dell PowerEdge R760 with 4th Generation Intel Xeon Platinum 8468 CPUs delivered up to a 15% performance improvement for business intelligence queries than the Dell PowerEdge R750 with 3rd Generation Intel Xeon Platinum 8380 CPUs, and were able to load the data set up to 27% faster.

PowerEdge R760 with 4th Generation Intel® Xeon® Processors TigerGraph Test Report
Tue, 30 Jan 2024 23:55:41 -0000
|Read Time: 0 minutes
Summary
Introducing new server technologies allows customers to deploy solutions that use the newly introduced functionality. It can also provide an opportunity for them to review their current infrastructure and determine whether the new technology can increase performance and efficiency. With this in mind, Dell Technologies and Intel recently conducted testing with TigerGraph on the new Dell PowerEdge R760 with 4th Generation Intel Xeon Scalable processors. We compared the results to the same solution running on the previous generation R750 with 3rd Generation Intel Xeon Scalable processors to determine whether customers could benefit from a transition.
All testing was conducted in Dell Labs by Intel and Dell engineers in April 2023.
Solution overview
TigerGraph was founded in 2012, by programmer Dr. Yu Xu, under the name GraphSQL[i]
According to Gartner, by 2025, graph technologies will be used in 80% of data and analytics innovations, up from 10% in 2021. This projection aligns with the explosive growth of TigerGraph’s global customer base, which has increased by more than 100% in the past twelve months as more organizations use graphs to drive better business outcomes.[ii]
A graph database is designed to facilitate analysis of relationships in data. A graph database stores data as entities and the relationships between those entities. It is composed of two things: vertices and edges. Vertices represent entities such as a person, product, location, payment, order, and so on; edges represent the relationship between these entities, for example, this person initiated this payment to purchase this product with this order. Graph analytics explores these connections in data and reveals insights about the connected data. These capabilities enable applications such as customer 360, cyber threat mitigation, digital twins, entity resolution, fraud detection, supply chain optimization, and much more.
TigerGraph is the only scalable graph database for the enterprise. TigerGraph’s innovative architecture allows siloed data sets to be connected for deeper and wider analysis at scale. Additionally, TigerGraph supports real-time in-place updates for operational analytics use cases.[iii]
- Four top-tier banks use TigerGraph to improve fraud detection rates by 20% or more.
- Over 300 million consumers receive personalized offers with recommendation engines powered by TigerGraph.
- More than 50 million patients receive care path recommendations to assist them on their wellness journey.
- One billion people depend on the energy infrastructure optimized by TigerGraph to reduce power outages.TigerGraph is a native parallel graph database purpose-built for analyzing massive amounts of data (terabytes).[iv]
TigerGraph helps make graph technology more accessible. TigerGraph DB is democratizing the adoption of advanced analytics with Intel’s 4th Generation Intel Xeon Scalable Processors by enabling non-technical users to accomplish as much with graphs as the experts do.[v]
Here is an outline of the TigerGraph architecture:
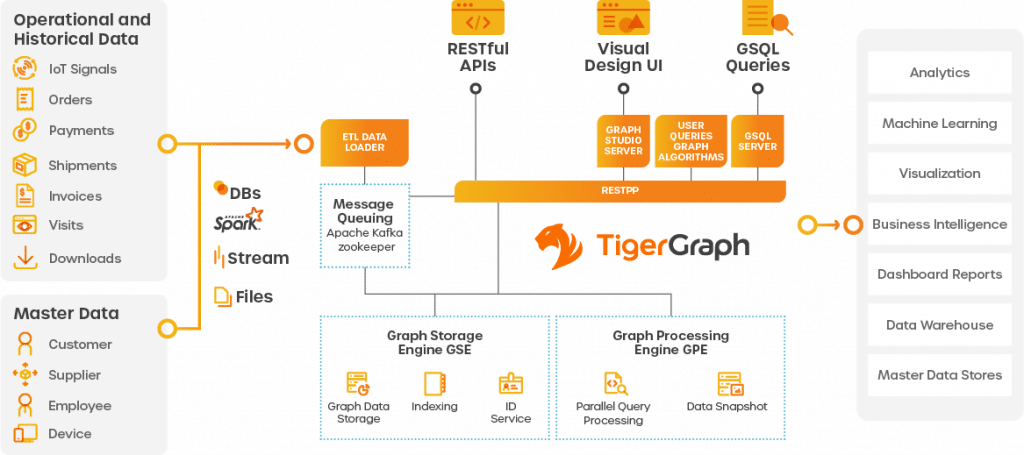
Because a TigerGraph instance is designed to process massive pools of data and uses a large number of processes to do so, choosing the correct hardware is critical to a successful deployment.
Dell PowerEdge R660 and R760 servers with 4th generation Intel Xeon Scalable processors deliver a fast, scalable, portable, and cost-effective solution to implement and operationalize deep analysis of large pools of data.
Workload description
To test the performance of TigerGraph, we chose the Linked Data Benchmark Council SNB BI benchmark.
The Linked Data Benchmark Council (LDBC) is a non-profit organization that helps to define standard graph benchmarks to foster a community around graph processing technologies. LDBC consists of members from both industry and academia, including organizations (such as Intel) and individuals.
The Social Network Benchmark (SNB) suite defines graph workloads that target database management systems. One of these is the Business Intelligence (BI) workload, which focuses on aggregation- and join-heavy complex queries that touch a large portion of the graph with microbatches of insert/delete operations. The SNB BI specification standardizes the dataset schema, data generation technique, size, and graph queries to be performed.
The SNB BI dataset represents a social network database (with Forums, Posts, Comments, and so on). In addition to analytics queries, it defines daily batches of updates to simulate changes in the social network over time (adding/removing posts, comments, users, and so on).
The reference implementation of the benchmark is responsible for loading the data into the database, scheduling the queries, collecting the metrics, and producing scoring results.
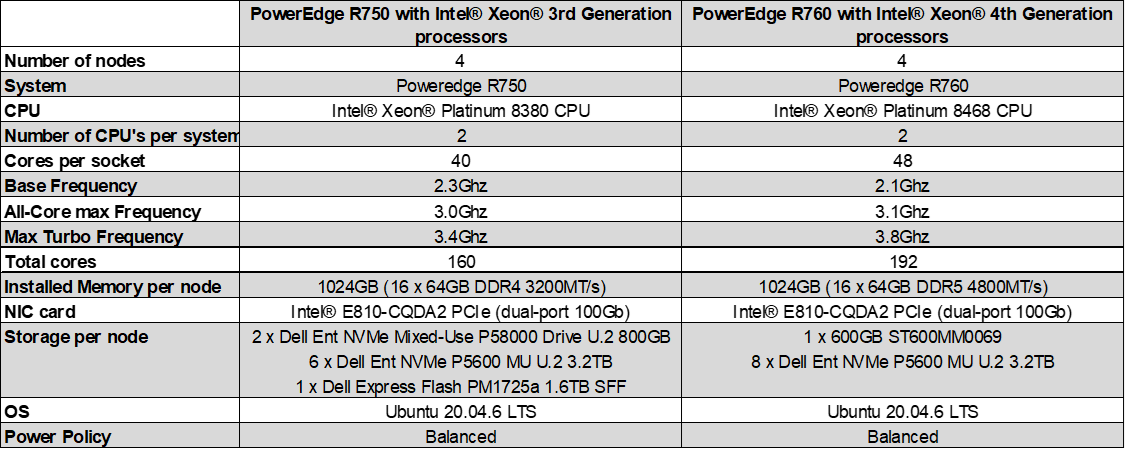
Configurations tested

Results
The following graphs highlight the relative performance differences between the two architectures.
Benchmark Score
Load Time
*Performance varies by use, configuration, and other factors. For the configuration details of this test, see the following section.
Test configuration details
- 3rd Gen Intel Xeon Scalable Processors (baseline): Test by Intel as of 04/28/23. 1-node, 2x Intel Xeon Platinum 8380 CPU @ 2.30GHz, 40 cores, HT On, Turbo On, Total Memory 1024GB (16x64GB DDR4 3200 MT/s [3200 MT/s]), BIOS 1.9.2, microcode 0xd000389, 2x NetXtreme BCM5720 2-port Gigabit Ethernet PCIe, 2x Ethernet Controller E810-C for QSFP, 2x 745.2G Dell Ent NVMe P5800x WI U.2 800GB, 6x 2.9T Dell Ent NVMe P5600 MU U.2 3.2TB, 1x 1.5T Dell Express Flash PM1725a 1.6TB SFF, Ubuntu 20.04.6 LTS, 5.15.0-71-generic, LDBC SNB BI v., TigerGraph 3.7
- 4th Gen Intel Xeon Scalable Processors: Test by Intel as of 04/28/23. 1-node, 2x Intel Xeon Platinum 8468, 48 cores, HT On, Turbo On, Total Memory 1024GB (16x64GB DDR5 4800 MT/s [4800 MT/s]), BIOS 1.0.1, microcode 0x2b000181, 2x NetXtreme BCM5720 2-port Gigabit Ethernet PCIe, 2x Ethernet Controller E810-C for QSFP, 1x 558.9G ST600MM0069, 8x 2.9T Dell Ent NVMe P5600 MU U.2 3.2TB, Ubuntu 20.04.6 LTS, 5.15.0-71-generic, LDBC SNB BI v., TigerGraph 3.7
Key takeaways
PowerEdge servers with 4th Generation Intel Xeon Platinum processors delivered up to 1.15x better throughput than 3rd Generation Intel Xeon Platinum processors and were able to load the data set up to 1.27x faster (for TigerGraph in the LDBC SNB BI benchmark).
Conclusion
Choosing the right combination of server and processor can increase performance and reduce latency. As this testing demonstrated, the Dell PowerEdge R760 with 4th Generation Intel Xeon Platinum 8468 CPUs delivered up to a 15% performance improvement for business intelligence queries than the Dell PowerEdge R750 with 3rd Generation Intel Xeon Platinum 8380 CPUs, and were able to load the data set up to 27% faster simply by upgrading the platform to Intel 4th Gen Xeon Gold Scalable processors.
[ii] https://www.tigergraph.com/press-article/tigergraph-recognized-for-the-first-time-in-the-2022-gartner-magic-quadrant-for-cloud-database-management-systems-2/

Driving Advanced Graph Analytics with TigerGraph on Next Gen PE Servers and 4th Gen Intel® Xeon® Processors
Tue, 30 Jan 2024 22:49:38 -0000
|Read Time: 0 minutes
Summary
This joint paper describes the key hardware considerations when configuring a successful Tigergraph database deployment and recommends configurations based on the next generation Dell PowerEdge Server portfolio offerings.
TigerGraph helps make graph technology more accessible. TigerGraph DB is democratizing the adoption of advanced analytics with Intel’s 4th Generation Intel Xeon Scalable Processors by enabling non-technical users to accomplish as much with graphs as the experts do. TigerGraph is a native parallel graph database purpose-built for analyzing massive amounts of data (terabytes).
Dell PowerEdge R660 and R760 servers with 4th Generation Intel Xeon Scalable processors deliver a fast, scalable, portable, and cost-effective solution to implement and operationalize deep analysis of large pools of data.
Key considerations and industry use cases
- Manufacturing/Supply Chain. Delays in orders or shipments that cannot reach their final destination translate to poor customer experience, increased customer attrition, financial penalties for delivery delays and the loss of potential customer revenues.
With the mounting strains on global supply chains, companies are now investing heavily into technologies and processes to enhance adaptability and resiliency in their supply chains.
Real-time analysis of changes in supply and demand requires expensive database joins across the board, with the data for suppliers, orders, products, locations, and the inventory for parts and sub-assemblies. Global supply chains have multiple manufacturing partners, requiring integrating the external data from partners with the internal data. TigerGraph, Intel, and Dell Technologies provide a powerful Graph engine to find product relations and shipping alternatives for your business needs.
- Financial Services. Fraudsters are getting more sophisticated over time, creating a network of synthetic identities that combine legitimate information, such as social security or national identification number, name, phone number, and physical address. TigerGraph’s solutions on 4th Generation Intel Xeon Scalable Processors help you isolate and identify issues to keep your business safe.
- Recommendation Engines. Every business faces the challenge of maximizing the revenue opportunity from every customer interaction. Companies offering a wide range of products or services face the additional challenge of matching the right product or service based on immediate browsing and search activity along with the historical data for the customer. TigerGraph’s Recommendation Engine on 4th Generation Intel Xeon Scalable Processors powers purchases with increased click-through results leading to higher average order value and increased per-visit spend for your shoppers.
- The Dell PERC H755N NVMe RAID controller and the new PERC 965i RAID controller with Self-Encrypting Drives (SED) provide additional security for stored data. Whether drives are lost, stolen, or failed, unauthorized access is prevented by rendering the drive unreadable without the encryption key. It also offers additional benefits, including regulatory compliance and secure decommissioning. Both controllers support Local Key Management (LKM) and external key management systems using Secure Enterprise Key Manager (SEKM).
Recommended configurations
Cost-optimized configuration | |
Platform | PowerEdge R660 supporting up to 8 NVMe drives in RAID config or the PowerEdge R760 with support for up to 24 NVMe drives |
CPU* | 2x Intel® Xeon® Gold 5420+ processor* (28 cores, 2.0GHz base/2.7GHz all core turbo frequency) |
DRAM | 256 GB (16x 16 GB DDR5-4800)* |
Boot device | Dell BOSS-S2 with 2x 240GB or 2x 480GB M.2 SATA SSD (RAID1) |
Storage adapter | Dell PERC H755 or H965i Front NVMe RAID Controller |
Storage | 2x (up to 8x) 1.6TB Enterprise NVMe Mixed Use P5620 Drive, U2 Gen4 |
NIC | Intel® E810-XXVDA2 for OCP3 (dual-port 25Gb) |
* Memory attached to the Gold 5420+ operates at DDR5-4400 memory speeds.
Balanced configuration | |
Platform | PowerEdge R660 supporting up to 8 NVMe drives in RAID config or the PowerEdge R760 with support for up to 24 NVMe drives |
CPU | 2x Intel® Xeon® Gold 6448Y processor (32 cores, 2.2GHz base/3.0GHz all core turbo frequency) |
DRAM | 512 GB (16x 32 GB DDR5-4800) |
Boot device | Dell BOSS-S2 with 2x 240GB or 2x 480GB M.2 SATA SSD (RAID1) |
Storage adapter | Dell PERC H755 or H965i Front NVMe RAID Controller |
Storage | 2x (up to 8x) 1.6TB Enterprise NVMe Mixed Use P5620 Drive, U2 Gen4 |
NIC | Intel® E810-XXVDA2 for OCP3 (dual-port 25Gb) |
High-performance configuration | |
Platform | PowerEdge R660 supporting up to 8 NVMe drives in RAID config or the PowerEdge R760 with support for up to 24 NVMe drives |
CPU | 2x Intel® Xeon® Platinum 8468 processor (48 cores, 2.1GHz base/3.1GHz all core turbo frequency) with Intel Speed Select technology |
DRAM | 1 TB (32x 32 GB DDR5-4800) |
Boot device | Dell BOSS-S2 with 2x 240GB or 2x 480GB M.2 SATA SSD (RAID1) |
Storage adapter | Dell PERC H755 or H965i Front NVMe RAID Controller |
Storage | 2x (up to 8x) 1.6TB Enterprise NVMe Mixed Use P5620 Drive, U2 Gen4 |
NIC | Intel® E810-XXVDA2 for OCP3 (dual-port 25Gb), or Intel® E810-CQDA2 PCIe (dual-port 100Gb) |
Learn more
Visit the Dell support page or contact Dell for a customized quote 1-877-289-3355 You can also visit the Intel-Dell website for more information.
Read:

Driving Advanced Graph Analytics with TigerGraph on 15G PowerEdge Servers and 3rd Gen Intel® Xeon® Processors
Tue, 30 Jan 2024 22:23:26 -0000
|Read Time: 0 minutes
Summary
This joint paper describes the key hardware considerations when configuring a successful Tigergraph database deployment, and recommends configurations based on the 15th Generation Dell PowerEdge Server portfolio offerings.
TigerGraph helps make graph technology more accessible. TigerGraph 3.x is democratizing the adoption of advanced analytics with Intel’s 3rd Generation Intel Xeon Scalable Processors by enabling non-technical users to accomplish as much with graphs as the experts do. TigerGraph is a native parallel graph database purpose-built for analyzing massive amounts of data (terabytes).
Dell PowerEdge R650 and R750 servers with 3rd Generation Intel Xeon Scalable processors deliver a fast, scalable, portable, and cost-effective solution to implement and operationalize deep analysis of large pools of data.
Key considerations and industry use cases
- Manufacturing/Supply Chain. Delays in orders or shipments that cannot reach their final destination translate to poor customer experience, increased customer attrition, financial penalties for delivery delays, and the loss of potential customer revenues.
With the mounting strains on global supply chains, companies are now investing heavily in technologies and processes to enhance adaptability and resiliency in their supply chains.
Real-time analysis of changes in supply and demand requires expensive database joins across the board, with the data for suppliers, orders, products, locations, and inventory for parts and sub-assemblies. Global supply chains have multiple manufacturing partners, requiring integrating the external data from partners with the internal data. TigerGraph, Intel, and Dell Technologies provide a powerful Graph engine to find product relations and shipping alternatives for your business needs.
- Financial Services. Fraudsters are getting more sophisticated over time, creating a network of synthetic identities that combine legitimate information, such as social security or national identification number, name, phone number, and physical address. TigerGraph’s solutions on 3rd Generation Intel Xeon Scalable Processors help you isolate and identify issues to keep your business safe.
- Recommendation Engines. Every business faces the challenge of maximizing the revenue opportunity from every customer interaction. Companies offering a wide range of products or services face the additional challenge of matching the right product or service based on immediate browsing and search activity along with the historical data for the customer. TigerGraph’s Recommendation Engine on 3rd Generation Intel Xeon Scalable Processors powers purchases with increased click-through results, leading to higher average order value and increased per-visit spend for your shoppers.
- The Dell PERC H755N NVMe RAID controller with Self-Encrypting Drives (SED) provides additional security for stored data. Whether drives are lost, stolen, or failed, unauthorized access is prevented by rendering the drive unreadable without the encryption key. It also offers additional benefits, including regulatory compliance and secure decommissioning. The PERC H755N controller supports Local Key Management (LKM) and external key management systems using Secure Enterprise Key Manager (SEKM).
Recommended configurations
Cost-optimized configuration | |
Platform | PowerEdge R650 supporting up to 8 NVMe drives in RAID config or the PowerEdge R750 with support for up to 24 NVMe drives |
CPU* | 2x Intel® Xeon® Gold 5320 processor* (26 cores, 2.2GHz base/2.8GHz all core turbo frequency) |
DRAM | 256 GB (16x 16GB DDR4-3200) |
Boot device | Dell BOSS-S2 with 2x 240GB or 2x 480GB M.2 SATA SSD (RAID1) |
Storage adapter | Dell PERC H755N Front NVMe RAID Controller |
Storage | 2x (up to 8x) 1.6TB Enterprise NVMe Mixed Use P5620 Drive, U2 Gen4 |
NIC | Intel® E810-XXVDA2 for OCP3 (dual-port 25Gb) |
* Memory attached to the Gold 5320 operates at DDR4-2933 memory speeds.
Balanced configuration | |
Platform | PowerEdge R650 supporting up to 8 NVMe drives in RAID config or the PowerEdge R750 with support for up to 24 NVMe drives |
CPU | 2x Intel® Xeon® Gold 6348 processor (28 cores, 2.6GHz base/3.4GHz all core turbo frequency) |
DRAM | 512 GB (16x 32GB DDR4-3200) |
Boot device | Dell BOSS-S2 with 2x 240GB or 2x 480GB M.2 SATA SSD (RAID1) |
Storage adapter | Dell PERC H755N Front NVMe RAID Controller |
Storage | 2x (up to 8x) 1.6TB Enterprise NVMe Mixed Use P5620 Drive, U2 Gen4 |
NIC | Intel® E810-XXVDA2 for OCP3 (dual-port 25Gb) |
High-performance configuration | |
Platform | PowerEdge R650 supporting up to 8 NVMe drives in RAID config or the PowerEdge R750 with support for up to 24 NVMe drives |
CPU | 2x Intel® Xeon® Platinum 8380 processor (40 cores, 2.3GHz base/3.0GHz all core turbo frequency) with Intel Speed Select technology |
DRAM | 1 TB (32x 32GB DDR4-3200) |
Boot device | Dell BOSS-S2 with 2x 240GB or 2x 480GB M.2 SATA SSD (RAID1) |
Storage adapter | Dell PERC H755N Front NVMe RAID Controller |
Storage | 2x (up to 8x) 1.6TB Enterprise NVMe Mixed Use P5620 Drive, U2 Gen4 |
NIC | Intel® E810-XXVDA2 for OCP3 (dual-port 25Gb), or Intel® E810-CQDA2 PCIe (dual-port 100Gb) |
Learn more
Visit the Dell support page or contact Dell for a customized quote 1-877-289-3355 You can also visit the Intel-Dell website for more information.
Read:

Achieving Significant Virtualization Performance Gains with New 16G Dell® PowerEdge™ R760 Servers

Thu, 25 Jan 2024 17:43:01 -0000
|Read Time: 0 minutes
Summary
With the latest Dell PowerEdge R760 16G servers utilizing the PCIe® 5.0 interface to connect networking and storage to the CPU, there are great performance increases in data movement over previous PCIe generations. These improvements can be utilized by hyperconverged infrastructures running on these servers.
This Direct from Development (DfD) tech note presents a generational server performance comparison in a virtualized environment comparing new 16G Dell PowerEdge R760 servers deployed with new KIOXIA CM7 Series SSDs with prior generation 14G Dell PowerEdge R740xd servers deployed with prior generation KIOXIA CM6 Series SSDs.
As presented by the test results, the latest Dell generation PowerEdge servers perform the same amount of work in less time and deliver faster performance in a virtualized environment when compared with prior PCIe server generations.
Market positioning
Data center infrastructures typically fall into three categories: traditional, converged and hyperconverged. Hyperconverged infrastructures enable users to add compute, memory and storage requirements as needed, delivering the flexibility of horizontal and vertical scaling. However, many virtual machine (VM) configurations run in converged infrastructures, and their ability to scale is often difficult when VM clusters require more storage.
VMware®, Inc. enables hyperconverged infrastructures through VMware ESXi™ and VMware vSAN™ platforms. The VMware ESXi platform is a popular enterprise-grade virtualization platform that scales compute and memory as needed and provides simple management of large VM clusters. The VMware vSAN platform enables the infrastructure to transition from converged to hyperconverged, delivering incredibly fast performance since storage is local to the servers themselves. The platforms support a new VMware vSAN Express Storage Architecture™ (ESA) that has gone through a series of optimizations to utilize NVMe™ SSDs more efficiently than in the past.
Product features
Dell PowerEdge 760 Rack Server (Figure 1)
Specifications: https://www.delltechnologies.com/asset/en-us/products/servers/technical-support/poweredge-r760-spec-sheet.pdf.
Figure 1: Side angle of Dell PowerEdge 760 Rack Server1
KIOXIA CM7 Series Enterprise NVMe SSD (Figure 2) Specifications:https://americas.kioxia.com/en-us/business/ssd/enterprise-ssd.html.
Figure 2: Front view of KIOXIA CM7 Series SSD2
PCIe 5.0 and NVMe 2.0 specification compliant; Two configurations: CM7-R Series (read intensive), 1 Drive Write Per Day3 (DWPD), up to 30,720 gigabyte4 (GB) capacities and CM7-V Series (higher endurance mixed use), 3 DWPD, up to 12,800 GB capacities.
Performance specifications: SeqRead = up to 14,000 MB/s; SeqWrite = up to 7,000 MB/s; RanRead = up to 2.7M IOPS; RanWrite = up to 600K IOPS.
Hardware/Software test configuration
The hardware and software equipment used in this virtualization comparison (Figure 3):
Server Information | ||
Server Model | Dell PowerEdge R7605 | Dell PowerEdge R740xd6 |
No. of Servers | 3 | 3 |
BIOS Version | 1.3.2 | 2.18.1 |
CPU Information | ||
CPU Model | Intel® Xeon® Gold 6430 | Intel Xeon Silver 4214 |
No. of Sockets | 2 | 2 |
No. of Cores | 64 | 24 |
Frequency (in gigahertz) | 2.1 GHz | 2.2 GHz |
Memory Information | ||
Memory Type | DDR5 | DDR4 |
Memory Speed (in megatransfers per second) | 4,400 MT/s | 2,400 MT/s |
Memory Size (in gigabytes) | 16 GB | 32 GB |
No. of DIMMs | 16 | 12 |
Total Memory (in gigabytes) | 256 GB | 384 GB |
SSD Information | ||
SSD Model | KIOXIA CM7-R Series | KIOXIA CM6-R Series |
Form Factor | 2.5-inch7 | 2.5-inch |
Interface | PCIe 5.0 x4 | PCIe 4.0 x4 |
No. of SSDs | 12 | 12 |
SSD Capacity (in terabytes4) | 3.84 TB | 3.84 TB |
Drive Write(s) Per Day (DWPD) | 1 | 1 |
Active Power | 25 watts | 19 watts |
Operating System Information | ||
Operating System (OS) | VMware ESXi | VMware ESXi |
OS Version | 8.0.1, 21813344 | 8.0.1, 21495797 |
VMware vCenter® Version | 8.0.1.00200 | 8.0.1.00200 |
Storage Type | vSAN ESA | vSAN ESA |
Load Generator Information (Test Software) | ||
Load Generator | HyperConverged Infrastructure Benchmark (HCIBench) | HCIBench |
Load Generator Version | 2.8.2 | 2.8.2 |
Figure 3: Hardware/Software configuration used in the comparison
Set-up and test procedures
Set-up:
The latest VMware ESXi 8.0 operating system was installed on all hosts.
Two clusters were created in VMware’s vCenter management interface with ‘High Availability’ and ‘Distributed Resource Scheduler’ disabled for testing.
Each Dell PowerEdge R760 host was added into a cluster - then each Dell PowerEdge R740xd host was added into a separate cluster.
VMkernel adapters were set up to have VMware vMotion™ migration, provisioning, management and the VMware vSAN platform enabled for both test configurations.
In the VMware vSAN configurations, twelve KIOXIA CM7 Series drives were added for the Dell PowerEdge R760 cluster (four drives per server), and twelve KIOXIA CM6 Series drives were added for the Dell PowerEdge R740xd cluster (four drives per server). The default storage policy was set to ‘vSAN ESA Default Policy – RAID 5’ for both configurations.
The HCIBench load generator (virtual appliance) was then imported and configured on the network.
Test procedures:
The latest VMware ESXi 8.0 operating system was installed on all hosts.
Six tests were run on each cluster – four performance tests and two power consumption tests as follows:
Performance tests:
IOPS: This metric measured the number of Input/Output operations per second that the system completed. Throughput: This metric measured the amount of data transferred per second to and from the storage devices.
Read Latency: This metric measured the time it took to perform a read operation. It included the average time it took for the load generator to not only issue the read operation, but also the time it took to complete the operation and receive a ‘successfully completed’ acknowledgement.
Write Latency: This metric measured the time it took to perform a write operation. It included the average time it took for the load generator to not only issue the write operation, but also the time it took to complete the operation and receive a ‘successfully completed’ acknowledgement.
Power consumption tests:
IOPS per Watt: This metric measured the amount of IOPS performed in conjunction with the power consumed by the cluster.
Throughput per Watt: This metric measured the amount of throughput performed in conjunction with the power consumed by the cluster.
For the four performance tests, the following five workloads were run with the test results recorded. For the two power consumption tests, the latter four workloads were run with the test results recorded.
100% Sequential Write (256K block size, 1 thread): This workload is representative of a data logging use case. 100% Random Read (4K block size, 4 threads): This workload is representative of a read cache system.
Random 70% Read / 30% Write (4K block size, 4 threads): This workload is representative of a common mixed read/write ratio used in commercial database systems.
Random 50% Read /50% Write (4K block size, 4 threads): This workload is representative of other common IT use cases such as email.
Blender (block sizes/threads vary): This workload is representative of a mix of many types of sequential and random workloads at various block sizes and thread counts as VMs request storage against the vSAN storage pool.
Test results8
IOPS (Figure 4): The results are in IOPS - the higher result for each is better.
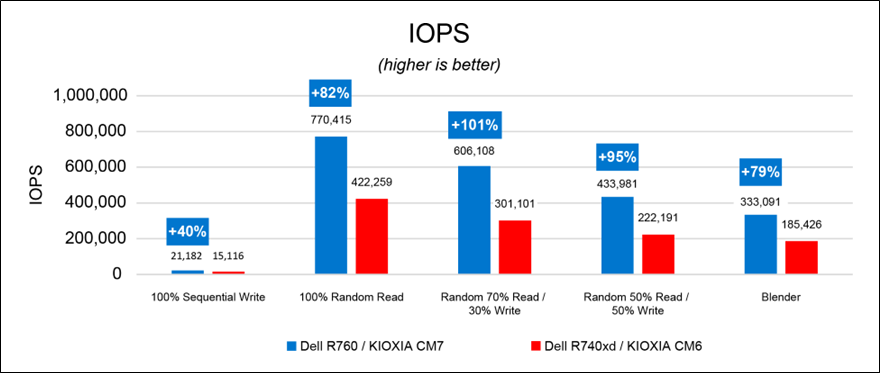
Figure 4: IOPS results
Throughput (Figure 5): The results are in megabytes per second (MB/s) - the higher result for each is better.
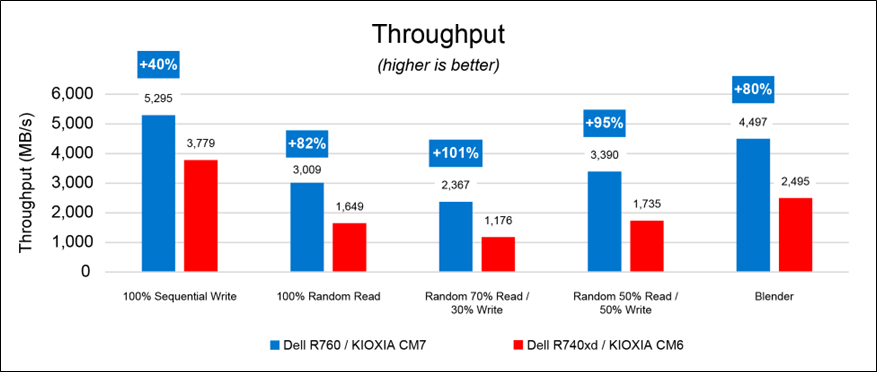
Figure 5: throughput results
Read Latency (Figure 6): The results are in milliseconds (ms) - the lower result for each is better. The 100% sequential write workloads for both configurations were not included for this test as the workload does not include read operations.
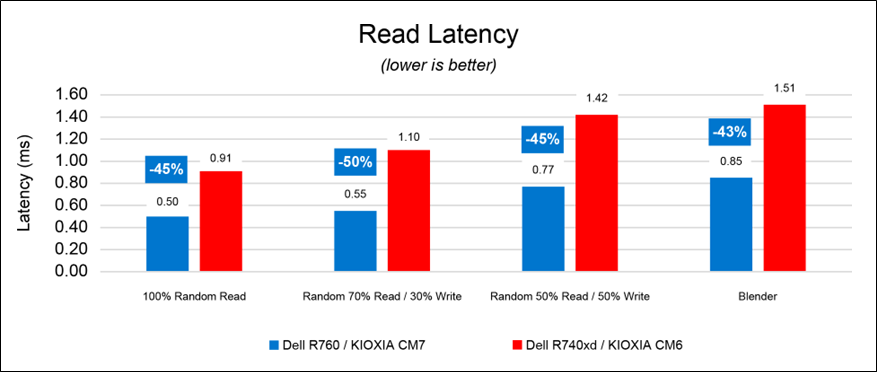
Figure 6: read latency results
Write Latency (Figure 7): The results are in milliseconds - the lower result for each is better. The 100% random read workloads for both PCIe configurations were not included for this test as the workload does not include write operations.
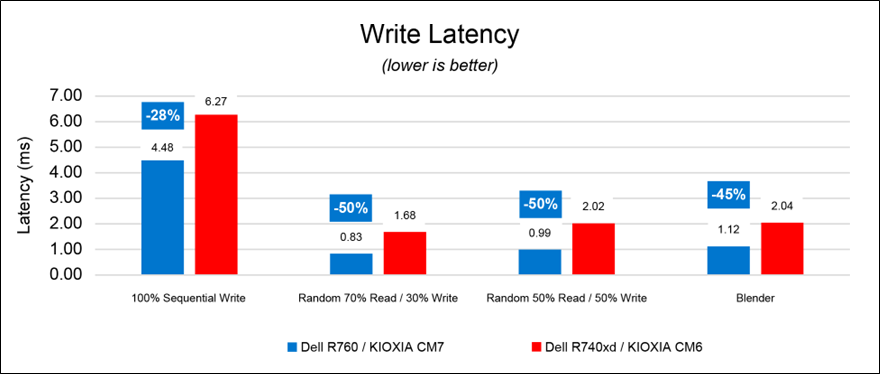
Figure 7: write latency results
IOPS per Watt (Figure 8): The results show the amount of IOPS performed per power consumed by the cluster and are in IOPS per watt (IOPS/W). The higher result for each is better.
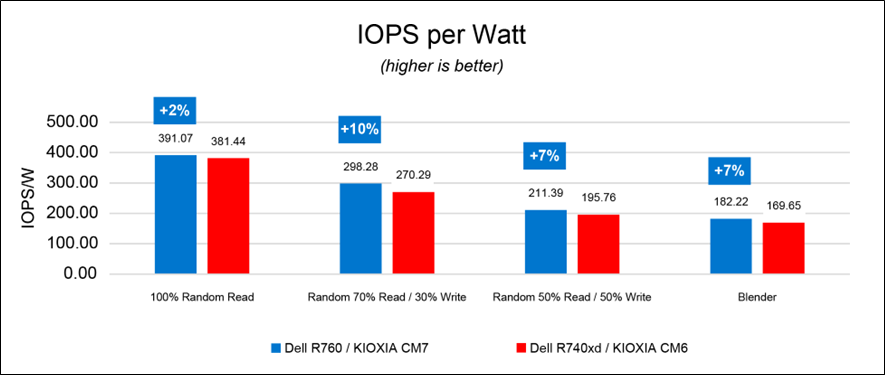
Figure 8: IOPS per watt results
Throughput per Watt (Figure 9): The results show the amount of throughput performed per power consumed by the cluster and are in MB/s per watt (MBps/W). The higher result for each is better.
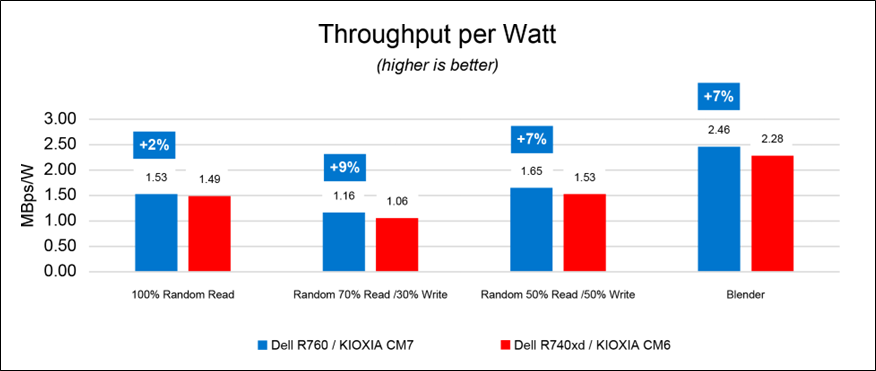
Figure 9: throughput per watt results
Final analysis
The Dell PowerEdge R760 servers equipped with new KIOXIA CM7 Series enterprise NVMe SSDs outperformed the Dell PowerEdge 740xd servers and SSDs in IOPS, throughput and latency. They also delivered higher performance per watt. With the newer generation of Dell PowerEdge servers, there are notable performance increases associated with hyperconverged infrastructures that directly affect server, CPU, memory and storage performance when compared with prior generations.
References
Footnotes
1. The product image shown is a representation of the design model and not an accurate product depiction.
2. The product image shown was provided with permission from KIOXIA America, Inc. and is a representation of the design model and not an accurate product depiction.
3. Drive Write Per Day (DWPD) means the drive can be written and re-written to full capacity once a day, every day for five years, the stated product warranty period. Actual results may vary due to system configuration, usage and other factors. Read and write speed may vary depending on the host device, read and write conditions and file size.
4. Definition of capacity - KIOXIA Corporation defines a megabyte (MB) as 1,000,000 bytes, a gigabyte (GB) as 1,000,000,000 bytes and a terabyte (TB) as 1,000,000,000,000 bytes. A computer operating system, however, reports storage capacity using powers of 2 for the definition of 1Gbit = 230 bits = 1,073,741,824 bits, 1GB = 230 bytes = 1,073,741,824 bytes and 1TB = 240 bytes = 1,099,511,627,776 bytes and therefore shows less storage capacity. Available storage capacity (including examples of various media files) will vary based on file size, formatting, settings, software and operating system, and/or pre-installed software applications, or media content. Actual formatted capacity may vary.
5. The Dell PowerEdge R760 server features a PCIe 4.0 backplane.
6. The Dell PowerEdge R740xd server features a PCIe 3.0 backplane.
7. 2.5-inch indicates the form factor of the SSD and not its physical size.
8. Read and write speed may vary depending on the host device, read and write conditions and file size.
Trademarks
Dell and PowerEdge are registered trademarks or trademarks of Dell Inc.
Intel and Xeon are registered trademarks of Intel Corporation or its subsidiaries in the U.S. and/or other countries NVMe is a registered or unregistered trademark of NVM Express, Inc. in the United States and other countries. PCIe is a registered trademark of PCI-SIG.
VMware, VMware ESXi, VMware vMotion, VMware vSAN, VMware vSAN Express Storage Architecture and VMware vCenter are registered trademarks or trademarks of VMware Inc. in the United States and/or various jurisdictions.
All other company names, product names and service names may be trademarks or registered trademarks of their respective companies.
Disclaimers
© 2023 Dell, Inc. All rights reserved. Information in this tech note, including product specifications, tested content, and assessments are current and believed to be accurate as of the date that the document was published and subject to change without prior notice. Technical and application information contained here is subject to the most recent applicable product specifications.

Launch Flexible Machine Learning Models Quickly with cnvrg.io® on Red Hat OpenShift
Wed, 17 Jan 2024 14:11:31 -0000
|Read Time: 0 minutes
Summary
Data scientists hold a high degree of responsibility to support the decision-making process of companies and their strategies. To this end, data scientists extract insights from a large amount of heterogeneous data through a set of iterative tasks that include various aspects: cleaning and formatting the data available to them, building training and testing datasets, mining data for patterns, deciding on the type of data analysis to apply and the ML methods to use, evaluating and interpreting the results, refining ML algorithms, and possibly even managing infrastructure. To ensure that data scientists can deliver the most impactful insights for their companies efficiently and effectively, convrg.io provides a unified platform to operationalize the full machine learning (ML) lifecycle from research to production.
As the leading data-science platform for ML model operationalization (MLOps) and management, cnvrg.io is a pioneer in building cutting-edge ML development solutions that provide data scientists with all the tools they need in one place to streamline their processes. In addition, by deploying MLOps on Red Hat OpenShift, data scientists can launch flexible, container-based jobs and pipelines that can easily scale to deliver better efficiency in terms of compute resource utilization and cost. Infrastructure teams can also manage and monitor ML workloads in a single managed and cloud-native environment. For infrastructure architects who are deploying cnvrg.io on Dell PowerEdge servers and Intel® components, this document provides recommended hardware bill of materials (BoM) configurations to help get them started.
Key considerations
Key considerations for using the recommended hardware BoMs for deploying cnvrg.io on Red Hat OpenShift include:
- Provision external storage. When deploying cnvrg.io on Red Hat OpenShift, local storage is used only for container images and ephemeral volumes. External persistent storage volumes should be provisioned on a storage array or on another solution that you already have in place. If you do not already have a persistent storage solution, contact your Dell Technologies representative for guidance.
- Use high-performance object storage. The hardware BoMs below assume that you use an in-cluster solution based on MinIO for object storage. The number of drives and the capacity for MinIO object storage depends on the dataset size and performance requirements. An alternative object store would be an external S3-compatible object store such as Elastic Cloud Storage (ECS) or Dell PowerScale (Isilon), powered by high-capacity Solidigm SSDs.
- Scale object storage independently. Object storage capacity can be scaled independently of worker nodes by deploying additional storage nodes. Both high-performance, high capacity (with NVM Express [NVMe] Solidigm solid-state drives [SSDs]), and high-capacity (with rotational hard-disk drives [HDDs]) configurations can be used. All nodes using NVMe drives should be configured with 100 Gbps network interface controllers (NICs) to take full advantage of the drives’ I/O throughput.
Recommended configurations
Controller nodes (3 nodes required) and worker nodes
Table 1. PowerEdge R660-based, up to 10 NVMe drives, 1RU
Feature | Control-Plane (Master) Nodes | ML/Artificial Intelligence (AI) CPU Cluster (Worker) Nodes | |
Platform | Dell R660 supporting 10 x 2.5” drives with NVMe backplane - direct connection | ||
CPU |
| Base configuration | Plus configuration |
2x Xeon® Gold 6426Y (16c @ 2.5GHz) | 2x Xeon® Gold 6448Y (32c @ 2.1GHz) | 2x Xeon® Platinum 8468 (48c @ 2.1GHz) | |
DRAM | 128GB (8x 16GB DDR5-4800) | 256GB (16x 16GB DDR5-4800) | 512GB (16x 32GB DDR5-4800) |
Boot device | Dell BOSS-N1 with 2x 480GB M.2 NVMe SSD (RAID1) | ||
Storage[1] | 1x 1.6TB Solidigm[2] D7-P5620 SSD (PCIe Gen4, Mixed-use) | 2x 1.6TB Solidigm2 D7-P5620 SSD (PCIe Gen4, Mixed-use) | |
Object storage[3] | N/A | 4x (up to 10x) 1.92TB, 3.84TB or 7.68TB Solidigm D7-P5520 SSD (PCIe Gen4, Read-Intensive) | |
Shared storage[4] | N/A | External | |
NIC[5] | Intel® X710-T4L for OCP3 (Quad-port 10Gb) | Intel® X710-T4L for OCP3 (Quad-port 10Gb), or Intel® E810-CQDA2 PCIe add-on card (dual-port 100Gb) | |
Additional NIC for external storage[6] | N/A | Intel® X710-T4L for OCP3 (Quad-port 10Gb), or Intel® E810-CQDA2 PCIe add-on card (dual-port 100Gb) | |
Optional – Dedicated storage nodes
Figure 2. PowerEdge R660-based, up to 10 NVMe drives or 12 SAS drives, 1RU
Feature | Description | |
Node type | High performance | High capacity |
Platform | Dell R660 supporting 10x 2.5” drives with NVMe backplane | Dell R760 supporting 12x 3.5” drives with SAS/SATA backplane |
CPU | 2x Xeon® Gold 6442Y (24c @ 2.6GHz) | 2x Xeon® Gold 6426Y (16c @ 2.5GHz) |
DRAM | 128GB (8x 16GB DDR5-4800) | |
Storage controller | None | HBA355e adapter |
Boot device | Dell BOSS-N1 with 2x 480GB M.2 NVMe SSD (RAID1) | |
Object storage3 | up to 10x 1.92TB / 3.84TB / 7.68TB Solidigm D7-P5520 SSD (PCIe Gen4, Read-Intensive) | up to 12x 8TB/16TB/22TB 3.5in 12Gbps SAS HDD 7.2k RPM |
NIC4 | Intel® E810-CQDA2 PCIe add-on card (dual-port 100Gb) | Intel® E810-XXV for OCP3 (dual-port 25Gb) |
Learn more
Contact your Dell or Intel account team for a customized quote at 1-877-289-3355
[1] Local storage used only for container images and ephemeral volumes; persistent volumes should be provisioned on an external storage system.
[2] Formerly Intel
[3] The number of drives and capacity for MinIO object storage depends on the dataset size and performance requirements.
[4] External shared storage required for Kubernetes persistent volumes.
[5] 100 Gb NICs are recommended for higher throughput.
[6] Optional, required only if a dedicated storage network for external storage system is necessary.

GPU Support for the PowerEdge R360 & T360 Servers Raises the Bar for Emerging Use Cases

Fri, 12 Jan 2024 17:31:43 -0000
|Read Time: 0 minutes
Summary
As we enter the New Year, the market for AI solutions across numerous industries continues to grow. Specifically, UBS predicts a jump from $2.2 billion in 2022 to $255 billion in 2027 [1]. This growth is not limited to large enterprises; GPU support on the new PowerEdge T360 and R360 servers gives businesses of any size the freedom to explore entry AI inferencing use cases, in addition to graphic-heavy workloads.
We tested both a 3D rendering and AI inferencing workload on a PowerEdge R360 with one NVIDIA A2 GPU[1] to fully showcase the added performance possibilities.
Achieve 5x rendering performance with the NVIDIA A2 GPU
For our first test, we used Blender’s OpenData benchmark. This open-source benchmark measures rendering performance of various 3D scenes on either CPU or GPU. We achieved up to 5x better rendering performance on GPU, compared to the same workload run only on CPU [1]. As a result, customers gain up to 1.70x the performance per every dollar invested on an A2 GPU vs CPU [2].
[1] Similar results can be expected on a PowerEdge T360 with the same configuration.
Reach max inferencing performance with limited CPU consumption
Part of the motivation behind adding GPU support is the growing demand among SMBs for on-premise, real-time, video and audio processing. Thus, to evaluate AI inferencing performance, we installed NVIDIA’s open-source DeepStream toolkit (version 6.3). DeepStream is primarily used to develop AI vision applications that leverage sensor data and various camera and video streams as input. These applications can be used across various industrial sectors (for example, real-time traffic monitoring systems or retail store aisle footage analysis). With the same PowerEdge R360, we conducted inferencing on 48 streams while utilizing just over 50% of the GPU, and a limited amount of the CPU [3]. Our CPU utilization during testing averaged about 8%.
The rest of this document provides more details about the testing conducted for these two distinct use cases of a PowerEdge T360 or R360 with GPU support.
Product Overview
The PowerEdge T360 and R360 are the latest servers to join the PowerEdge family. Both are cost-effective 1-socket servers designed for small to medium businesses with growing compute demands. They can be deployed in the office, the near-edge, or in a typical data analytic environment.
The biggest differentiator between the T360 and R360 is the form factor. The T360 is a tower server that can fit under a desk or even in a storage closet, while maintaining office-friendly acoustics. The R360, on the other hand, is a traditional 1U rack server. Both servers support the newly launched Intel® Xeon® E-series CPUs, 1 NVIDIA A2 GPU, as well as DDR5 memory, NVMe BOSS, PCIe Gen5 I/O ports, and the latest remote management capabilities.

Figure 1. From left to right, PowerEdge T360 and R360
NVIDIA A2 GPU Information
Unlike the analogous prior-generation servers, the recently launched PowerEdge T360 and R360 now support 1 NVIDIA A2 entry GPU. The A2 accelerates media intensive workloads, as well as emerging AI inferencing workloads. It is a single-width GPU stacked with 16GB of GPU memory and 40-60W configurable thermal design power (TDP). Read more about the A2 GPU’s up to 20x inference speedup and features here: A2 Tensor Core GPU | NVIDIA.
Testing Configuration
We conducted benchmarking on one PowerEdge R360 with the configuration in the table below. Similar results can be expected for the PowerEdge T360 with this same configuration. We tested in a Linux Ubuntu Desktop environment, version 20.04.6.
Table 1. PowerEdge R360 System Configuration
Component | Configuration |
CPU | 1x Intel® Xeon® E-2488, 8 cores |
GPU | 1x NVIDIA A2 |
Memory | 4x 32 GB DIMMs, DDR5 |
Drives | 1x 2 TB SATA HDD |
OS | Ubuntu 20.04.6 |
NIC | 2x Broadcom NetXtreme Gigabit Ethernet |
Accelerate 3D Rendering Workloads
Entry GPUs are often used in the media and entertainment industry for 3D modeling and rending. The NVIDIA A2 GPU is a powerful accelerator for these workloads. To highlight the magnitude of the acceleration, we ran the same Blender OpenData benchmark on CPU, and then only on GPU. Blender is a popular open-source 3D modeling software.
The benchmark evaluates the system’s rendering performance for three different 3D scenes, either on CPU or GPU only. Results, or scores, are reported in sample per minute. We ran the benchmark on CPU (Intel Xeon-E2488) three times, and then on GPU (NVIDIA A2) three times. The results in Table 2 below represent the average score of each of the three trials.
Results
Compared to the benchmark run only on CPU, we attained up to 5x better rendering performance with the same workload run on the A2 GPU [1]. Although we achieved over 4x better performance for all three 3D scenes, the classroom scene corresponds to the best result and is illustrated in the figure below.
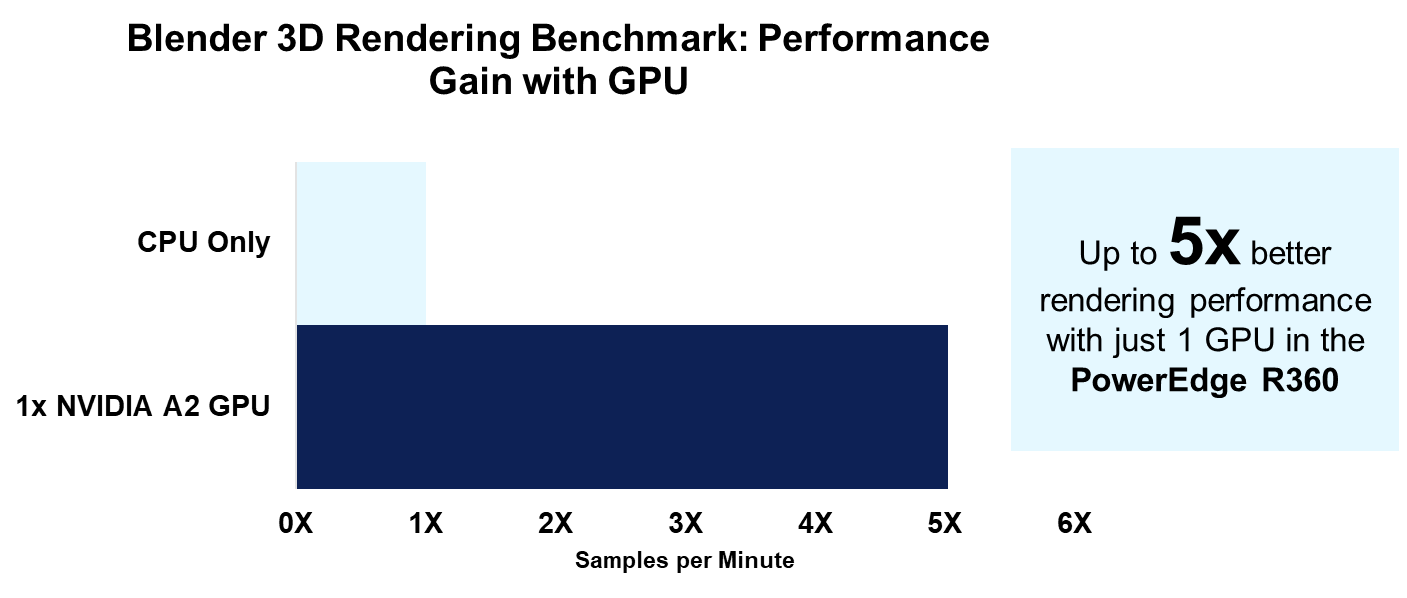
Figure 2. Rendering performance on CPU only and GPU only
Given this 5x better rendering performance, we calculated the performance per dollar for the cost of CPU compared to the cost of the GPU. For CPU performance, we divided the rendering score by the Dell US list price for the E-2488 CPU. For GPU performance, we divided the rendering score by the Dell US list price for the A2 GPU[2]. When comparing these results, we found customers can gain up to 1.70x the performance per every dollar spent on the GPU compared to the CPU [2].
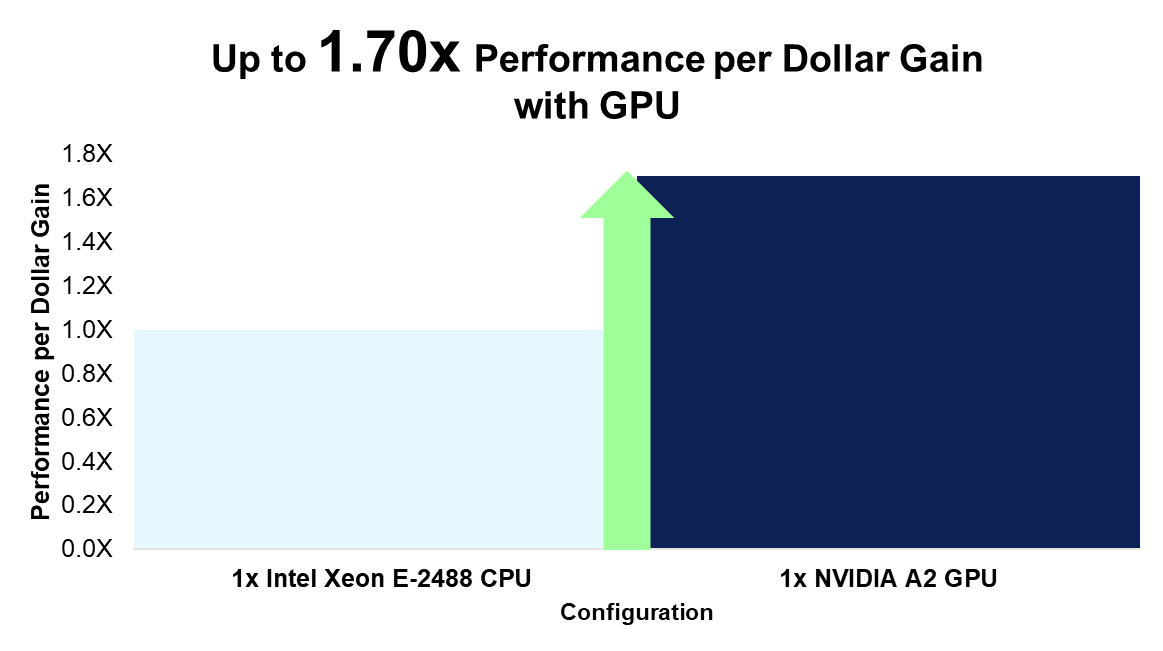
Figure 3. Rendering performance per dollar increase
Taking the analysis a step further, we also calculated the performance per dollar spent on a CPU compared to cost of both a CPU and GPU. This comparison is relevant for customers who are investing in both an Intel Xeon E-2488 CPU and NVIDIA A2 GPU for their PowerEdge R360/T360. While we calculated the CPU performance score the same way as above, we now divided the GPU rendering score by the Dell US list price for the A2 GPU + E-2488 CPU. When comparing these results, we found customers can gain up to 1.27x the performance per every dollar spent on both GPU and CPU compared to just CPU [2].
In other words, investing in an R360 with a E-2488 CPU and A2 GPU yields a higher return on investment for rendering performance compared to an R360 without an A2 GPU. It is also worth mentioning that the E-2488 CPU is the highest-end, and most expensive, CPU offered for both the T360 and R360. It is reasonable to expect an even higher return on investment for the A2 GPU when compared to the same system with a lower-end CPU.
The full results and scores are listed in the table below.
Table 2. Blender benchmark results
Scene | CPU Only, Samples per Min | NVIDIA A2 GPU, Samples per Min | Increase from CPU to GPU |
Monster | 98.664848 | 422.8827567 | 4.29x |
Junkshop | 62.561726 | 268.386526 | 4.29x |
Classroom | 47.35613467 | 237.8551867 | 5.02x |
Video Analytics Performance with NVIDIA DeepStream
While 3D rendering may be a more common workload for SMBs investing in entry-GPUs, the same GPU is also a powerful accelerator for entry AI inferencing and video analytic workloads. We used NVIDIA’s DeepStream version 6.3[3] to showcase the PowerEdge R360’s performance when running a sample video analytic application. DeepStream has a variety of sample applications and input streams available for testing. The given configuration files allow you to vary the number of streams for a run of the app which we explain in greater detail below. Input streams can range from photos, video files (with either h.264 or h.265 coding), or even RTSP IP cameras.
To better illustrate DeepStream’s functionality, consider the images below that were generated from our run of a DeepStream sample app. Instead of using a provided sample video, we used our own stock video of customers entering and leaving a bakery. The AI model in this scenario can identify people, cars, and bicycles. The images below, which are cropped outputs to zoom in on the person at the cash register, show how this vision application correctly identified these two customers with a bounding box and “person” label.
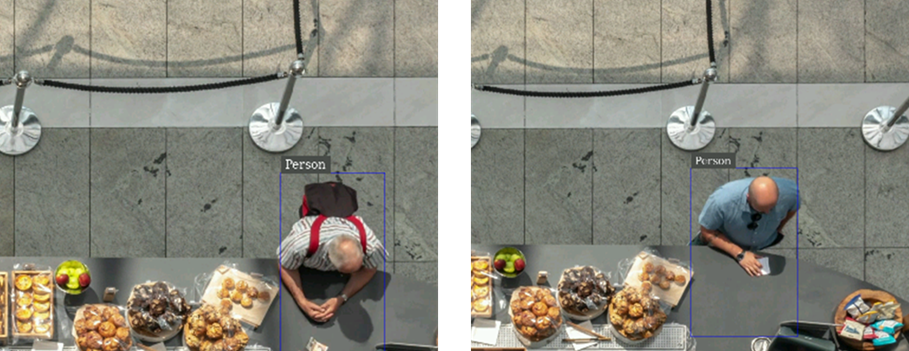
Figure 4. Cropped output of DeepStream sample app with modified source video
Instead of pre-recorded videos, an RTSP IP camera would theoretically allow a user to stream and analyze live footage of customers in a retail store. Check out this blog from the Dell AI Solutions team for a guide on how to get DeepStream up and running with a 1080p webcam for streaming RTSP output.
We also tested the DeepStream sample application with one of NVIDIA’s provided videos that shows cars, bicycles, and pedestrians on a busy road. The images below are screenshots of the sample app run with 1, 4, and 30 streams, respectively. In each tile, or stream, the given model places bounding boxes around the identified objects.
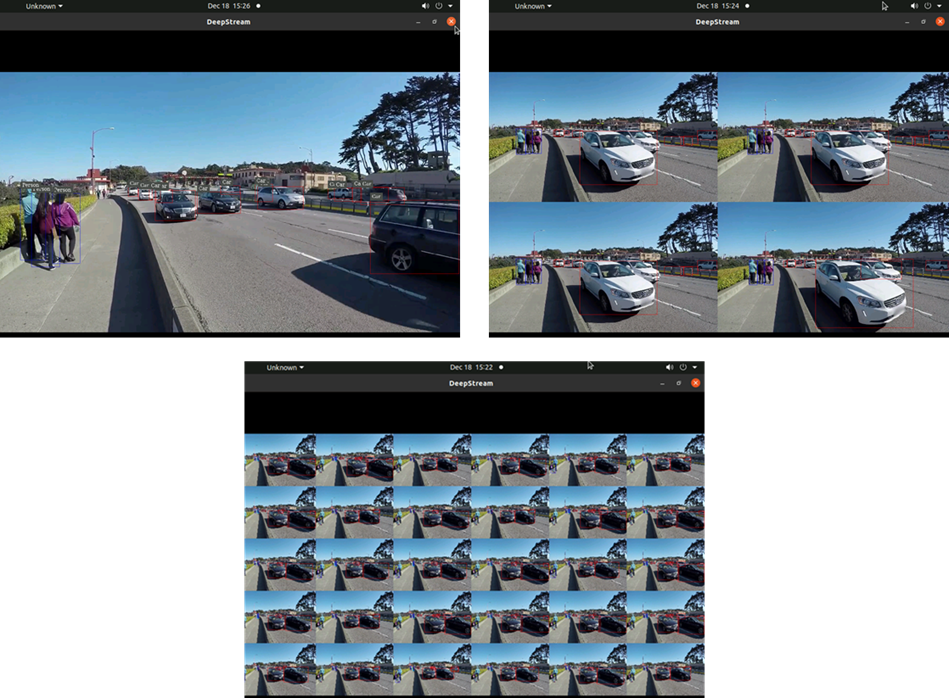
Figure 5. Deepstream sample video output with 1, 4, and 30 streams, respectively
Performance Testing Procedure
During a run of a sample application, NVIDIA measures performance as the number of frames per second (FPS) processed. An FPS score is displayed for each stream in 5 second intervals. For our testing, we followed the steps in the DeepStream 6.3 performance guide, which lists the appropriate modifications to the configuration file in order to maximize performance. All modifications were made to the source4_1080p_dec_infer-resnet_tracker_sgie_tiled_display_int8.txt configuration file, which is specifically described in the “Data center GPU – A2 section” of the tutorial. Tiled displays like in Figures 4 and 5 above impact performance, so NVIDIA recommends disabling on-screen display/output when evaluating performance. We did the same.
With the same sample video as shown in Figure 5, NVIDIA reports that using an H.264 source, it is possible to host 48 inferencing streams at 30 FPS each. To test this with our PowerEdge R360 and A2 GPU, we followed the benchmarking procedure below:
- Modify the sample application configuration file to take in 48 input streams by changing the parameter num-sources to 48, and the batch-size parameter under the streammux section to 48.[4] This is in addition to the other recommended configuration changes described in the guide above.
- Let the application run for 10 minutes[5]
- Record the average FPS for each of the 48 streams at the end of the run
- Repeat steps 1-3 with 40, 30, 20, 10, 5, and 1 streams. The only modification to the configuration file should be updating the num-sources and batch-size to match the number of streams currently under test.
Our results are illustrated in the section below. We used iDRAC tools and the nvidia-smi command to capture system telemetry data every 7 seconds during testing trials as well (i.e. CPU utilization, total power utilization, GPU power draw, and GPU utilization). Each reported utilization statistic (such a GPU utilization) is the average of 100 datapoints collected over the app run period.
Results
The figure below displays the average FPS (to the nearest whole number) achieved for varying number of streams. As the number of streams tested increases, the FPS per stream decreases.
Most notably, we achieved NVIDIA’s expected max performance with our PowerEdge R360; We ran 48 streams with an average of 30 FPS each at the end of the 10-minute run period [3]. In general, 30 FPS is an industry-accepted rate for standard video feeds such as live TV.
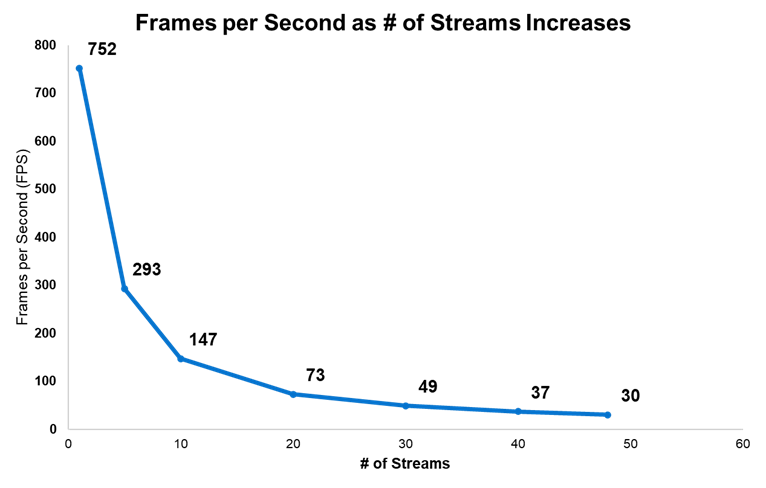
Figure 6. DeepStream FPS for varying number of streams
We also captured CPU utilization during our testing. Unsurprisingly, CPU utilization was highest with 48 streams. However, for all number of streams tested, CPU utilization only ranged between about 2-8%. This means most of the system’s CPU was still available for other work while we tested DeepStream.
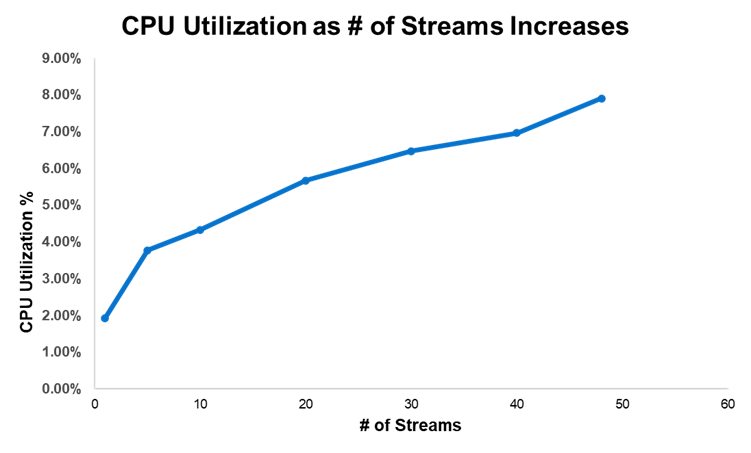
Figure 7. CPU utilization for varying number of streams
In terms of power consumption, the figure below shows GPU power draw overlayed on top of total system power utilization. Irrespective to the number of streams, GPU power draw represents only about 25-27% of the total system power utilization.
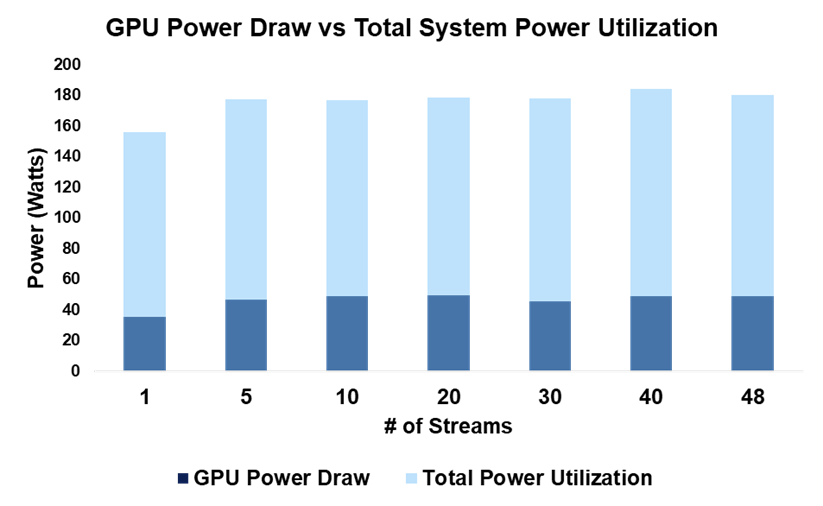
Figure 8. System power consumption for varying number of streams
Finally, we captured GPU utilization as number of streams increased. While it varied more so than the other telemetry data, at the max number of streams tested, GPU utilization was about 50%. We achieved these impressive results without driving the GPU to max utilization.
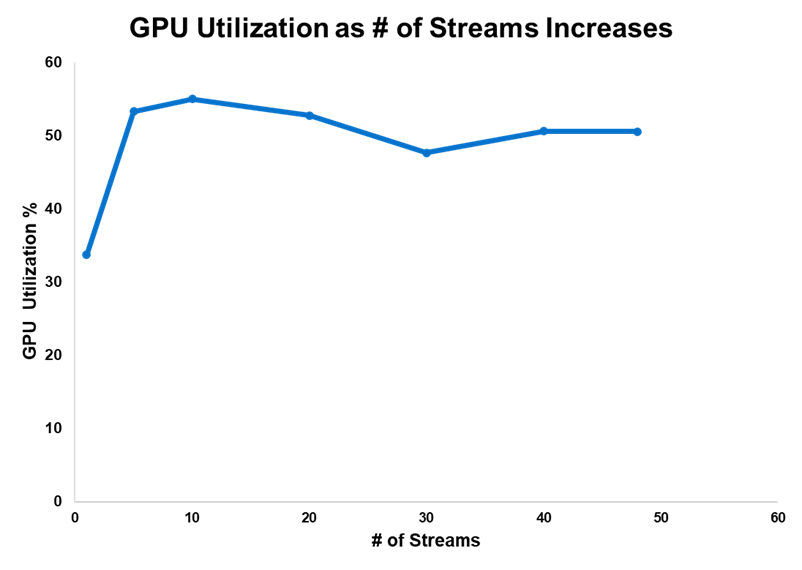
Figure 9. GPU utilization for varying number of streams
Conclusion
We have just scratched the surface on the performance capabilities of the PowerEdge T360 and R360. Between 3D rendering and entry AI-inferencing workloads; the added A2 GPU allows SMBs to explore compute-intensive use cases from the office to the near-edge. In other words, the R360 and T360 are equipped to scale with businesses as computing demand inevitably, and rapidly, evolves.
While GPU support is a defining feature of the PowerEdge T360 and R360, they also leverage the newly launched Intel® Xeon® E-series CPUs, 1.4x faster DDR5 memory, NVMe BOSS, and PCIe Gen5 I/O ports. For more information on these cost-effective, entry-level servers, you can read about their excellent performance across a variety of industry-relevant benchmarks and up to 108% better CPU performance.
References
- Daily: US tech gains set to continue on stronger AI growth | UBS Global
- Blender - Open Data
- DeepStream SDK | NVIDIA Developer | NVIDIA Developer
- A2 Tensor Core GPU | NVIDIA
- Ubuntu 20.04.6 LTS (Focal Fossa)
- Performance — DeepStream 6.3 Release documentation (nvidia.com)
- Understanding FPS Values: The Advanced Guide to Video Frame Rates (dacast.com)
- Battle of the Servers: PowerEdge T360 & R360 outperform prior-gen models across a range of benchmarks | Dell Technologies Info Hub
- Introducing the PowerEdge T360 & R360: Gain up to Double the Performance with Intel® Xeon® E-Series Processors | Dell Technologies Info Hub
Legal Disclosures
[1] Based on November 2023 Dell labs testing subjecting the PowerEdge R360 to Blender OpenData benchmark with 1x NVIDIA A2 GPU and 1x Intel Xeon E-2488 CPU. Actual results will vary. Similar results can be expected on a PowerEdge T360 with the same system configuration.
[2] Based on November 2023 Dell labs testing subjecting the PowerEdge R360 to Blender OpenData benchmark with 1x NVIDIA A2 GPU and 1x Intel Xeon E-2488 CPU. Actual results will vary. Similar results can be expected on a PowerEdge T360 with the same system configuration. Pricing analysis is based on Dell US R360 list prices for both the NVIDIA A2 GPU and Intel Xeon E-2488 processor. Pricing varies by region and is subject to change without notice. Please contact your local sales representative for more information.
[3] Based on November 2023 Dell labs testing subjecting the PowerEdge R360 with 1x A2 GPU to performance testing of NVIDIA’s DeepStream SDK, version 6.3. We tested the sample application with configuration file named:source4_1080p_dec_infer-resnet_tracker_sgie_tiled_display_int8.txt. The full testing procedure is described in this report. Similar results can be expected with a PowerEdge T360 with the same configuration. Actual results will vary.
Appendix
Dell provides an open-source Reference Toolset for iDRAC9 Telemetry Streaming. With streaming data, you can easily create a Grafana dashboard to visualize and monitor your system’s telemetry in real-time. Tutorials are available with this video and whitepaper.
The screenshot below is from a Grafana dashboard we created for capturing PowerEdge R360 telemetry. It displays GPU temperature and rotations per minute (RPM) for three fans (we ran the Blender benchmark to demonstrate a spike in GPU temperature). You can also track GPU power consumption and utilization, among many other system metrics.
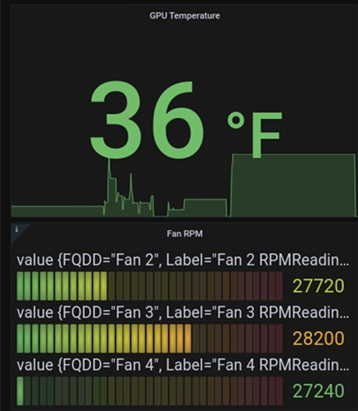
Figure 10. Grafana dashboard example

Powering Kafka with Kubernetes and Dell PowerEdge Servers with Intel® Processors
Mon, 29 Jan 2024 23:33:38 -0000
|Read Time: 0 minutes
Kafka with Kubernetes
At the top of this webpage are 3 PDF files outlining test results and reference configurations for Dell PowerEdge servers using both the 3rd Generation Intel® Xeon® processors and 4th Generation Intel Xeon processors. All testing was conducted in Dell Labs by Intel and Dell Engineers in October and November of 2023.
- “Dell DfD Kafka ICX” – highlights the recommended configurations for Dell PowerEdge servers using 3rd generation Intel® Xeon® processors.
- “Dell DfD Kafka SPR” – highlights the recommended configurations for Dell PowerEdge servers using 4th generation Intel® Xeon® processors.
- “Dell DfD Kafka Kubernetes Test Report” – Highlights the results of performance testing on both configurations with comparisons that demonstrate the performance differences between them.
Solution Overview
The Apache® Software Foundation developed Kafka as an Open Source solution to provide distributed event store and stream processing capabilities. Apache Kafka uses a publish-subscribe model to enable efficient data sharing across multiple applications. Applications can publish messages to a pool of message brokers, which subsequently distribute the data to multiple subscriber applications in real time.
Kafka is often deployed for mission-critical applications and streaming analytics along with other use cases. These types of workloads require leading-edge performance which places significant demand on hardware.
There are five major APIs in Kafka[i]:
- Producer API – Permits an application to publish streams of records.
- Consumer API – Permits an application to subscribe to topics and process streams of records.
- Connect API – performs the reusable producer and consumer APIs that can link the topics to the existing applications.
- Streams API – This API converts the input streams to output and produces the result.
- Admin API – Used to manage Kafka topics, brokers, and other Kafka objects.
Kafka with Dell PowerEdge and Intel processor benefits
The introduction of new server technologies allows customers to deploy solutions using the newly introduced functionality, but it can also provide an opportunity for them to review their current infrastructure and determine if the new technology might increase performance and efficiency. Dell and Intel recently conducted testing of Kafka performance in a Kubernetes environment and measured the performance of two different compression engines on the new Dell PowerEdge R760 with 4th generation Intel® Xeon® Scalable processors and compared the results to the same solution running on the previous generation R750 with 3rd generation Intel® Xeon® Scalable processors to determine if customers could benefit from a transition.
Some of the key changes incorporated into 4th generation Intel® Xeon® Scalable processors include:
- Quick Assist Technology (QAT) to accelerate data compression and encryption.
- Support for 4800 MT/s DDR5 memory
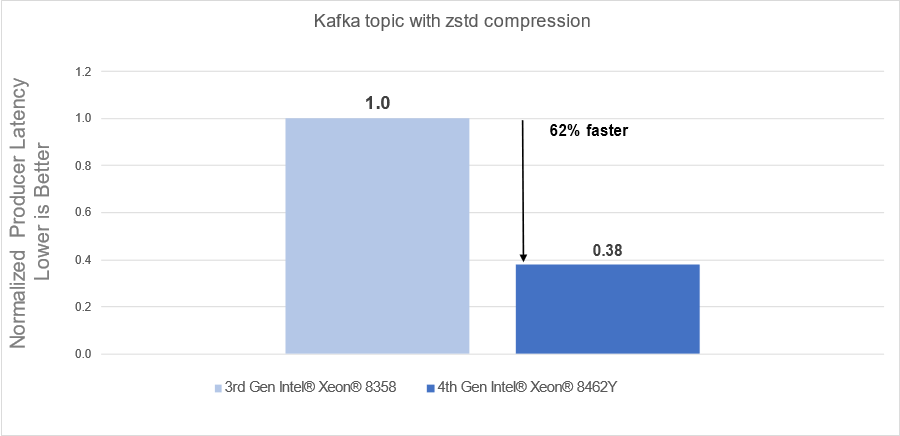
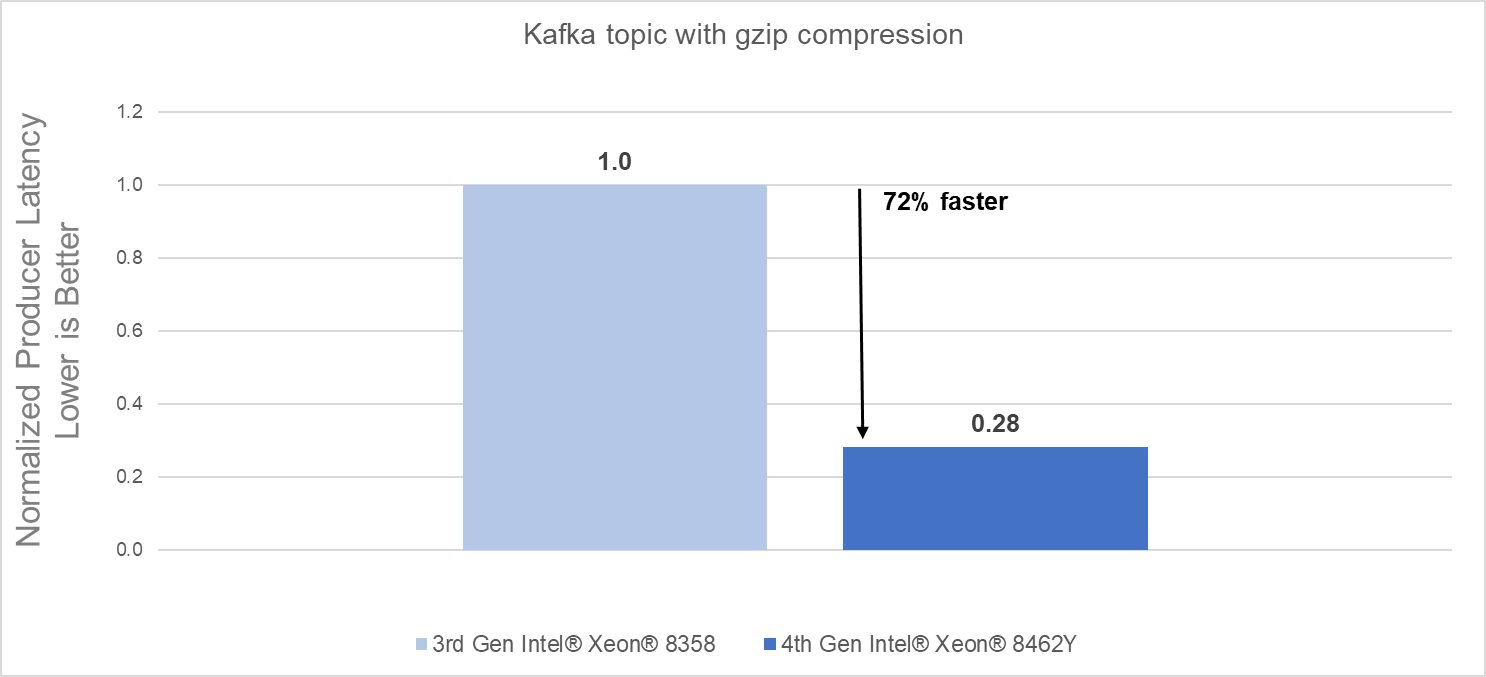
Raw performance: As noted in the report, our tests showed a 72% producers’ latency decrease with gzip compression and a 62% producers’ latency decrease with zstd compression.
Conclusion
Choosing the right combination of Server and Processor can increase performance and reduce time, allowing customers to react faster and process more data. As this testing demonstrated, the Dell PowerEdge R760 with 4th Generation Intel® Xeon® CPUs significantly outperformed the previous generation.
- The Dell PowerEdge R760 with 4th Generation Intel® Xeon® Scalable processors delivered:
- 62% faster processing using zstd compression
- 72% faster procession using gzip compression
- 4th Generation Intel® Xeon® Scalable processors benefits are the results of:
- Innovative CPU microarchitecture providing a performance boost
- Introduction of DDR5 memory support
[i] https://en.wikipedia.org/wiki/Apache_Kafka

Yellowbrick- An efficient Cloud Data Warehouse powered by Dell Technologies
Mon, 29 Jan 2024 23:20:57 -0000
|Read Time: 0 minutes
In the current economic climate, CIOs are rethinking their cloud strategy. They face challenges on several fronts - the need to continue innovating and driving growth while reducing the cost of cloud data programs and bringing tangible value. As cloud economics practices mature, private cloud and hybrid cloud are regaining strategic impetus. Organizations need the flexibility to manage data in private cloud, public cloud, co-lo, and at the edge. Yellowbrick delivers on this “Your Data Anywhere” vision.
Alongside new data management approaches such as data lakes, SQL based Data Warehouse technologies continue to prove their value as the primary business interface, with data lake vendors rushing to emulate their capabilities.
With Dell Technologies’ this solution is designed and optimized to provide an elastic data management platform for SQL analytics at any scale.
Business Challenges and Benefits
Yellowbrick data warehouse meets these challenges with a unique architecture designed to maximize efficiency with hardened security and simplified management. Yellowbrick delivers everything you would expect from a modern high-performance SQL cloud data warehouse.
It comes with cloud SaaS simplicity and elasticity with performance perfected through years of delivering value to customers in weeks and months and bills natively to exploit the power agility of the cloud.
Yellowbrick uniquely combines its MPP database software, and highly engineered systems design, with an agile elastic modern Kubernetes-based architecture that delivers high efficiency and maximizes performance in every deployment scenario.
Yellowbrick is engineered for maximum efficiency and price performance, supporting thousands of concurrent users on 1/5 of the cloud resources compare with competitors, maximizing data value with the simplicity and familiarity of SQL but with a unique pricing model that alleviates concerns over unpredictable cost overruns.
Who is Yellowbrick?
The Yellowbrick Data Warehouse is an elastic massively parallel processing (MPP) SQL database that runs on-premises, in the cloud, and at the network edge, it was designed for the most demanding batch real time and ad hoc and mixed workloads and can run complex queries at up to petabyte scale with guaranteed sub second response times. Yellowbrick is proven, providing business critical services at many large global enterprises with thousands of concurrent users. It is available on AWS, Azure, and Google Cloud as well as on-premises.
| SQL Analytics for The Masses Cost-effectively supporting thousands of concurrent users running hundreds of concurrent ad-hoc queries, Yellowbrick leapfrogs competitors while still providing full elasticity with separate storage and compute. |
| Meet Mission-Critical Service Levels Intelligent workload management dynamically optimizes resources to ensure SLAs are consistently met without the need to scale out and spend more. |
| Ultimate Control of Data Security Yellowbrick’s data warehouse runs in your own cloud VPC or on-premises behind your firewall, allowing you to meet data sovereignty and governance requirements and pay for your own infrastructure. |
| Engineered for Extreme Efficiency and Performance Get answers faster with our Direct Data Path architecture. Yellowbrick runs mixed ad-hoc ETL, OLAP, and real-time streaming workloads delivering the maximum benefit from any underlying infrastructure platform. |
| Easy to Do Business With Optimize your costs with flexible on-demand or fixed subscription – Yellowbrick is invested in your success, not in emptying your wallet. Our NPS of 82 is a testament to our customer partnership model and support excellence. |


Figure 1 The Yellowbrick Advantage
Yellowbrick Overview
Designed to run complex mixed workloads and support ad-hoc SQL while computing correct answers on any schema, Yellowbrick offers massive scalability and supports vast numbers of concurrent users. This means our clients gain deeper, more meaningful insights into their customers more quickly than ever before possible, setting us apart from other cloud data warehouses (CDWs).
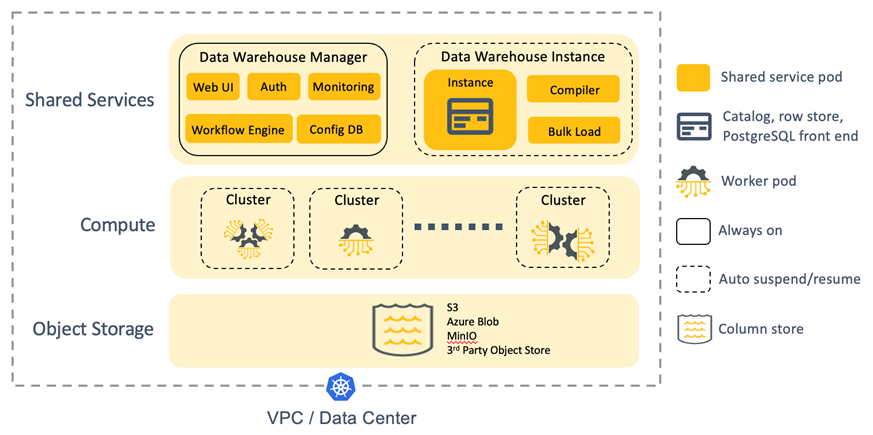
Figure 2 Yellowbrick Architecture
In an industry-first, full SQL-driven elasticity with separate storage and compute is available within your own cloud account as well as on-premises. Compute resources – elastic, virtual compute clusters (VCCs) – are created, resized, and dropped on-demand through SQL, and cache data persisted on shared cloud object storage. For example, ad-hoc users can be routed to one cluster, business-critical users to a second cluster, and more clusters created and dropped on demand for ETL processing.
Each data warehouse instance runs independently of one another. There is no single point of failure or metadata shared across instances. Global outages – when deployed with replication across multiple public clouds and/or on-premises – are impossible.
Yellowbrick is secure by default with no external network access to your database instance. Encryption of data at rest is standard with keys you manage. Columnar encryption, granular role-based access control, column masking, OAuth2, Active Directory, and Kerberos authentication are built in. Integrations with best-in-class enterprise data protection solutions secure PII data. Enterprise-class high availability, backups for data retention, and asynchronous replication for disaster recovery are standard. Management capabilities, Vantage offers significant value for your investment.
Yellowbrick powered by Dell Technologies
Yellowbrick and Dell share solutions that address a variety of data analytic use cases:
- Mission-critical Reporting and BI
- Data Warehouse modernization and consolidation
- Data-intensive B2B Apps and Data Monetization
- Hybrid Cloud Big Data Analytics
- Unified features store for data science and AI
- Multi-PB scale relational data lake
Symphony Retail AI
Symphony RetailAI serves the ever-changing consumer goods industry. That means they need to transfer terabytes of raw data to their 700 TB data warehouse and quickly convert it into easily digestible information for their consumers. Development and test, departmental data marts, self-service analytic workspaces for data scientists and developers, and edge/IoT computing.
TEOCO powered by Dell Technologies
TEOCO (The Employee-Owned Company) is a leading provider of telecom industry analytics and optimization solutions. The company provides intelligence about revenue assurance, network quality, and customer experience to more than 300 providers and customers. In addition to managing mountains of data for their clients, TEOCO also develops algorithms to transform raw data into actionable insights.
With these game-changing responsibilities in mind, TEOCO constantly strives to improve data warehouse innovation.
Some of the use cases <insert use case introduction>
Catalina Marketing powered by Dell Technologies
Catalina Marketing is the industry leader in consumer intelligence as well as in targeted instore and digital media. The company delivers an annual $6.1 billion in consumer value by pairing its exceptional analytics and insights with the richest buyer-history database in the world. To fulfill its mission, Catalina processes terabytes of data, transforming it into meaningful results so companies can optimize media planning to increase consumer engagement.
Catalina’s complex extract, transform, and load (ETL) processes required nightly conversions to produce data sets for querying and reporting. Plus, Catalina’s team of about 100 data scientists used advanced analytics and data-mining tools to perform large, ad hoc queries for a variety of customers.
Luis Velez, data engineering manager at Catalina explained that before Yellowbrick “It was an unsustainable environment in which we were not able to finish our data loads because we had 15 to 20 queries running at any given time.” “Every day, it was getting a little bit worse.” “Sometimes queries took hours, and other times they were simply killed so ETL processes could run,” says Aaron Augustine, executive director of data science at Catalina.
To achieve optimal results, Catalina incorporated Yellowbrick into its system, dividing the computing workload in half between the two platforms. Netezza would handle data processing, while Yellowbrick supported the consumption of processed data. During a three-week Proof of Technology (POT) exercise, Catalina found Yellowbrick’s single 10U, 30-node system performed 182X better than their current system. Catalina switched immediately.
The Enterprise Data Warehouse is powered by the Dell PowerEdge R660 server, together with Dell PowerSwitch networking and ECS storage featuring capacity, performance, and operational simplicity.
Dell Infrastructure Components
The following Dell components provide the foundation for the Yellowbrick private cloud solution.
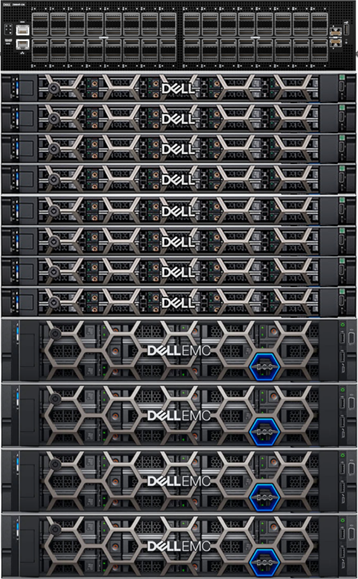
Figure 3 Dell Yellowbrick Solution
Dell PowerEdge R660 Server is the ideal dual-socket 1U rack server based on Intel’s fourth-generation Xeon Scalable “Sapphire Rapids” processors for dense scale-out data center computing applications. Benefiting from the flexibility of 2.5” or 3.5” drives, the performance of NVMe, and embedded intelligence, it ensures optimized application performance in a secure platform.
The server is designed with a cyber-resilient architecture, integrating security deep into every phase in the life cycle. It has intelligent automation with integrated change management capabilities for update planning and seamless and zero-touch configuration. And it has built-in telemetry streaming, thermal management, and RESTful APIs with Redfish that offer streamlined visibility and control for better server management.
Dell ECS Storage is an enterprise-grade, cloud-scale, object storage platform that provides comprehensive protocol support for unstructured object and file workloads on a single modern storage platform. Either the ECS EX500 or EX5000 may be used depending on capacity requirements.
Dell PowerSwitch Networking switches are based on open standards to free the data center from outdated, proprietary approaches: They support future ready networking technology that helps you improve network performance, lower network management costs and complexity, and adopt new innovations in networking.
Why Dell Technologies
The technology required for data management and enterprise analytics is evolving quickly, and companies may not have experts on staff or who have the time to design, deploy, and manage solution stacks at the pace required. Dell Technologies has been a leader in the Big Data and advanced analytics space for more than a decade, with proven products, solutions, and expertise. Dell Technologies has teams of application and infrastructure experts dedicated to staying on the cutting edge, testing new technologies, and tuning solutions for your applications to help you keep pace with this constantly evolving landscape.
Dell Technologies is building a broad ecosystem of partners in the data space to bring the necessary experts, resources, and capabilities to our customers and accelerate their data strategy. We believe customers should be able to innovate using data irrespective of where it resides across on-premises, public cloud and edge. By partnering with Teradata, an industry leader in enterprise data management and analytics, we are creating optimized solutions for our customers.
Dell Technologies uniquely provides an extensive portfolio of technologies to deliver the advanced infrastructure that underpins successful data implementations. With years of experience and an ecosystem of curated technology and service partners, Dell Technologies provides innovative solutions, servers, networking, storage, workstations, and services that reduce complexity and enable you to capitalize on a universe of data.
Conclusion
Whether you want to expand your existing capabilities or get started with your first project, Yellowbrick powered by Dell Technologies offers XYZ. For more information about the solutions, please contact the Dell Technologies Teradata Solutions team by email.
Your company needs all tools and technologies working in concert to achieve success. Fast, effective systems that complement time management practices are crucial to making the most out of every employee hour. High-level data collection and processing that provides rich, detailed analytics can ensure your marketing campaigns strategically target your ideal customers and encourage conversion. To top it off, you need affordable products that meet your criteria and then some. After switching to Yellowbrick, our customers have seen dramatic gains in efficiency:
- Streamlined processes.
- Faster query times.
- Minimized data turnaround time.
- Richer, more accurate data.
- Increased customer growth.
- Affordable pricing with fixed-rate subscriptions for any deployment.
- No hidden fees or quotas.
- Predictable and reliable performance.
- Compatible with other components and applications.
- Highly capable system portability and accessibility.
- Innovative solutions.
- Little to no performance tuning.
- Ability to support a multitude of concurrent users.
Enjoy quick, easy, and supportive migration
At Yellowbrick, we are ready to provide you with simple, swift migration services. We complete most migrations in weeks, not months. Our 15-day proof of concept performance and operational testing period allows you to confirm that Yellowbrick is the right fit for your company. During this time, we will work closely with you to understand the requirements and scope a POC in your data center or in the cloud—whichever you prefer. We will set up a test instance, migrate your data, and integrate all necessary applications.
Since Yellowbrick is based on PostgreSQL, the world’s most advanced open-source database, and natively supports stored procedures, it works out of the box quickly. Our data solutions are also compatible with common industry tools, such as Tableau, MicroStrategy, SAS, and Microsoft Power BI, as well as Python and R programming languages. Coupled with one day of setup and one week of testing, your team can hit the ground running almost immediately.
Additionally, our broad partner network can help plan your transition, understand your data flows, and manage cutover with purpose-built tools and consulting services, so you can migrate from any platform.
Additional Resources
For more information, please see the following resources:

PowerEdge R760 HiBench- K-Means test report
Thu, 14 Dec 2023 18:12:20 -0000
|Read Time: 0 minutes
Summary
Companies should always be looking for ways to better serve their customers. Customers are overwhelmed with information and often make buying decisions based on existing relationships. Companies looking to expand their relationships with customers can benefit from combining Machine Learning technologies with Data Mining to better understand their customers’ needs and to tailor their offerings to those needs.
Earlier this year, Dell and Intel conducted testing to determine how the new PowerEdge Server family utilizing Intel® 4th Generation Xeon® Scalable Processors could improve a company’s Data Mining efforts with Machine Learning technologies.
HiBench is a big data benchmark suite that helps evaluate different big data frameworks in terms of speed, throughput, and system resource utilizations. Part of the HiBench framework focuses on Machine Learning and utilizes Bayesian Classification and K-Means Clustering to effectively measure the relative performance of systems in a Machine Learning environment. The information below highlights the performance differences between a Dell PowerEdge R750 server with 3rd Generation Intel® Xeon® Scalable processors compared to the new Dell PowerEdge R760 with 4th Generation Intel® Xeon® Scalable processors.
All testing was conducted in Dell Labs by Intel and Dell Engineers in January of 2023.
Solution Overview
One of the primary benefits of the new 4th Generation Intel® Xeon® Scalable processors is core count. The previous generation of processors offered a maximum of 40 cores while the new processor family scales up to 56 cores. For the testing outlined in this report, we decided to use the new Intel® Xeon® Platinum 8470 processor which provides 52 cores. For the previous generation processor, we chose the Intel® Xeon® Platinum 8380 which provides 40 cores.
In addition, to increased core count, the 4th Generation processors also support faster memory. The Dell R750 system we tested were configured with 512GB of memory (16x32GB DDR4) running at 3200MT/s. The new Dell R760 system was also configured with 512GB of memory (16x32GB DDR5) which operates at 4800MT/s.
Our testing utilized the HiBench K-Means elements of the test. This Algorithm aims to partition n observations into k clusters as shown in the graphic below:
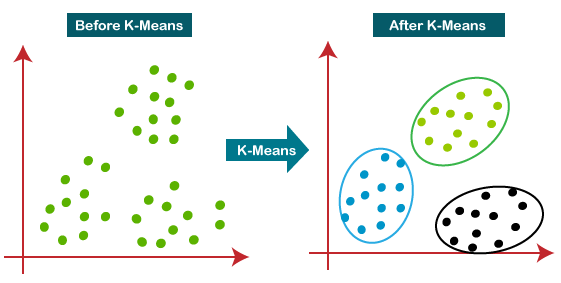
Methodology
Each system was configured with the same number of processors, memory, and the configuration of hard drives. Each test bed was then subjected to two “warm up” cycles prior to running three iterations of the benchmark. The results for each test were averaged to measure processing time.
Hardware Configurations tested
PowerEdge R750 | PowerEdge R760 | |
CPU | 2x Intel® Xeon® Platinum 8380 CPU's 40 - Core Processors | 2x Intel® Xeon® Platinum 8470 CPU's 52 - Core Processors |
Base Frequency | 2.3GHz | 2.0GHz |
Turbo Frequency | 3.4GHz | 3.8GHz |
All Core Turbo Frequency | 3.0GHz | 3.0GHz |
Network card | Intel® E810-C Dual Port 100Gb/s | Intel® E810-C Dual Port 100Gb/s |
Boot Drives | 1 x 1.6TB Dell Ent NVMe | 1 x 1.6TB Dell Ent NVMe |
Primary Storage | 6 x 3.2TB NVMe Solidgm* D7-P5620 | 6 x 3.2TB NVMe Solidgm* D7-P5620 |
*D7-P5620 drives supplied by Solidigm (formerly Intel) | ||
Software Configuration
| All Nodes |
OS | Red Hat® Enterprise Linux 8.6 |
Toolkit | Hibench-7.1.1, 3.1.1 |
JNI | Netlib-java 1.1 |
BLAS Libraries | OpenBLAS 0.3.15 |
Hadoop Distribution | Cloudera 7.1.7 |
Compute Engine | Spark 3.1.1 |
Test Results
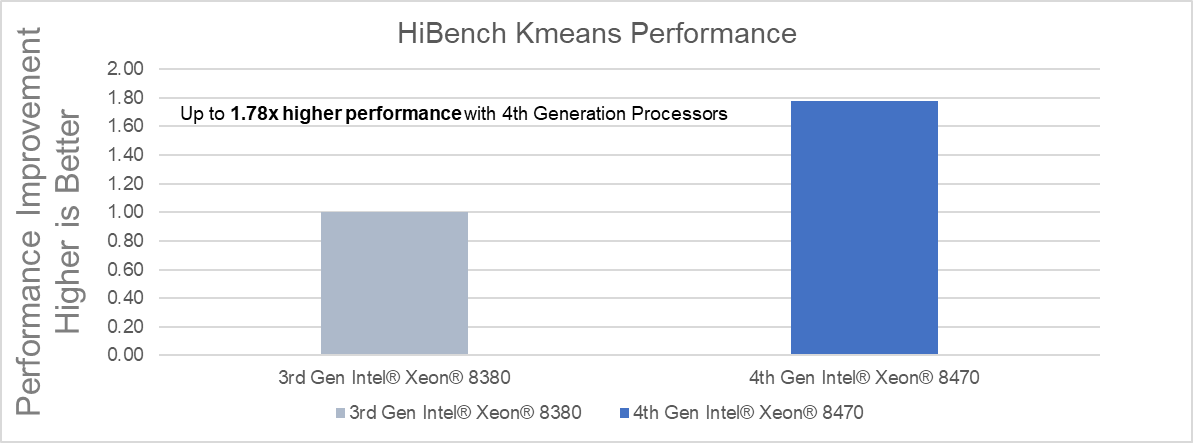
Key takeaways:
- 78% performance gain with the 4th Generation Intel® Xeon® 8470 compared to 3rd Generation Intel® Xeon® 8380 for Spark K-Means algorithm using OpenBlas library
- 4th Generation Intel® Xeon®Scalable processors benefits are results of:
- Innovative CPU microarchitecture providing up to a 37% performance boost
- Increased Parallelism (30% more cores)
Conclusion
Implementing Machine Learning technologies with Big Data can help Companies better serve their customers. As shown in the testing above, the new Dell PowerEdge R760 with 4th Generation Intel® Xeon® Scalable processors can significantly reduce processing times leading to faster decision making.

Deploy Machine Learning Models Quickly with cnvrg.io and VMware Tanzu
Wed, 13 Dec 2023 21:09:16 -0000
|Read Time: 0 minutes
Summary
Data scientists and developers use cnvrg.io to quickly deploy machine learning (ML) models to production. For infrastructure teams interested in enabling cnrvg.io on VMware Tanzu, this article contains a recommended hardware bill of materials (BoM). Data scientists will appreciate the performance boost that they can experience using Dell PowerEdge servers with Intel Xeon Scalable Processors as they wrangle big data to uncover hidden patterns, correlations, and market trends. Containers are a quick and effective way to deploy MLOps solutions built with cnvrg.io, and IT teams are turning to VMware Tanzu to create them. Tanzu enables IT admins to curate security-enabled container images that are grab-and-go for data scientists and developers, to speed development and delivery.
Market positioning
Too many AI projects take too long to deliver value. What gets in the way? Drudgery from low-level tasks that should be automated: managing compute, storage, and software, managing Kubernetes pods, sequencing jobs, monitoring experiments, models, and resources. AI development requires data scientists to perform many experiments that require adjusting a variety of optimizations, and then preparing models for deployment. There is no time to waste on tasks already automated by MLOps platforms.
Cnvrg.io provides a platform for MLOps that streamlines the model lifecycle through data ingestion, training, testing, deployment, monitoring, and continuous updating. The cnvrg.io Kubernetes operator deploys with VMware Tanzu to seamlessly manage pods and schedule containers. With cnvrg.io, AI developers can create entire AI pipelines with a few commands, or with a drag-and-drop visual canvas. The result? AI developers can deploy continuously updated models faster, for a better return on AI investments.
Key considerations
- Intel Xeon Scalable Processors – The 4th Generation Intel Xeon Scalable processor family features the most built-in accelerators of any CPU on the market for AI, databases, analytics, networking, storage, crypto, and data compression workloads.
- Memory throughput – Dell PowerEdge servers with Intel 4th Gen Xeon Scalable Processors provide an enhanced memory performance by supporting eight channels of DDR5 memory modules per socket, with speeds of up to 4800MT/s with 1 DIMM per channel (1DPC) or up to 4400MT/s with 2 DIMMs per channel (2DPC). Dell PowerEdge servers using DDR5 support higher-capacity memory modules, consume less power, and offer up to 1.5x bandwidth compared to previous generation platforms that use DDR4.
- Higher performance for intensive ML applications – Dell PowerEdge R760 servers support up to 24 x 2.5” NVM Express (NVMe) drives with an NVMe backplane. NVMe drives enable VMware vSAN, which runs under VMware Tanzu, to meet the high-performance requirements of ML workloads, in terms of both throughput and latency metrics.
- Storage architecture – vSAN’s Original Storage Architecture (OSA) is a legacy 2-tier model using high throughput storage drives for a caching tier, and a capacity tier composed of high-capacity drives. In contrast, the Express Storage Architecture (ESA) is an alternative design introduced in vSAN 8.0 that features a single-tier model designed to take full advantage of modern NVMe drives.
- Scale object-storage capacity – Deploy additional storage nodes to scale object-store capacity independently of worker nodes. Both high performance (with NVMe solid-state drives [SSDs]) and high-capacity (with rotational hard-disk drives [HDDs]) configurations can be used. All nodes using NVMe drives should be configured with 100 Gb network interface controllers (NICs) to take full advantage of the drives’ data transfer rates.
Recommended configurations
Worker Nodes (minimum four nodes required, up to 64 nodes per cluster)
Table 1. PowerEdge R760-based, up to 16 NVMe drives, 2RU
Feature | Description | |
Platform | Dell R760 supporting 16x 2.5” drives with NVMe backplane - direct connection | |
CPU | Base configuration: 2x Xeon Gold 6448Y (32c @ 2.1GHz), or Plus configuration: 2x Xeon Gold 8468 (48c @ 2.1GHz) | |
vSAN Storage Architecture | OSA | ESA |
DRAM | 256GB (16x 16GB DDR5-4800) | 512GB (16x 32GB DDR5-4800) |
Boot device | Dell BOSS-N1 with 2x 480GB M.2 NVMe SSD (RAID1) | |
vSAN Cache Tier [1] | 2x 1.92TB Solidigm D7-P5520 SSD (PCIe Gen4, Read-Intensive) | N/A |
vSAN Capacity Tier1 | 6x 1.92TB Solidigm D7-P5620 SSD (PCIe Gen4, Mixed Use) | |
Object storage1 | 4x (up to 10x) 1.92TB, 3.84TB or 7.68TB Solidigm D7-P5520 SSD (PCIe Gen4, Read-Intensive) | |
NIC[2] | Intel E810-XXV for OCP3 (dual-port 25Gb), or Intel E810-CQDA2 PCIe add-on card (dual-port 100Gb) | |
Additional NIC[3] | Intel E810-XXV for OCP3 (dual-port 25Gb), or Intel E810-CQDA2 PCIe add-on card (dual-port 100Gb) | |
Optional – Dedicated storage nodes
Table 2. PowerEdge R660-based, up to 10 NVMe drives or 12 SAS drives, 1RU
Feature | Description | |
Node type | High performance | High capacity |
Platform | Dell R660 supporting 10x 2.5” drives with NVMe backplane | Dell R760 supporting 12x 3.5” drives with SAS/SATA backplane |
CPU | 2x Xeon Gold 6442Y (24c @ 2.6GHz) | 2x Xeon Gold 6426Y (16c @ 2.5GHz) |
DRAM | 128GB (16x 8GB DDR5-4800) | |
Storage controller | None | HBA355e adapter |
Boot device | Dell BOSS-N1 with 2x 480GB M.2 NVMe SSD (RAID1) | |
Object storage1 | up to 10x 1.92TB / 3.84TB / 7.68TB Solidigm D7-P5520 SSD (PCIe Gen4, Read-Intensive) | up to 12x 8TB/16TB/22TB 3.5in 12Gbps SAS HDD 7.2k RPM |
NIC2 | Intel E810-CQDA2 PCIe add-on card (dual-port 100Gb) | Intel E810-XXV for OCP3 (dual-port 25Gb) |
Learn more
Deploy ML models quickly with cnvrg.io and VMware Tanzu. Contact your Dell or Intel account team for a customized quote, at 1-877-289-3355.
[1] Number of drives and capacity for MinIO object storage depends on the dataset size and performance requirements.
[2] 100Gbps NICs recommended for higher throughput.
[3] Optional – required only if dedicated storage network for external storage system is necessary.

Battle of the Servers: PowerEdge T360 & R360 outperform prior-gen models across a range of benchmarks
Fri, 15 Dec 2023 17:21:18 -0000
|Read Time: 0 minutes
Summary
With the launch of the PowerEdge T360 and R360, we decided to put these systems to the test against their predecessors, the T350 and R360. Our benchmarking revealed:
Workload | Use Case | T360 and R360 Performance Increase vs Prior Gen |
Database | Data Storage | Up to 50% |
Data Query | Web Host | Up to 160% |
Data Analytics | Big Data Processing | Up to 47% |
The rest of this document gives more details about the T360 & R360 and describes the testing behind these impressive results.
PowerEdge T360 and R360 Specs
Dell Technologies just announced the next servers to join the PowerEdge family: the T360 and R360. They are cost-effective 1-socket servers designed for small to medium businesses with growing compute demands. They can be deployed in the office, the near-edge, or in a typical data analytic environment.
The biggest differentiator between the T360 and R360 is form factor. The T360 is a tower server that can fit under a desk or even in a storage closet, while maintaining office-friendly acoustics. The R360, on the other hand, is a traditional 1U rack server. Both servers support the newly launched Intel® Xeon® E-series CPUs, 1 NVIDIA A2 GPU, as well as DDR5 memory, NVMe BOSS, and PCIe Gen5 I/O ports. Read this paper for more details about new features and CPU performance gains compared to prior-gen servers.
Testing Methodology, Configurations & Results
In our Dell Technologies labs, we evaluated four different industry-relevant benchmarks on the PowerEdge T350 and T360 servers using open-source Phoronix Test Suites.[1] The table below details the configurations for each system under test. While the drive configuration is the same, the PowerEdge T360 was configured with the latest DDR5 memory and the corresponding next-generation Intel CPU with equal number of cores.
Although we tested the PowerEdge T360, similar results can be expected for the PowerEdge R360 with the same configuration below. To replicate our results, see the Appendix of this report for the terminal commands to run each of the Phoronix Test Suites described in the following sections. We tested in a Linux Ubuntu Desktop environment, version 22.04.3
- Testing Configuration
Component | PowerEdge T350 | PowerEdge T360 |
CPU | Intel Xeon E-2388G, 8 cores | Intel Xeon E-2488, 8 cores |
Memory | 4x 32GB DDR4 | 4x 32GB DDR5 |
Drives | 4x 1 TB SATA HDD, PERC H345 | 4x 1 TB SATA HDD, PERC H355 |
Database Benchmarks
Businesses of any size place great importance on efficiently and securely storing large amounts data. It should come as no surprise that a key workload for both the R360 and T360 is database hosting.
We first evaluated database performance on the T360 and T350 using PostgreSQL, an open-source SQL relational database that is popular with small to medium businesses. The benchmark reports database read/write performance in number of transactions per second. Figures 1 and 2 below show two different test configurations, one with a scaling factor 1,000 and the other with scaling factor 10,000. Scaling factor is a multiplier for the number of rows in each table.
In both configurations, as the number of clients (or number of users) increases, so does transactions per second. While both the T360 and T350 follow this trend, the T360 handles up to 50% more transactions per second than the T350 [1].
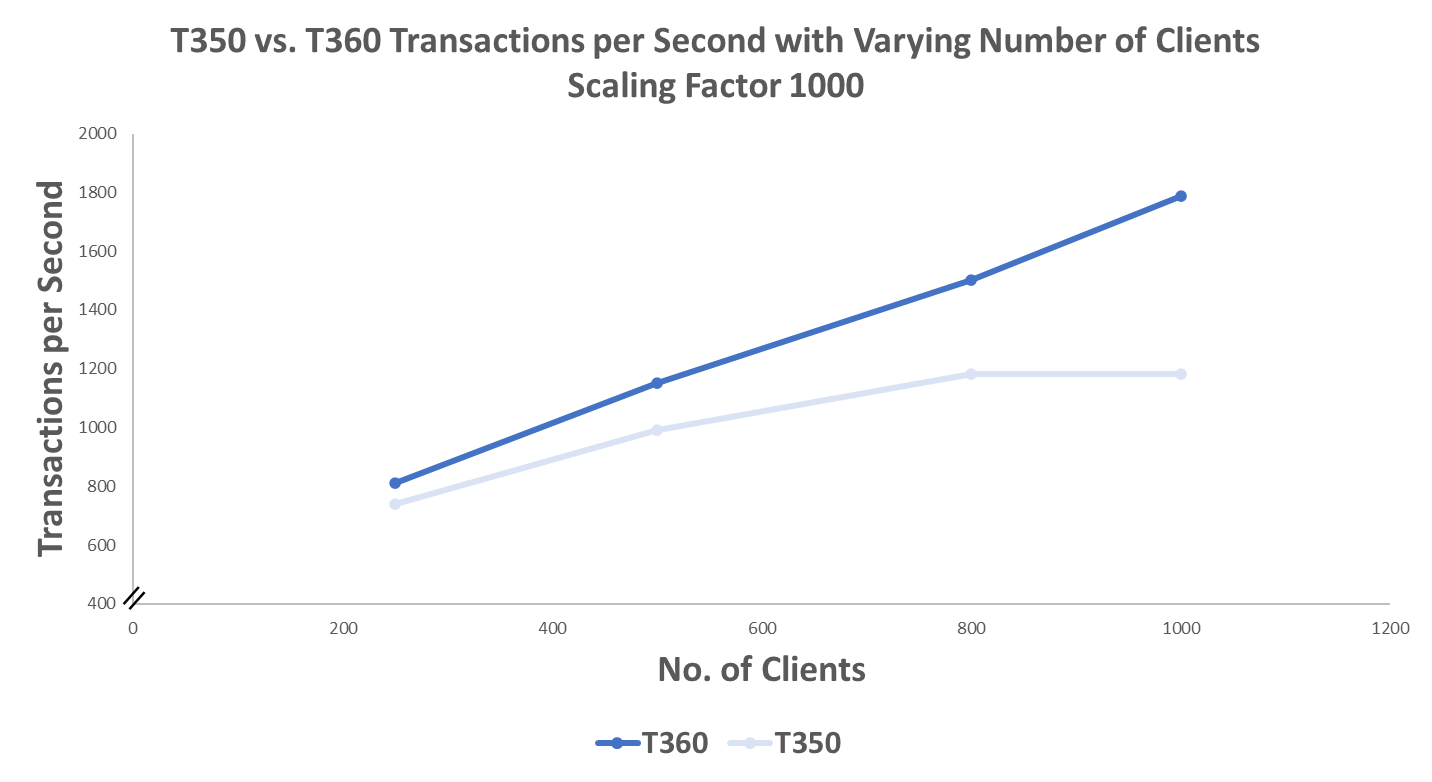
- PostgreSQL performance, Scaling Factor 1000
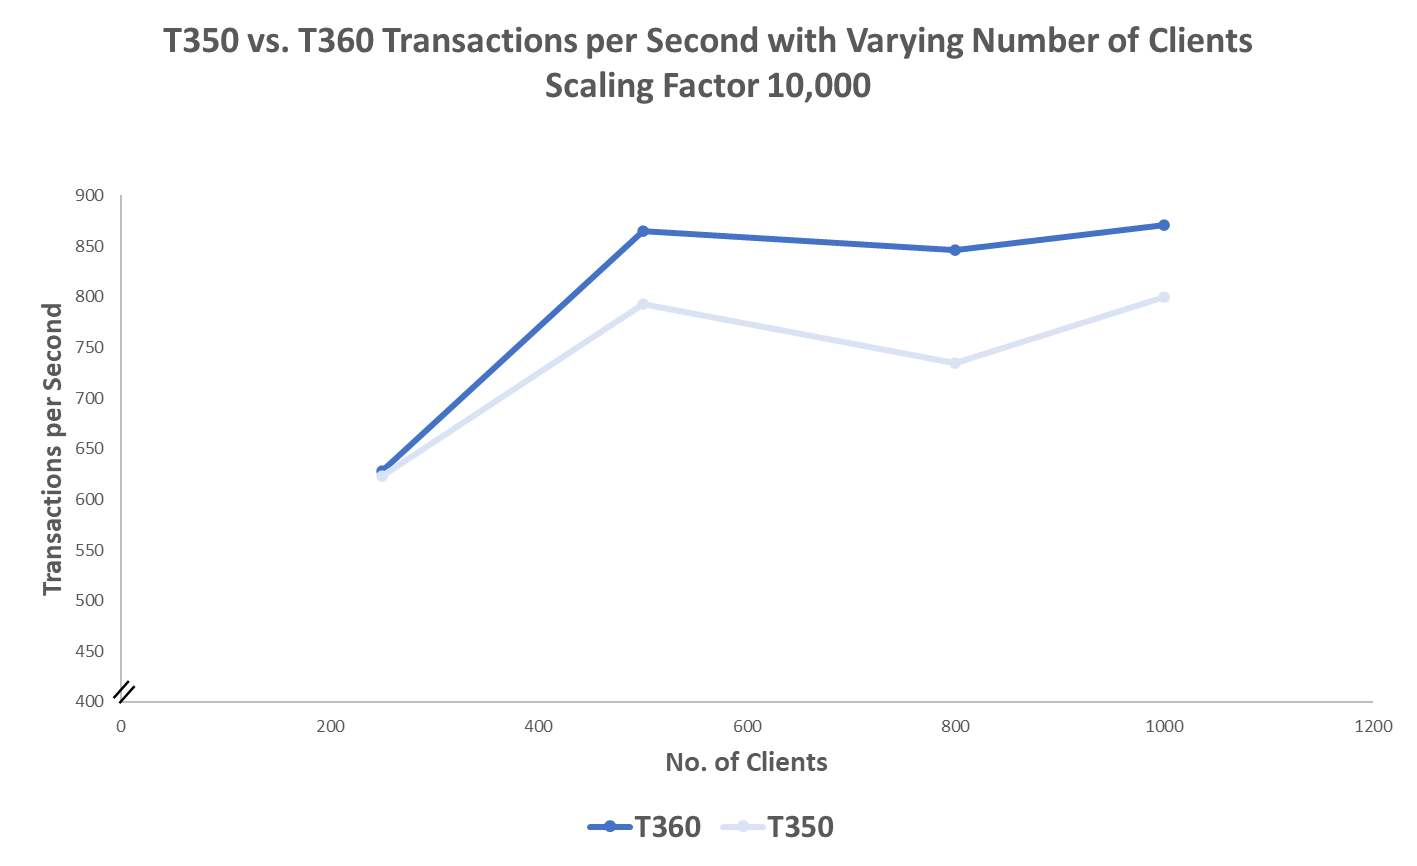
2. PostgreSQL performance, Scaling Factor 10,000
We see comparable results when testing performance with MariaDB, another open-source relational database. In this case, as the number of clients increases, the T360 handles a greater number of queries per second compared to the T350. At its peak, the T360 demonstrates an 11% performance increase over the T350 [2].
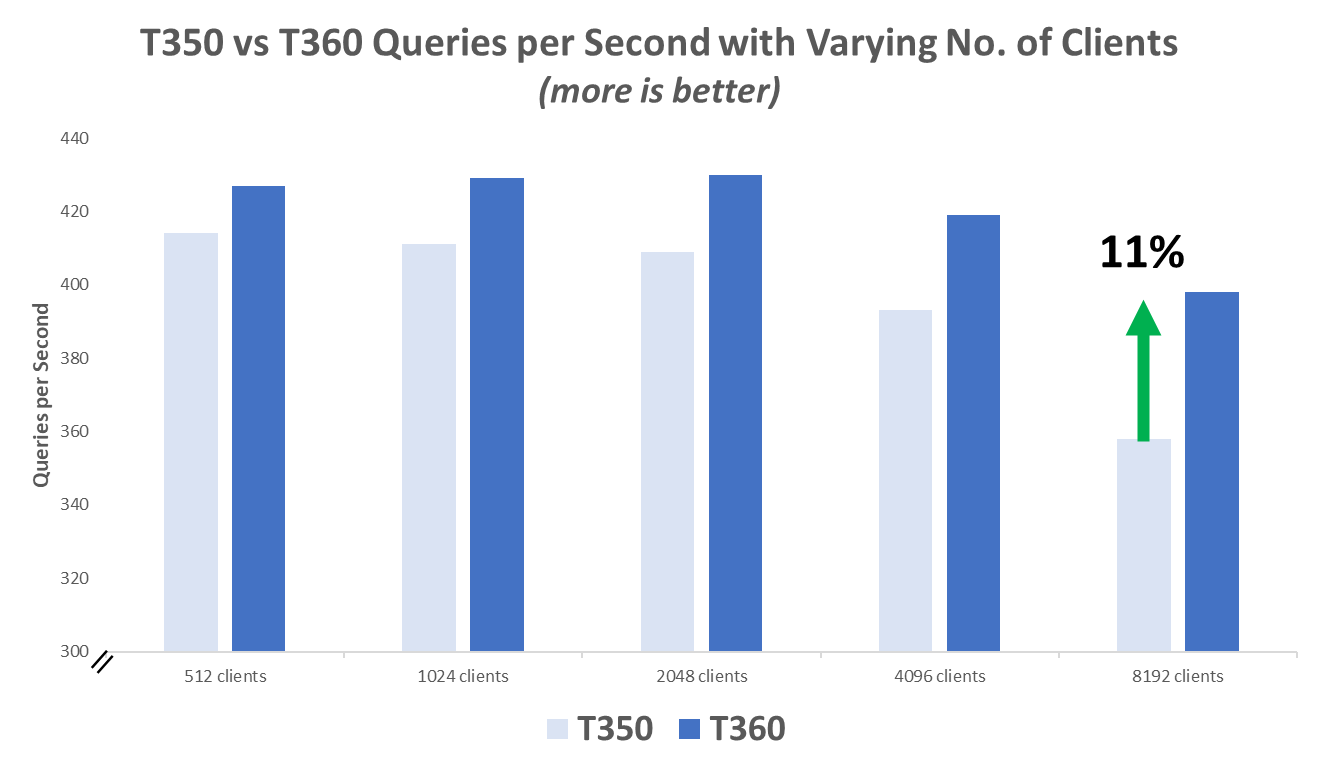
3. Queries per Second, T350 vs T360
The performance gains are impressive when you consider both servers were configured very similarly with the same drives and varied only in CPU and memory generations. These results also point to the T360 as better equipped to scale with heavier database workloads as number of clients increases and more compute is required.
Web Server Benchmark
Web hosting is a common, and critical, workload for entry-level servers. Organizations count on their websites to run efficiently, securely, and handle increasingly heavy traffic loads.
We evaluated web server performance on the T360 and T350 with Apache HTTP Server, which is a completely free, open-source, and widely used web server software. The benchmark reports the number of requests handled per second with a set number of concurrent clients, or visitors. The figure below illustrates that as the number of concurrent clients increases, the T360 is able to handle up to 160% more requests per second than the T350.
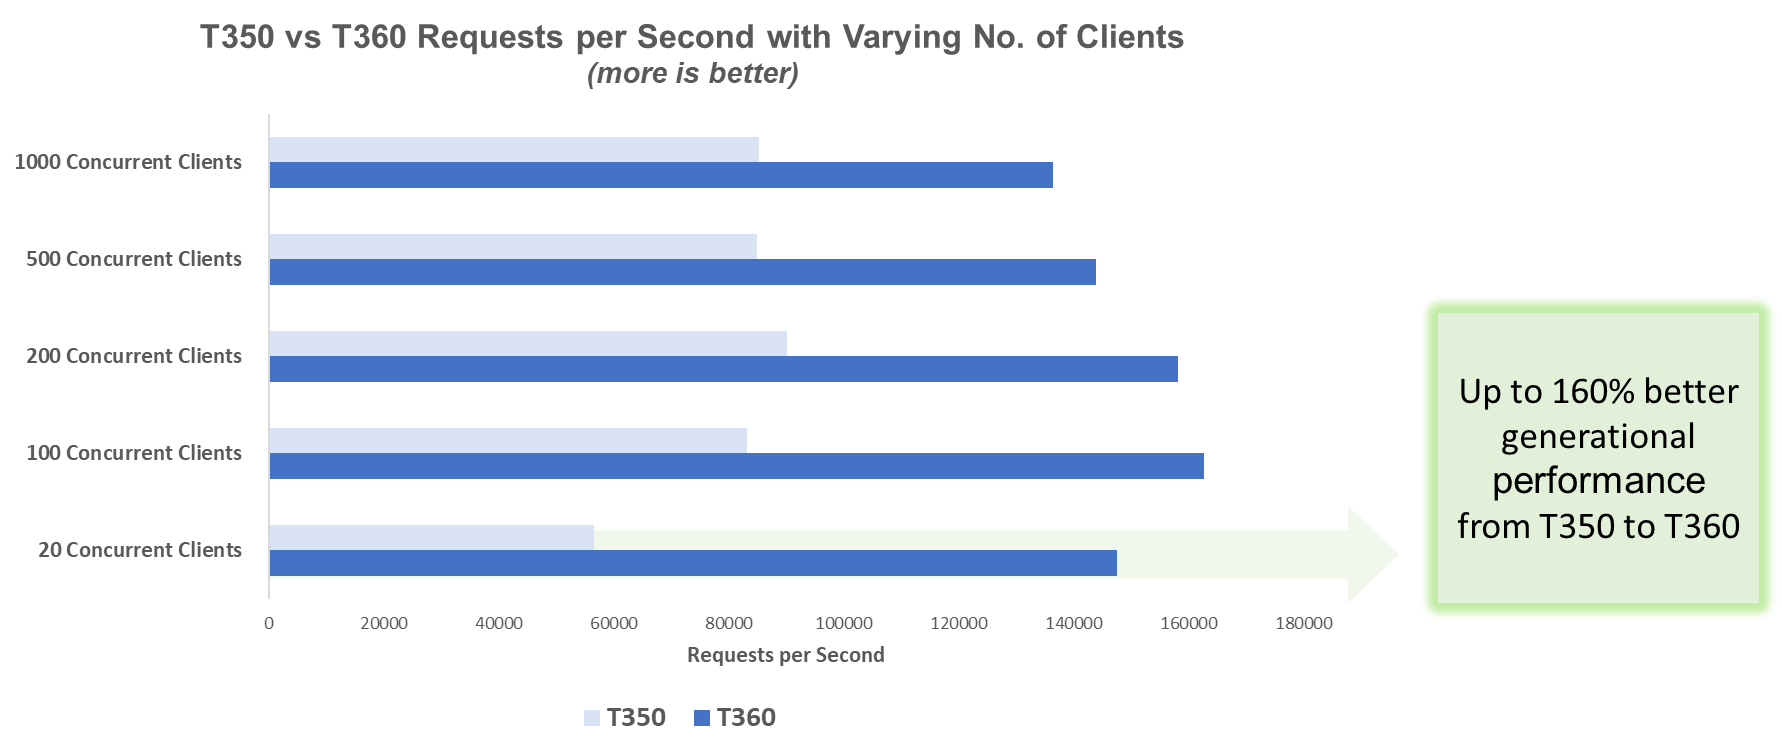
4. Requests per Second, T350 vs T360
Data Analytics Benchmark
With the growing amount of data available to all businesses, there is ample opportunity to leverage data-driven insights. Although large-scale data processing requires immense compute power, the PowerEdge R360 and T360 are more than up for the challenge.
We evaluated data analytics performance on the T360 and T350 using Apache Spark, which is an open-source analytics engine built for managing big data. The benchmark reports the time it takes to complete different Spark operations in seconds. As illustrated in the figure below, the T360 is up to 47% faster than the T350 for this workload [4].
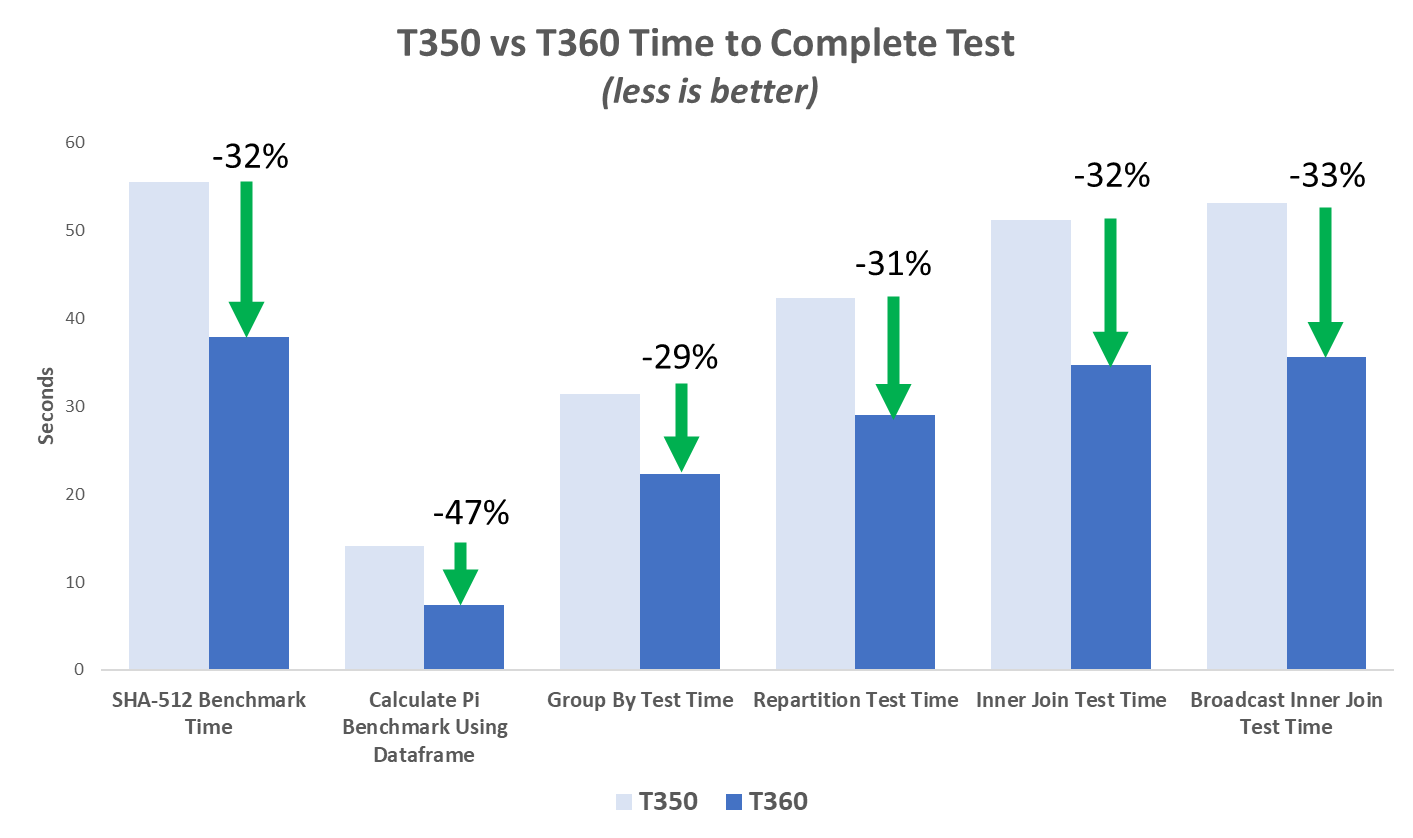
5. Time to Complete Test, T350 vs T360
Conclusion
Whether it is database workloads, web hosting, or data analytics, both the PowerEdge T360 & R360 exhibit impressive performance gains over the prior generation servers. There is a clear winner in this battle. Explore and read more about the benefits of upgrading to a PowerEdge server at PowerEdge Servers | Dell USA
References
Legal Disclosures
[1] Based on November 2023 Dell labs testing subjecting the PowerEdge T350 and T360 tower servers to a PostgreSQL benchmark with scaling factor 1000, 1000 clients, and both read and write operations. Results were obtained via a Phoronix test suite. Similar results can be expected comparing the PowerEdge R360 and R350 with the same system configurations.
[2] Based on November 2023 Dell labs testing subjecting the PowerEdge T350 and T360 tower servers to a MariaDB benchmark with 8192 clients via a Phoronix test suite. Similar results can be expected comparing the PowerEdge R360 and R350 with the same system configurations.
[3] Based on November 2023 Dell labs testing subjecting the PowerEdge T350 and T360 tower servers to an Apache HTTP Server benchmark with 20 concurrent users, via Phoronix Test Suite. Actual results will vary. Similar results can be expected comparing the PowerEdge R360 and R350 with the same system configurations.
[4] Based on November 2023 Dell labs testing subjecting the PowerEdge T350 and T360 tower servers to an Apache Spark benchmark via a Phoronix test suite. Benchmark results were obtained during a run with 40000000 rows and 1000 Partitions to calculate the Pi benchmark using Dataframe. Actual results will vary. Similar results can be expected comparing the PowerEdge R360 and R350 with the same system configurations.
Appendix
2. Phoronix Test Suite Commands
Workload |
|
Database, PostgreSQL | phoronix-test-suite run pgbench |
Database, MariaDB | phoronix-test-suite run mysqlslap |
Analytics, Apache Spark | phoronix-test-suite run spark |
Web Server, Apache HTTP | phoronix-test-suite run apache |
Note: If you do not have the required dependencies for each test, they will automatically be installed after running the command above. You will be prompted to enter “Y” for yes to kick-off the installation before testing resumes. To download Phoronix Test Suite visit Phoronix Test Suite - Linux Testing & Benchmarking Platform, Automated Testing, Open-Source Benchmarking (phoronix-test-suite.com)

Introducing the PowerEdge T360 & R360: Gain up to Double the Performance with Intel® Xeon® E-Series Processors
Thu, 04 Jan 2024 22:08:42 -0000
|Read Time: 0 minutes
Summary
The launch of the PowerEdge T360 and R360 is a prominent addition to the Dell Technologies PowerEdge portfolio. These cost-effective 1-socket servers deliver powerful performance with the latest Intel® Xeon® E-series processors, added GPU support, DDR5 memory, and PCIe Gen 5 I/O slots. They are designed to meet evolving compute demands in Small and Medium Businesses (SMB), Remote Office/Branch Office (ROBO) and Near-Edge deployments.
Both the T360 and R360 boost compute performance up to 108% compared to the prior generation servers. Consequently, customers gain up to 1.8x the performance per every dollar spent on the new E-series CPUs [1]. The rest of this document covers key product features and differentiators, as well as the details behind the performance testing conducted in our labs.
Feature Additions and Upgrades
We break down the new features that are common across both the rack and tower form factors as shown in the table below. Perhaps the most salient upgrades over the prior generation servers – the PowerEdge T350 and R350 – are the significantly more performant CPUs, added entry GPU support, and up to nearly 1.4x faster memory.
- T360 and R360 key feature additions
| Prior-Gen PowerEdge T350, R350 | New PowerEdge T360, R360 |
CPU | 1x Intel Xeon E-2300 Processor, up to 8 cores | 1x Intel Xeon E-2400 Processor, up to 8 cores |
Memory | 4x UDDR4, up to 3200 MT/s DIMM speed | 4x UDDR5, up to 4400 MT/s DIMM speed |
Storage | Hot Plug SATA BOSS S-2 | Hot Plug NVMe BOSS N-1 |
GPU | Not supported | 1 x NVIDIA A2 entry GPU |

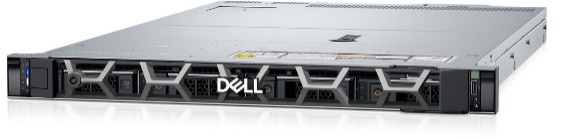
- From left to right, PowerEdge R360 and T360
Entry GPU Support
We have seen a growing demand for video and audio computing particularly in retail, manufacturing, and logistics industries.To meet this demand, the PowerEdge T360 and R360 now supports 1 NVIDIA A2 entry datacenter GPU that accelerates these media intensive workloads, as well as emerging AI inferencing workloads. The A2 is a single-width GPU stacked with 16GB of GPU memory and 40-60W configurable thermal design power (TDP). Read more about the A2 GPU’s up to 20x inference speedup and features here: A2 Tensor Core GPU | NVIDIA.
This upgrade could not come at a more apropos time for businesses looking to scale up and explore entry AI use cases. In fact, IDC projects $154 billion in global AI spending this year, with retail and banking topping the industries with the greatest AI investment. For example, a retailer could leverage the power of the A2 GPU and latest CPUs to stream video of store aisles for inventory management and customer behavior analytics.
Product Differentiation – Rack vs Tower Form Factor
The biggest differentiator between T360 and R360 is their form factors. The T360 is a tower server that can fit under a desk or even in a storage closet, while maintaining office-friendly acoustics. The R360 is a traditional 1U rack server. The table below further details the differences in the product specifications. Namely, the PowerEdge T360 has greater drive capacity for customers with data-intensive workloads or those who anticipate growing storage demand.
2. T360 and R360 differentiators
| PowerEdge R360 | PowerEdge T360 |
Storage | Up to 4 x 3.5'' or 8 x 2.5'' SATA/SAS, max 64GB | Up to 8 x 3.5'' or 8 x 2.5'' SATA/SAS, max 128G |
PCIe Slots | 2 x PCIe Gen 5 (QNS) or 2 x PCIe Gen4 | 3x PCIe Gen 4 + 1x PCIe Gen 5 |
Dimensions & Form Factor | H x W x D: 1U x 17.08 in x 22.18 in 1U Rack Server | H x W x D: 14.54 in x 6.88 in x 22.06 in 4.5U Tower Server |
Processor Performance Testing
The Dell Solutions Performance Analysis Lab (SPA) ran the SPEC CPU® 2017 benchmark on both the PowerEdge T360 and R360 servers with the latest Intel Xeon E-2400 series processors. SPEC CPU is an industry-standard benchmark that measures compute performance for both floating point (FP) and integer operations. We compare these new results with the prior-generation PowerEdge T350 and R350 servers that have Intel Xeon E-2300 series processors.
The following gen-over-gen comparisons represent common Intel CPU configurations for R350/T350 and R360/T360 customers, respectively:
3. Selected CPUs for T/R350 vs T/R360 comparison
Comparison # | PowerEdge R350/T350 | PowerEdge R360/T360 |
1 | E-2388G, 8 cores, 3.2 GHz base frequency | E-2488, 8 cores, 3.2 GHz base frequency |
2 | E-2374G, 4 cores, 3.7 GHz base frequency | E-2456, 6 cores, 3.3 GHz base frequency |
3 | E-2334, 4 cores, 3.4 GHz base frequency | E-2434, 4 cores, 3.4 GHz base frequency |
4 | E-2324G, 4 cores, 3.1 GHz base frequency | E-2414, 4 cores, 2.6 GHz base frequency
|
5 | E-2314, 4 cores, 2.8 GHz base frequency |
Results
We report SPEC CPU’s FP rate metric and integer rate metric which measures throughput in terms of work per unit of time (so higher results are better).[1] Across all CPU comparisons and for both FP and Int rates, there was a 20% or greater uplift in performance gen-over-gen. Overall, customers can expect up to 108% better CPU performance when upgrading from the PowerEdge T/R350 to the T/R360.[2] Below Figure 1 displays the results for the FP base metric, and Table 4 details results for integer rates and FP peak metric.
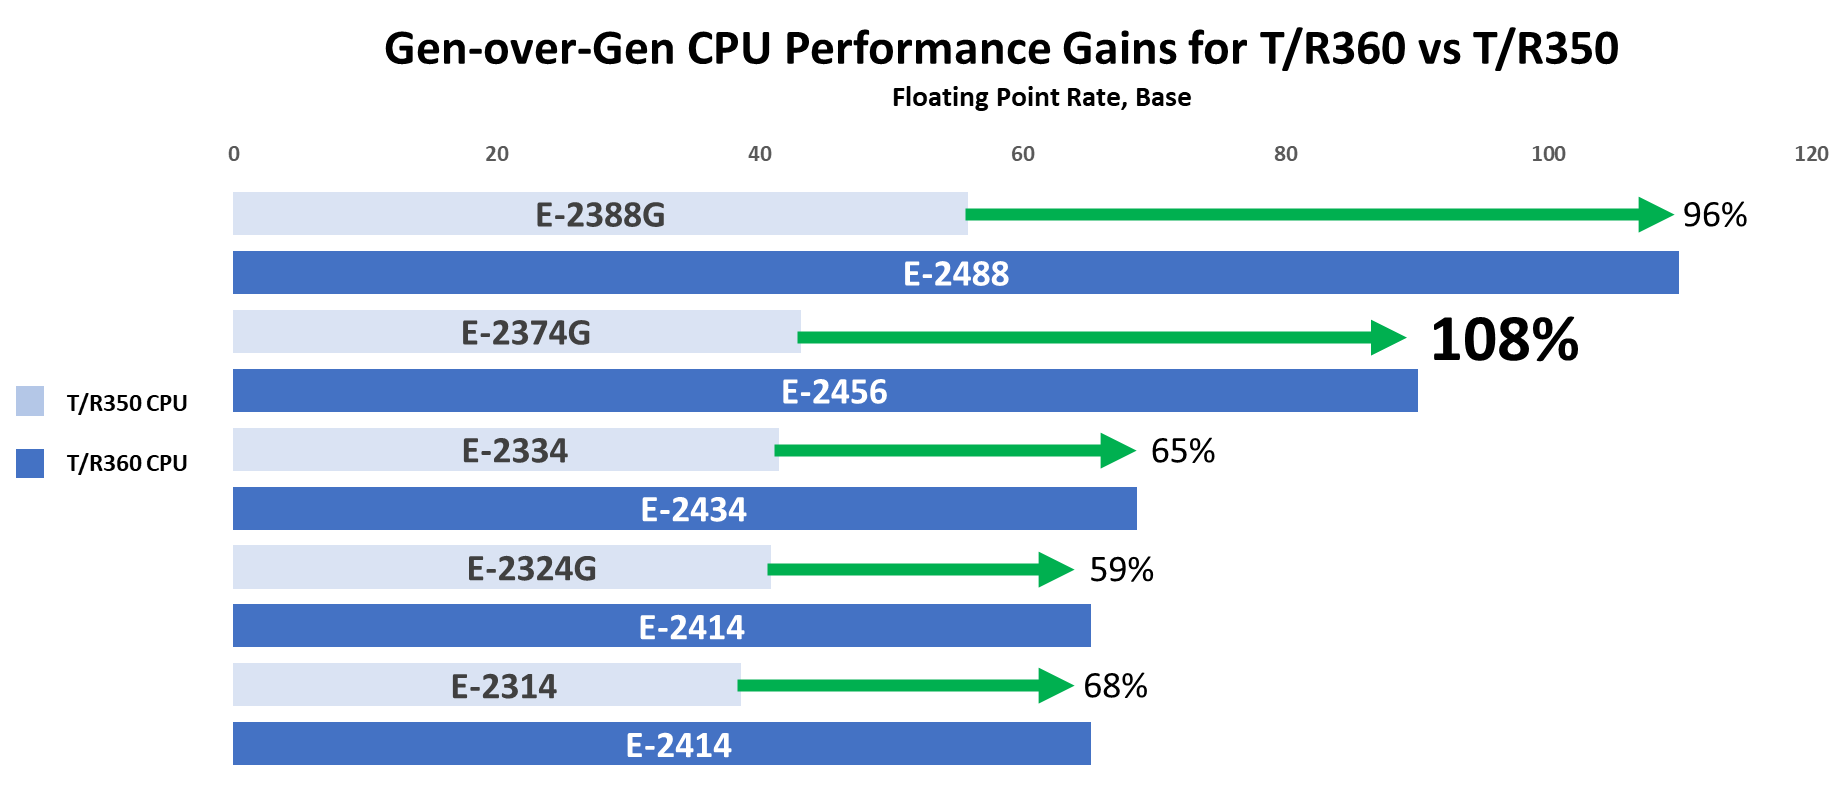
Figure 1. SPEC CPU results gen-over-gen
4. Results for each CPU comparison
Comparison # | Processor | Int Rate (Base) | Int Rate (Peak) | FP Rate (Base) | FP Rate (Peak) |
1 | E-2388G | 68.1 | 71.2 | 55.9 | 60.3 |
E-2488 | 95.1 | 99.2 | 110 | 110 | |
% Increase | 39.65% | 39.33% | 96.78% | 82.42% | |
2 | E-2374G | 42.3 | 43.8 | 43.2 | 45.3 |
E-2456 | 68.3 | 71.1 | 90.1 | 90.3 | |
% Increase | 61.47% | 62.33% | 108.56% | 99.34% | |
3 | E-2334 | 39.8 | 41.2 | 41.5 | 43.4 |
E-2434 | 50.8 | 52.6 | 68.7 | 68.9 | |
% Increase | 27.64% | 27.67% | 65.54% | 58.76% | |
4 | E-2324G | 33 | 34 | 40.9 | 41.4 |
E-2414 | 39.7 | 41.1 | 65.2 | 65.7 | |
% Increase | 20.30% | 20.88% | 59.41% | 58.70% | |
5 | E-2314 | 29.4 | 30.2 | 38.6 | 39 |
E-2414 | 39.7 | 41.1 | 65.2 | 65.7 | |
% Increase | 35.03% | 36.09% | 68.91% | 68.46% |
In addition to better performance, Figure 2 below illustrates the high return on investment associated with these new Intel Xeon E-2400 series processors. Specifically, customers gain up to 1.8x the performance per every dollar spent on CPUs [1]. We calculated performance by dollar by dividing the FP base results reported in Table 4 by the US list price for the corresponding CPU. Please note that pricing varies by region and is subject to change.
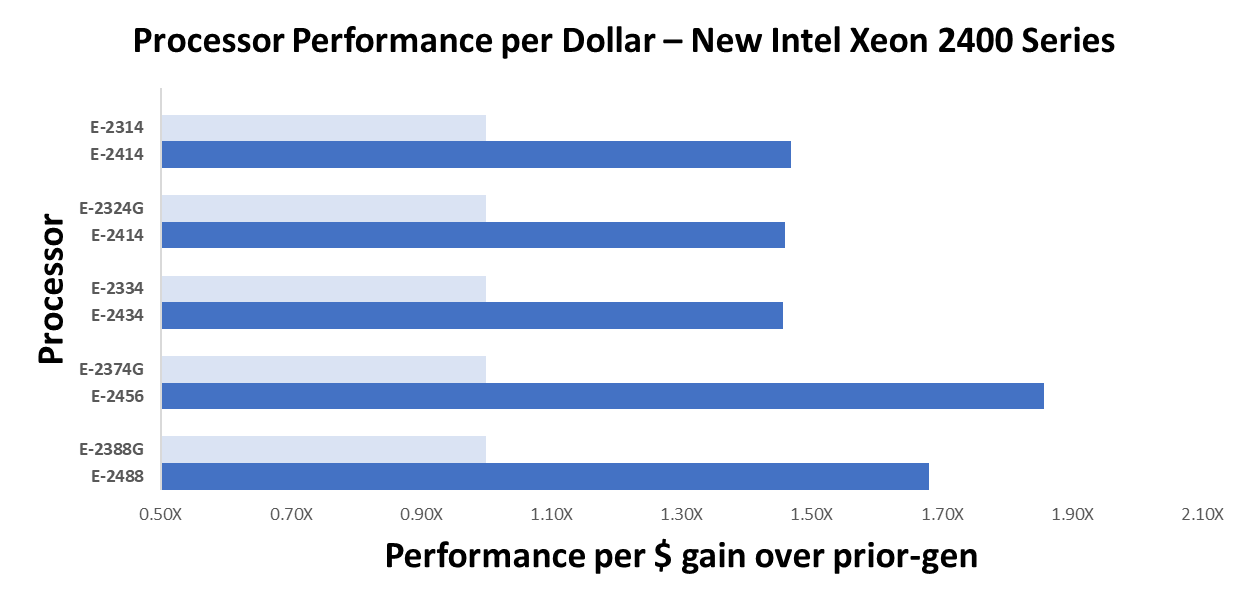
Figure 2. Performance per Dollar gen-over-gen
Conclusion
The PowerEdge T360 and R360 are impressive upgrades from the prior-generation servers, especially considering the performance gains with the latest Intel Xeon E-series CPUs and added GPU support. These highly cost-effective servers empower businesses to accelerate their traditional use cases while exploring the realm of emerging AI workloads.
References
- A2 Tensor Core GPU | NVIDIA
- Worldwide Spending on AI-Centric Systems Forecast to Reach $154 Billion in 2023, According to IDC
- Overview - CPU 2017 (spec.org)
Legal Disclosures
[1] Based on SPEC CPU® 2017 benchmarking of the E-2456 and E-2374G Intel Xeon E-series processors in the PowerEdge R360 and R350, respectively. Testing was conducted by Dell Performance Analysis Labs in October 2023, available on spec.org/cpu2017/. Actual results will vary. Pricing is based on Dell US list prices for Intel Xeon E-series processors and varies by region. Please contact your local sales representative for more information.

Dell PowerEdge with Intel 4th Gen Xeon Built-In Accelerators – Choosing the Right SKU
Tue, 24 Oct 2023 20:21:02 -0000
|Read Time: 0 minutes
Executive Summary
Intel’s 4th gen Xeon introduces several built-in acceleration engines which have meaningful performance implications for use cases directly relevant to the modern and evolving data center. In this DfD, we’ll present a brief introduction to these accelerators and then provide a comprehensive listing of all 4th Gen Xeon FCLGA4677 socketed SKUs presently offered by Dell Technologies and what accelerator support they each provide.
Before the quick overview to explain the built-in Accelerator Engines, the following chart describes the suffixes found on Intel’s 4th Gen Xeon processors:
Options | 4th Generation Intel® Xeon® Processors |
(formerly Sapphire Rapids-SP) | |
H | Database and Analytics up to 4S and 8S depending on SKU |
M | Processor specifications optimized for AI and media processing workloads |
N | Network/5G/Edge |
(High TPT /Low Latency) Processor specifications optimized for communications/networking/NFV (Network Function(s) Virtualization) workloads and operating environments | |
P | Processor specifications optimized for IaaS cloud environments such as orchestration efficiency in high-frequency VM environments |
Q | Lower Tcase SKUs, targeted towards liquid cooling |
S | Storage-optimized SKU with full accelerators enabled (DSA, QAT, DLB) |
T | Support for up to 10-year reliability and support for higher Tcase. These SKUs are often used in operating environments with long-life use requirements and require Network Equipment Building System (NEBS)–Thermal friendly specification support |
U | Supported in one-socket configurations only |
V | Processors specification optimized for SaaS cloud environments. |
Y | |
+ | Feature plus(+) SKU contains 1 of each accelerator enabled (DSA, DLB, QAT, IAA) |
Intel’s 4th Gen Xeon Acceleration Engines
DSA “Data Streaming Accelerator”
Intel® DSA is a high-performance data copy and transformation accelerator that will be integrated in future Intel® processors, targeted for optimizing streaming data movement and transformation operations common with applications for high-performance storage, networking, persistent memory, and various data processing applications.
IAA “In-Memory Analytics Accelerator”
The Intel® In‐Memory Analytics Accelerator (Intel® IAA) is a hardware accelerator that provides very high throughput compression and decompression combined with primitive analytic functions.
QAT “Quick Assist Technology”
Intel Quick Assist Technology is a high-performance data security and compression acceleration solution provided by Intel. This solution utilizes the QAT chip to share symmetrical/asymmetrical encryption computations, DEFLATE lossless compression, and other computation intensive tasks for lower CPU utilization and higher overall platform performance.
DLB “Dynamic Load Balancer”
Intel® DLB is a Peripheral Component Interconnect Express (PCIe) device that provides load-balanced, prioritized scheduling of events (packets) across CPU cores/threads, enabling efficient core-to-core communication. It is a hardware accelerator located inside the latest Intel® Xeon® CPUs offered by Intel. Under the hood, Intel® DLB is a hardware managed system of queues and arbiters connecting producers and consumers.
List of Xeon Gen 4 SKUs and Accelerator Engine Support
The following chart illustrates Xeon Gen 4 CPUs and the quantity of built-in Accelerator Engines featured on each SKU.
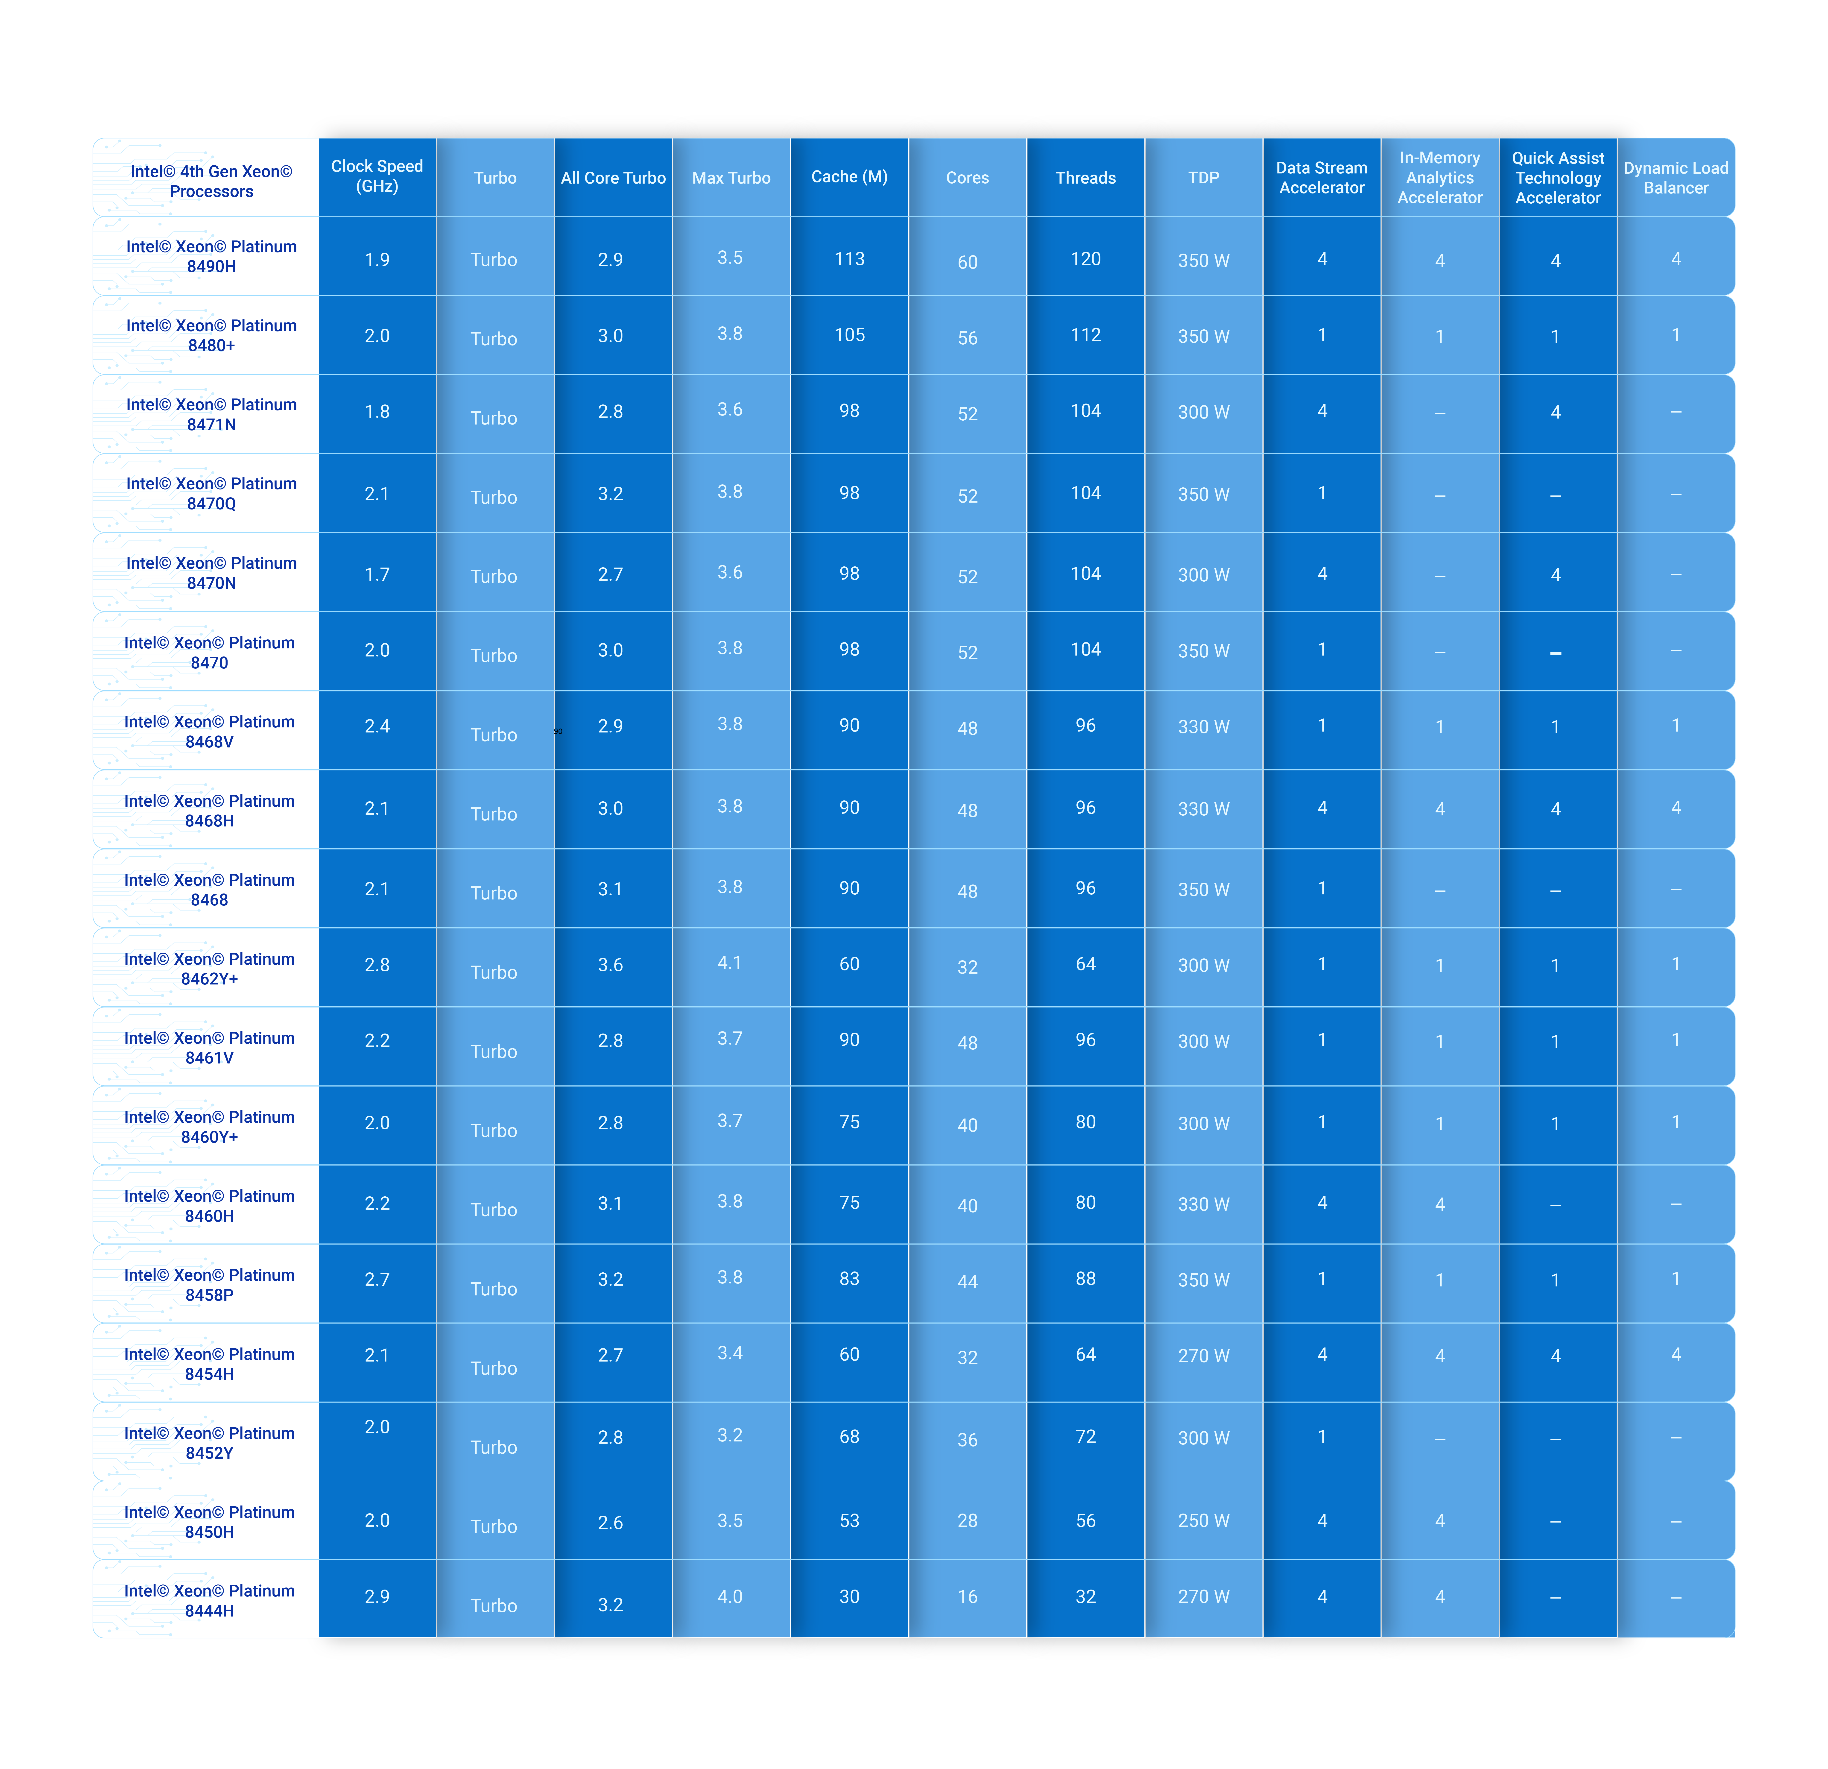
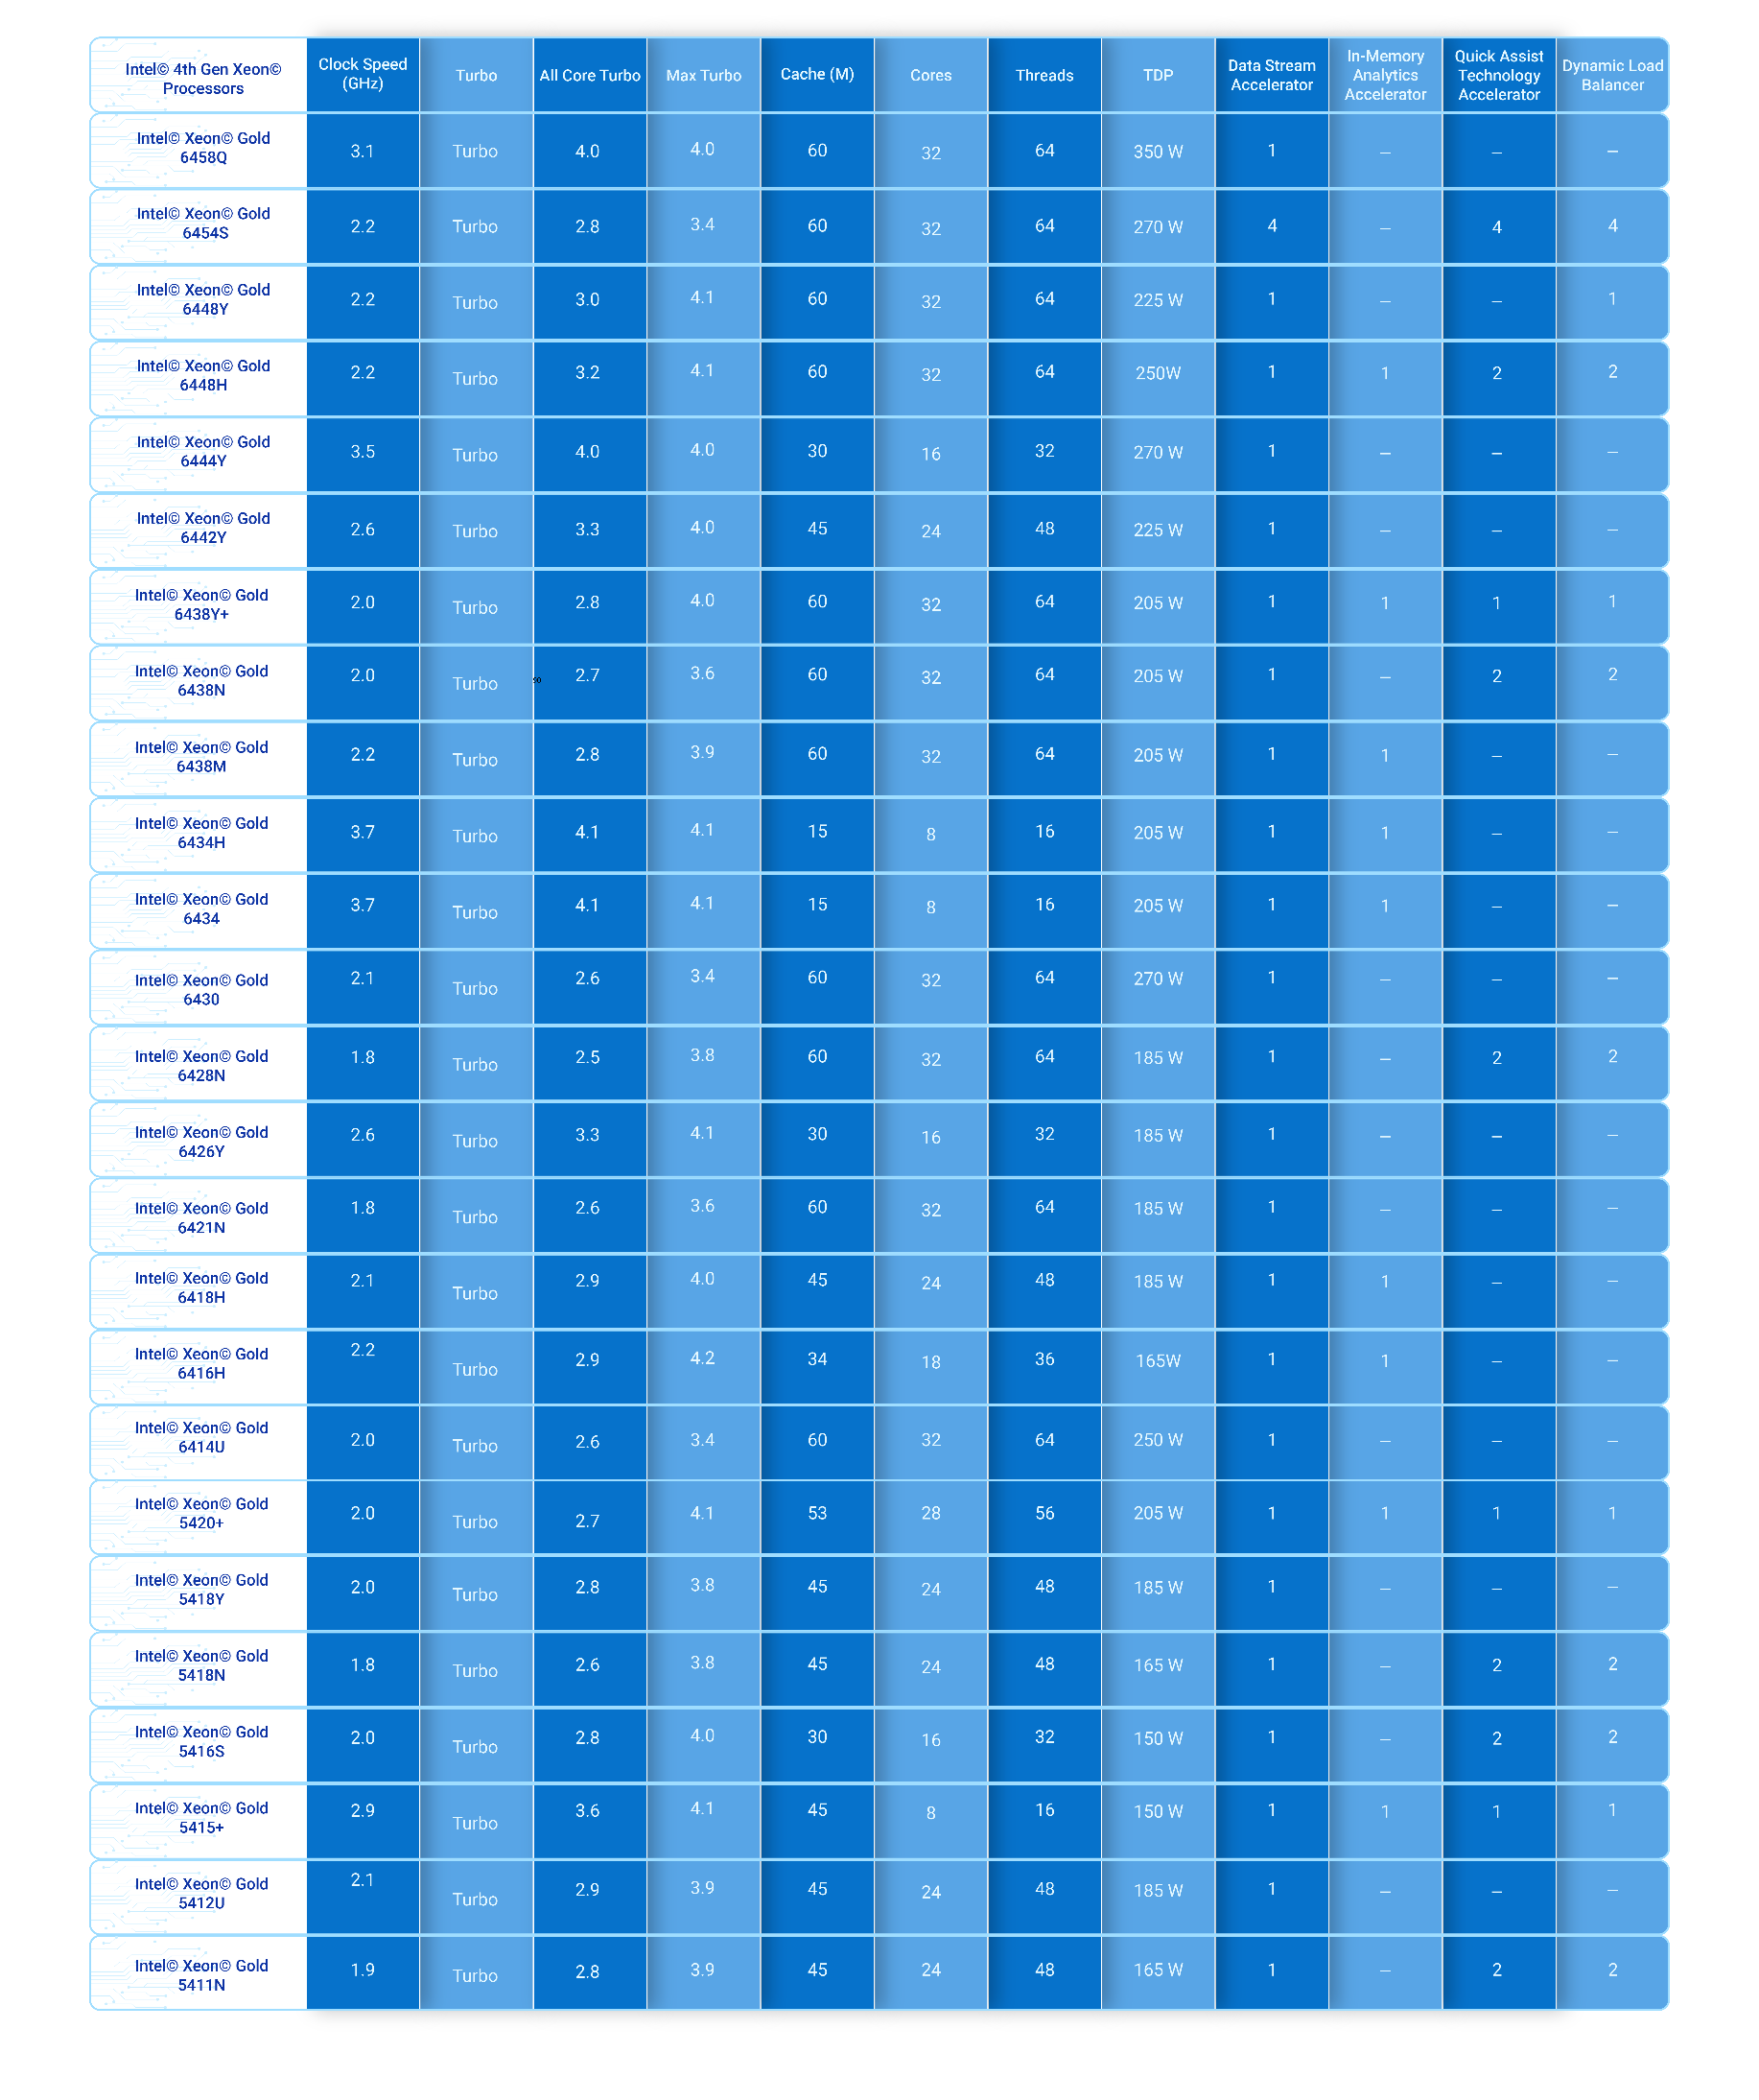
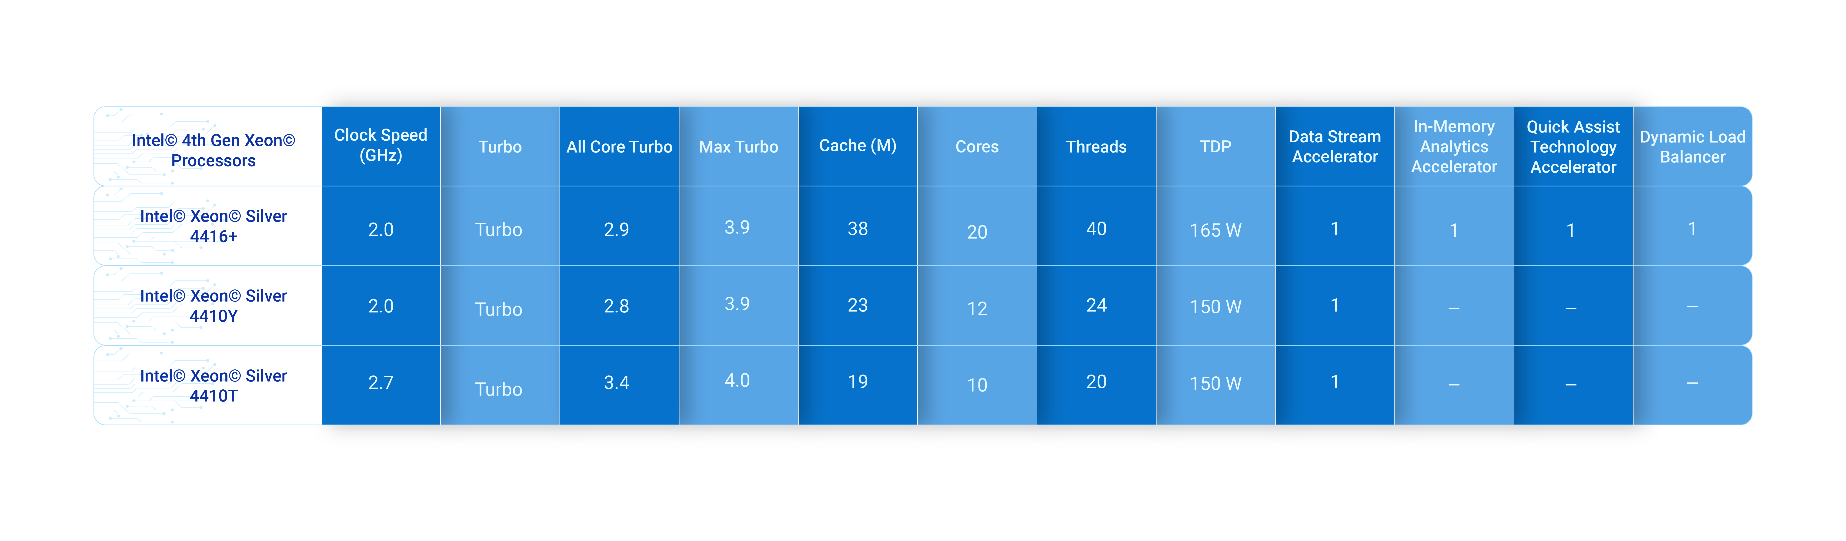
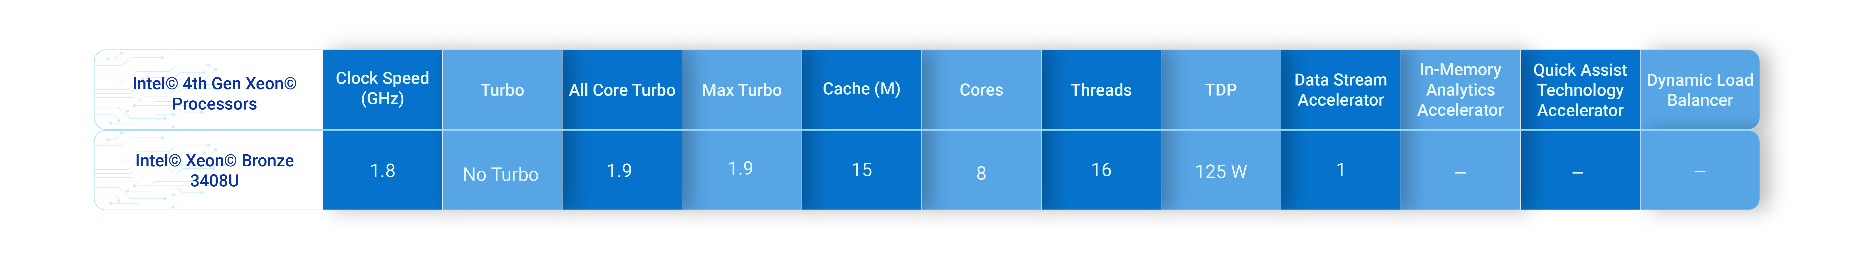

Accelerate Genomics Insights and Discovery with High-Performing, Scalable Architecture from Dell and Intel
Thu, 05 Oct 2023 19:52:19 -0000
|Read Time: 0 minutes
Summary
The field of genomics requires the storage and processing of vast amounts of data. In this brief, Intel and Dell technologists discuss key considerations to successfully deploy BeeGFS based storage for genomics applications on the 16th Generation PowerEdge Server portfolio offerings.
Market positioning
The life sciences industry faces intense pressure to accelerate results and bring new treatments to market while lowering costs, especially in genomics. But life-changing discoveries often depend on processing, storing, and analyzing enormous volumes of genomic sequencing data — more than 20 TB of new data per day by one organization alone[1], with each modern genome sequencer producing up to 10TB of new data per day. Researchers need high-performing solutions built to handle this volume of data, in addition to demanding analytics and artificial intelligence (AI) workloads, and that are also easy to deploy and scale.
Dell and Intel have collaborated on a bill of materials (BoM) that provides life science organizations with a scalable solution for genomics. This solution features high-performance compute and storage building blocks for one of the leading parallel cluster file systems, BeeGFS. The BoM features four Dell PowerEdge rack server nodes powered by 4th Generation Intel® Xeon® Scalable processors, which deliver the performance needed for faster results and time to production.
The BoM can be tailored for each organization’s architectural needs. For dense configurations, customers can use the Dell PowerEdge C6600 enclosure with PowerEdge C6620 server nodes instead of standard PowerEdge R660 servers (each PowerEdge C6600 chassis can hold up to four PowerEdge C6620 server nodes). If they already have a storage solution in place using InfiniBand fabric, the nodes can be equipped with an additional Mellanox ConnectX-6 HDR100 InfiniBand adapter.
Key Considerations
Key considerations for deploying genomics solutions on Dell PowerEdge servers include:
- Core count: Life sciences organizations often process a whole genome on a cluster, which scales linearly with core count. The Dell PowerEdge solution offers up to 32 cores per CPU to meet performance requirements.
- Memory requirements: This BoM provides 512 GB of DRAM to support specific tasks in workloads that have higher memory requirements, such as running Burrows-Wheeler Aligner algorithms.
- Local and distributed storage: Input/output (I/O) is a big consideration for genomics workloads because datasets can reach hundreds of gigabytes in size. Dell and Intel recommend 3.2 TB of local storage specifically for commonly used genomics tools that read and write many temporary files.
Available Configurations
Feature | Configuration |
Platform | 4 x Dell R660 supporting 8 x 2.5” NVMe drives - direct connection |
CPU (per server) | 2x Xeon Gold 6438Y+ (32c @ 2.0GHz) |
DRAM | 512GB (16 x 32GB DDR5-4800) |
Boot device | Dell BOSS-N1 with 2x 480GB M.2 NVMe SSD (RAID1) |
Storage | 1x 3.2TB Solidigm D7-P5620 SSD (PCIe Gen4, Mixed-use) |
Capacity storage | Dell Ready Solutions for HPC BeeGFS Storage: 500 GB capacity per 30x coverage whole genome sequence (WGS) to be processed; 800 MB/s total (200 MB/s per node). |
NIC | Intel E810-XXV Dual Port 10/25GbE SFP28, OCP NIC 3.0 |
Learn More
Contact your Dell or Intel account team for a customized quote at 1-877-289-3355.
Intel Select Solutions for Genomics Analysis: https://www.intel.com/content/dam/www/public/us/en/documents/solution-briefs/select-genomics-analytics.pdf
Dell HPC Ready Architecture for Genomics: https://infohub.delltechnologies.com/static/media/6cb85249-c458-4c06-bcec-ef35c1a363ca.pdf?dgc=SM&cid=1117&lid=spr4502976221&linkId=112053582
Dell Ready Solutions for HPC BeeGFS Storage: https://www.dell.com/support/kbdoc/en-us/000130963/dell-emc-ready-solutions-for-hpc-beegfs-high-performance-storage
[1] Broad Institute. “Sharing Data and Tools to Enable Discovery” https://www.broadinstitute.org/sharing-data-and-tools/cloud-computing#top.

Insights on Cloudera Data Platform on VMware Cloud Foundation Powered by VMware vSAN
Thu, 05 Oct 2023 19:34:38 -0000
|Read Time: 0 minutes
Summary
This joint paper outlines a brief discussion on the key hardware considerations when configuring a successful deployment and recommends configurations based on 15th Generation PowerEdge Server.
Market positioning
VMware Cloud Foundation is built on VMware’s leading hyperconverged architecture, VMware vSAN, with all-flash performance and enterprise-class storage services including deduplication, compression, and erasure coding. vSAN implements hyperconverged storage architecture by delivering an elastic storage and simplifying the storage management.
VMware vSAN is the market leader in hyperconverged Infrastructure (HCI), enabling low cost and high-performance next-generation HCI solutions. It converges traditional IT infrastructure silos onto industry-standard servers, virtualizes physical infrastructure to help customers easily evolve their infrastructure without risk, improves TCO over traditional resource silos, and scales to tomorrow with support for new hardware, applications, and cloud strategies.
Cloudera Data Platorm (CDP) Private Cloud Base supports a variety of hybrid solutions where compute tasks are separated from data storage and where data can be accessed from remote clusters, including workloads created using CDP Private Cloud Experiences. This hybrid approach provides a foundation for containerized applications by managing storage, table schema, authentication, authorization, and governance.
Key Considerations
- Often, enterprises have at least a development CDP cluster, a preproduction staging CDP cluster, and a production cluster. With virtualization, there is the flexibility to share the hardware for these Hadoop clusters. The CDP version for the development cluster is likely more current than that of the others because developers like to work with the newer versions. Dedicating a set of hardware to one version of a Hadoop vendor’s product does not make the best use of resources.
- Co-locating CDP VMs on host servers with VMs supporting different workloads is also possible, particularly for situations that are not performance critical. Doing this can balance the use of the system. This often enables better overall utilization by consolidating applications that either use different kinds of hardware resources or use the hardware resources at different times of the day or night.
- Efficiency: VMware enables easy and efficient deployment of CDP on an existing virtual infrastructure as well as consolidation of otherwise dedicated CDP cluster hardware into a data center or cloud environment.
- Availability and fault tolerance: vSphere features such as VMware vSphere High Availability (vSphere HA) and VMware vSphere Fault Tolerance (vSphere FT) can protect the CDP components from server failure and improve availability. Resource management tools such as VMware vSphere vMotion can provide availability during planned server downtime and maintenance windows.
Available Configurations
| Cloudera Data Platform on VMware Cloud Foundation (VCF) with vSAN |
| ||
| VCF Management Domain 4 nodes required
| VCF Workload Domain for Cloudera Data Platform Base
4 (minimum) up to 64 nodes per workload domain Up to 15 workload domains (including management domain)
|
| |
Platform | PowerEdge R650 supporting 10 NVMe drives (direct), or VxRail E660N |
| ||
CPU | 2x Intel® Xeon® Gold 5318Y processor (2.1GHz, 24 cores) | 2x Intel Xeon Gold 6348 processor (2.6GHz, 28 cores 4 GHz)
|
| |
DRAM | 256GB (16x 16GB DDR4-3200) or more | 512 GB (16 x 32 GB DDR4-3200) or more |
| |
Boot Device | Dell BOSS-S2 with 2x 240GB or 2x 480GB M.2 SATA SSD (RAID1) |
| ||
Cache tier Drives | 2x 400GB Intel Optane P5800X (PCIe Gen4) |
| ||
Capacity tier Drives (1) | 6x (up to 8x) 1.92TB Enterprise NVMe Read Intensive AG Drive U.2 Gen4 | 8x 1.92TB or 3.84TB Enterprise NVMe Read Intensive AG Drive U.2 Gen4 |
| |
Network Interface Controller | Intel E810-XXVDA2 for OCP3 (dual-port 25Gb) | Intel E810-XXVDA2 for OCP3 (dual-port 25Gb), or Intel E810-CQDA2 PCIe (dual-port 100Gb) |
| |
Note: For more than 7 workload domains, each node needs a minimum of 512GB DRAM (16x 32GB) and more capacity (use 3.84TB drives instead of 1.92TB).
This solution can be deployed on either Dell PowerEdge based vSAN ReadyNodes or VxRail appliances.
Solution adopted from https://core.vmware.com/resource/cloudera-data-platform-vmware-cloud-foundation-powered-vmware-vsan.
For more information and specifications, contact a Dell representative. Alternative storage configurations can be considered.
Authors: Todd Mottershead (Dell), Seamus Jones (Dell), Esther Baldwin (Intel), Krzysztof Cieplucha (Intel), Teck Joo (Intel), Amandeep Raina (Intel), and Patryk Wolsza (Intel)

Powering AI using Red Hat Openshift with Intel based PowerEdge servers
Fri, 13 Oct 2023 14:42:09 -0000
|Read Time: 0 minutes
End-to-End AI using OpenShift Overview
At the top of this webpage are 3 PDF files outlining test results and reference configurations for Dell PowerEdge servers using both the 3rd Generation Intel® Xeon® processors and the 4th Generation Intel Xeon processors. All testing was conducted in Dell Labs by Intel and Dell Engineers in May and June of 2023.
- “Dell DfD E2E AI ICX” – highlights the recommended configurations for Dell PowerEdge servers using 3rd generation Intel Xeon processors.
- “Dell DfD E2E AI SPR” – highlights the recommended configurations for Dell PowerEdge servers using 4th generation Intel Xeon processors.
- “DfD – PowerEdge E2E AI Test Report” – Highlights the results of performance testing on both configurations with comparisons that demonstrate both performance and reduced power consumption for each.
Solution Overview
Red Hat OpenShift, the industry's leading hybrid cloud application platform powered by Kubernetes, brings together tested and trusted services to reduce the friction of developing, modernizing, deploying, running, and managing applications. OpenShift delivers a consistent experience across public cloud, on-premise, hybrid cloud, or edge architecture.[i]
Companies using OpenShift[ii]
- 50% of Fortune Global 500 aerospace and defense companies.
- 57% of Fortune Global 500 technology companies.
- 51% of Fortune Global 500 financial companies.
- 80% of Fortune Global 500 telecommunications companies.
- 54% of Fortune Global 500 motor vehicles and parts companies.
- 50% of Fortune Global 500 food and drug stores.
Elasticsearch with Dell PowerEdge and Intel processor benefits
The introduction of new server technologies allows customers to deploy solutions using the newly introduced functionality but it can also provide an opportunity for them to review their current infrastructure and determine if the new technology might increase performance and efficiency. With this in mind, Dell and Intel recently conducted Natural Language Processing Artificial Intelligence (AI) performance testing of a RedHat OpenShift solution on the new Dell PowerEdge R760 with 4th generation Intel® Xeon® Scalable processors and compared the results to the same solution running on the previous generation R750 with 3rd generation Intel® Xeon® Scalable processors to determine if customers could benefit from a transition.
Some of the key changes incorporated into 4th generation Intel® Xeon® Scalable processors utilized for this test included:
- New Advanced Matrix Extension (AMX) capabilities
- Improved Advanced Vector Extension (AVX) performance
- The new Intel® Extension for TensorFlow® open-source solution
Raw performance: As noted in the report, our tests showed a 3.47x increase in transfer learning performance and a 5.59x increase in Inferencing Performance
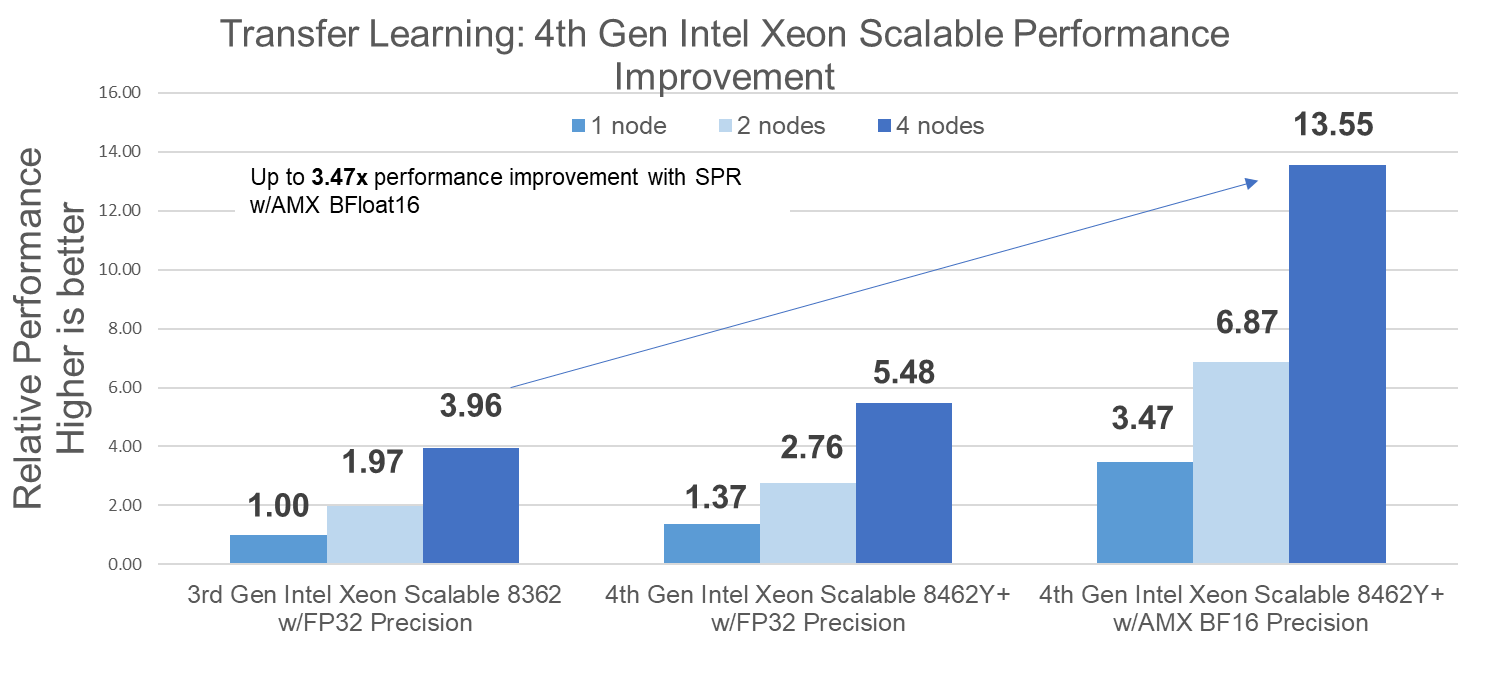
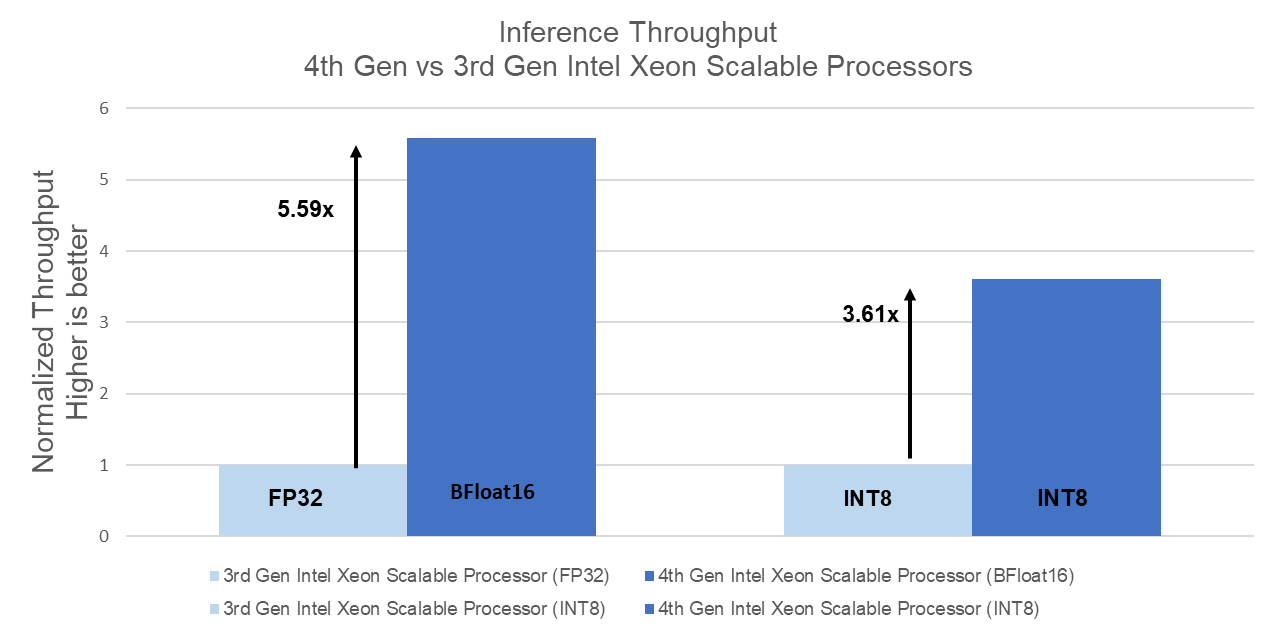
Relative Power Consumption: In addition to higher performance, the R760 based solution also delivered up to 3.39x better performance per watt than the previous generation:
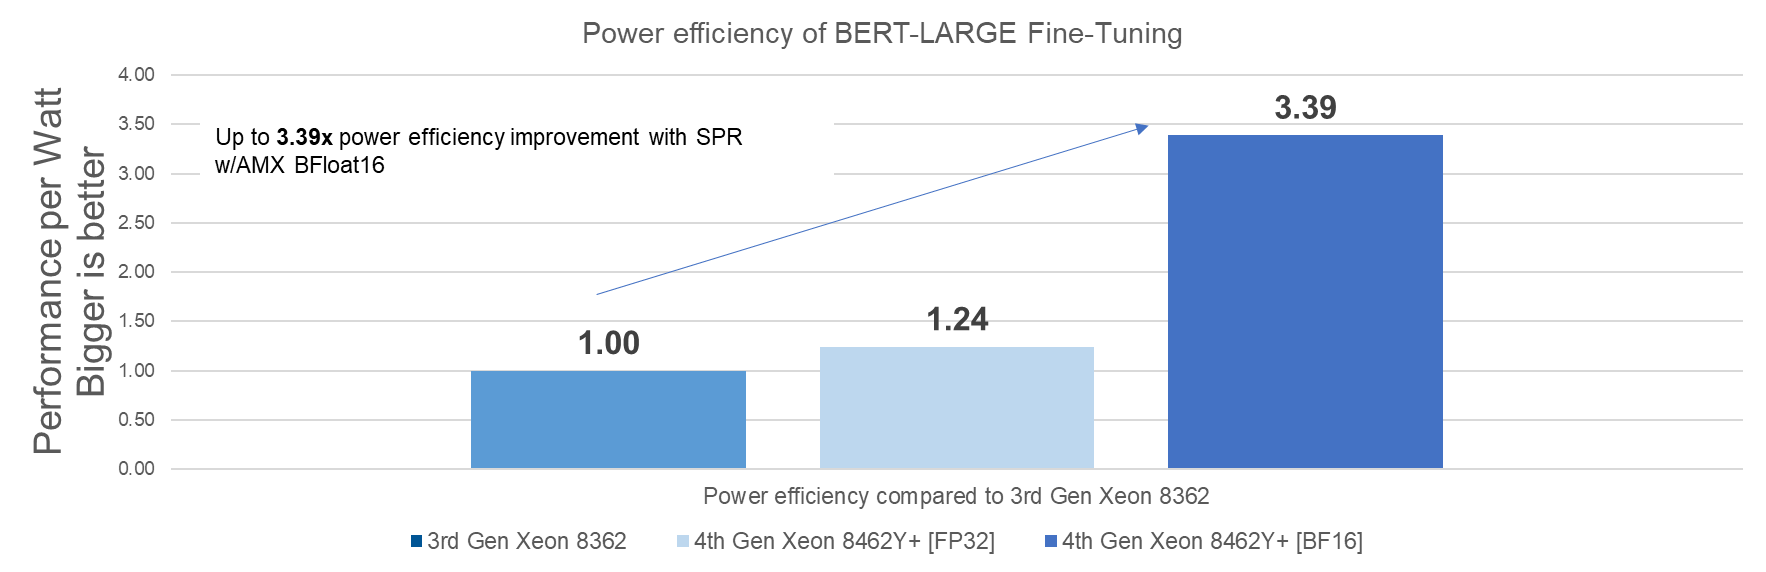
Conclusion
Choosing the right combination of Server and Processor can increase performance and reduce cost. As this testing demonstrated, the Dell PowerEdge R760 with 4th Generation Intel® Xeon® Platinum 8462Y+ CPU’s delivered up to 5.59x more throughput than the Dell PowerEdge R750 with 3rd Generation Intel® Xeon® Platinum 8362 CPU’s and provided up to 3.39x better power efficiency.
Efficient, scalable, and optimized means to run Enterprise AI pipelines on Intel HW; full end-to-end OpenShift stack with Kubeflow
- Up to 3.47x better transfer learning (Fine Tuning) throughput than 3rd Gen Xeon Scalable Processor; with linear scaling on 1, 2, and 4 nodes
- Up to 3.39x higher transfer learning power efficiency than 3rd Gen Xeon Scalable Processor
- Up to 5.59x better performance (inferencing) over 3rd gen Intel Xeon Scalable Processors with FP32 precision using the same core count
- Up to 3.61x performance improvement over 3rd generation Intel® Xeon® Scalable Processors with INT8 precision using same core count
[ii] Source: Fortune 500 subscription data as of 26 September 2022

Intel 4th Gen Xeon featuring QAT 2.0 technology delivers massive performance uplift in common cipher suites
Tue, 19 Sep 2023 18:53:46 -0000
|Read Time: 0 minutes
Intel QAT Hardware v2.0 acceleration running on 16G PowerEdge delivers on performance for ISPs - Lab Tested and Proven
Introduction
The Internet as we know it would simply not be possible without encryption technologies. This technology lets us perform secure communication and information exchange over public networks. If you buy a pair of shoes from an online retailer, the payment information you provide is encrypted with such a high level of security that extracting your credit card information from ciphertext would be nearly an impossible task for even a supercomputer. The shoes might not end up fitting, but if the requisite encryption and secure communication tech is properly implemented, your payment information remains a secret known only to you and the entity receiving payment.
This domain of security requires hardware that is up to the task of performing handshakes, key exchanges, and other algorithmic tasks at an expeditious speed.
As we’ll demonstrate through extensive testing and proven results in our lab, Intel’s QAT 2.0 Hardware Accelerator featured on Gen4 Xeon processors is a performant and dev friendly choice to supercharge your encryption workloads. This feature is readily available on our current products across the PowerEdge Server portfolio.
What is QAT?
QAT, or “Quick Assist Technology” is an Intel technology that accelerates two common use cases: encryption acceleration and compression/decompression acceleration. In this tech note, we look at the encryption side of the QAT Accelerator feature set and explore leveraging QAT to speed up cipher suites used in deployments of OpenSSL–a common software library used by a vast array of websites and applications to secure their communications.
But before we start, let’s briefly touch on the lineage and history of QAT. QAT was introduced back in 2007, initially available as a discrete add-in PCIe card. A little further on in its evolution, QAT found a home in Intel Chipsets. Now, with the introduction of the 4th Gen Xeon processor, the silicon required to enable QAT acceleration has been added to the SOC. The hardware being this close to the processor has increased performance and reduced the logistical complexity of having to source and manage an external device.
For a complete list of the QAT Hardware v2.0’s cryptosystem and algorithms support, see: https://github.com/intel/QAT_Engine/blob/master/docs/features.md#qat_hw-features
QAT hardware acceleration may not be the fastest method to accelerate all ciphers or algorithms. With this in mind, QAT Hardware Acceleration (also called QAT_HW) can peacefully co-exist with QAT Software Acceleration (or QAT_SW). This configuration, while somewhat complex, is well supported by clear documentation. Fundamentally, this configuration relies on a method to ensure that the maximum performance is extracted for all inputs given what resources are available on the system. Allowing for use of an algorithm bitmap to dynamically choose between and prioritize the use of QAT_HW and QAT_SW based on hardware availability and which method offers the best performance.
Next we'll look at setting up QATlib and see what the performance looks like using OpenSSL Speed and a few common cipher suites.
Lab Test Setup and Notes
For this test we use a Dell PowerEdge R760. This is Dell’s mainstream 2U dual socket 4th Gen Xeon offering and features support for nearly all of Intel’s QAT enabled CPUs. Xeon gen4 CPUs that feature on-chip QAT HW 2.0 will have 1, 2 or 4 QAT endpoints per socket. We selected the Intel(R) Xeon(R) Gold 5420+ CPU that features 1 QAT endpoint for our testing. All else being equal, more endpoints allow for more QAT Hardware acceleration work to be done and allow greater performance in QAT HW accelerated use cases per socket.
As this is not a deployment guide, we’re going to use a RHEL 9.2 install as our operating system and run bare metal for our tests. Our primary resource for setting up QAT Hardware Version 2.0 Acceleration is the excellent QAT documentation found on Intel’s github here: https://intel.github.io/quickassist/index.html
Following the guide, we can simply install from RPM sources, ensure kernel drivers are loaded and we’re about ready to go.
Performance
First up, we’ll take a look at probably the most common public key asymmetric cipher suite, RSA. On the Internet RSA finds its home as a key exchange and signature method used to secure communication and confirm identities. In these graphs we’re comparing the speed of the RSA Sign and Verify algorithm using symmetric QAT_HW vs symmetric QAT off (using OpenSSLs default engine).
The following graphic shows a representation of a TLS handshake. This provides a bit of context concerning the role of the server in key exchange and handshakes.
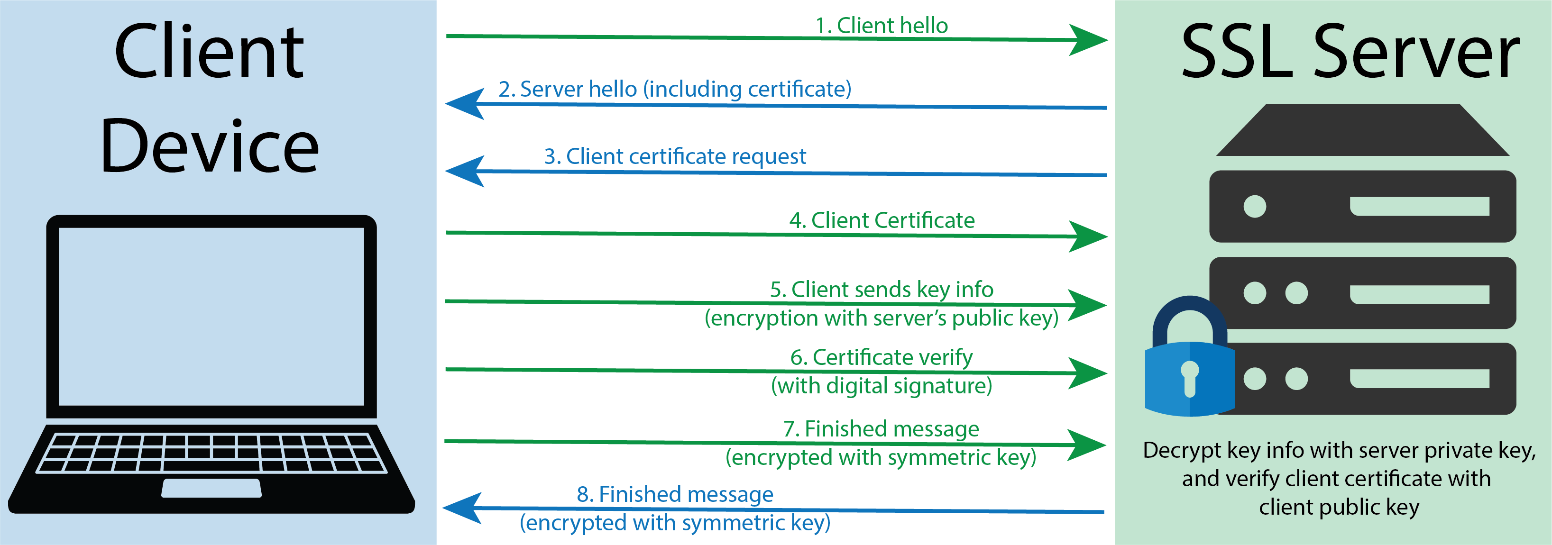 TLS handshake representation
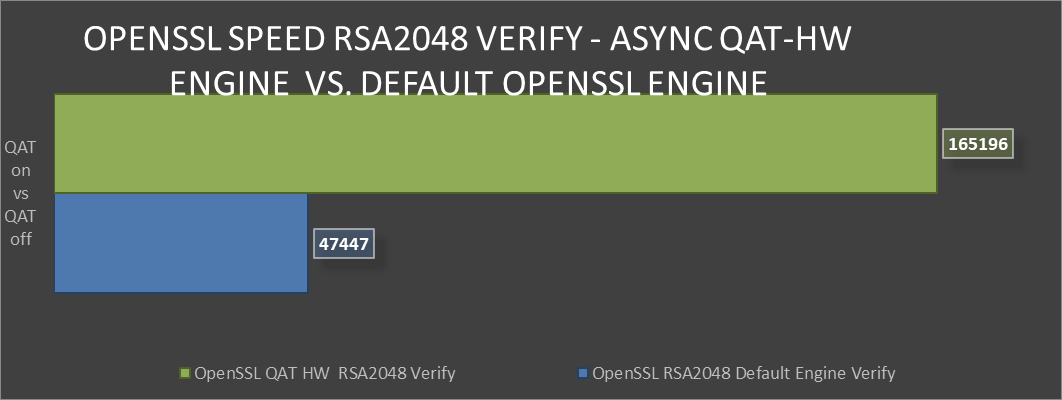 OpenSSL Speen RSA2048 Verify comparison
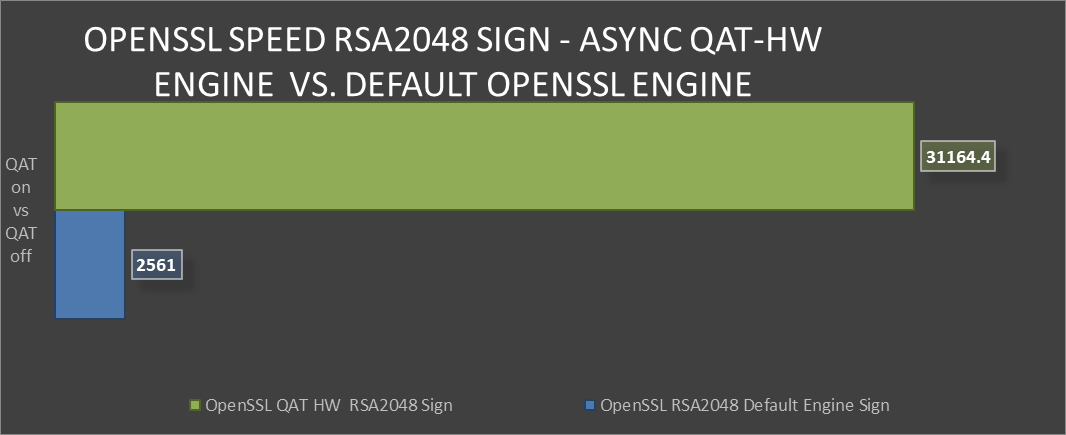 OpenSSL Speed RSA2048 Sign comparison
 Greater than 240% performance increase in OpenSSL RSA Verify using QAT Hardware Acceleration Engine vs Default Open SSL Engine.(1)
Testing in our labs shows that enabling QAT offers 240% greater algorithmic operations. The result for this performance improvement could be the implementation of greater security capacity per node without the risk of negative impact on QoS.
Next we’ll look at the industry standard elliptical curve digital signature algorithm (ECDSA), specifically P-384. QAT HW supports both P-256 and P-384, with both offering exceptional performance vs the default OpenSSL engine. ECDSA is a commonly used as a key agreement protocol by many Internet messaging apps.
ECDSA example
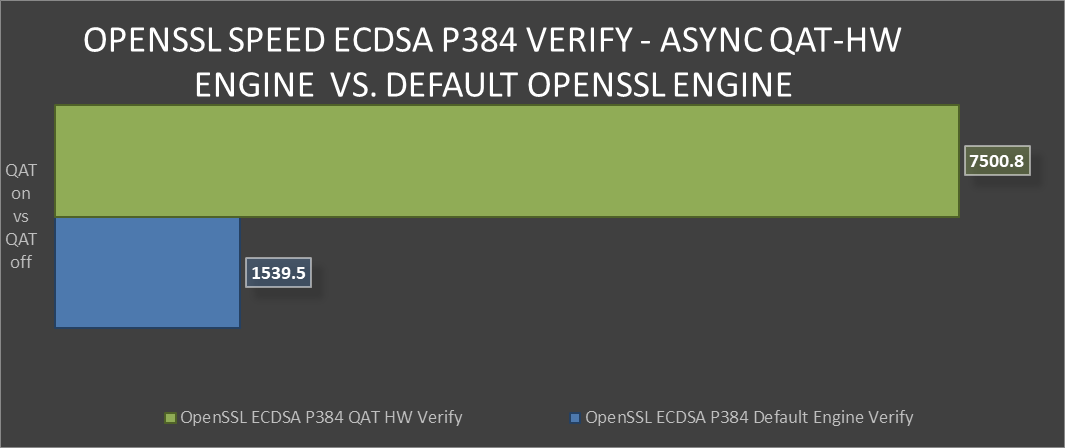 OpenSSL Speed ECDSA P384 Verify comparison
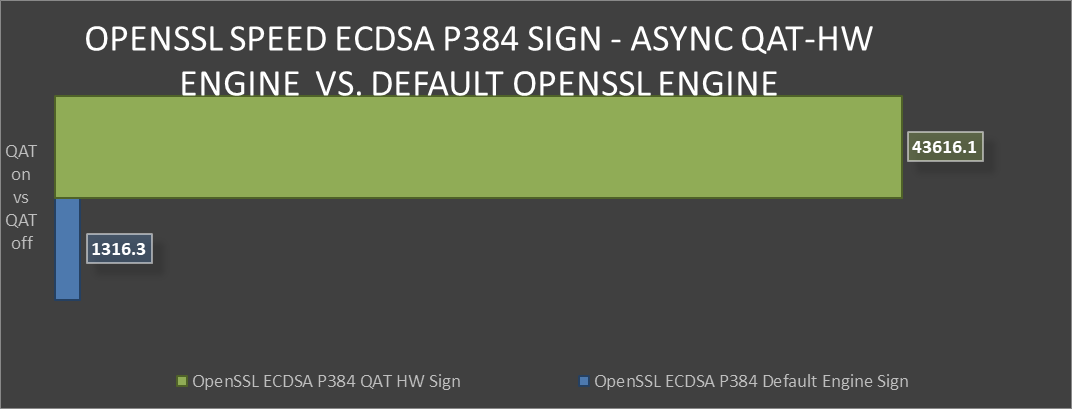 OpenSSL Speed ECDSA P384 Sign comparison
 Over 30x improvement in ECDSA P384 Sign-in OpenSSL using QAT Hardware Acceleration Engine vs Default OpenSSL Engine(2)
Both of these algorithms provide the level of protection that today’s server security specialists require. However, both are quite different in many aspects.
This vast performance improvement in secure key exchange offers more secure and uncompromised communication without degrading performance.
Conclusion
Intel’s QAT 2.0 Hardware acceleration offers substantial performance improvements for algorithms found in commonly used cipher suites. Also, QAT’s ample documentation and long history of use coupled with these new findings on performance should remove any reservations that a customer might have in deploying these security accelerators. Security at the server silicon level is critical to a modern and uncompromised data center. There is definite value in deploying QAT and a clear path towards realizing accelerated performance in their data center environments.
Legal disclosures
- Based on August 2023 Dell labs testing subjecting the PowerEdge R760 to OpenSSL Speed test running synchronously with default engine vs asynchronous with QAT Hardware Engine. Actual results will vary.
- Based on August 2023 Dell labs testing subjecting the PowerEdge R760 to OpenSSL Speed test running synchronously with default engine vs asynchronous with QAT Hardware Engine. Actual results will vary.

Unlock the Power of PowerEdge Servers for AI Workloads: Experience Up to 177% Performance Boost!
Fri, 11 Aug 2023 16:23:55 -0000
|Read Time: 0 minutes
Executive summary
As the digital revolution accelerates, the vision of an AI-powered future becomes increasingly tangible. Envision a world where AI comprehends and caters to our needs before we express them, where data centers pulsate at the heart of innovation, and where every industry is being reshaped by AI's transformative touch. Yet, this burgeoning AI landscape brings an insatiable demand for computational resources. TIRIAS Research estimates that 95% or more of all current AI data processed is through inference processing, which means that understanding and optimizing inference workloads has become paramount. As the adoption of AI grows exponentially, its immense potential lies in the realm of inference processing, where customers reap the benefits of advanced data analysis to unlock valuable insights. Harnessing the power of AI inference, which is faster and less computationally intensive than training, opens the door to diverse applications—from image generation to video processing and beyond.
Unveiling the pivotal role of Intel® Xeon® CPUs, which account for a staggering 70% of the installed inferencing capacity, this paper ventures into a comprehensive exploration, offering simple guidance to fine-tune BIOS on your PowerEdge servers for achieving optimal performance for CPU based AI workloads for their workload. We discuss available server BIOS configurations, AI workloads, and value propositions, explaining which server settings are best suited for specific AI workloads. Drawing upon the results of running 12 diverse workloads across two industry-standard benchmarks and one custom benchmark, our goal is simple: To equip you with the knowledge needed to turbocharge your servers and conquer the AI revolution.
Through extensive testing on Dell PowerEdge servers using industry-standard AI benchmarks, results showed:
 Up to 140% increase in TensorFlow inferencing benchmark performance
 Up to 46% increase in OpenVINO inferencing benchmark performance
 Up to 177% increase in raw performance for high-CPU-utilization AI workloads
 Up to 9% decrease in latency and up to 10% increase in efficiency with no significant increase in power consumption
The AI performance benchmarks focus on the activity that forms the main stage of the AI life cycle: inference. The benchmarks used here measure the time spent on inference (excluding any preprocessing or post-processing) and then report on the inferences per second (or frames per second or millisecond).
Performance analysis and process
We conducted iterative testing and data analysis on the PowerEdge R760 with 4th Gen Intel Xeon processors to identify optimal BIOS setting recommendations. We studied the impacts of various BIOS settings, power management settings, and different workload profile settings on throughput and latency performance for popular inference AI workloads such as Intel’s OpenVINO, TensorFlow, and customer-specific computer-vision-based workloads.
Dell PowerEdge servers with 4th Gen Intel Xeon processors and Intel delivered!
So what are these AI performance benchmarks?
We used a centralized testing ecosystem where the testing-related tasks, tools, resources, and data were integrated into a unified location, our Dell Labs, to streamline and optimize the testing process. We used various AI computer vision applications useful for person detection, vehicle detection, age and gender recognition, crowd counting, parking spaces detection, suspicious object recognition, and traffic safety analysis, and the following performance benchmarks:
- OpenVINO: A cross-platform deep learning and AI inferencing toolkit, developed by Intel, which has moderate CPU utilization.
- TensorFlow: An open-source deep learning and AI inferencing framework used to benchmark performance and characterized as a high CPU utilization workload.
- Computer-vision-based workload: A customer-specific workload. Scalers AI is a CPU-based smart city solution that uses AI and computer vision to monitor traffic safety in real time and takes advantage of the Intel AMX instructions. The solution identifies potential safety hazards, such as illegal lane changes on freeway on-ramps, reckless driving, and vehicle collisions, by analyzing video footage from cameras positioned at key locations. It is characterized as a high CPU utilization workload.
PowerEdge server BIOS settings
To improve out-of-the-box performance, we used the following server settings to achieve the optimal BIOS configurations for running AI inference workloads:
- Logical Processor: This option controls whether Hyper-Threading (HT) Technology is enabled or disabled for the server processors (see Figure 1 and Figure 2). The default setting is Enabled to potentially increase CPU utilization and overall system performance. However, disabling it may be beneficial for tasks that do not benefit from parallel execution. Disabling HT allows each core to fully dedicate its resources to a single task, often leading to improved performance and reduced resource contention in these cases.
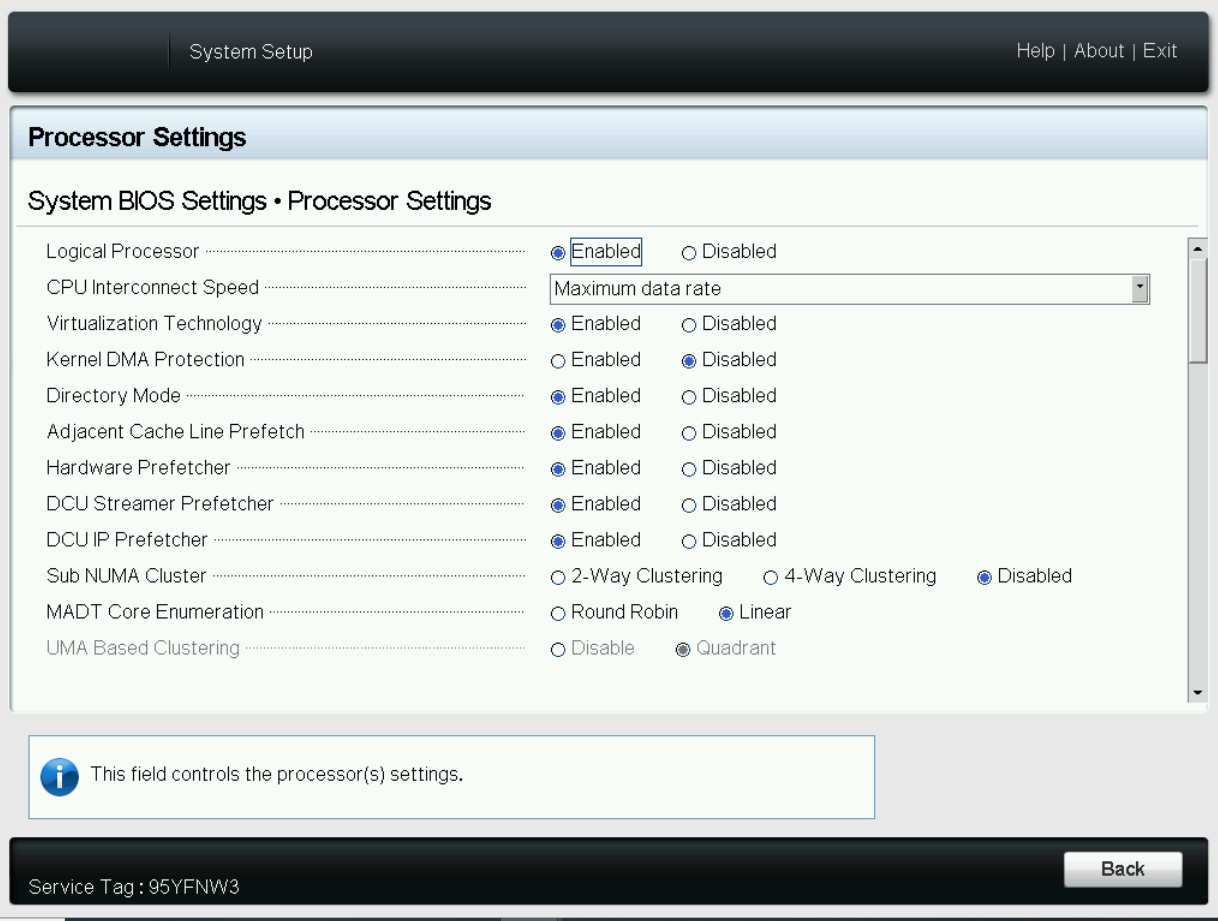
Figure 1. BIOS settings for Logical Processor on Dell server
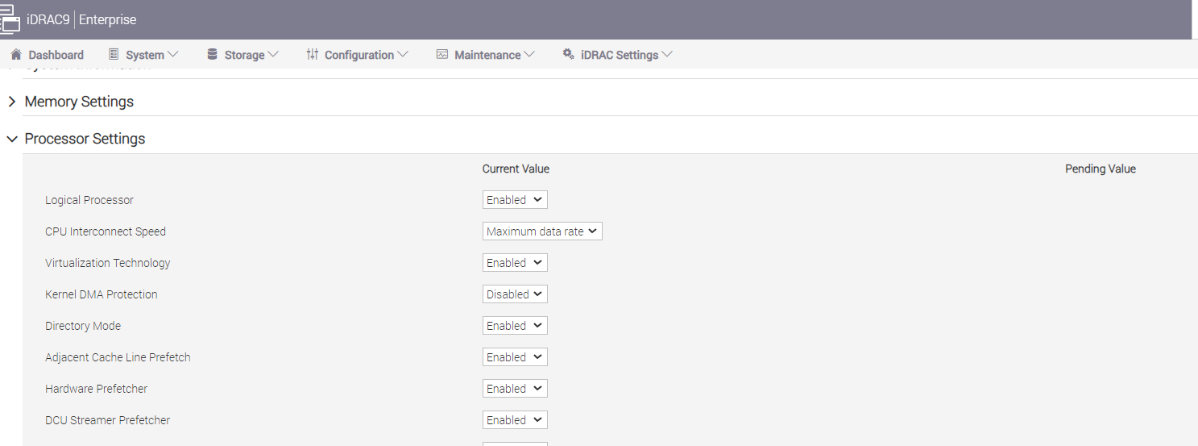
Figure 2. BIOS settings for Logical Processor on Dell iDRAC
- System Profile: This setting specifies options to change the processor power management settings, memory, and frequency. These five profiles (see Figure 1) can have a significant impact on both power efficiency and performance. The System Profile is set to Performance Per Watt (DAPC) as the default profile, and changes can be made through the BIOS setting on the server or by using iDRAC (See Figure 3 and Figure 4). We focused on the default and Performance options for System Profile because our goal was to optimize performance.
Additionally, we could see improvements in performance (throughput in FPS) and latency (in ms) for no significant increase in power.
- Performance-per-watt (DAPC) is the default profile and represents an excellent mix of performance balanced with power consumption reduction. Dell Active Power Control (DAPC) relies on a BIOS-centric power control mechanism that offers excellent power efficiency advantages with minimal performance impact in most environments and is the CPU Power Management choice for this overall System Profile.
- Performance profile provides potentially increased performance by maximizing processor frequency and disabling certain power-saving features such as C-states. Although not optimal for all environments, this profile is an excellent starting point for performance optimization baseline comparisons.
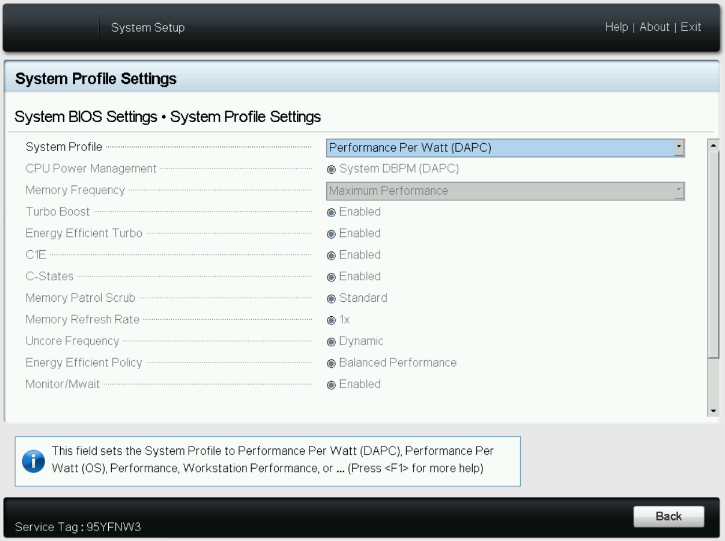
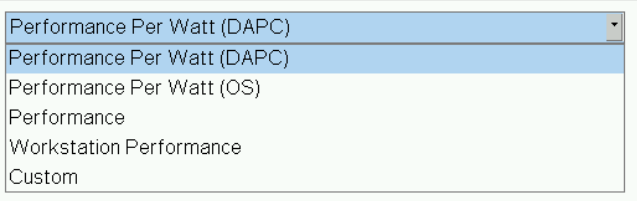
Figure 3. System BIOS settings—System Profiles Settings server screen
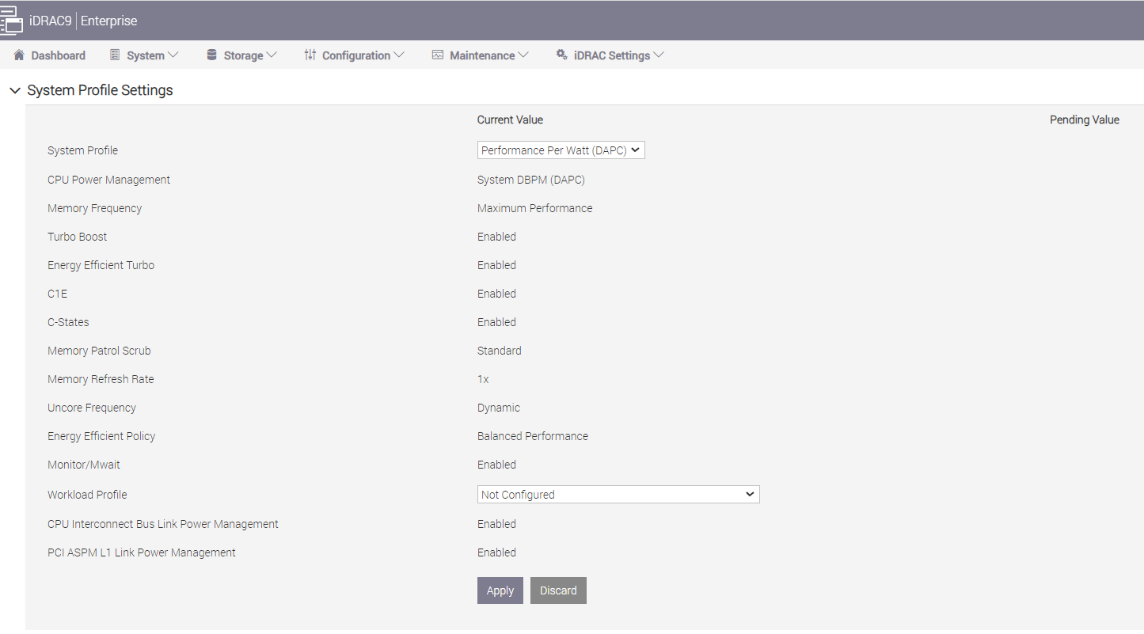
Figure 4. BIOS settings for System Profile and Workload Profile on Dell iDRAC
- Workload Profile: This setting allows the user to specify the targeted workload of a server to optimize performance based on the workload type. It is set to Not Configured as the default profile, and changes can be made through the BIOS setting on the server or by using iDRAC (see Figure 4 and Figure 5).
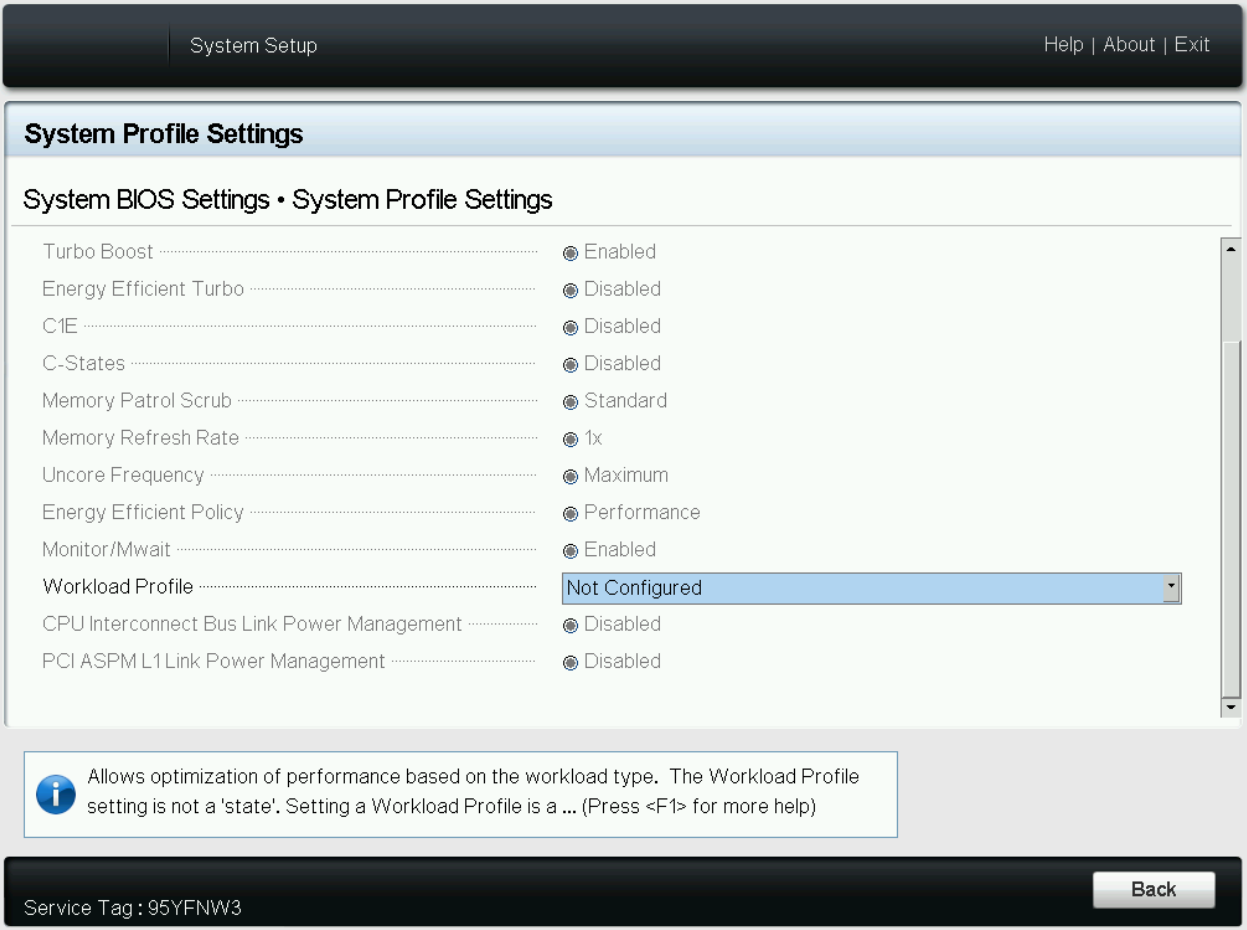
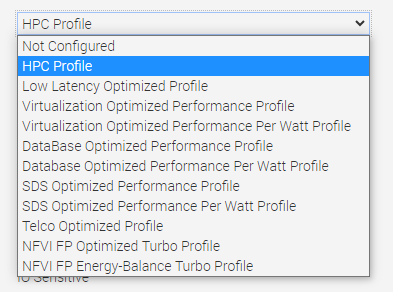 Figure 5. BIOS settings for Workload Profile on Dell iDRAC
Now the question is, does the type of workload influence CPU optimization strategies?
When a CPU is used dedicatedly for AI workloads, the computational demands can be quite distinct compared to more general tasks. AI workloads often involve extensive mathematical calculations and data processing, typically in the form of machine learning algorithms or neural networks. These tasks can be highly parallelizable, leveraging multiple cores or even GPUs to accelerate computations. For instance, AI inference tasks involve applying trained models to new data, requiring rapid computations, often in real time. In such cases, specialized BIOS settings, such as disabling hyperthreading for inference tasks or using dedicated AI optimization profiles, can significantly boost performance.
On the other hand, a more typical use case involves a CPU running a mix of AI and other workloads, depending on demand. In such scenarios, the CPU might be tasked with running web servers, database queries, or file system operations alongside AI tasks. For example, a server environment might need to balance AI inference tasks (for real-time data analysis or recommendation systems) with more traditional web hosting or database management tasks. In this case, the optimal configuration might be different, because these other tasks may benefit from features such as hyperthreading to effectively handle multiple concurrent requests. As such, the server's BIOS settings and workload profiles might need to balance AI-optimized settings with configurations designed to enhance general multitasking or specific non-AI tasks.
PowerEdge server BIOS tuning
In the pursuit of identifying optimal BIOS settings for enhancing AI inference performance through a deep dive into BIOS settings and workload profiles, we uncover key strategies for enhancing efficiency across varied scenarios.
Disabling hyperthreading
We determined that disabling the logical processor (hyperthreading) on the BIOS is another simple yet effective means of increasing performance up to 2.8 times for high CPU utilization workloads such as TensorFlow and computer-vision-based workload (Scalers AI), which run AI inferencing object detection use cases.
But why does disabling hyperthreading have such extensive impact on performance?
Disabling hyperthreading proves to be a valuable technique for optimizing AI inference workloads for several reasons. Hyperthreading enables each physical CPU core to run two threads simultaneously, which benefits overall system multitasking. However, AI inference tasks often excel in parallelization, rendering hyperthreading less impactful in this context. With hyperthreading disabled, each core can fully dedicate its resources to a single AI inference task, leading to improved performance and reduced contention for shared resources.
The nature of AI inference workloads involves intensive mathematical computations and frequent memory access. Enabling hyperthreading might result in the two threads on a single core competing for cache and memory resources, introducing potential delays and cache thrashing. In contrast, disabling hyperthreading allows each core to operate independently, enabling AI inference workloads to make more efficient use of the entire cache and memory bandwidth. This enhancement leads to increased overall throughput and reduced latency, significantly boosting the efficiency of AI inference processing.
Moreover, disabling hyperthreading offers advantages in terms of avoiding thread contention and context switching issues. In real-time or near-real-time AI inference scenarios, hyperthreading can introduce additional context switching overhead, causing interruptions and compromising predictability in task execution. When you opt for one thread per core with hyperthreading disabled, AI inference workloads experience minimal context switching and ensure continuous dedicated runtime. As a result, this approach achieves improved performance and delivers more consistent processing times, thereby streamlining the overall AI inference process.
The following charts represent what we learned.
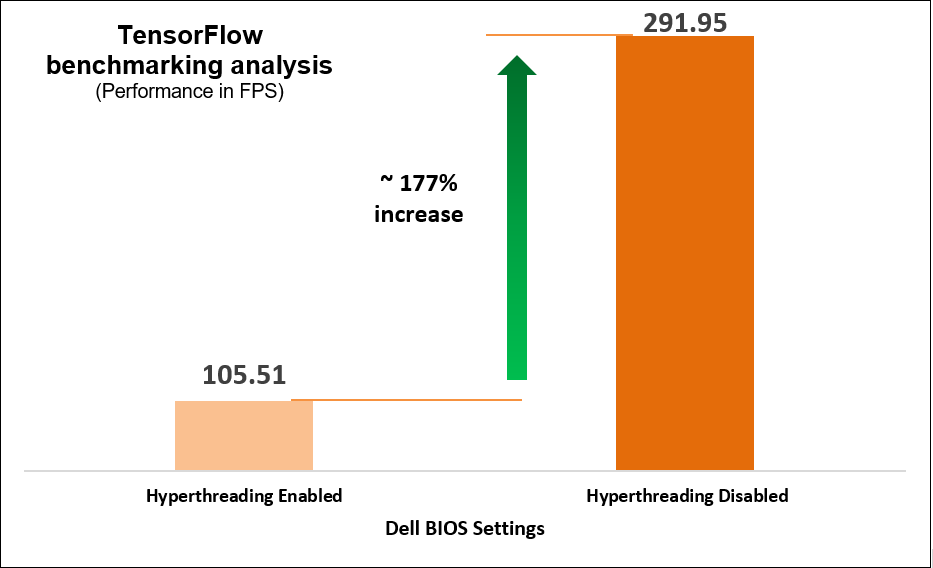
Figure 6. TensorFlow benchmarking results
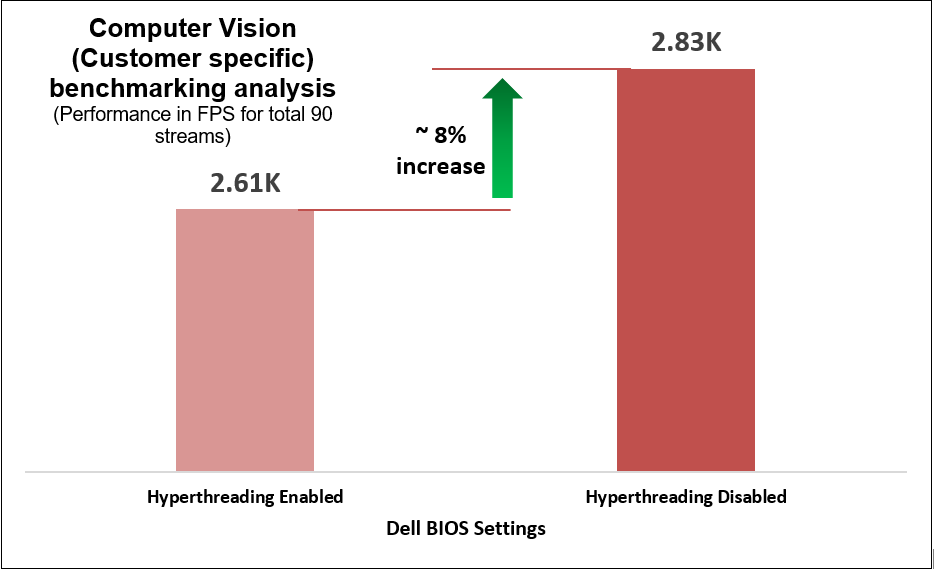
Figure 7. Customer-specific computer-vision-based workload benchmarking results
Identifying optimal System Profile
We began with selecting a baseline System Profile by analyzing the changes in performance and latency for the average power consumed when changing the System Profile from the default Performance per Watt (DAPC) to the Performance setting. The following graphs show the improvements in out-of-the-box performance after we tuned the System Profile.
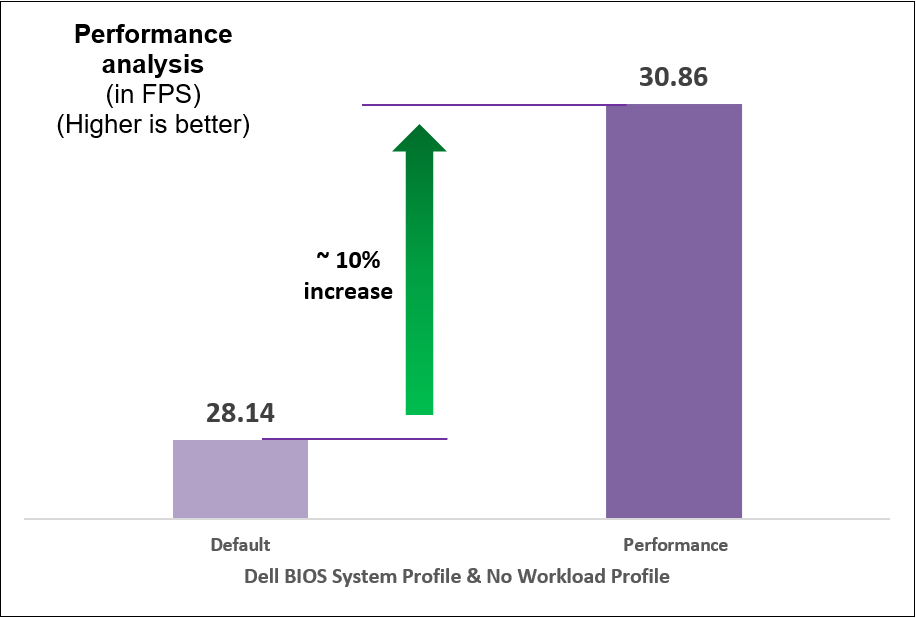
Figure 8. Comparison of default and Performance settings: Performance analysis
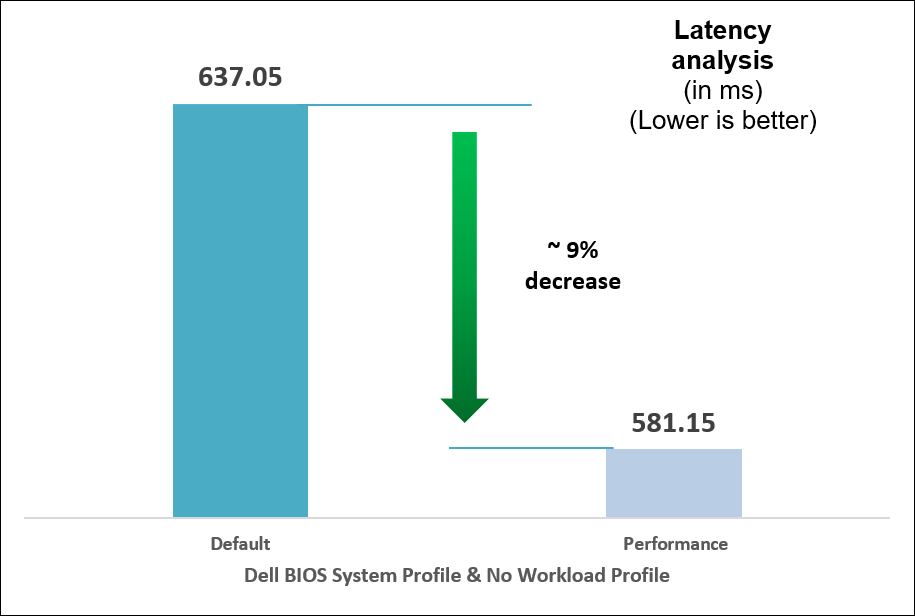
Figure 9. Comparison of default and Performance settings: Latency analysis
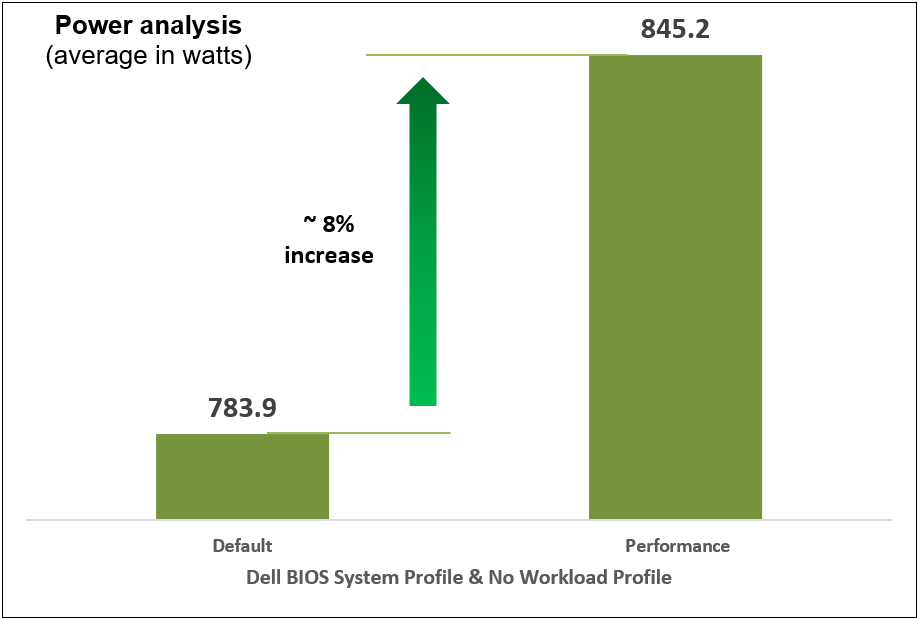
Figure 10. Comparison of default and Performance settings: Power analysis
Identifying optimal workload profile
We performed iterative testing on all current workload profile options on the PowerEdge R760 server for all three performance benchmarks. We found that the optimal, most efficient workload profile to run an AI inference workload is NFVI FP Energy-Balance Turbo Profile, based on improvements in metrics such as performance (throughput in FPS).
Why does this profile perform the best of the existing workload profiles?
The NFVI FP Energy-Balance Turbo Profile (Network Functions Virtualization Infrastructure with Float-Point) is a BIOS setting tailored for NFVI workloads that involve floating-point operations. Building upon the NFVI FP Optimized Turbo Profile, this profile optimizes the system's performance for NFVI tasks that require low-precision math operations, such as AI inference workloads. AI inference tasks often involve performing numerous calculations on large datasets, and some AI models can use lower-precision datatypes to achieve faster processing without sacrificing accuracy.
This profile leverages hardware capabilities to accelerate these low-precision math operations, resulting in improved speed and efficiency for AI inference workloads. With this profile setting, the NFVI platform can take full advantage of specialized instructions and hardware units that are optimized for handling low-precision datatypes, thereby boosting the performance of AI inference tasks. Additionally, the profile's emphasis on energy efficiency is also beneficial for AI inference workloads. Even though AI inference tasks can be computationally intensive, the use of lower-precision math operations consumes less power compared to higher-precision operations. The NFVI FP Energy-Balance Turbo Profile strikes a balance between maximizing performance and optimizing power consumption, making it particularly suitable for achieving energy-efficient NFVI deployments in data centers and cloud environments.
The following table shows the BIOS settings that we tested.
Table 1. BIOS settings for AI benchmarks
Setting | Default | Optimized |
System Profile | Performance Per Watt (DAPC) | Performance |
Workload Profile | No Configured | NFVI FP Energy-Balance Turbo Profile |
The following charts show the results of multiple iterative and exhaustive tests that we ran after tuning the BIOS settings.
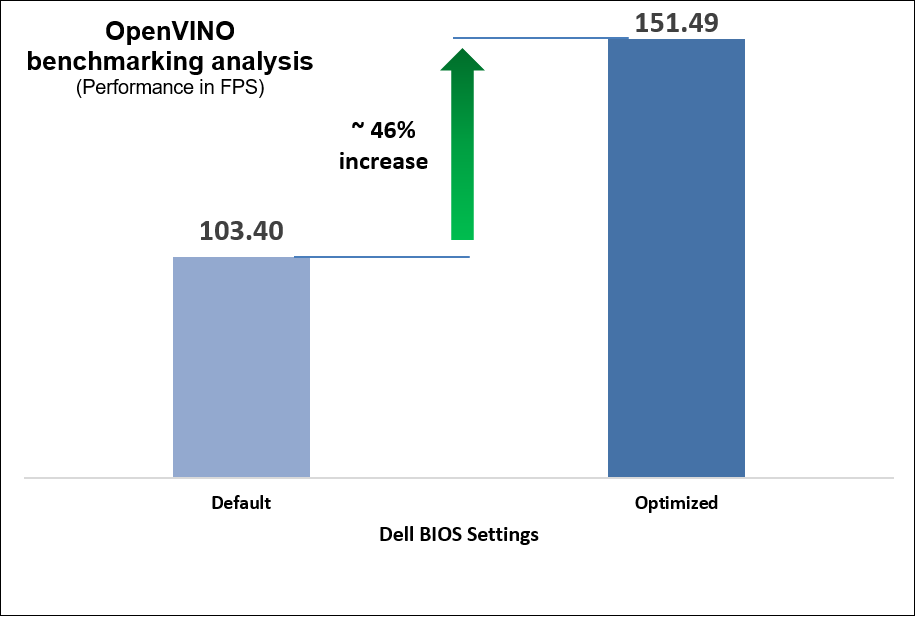
Figure 11. OpenVINO benchmark results
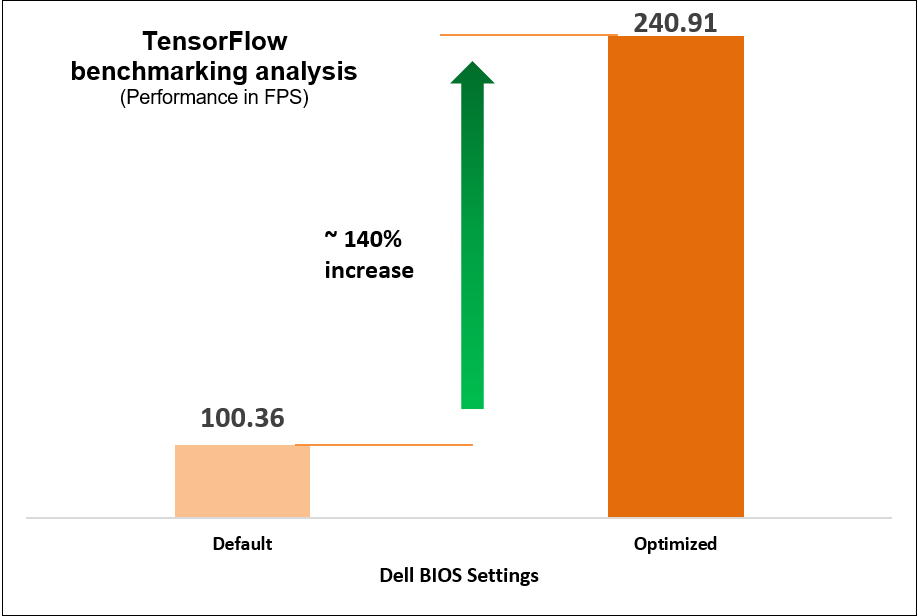
Figure 12. TensorFlow benchmark results
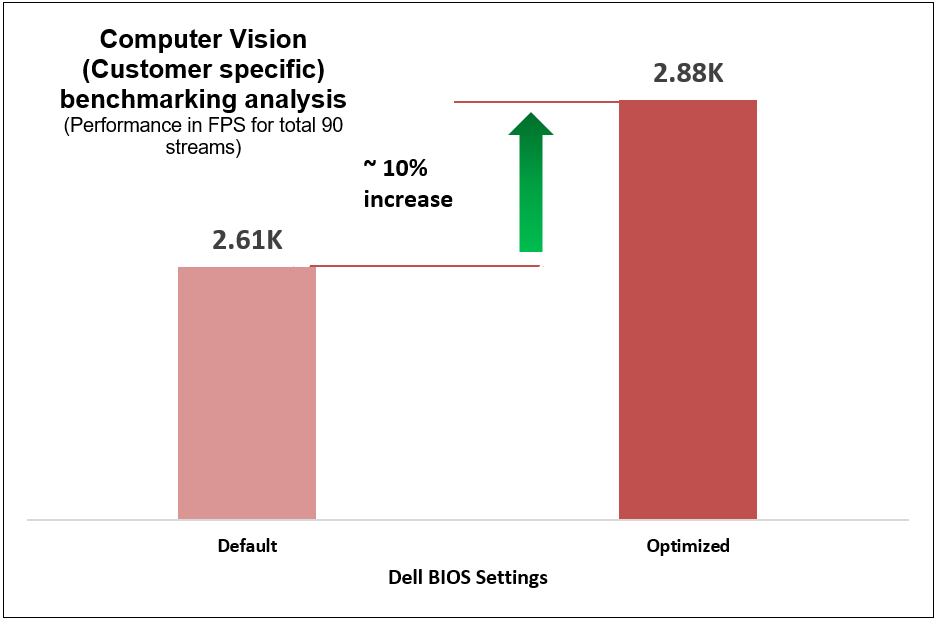
Figure 13. Computer-vision-based (customer-specific) workload benchmark results
These performance improvements reflect a significant impact on AI workload performance resulting from two simple configuration changes on the System Profile and Workload Profile BIOS settings, as compared to out-of-the-box performance.
Performance, latency, and power
We compared power consumption data with performance and latency data when changing the System Profile in the BIOS from the default Performance Per Watt (DAPC) setting to the Performance setting and using a moderate CPU utilization AI inference. Our results reflect that for an increase of up to 8% on average power consumed, the system displayed a 10% increase in performance and 9% decrease in latency with one simple BIOS setting change.
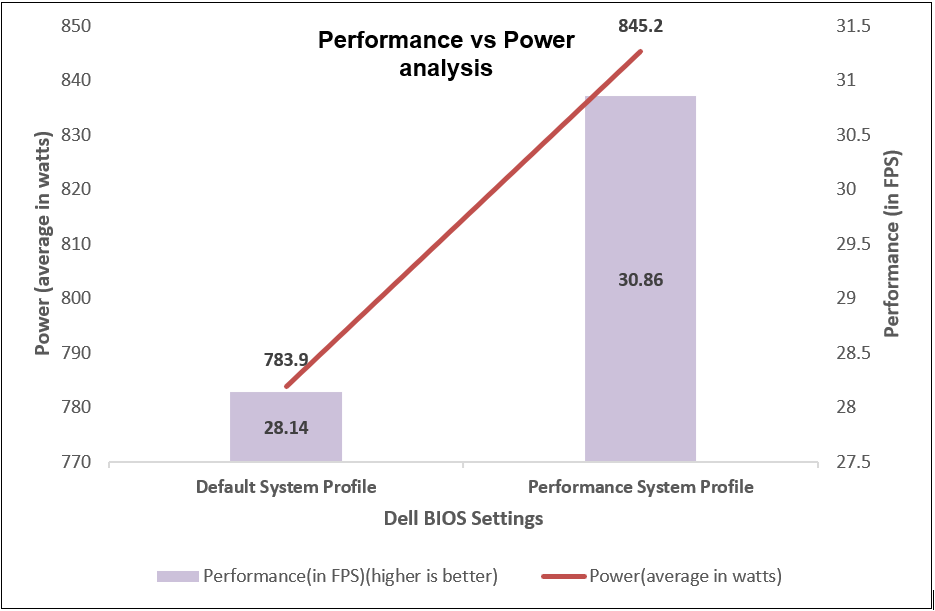
Figure 14. Comparing performance per average power consumed
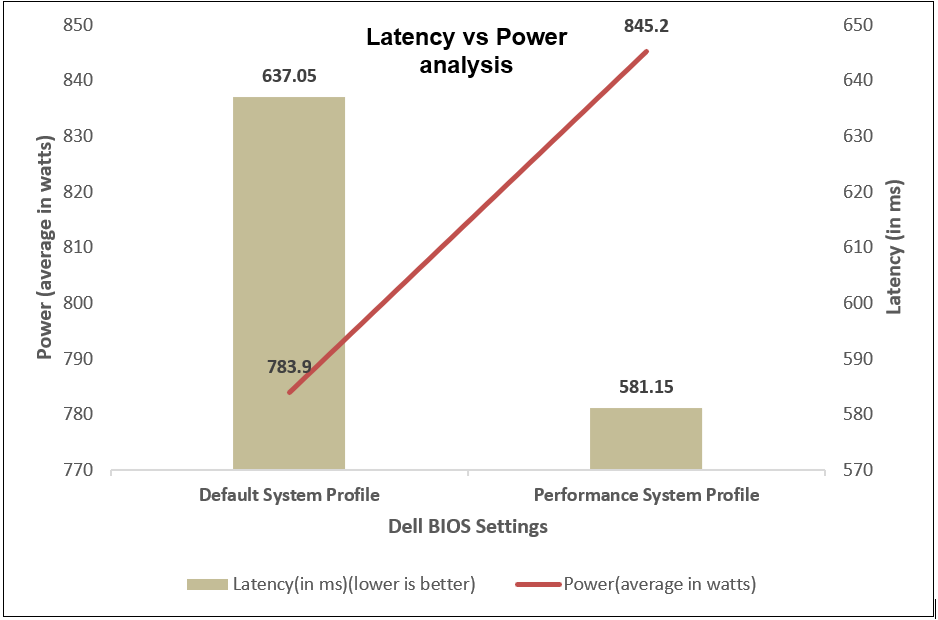
Figure 15. Comparing latency per average power consumed
Comprehensive details of benchmarks
We used the OpenVINO, TensorFlow, and computer-vision-based workload (Scalers AI) benchmarks and their specific use cases that measure the time spent on inference (excluding any preprocessing or post-processing) and then report on the inferences per second (or frames per second or millisecond).
What type of applications do these benchmarks support?
The benchmarks support multiple real-time AI applications such as person detection, vehicle detection, age and gender recognition, crowd counting, suspicious object recognition, parking spaces identification, traffic safety analysis, smart cities, and retail.
Table 2. OpenVINO test cases
Use case | Description |
Face detection | Measures the frames per second (FPS) and time taken (ms) for face detection using FP16 model on CPU |
Person detection
| Evaluates the performance of person detection using FP16 model on CPU in terms of FPS and time taken (ms) |
Vehicle detection | Assesses the CPU performance for vehicle detection using FP16 model, measured in FPS and time taken (ms) |
Person vehicle bike detection | Measures the performance of person vehicle bike detection on CPU using FP16-INT8 model, quantified in FPS and time taken (ms) |
Age and gender recognition | Evaluates the performance of age and gender detection on CPU using FP16 model, measured in FPS and time taken (ms) |
Machine translation | Assesses the CPU performance for machine translation from English using FP16 model, quantified in FPS and time taken |
Table 3. TensorFlow test cases
Use case | Description |
VGG-16 (Visual Geometry Group – 16 layers) | A deep convolutional neural network architecture with 16 layers, known for its uniform structure and use of 3x3 convolutional filters, achieving strong performance in image recognition tasks. This batch includes five different test cases of running the VGG-16 model on TensorFlow using a CPU, with various batch sizes ranging from 16 to 512. The images per second (images/sec) metric is used to measure the performance. |
AlexNet
| A pioneering convolutional neural network with five convolutional layers and three fully connected layers, instrumental in popularizing deep learning and inferencing. This batch includes five test cases of running the AlexNet model on TensorFlow using a CPU, with different batch sizes from 16 to 512. The images per second (images/sec) metric is used to assess the performance. |
GoogLeNet | An innovative CNN architecture using "Inception" modules with multiple filter sizes in parallel, reducing complexity while achieving high accuracy. This batch includes different test cases of running the GoogLeNet model on TensorFlow using a CPU, with varying batch sizes from 16 to 512. The images per second (images/sec) metric is used to evaluate the performance. |
ResNet-50 (Residual Network) | Part of the ResNet family, a deep CNN architecture featuring skip connections to tackle vanishing gradients, enabling training of very deep models. This batch consists of various test cases of running the ResNet-50 model on TensorFlow using a CPU, with different batch sizes ranging from 16 to 512. The images per second (images/sec) metric is used to measure the performance. |
Table 4. Computer-vision-based workload (Scalers AI) test case
Use case | Description |
Scalers AI | YOLOv4 Tiny from the Intel Model Zoo and computation was in int8 format. The tests were run using 90 vstreams in parallel, with a source video resolution of 1080p and a bit rate of 8624 kb/s. |
Conclusion
Using the PowerEdge server, we conducted iterative and exhaustive tests by fine-tuning BIOS settings against industry standard AI inferencing benchmarks to determine optimal BIOS settings that customers can configure with minimum efforts to maximize performance of AI workloads.
Our recommendations are:
 Disable Logical Processor for up to 177% increase in performance for high CPU utilization AI inference workloads.
 Select Performance as the System Profile BIOS setting to achieve up to 10% increase in performance.
 Select the NFVI FP Energy-Balance Turbo Profile BIOS setting to achieve up to 140 percent increase in performance for high CPU utilization workloads and 46% increase for moderate CPU utilization workload.
References
- Dell PowerEdge R760 with 4th Gen Intel Xeon Scalable Processors in AI
- Optimize Inference with Intel CPU Technology
Legal disclosures
Based on July 2023 Dell labs testing subjecting the PowerEdge R760 2x Intel Xeon Platinum 8452Y configuration with a 1.2.1 BIOS testing to AI inference benchmarks – OpenVINO and TensorFlow via the Phoronix Test Suite. Actual results will vary.

PowerEdge T560 Delivers Significant Performance Boost and Scalability
Thu, 24 Aug 2023 18:12:49 -0000
|Read Time: 0 minutes
Summary
Dell PowerEdge T560, with 4th Generation Intel® Xeon® Scalable Processors, boosts performance by up to 114% compared to the prior-gen T550 with 3rd Generation Intel® Xeon® Scalable Processors[1]. This document presents gen-over-gen CPU benchmarks for three common T560 CPU configurations, and highlights key features that enable enterprises to host a diverse set of workloads.
Advanced technology with accelerators
From retail, hospitality, and restaurants, to small healthcare, businesses continue to rely on tower servers to enable their day-to-day operations. IDC forecasts $2 billion in worldwide tower server spending for 2024.[2]
The Dell PowerEdge T560 exceeds these business needs while fitting where other servers cannot – under desks, in closets, tucked in any available space. It drives key enterprise workloads, including traditional business applications, virtualization, and data analytics. For customers looking to capture the advantages of AI, the T560 is also tuned to power medium duty AI or ML tailored inferencing algorithms that drive more timely and accurate business insights. In fact, the T560 has 20% more GPU capacity compared to prior-gen T550.
The table below details the gen-over-gen feature improvements that support the T560’s faster, more powerful, and balanced performance:
Table 1. PowerEdge T550 vs T560 key features
| Prior-Gen PowerEdge T550 | PowerEdge T560 |
CPU | 3rd Generation Intel Xeon Scalable Processors | 4th Generation Intel Xeon Scalable Processors |
GPU | Up to 2 DW or 5 SW GPUs | Up to 2 DW or 6 SW GPU |
Storage | Up to 8x3.5” Hot Plug SAS/SATA HDDs 120TB Storage Capacity | Up to 12x3.5” Hot Plug SAS/SATA HDDs 180TB Storage Capacity |
Memory | Up to 3200 MT/s DIMM Speed | Up to 4800 MT/S DIMM Speed |
PCIe Slots | PCIe Gen4 slots | PCIe Gen5 slots |
Performance data
We captured three benchmarks -- SPEC CPU, High-Performance Linpack (HPL), and STREAM -- to compare performance across three T550 3rd Generation Intel Xeon processors and two T560 4th Generation Intel Xeon processors. We report SPEC CPU’s fprate base metric which measures throughput in terms of work per unit of time. HPL is measured in Gflops, or floating-point operations per second, which assesses overall computational power. STREAM captures memory bandwidth in MB/s.
The tests were performed in the Dell Solutions Performance Analysis (SPA) Lab in March 2023. The following gen-over-gen comparisons represent common Intel CPU configurations for T550 and T560 customers, respectively:
Table 2. Selected CPUs for T550 vs T560 performance comparison
T550 CPU Config |
T560 CPU Config |
4309Y, 8 Cores, 2 Processors tested [16 Cores] | 4410Y, 12 Cores, 1 Processor tested |
4310, 12 Cores, 1 Processor tested | 4410Y, 12 Cores, 1 Processor tested |
4314, 16 Cores, 1 Processor tested | 5416S, 16 Cores, 1 Processor tested |
All tested T560 CPU configurations across both the SPEC CPU and HPL Benchmark demonstrate a greater than 47% performance uplift, gen over gen. Most notably, just one Intel Xeon 4410Y (12 core) processor in the T560 performed 114% better than two prior-gen 4309Y processors (16 cores total) in the T550. For these same processors, the HPL benchmark saw a performance uplift of 78%, and STREAM saw an uplift of up to 57%.
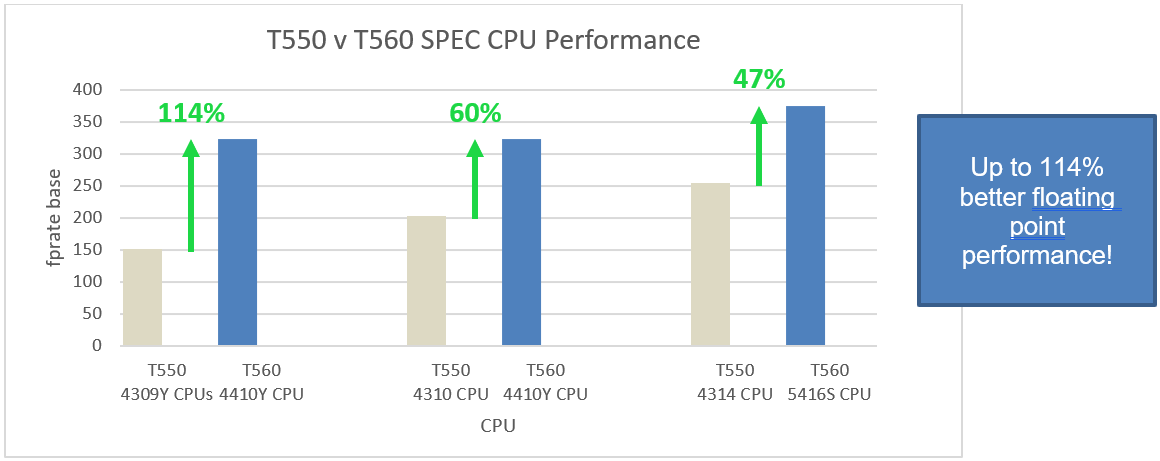
Figure 1. Three CPU comparisons demonstrating gen-over-gen performance uplift for SPEC CPU benchmark
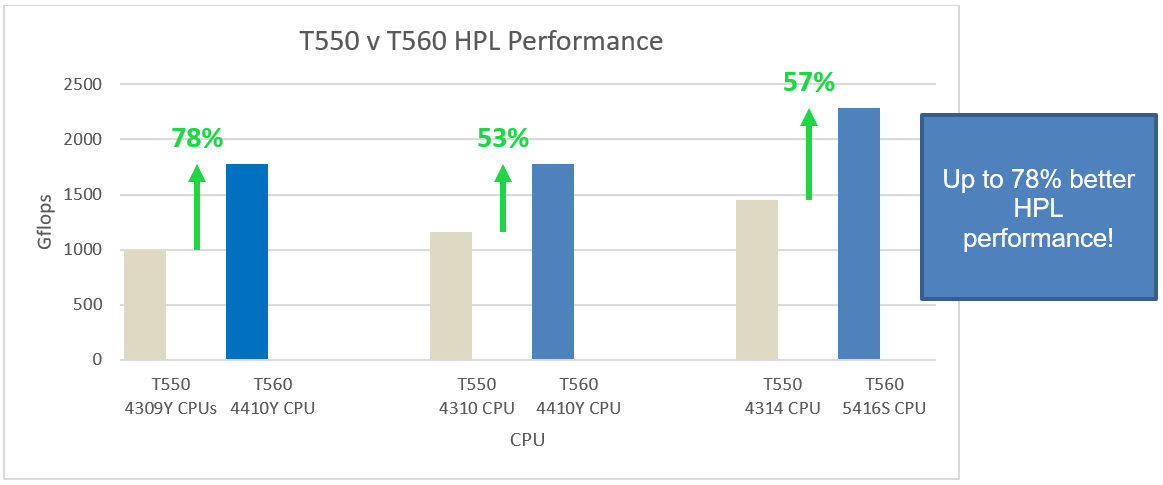
Figure 2. Three CPU comparisons demonstrating gen-over-gen performance uplift for HPL benchmark
Conclusion
For customers looking to upgrade their tower server, the Dell PowerEdge T560 captures up to 114% better performance over the prior-gen. Combined with its increased GPU capacity and 1.5x faster memory, the T560 gives enterprises the freedom to expand and explore AI/ML workloads while still powering its core business operations.
References
[1] March 2023, Dell Solutions Performance Analysis (SPA) lab test comparing 4309Y and 4410Y CPU on www.spec.org

Delivering Insights with Intel based PowerEdge Servers and Elasticsearch
Wed, 02 Aug 2023 17:23:31 -0000
|Read Time: 0 minutes
Elasticsearch with Dell PowerEdge
At the top of this page are links to three documents: two recommended configurations of Dell PowerEdge servers and one test results paper. All testing was conducted in Dell Labs by Intel and Dell engineers in April 2023:
- Powering your Elasticsearch Solution on Kubernetes with Dell PowerEdge Servers and Intel® 3rd Generation Xeon® Scalable Processors – Highlights the recommended configurations for Dell PowerEdge servers using 3rd Generation Intel Xeon processors
- Powering your Elasticsearch solution on Kubernetes with Dell PowerEdge Servers and Intel® 4th Generation Xeon® Scalable Processors – Highlights the recommended configurations for Dell PowerEdge servers using 4th Generation Intel Xeon processors
- Test Report: PowerEdge R760 with Elasticsearch – Describes the performance test results on both architectures, including comparisons of performance and power consumption
Solution overview
According to the DB-Engines ranking, Elasticsearch is the most popular enterprise search engine[1]. Wikipedia describes Elasticsearch as, “a search engine based on the Lucene library. It provides a distributed, multitenant-capable full-text search engine with an HTTP web interface and schema-free JSON documents. Elasticsearch is developed in Java and is dual-licensed under the source-available Server-Side Public License and the Elastic license[2], while other parts[3] fall under the proprietary (source-available) Elastic License. Official clients are available in Java, .NET (C#), PHP, Python, Ruby and many other languages.”
Implementations of Elasticsearch use the “Elastic Stack,” which consists of Elasticsearch, Kibana, Beats, and Logstash (previously known as the “ELK stack”)[4]. Each of these components is described below:
- Elasticsearch: RESTful, JSON-based search engine
- Logstash: Log ingestion pipeline
- Kibana: Flexible visualization tool
- Beats: Lightweight, single purpose data shippers
Figure 1. Elasticsearch architecture model
The benefits: Elasticsearch with Dell PowerEdge and Intel processors
Capital budget savings
As the testing document outlines, we compared the performance of two generations of platforms. To provide a meaningful comparison, we chose 40 core CPUs for each platform. For the R750, this meant the Intel Xeon Platinum 8380; for the R760, this meant the Intel Xeon Platinum 8460Y+. The result was a significant cost difference:
R750 - Intel Xeon Platinum 8380 - $9,359 - reviewed on June 6, 2023
R760 - Intel Xeon Platinum 8460Y+ - $5,558 – reviewed on June 6, 2023
Price Delta:

Sources:
8380: Intel Xeon Platinum 8380 Processor 60M Cache 2.30 GHz Product Specifications
8460Y: Intel Xeon Platinum 8460Y Processor 105M Cache 2.00 GHz Product Specifications
Note that while the R750 had the highest performing processor available in its generation, for even higher performance, R760 customers have the choice of moving up to the Intel Platinum 8480+ processor, which delivers 56 cores.
Operational budget savings
When measuring power, it is important to consider not just raw power consumption but more importantly, the amount of work that can be achieved per watt. In our tests we found that the R750 system averaged 829.57 watts of power consumption; the R760 required 963.23 watts. Although the R760 used more power, it also delivered significantly higher performance (24%). The end result was that the R760 delivered 7% more queries/watt than the R750.
Raw performance
As noted above, our tests showed a 24% increase in the number of documents per second that could be indexed.
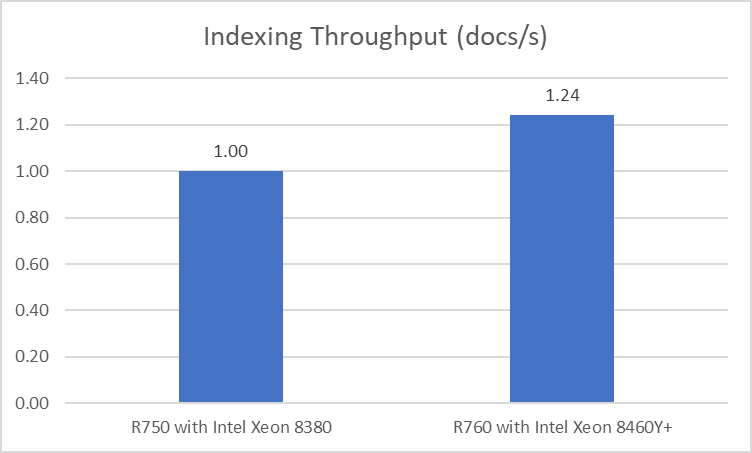
Reduced latency
In addition to higher performance, the R760 also provided the data 24% faster than the previous generation:
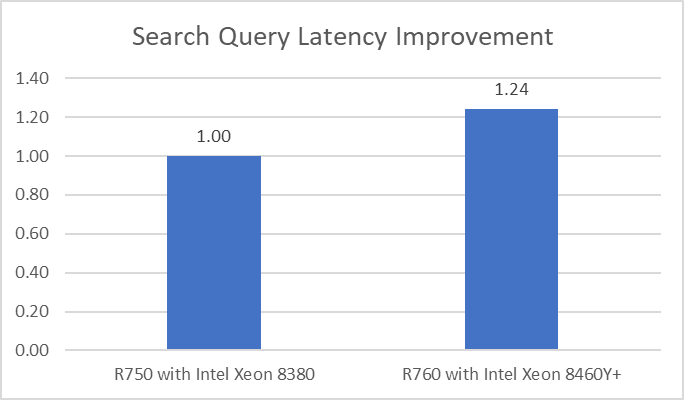
Raw data
We obtained the following raw data from our tests:
 Note: The same dataset was used for both tests, however, results may vary based on the size of the dataset being used and the types of logs being indexed.
Conclusion
Choosing the right combination of server and processor can increase performance, reduce latency, and reduce cost. As this testing demonstrated, the Dell PowerEdge R760 with 4th Generation Intel Xeon Platinum 8460Y CPUs was up to 1.24x faster than the Dell PowerEdge R750 with 3rd Generation Intel Xeon Platinum 8380 CPUs.
Importantly, the R760 was able to accomplish all of this using CPUs with a recommended Customer Price that was more than 40% less, thus reducing capital expense. The testing also showed that customers can reduce operating costs by implementing new technologies that can deliver more work per watt.
[1] https://db-engines.com/en/ranking/search+engine, as of June 6, 2023
[2] https://www.protocol.com/enterprise/about/aws-targeted-by-elastic, as of June 6, 2023
[3] No, Elastic X-Pack is not going to be open source - according to Elastic themselves - (flax.co.uk), as of June 6, 2023
[4] https://en.wikipedia.org/wiki/Elastic_NV, as of June 6, 2023

Test Report: PowerEdge R760 with Elasticsearch
Wed, 02 Aug 2023 17:04:20 -0000
|Read Time: 0 minutes
Summary
The introduction of new server technologies allows customers to use the new functionality to deploy solutions. It can also provide an opportunity for them to review their current infrastructure to see whether the new technology can increase efficiency. With this in mind, Dell Technologies recently conducted performance testing of an Elasticsearch solution on the new Dell PowerEdge R760 and compared the results to the same solution running on the previous generation R750 to determine whether customers could benefit from a transition. All testing was conducted in Dell Labs by Intel and Dell engineers in April 2023.
Choosing which CPU to deploy with an advanced solution like Elasticsearch can be challenging. A customer looking for maximum performance would typically start with the most expensive CPU available, while another customer might make a choice that offers a tradeoff between performance and price. For the purposes of this test, we decided to benchmark the new R760 with a lower cost processor so that we could compare the results to a previous generation R750 server using the top end Intel® Xeon® Platinum 8380 CPU.
Workload overview
An Elasticsearch solution includes multiple key components that combine into the “Elastic Stack”.
- Elasticsearch: RESTful, JSON-based search engine
- Logstash: Log ingestion pipeline
- Kibana: Flexible visualization tool
- Beats: Lightweight, single purpose data shippers
Methodology
To conduct the testing, we deployed Rally 2.7.1 as the benchmarking tool. Using an OpenShift Kubernetes cluster, each server was configured to create an Elasticsearch clus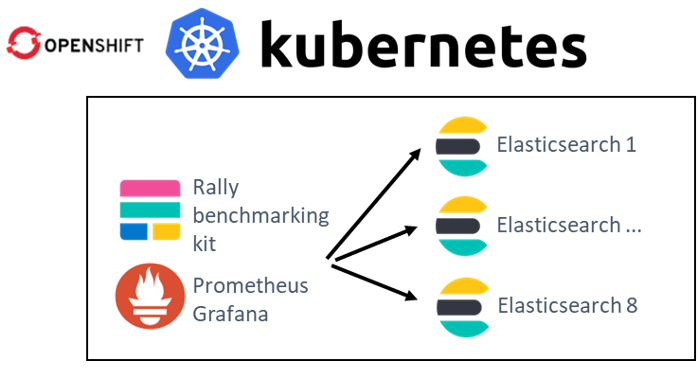 ter with eight instances (containers). Next, each system ran 10 cycles of searches to establish a “steady-state” flow of data as an indexing test. The performance of each system was measured by capturing the mean throughput of the bulk index (doc/s) and the search query latency (ms).
The benchmark simulated storing log files (application, http_logs, and system logs) and users who use Kibana to run analytics on this data. The test executes indexing and querying concurrently. Data replication was enabled, and software configuration was the same on both platforms.
The average CPU utilization during the test was 80%.
Dataset
Logging - server log data
The logging-indexing-querying workload generates multiple server logs before the test. The benchmark executes indexing and querying concurrently. Queries were issued until indexing was complete.
We used the following log types:
- Nginx access and error logs
- Apache access and error logs
- Mysql slowlog and error logs
- Kafka logs
- Redis app logs
- System syslog logs
- System auth logs
Who uses it? This data is typically produced by web services and could be used to validate HTTP responses, track web traffic, and monitor databases and system logs.
Hardware configurations tested
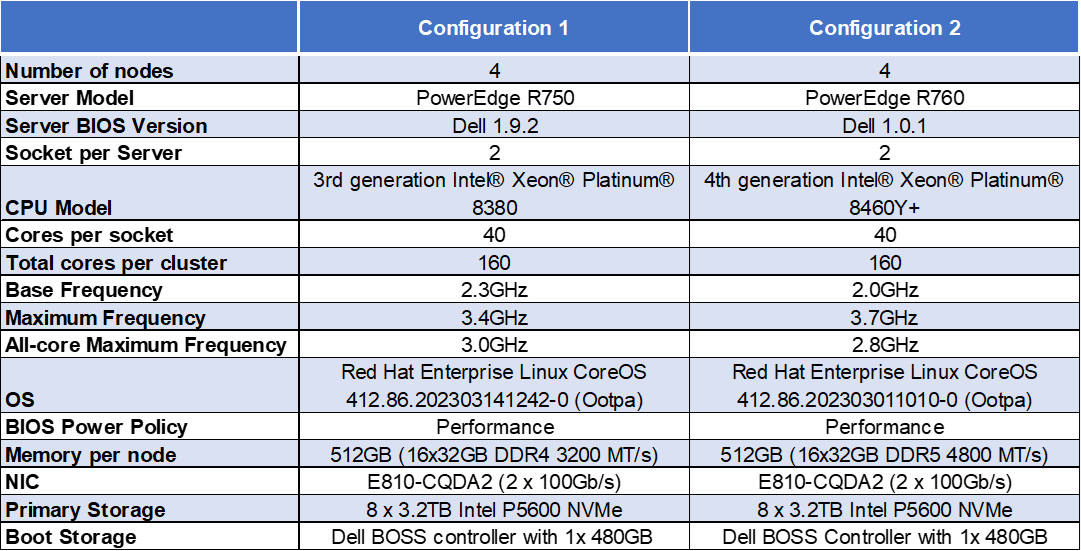
Note: The Dell Ent NVMe P5600 MU U.2 3.2TB Drives are manufactured by Solidigm.
Recommended customer pricing for the CPUs used in the tested configurations
- R750 - Intel Xeon Platinum 8380 - $9,359 - reviewed on June 6, 2023
- R760 - Intel Xeon Platinum 8460Y+ - $5,558 – reviewed on June 6, 2023
Price Delta:

Sources:
8380: Intel Xeon Platinum 8380 Processor 60M Cache 2.30 GHz Product Specifications
8460Y: Intel Xeon Platinum 8460Y Processor 105M Cache 2.00 GHz Product Specifications
Software configuration
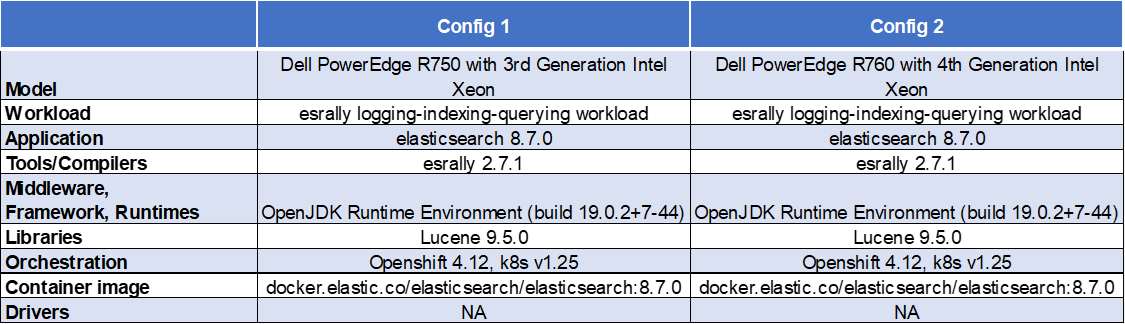
Test results
The following results represent the mean of 10 separate test runs.
Indexing Throughput (docs/s)
Indexing throughput indicates how many documents (log lines) that Elasticsearch can index per second.
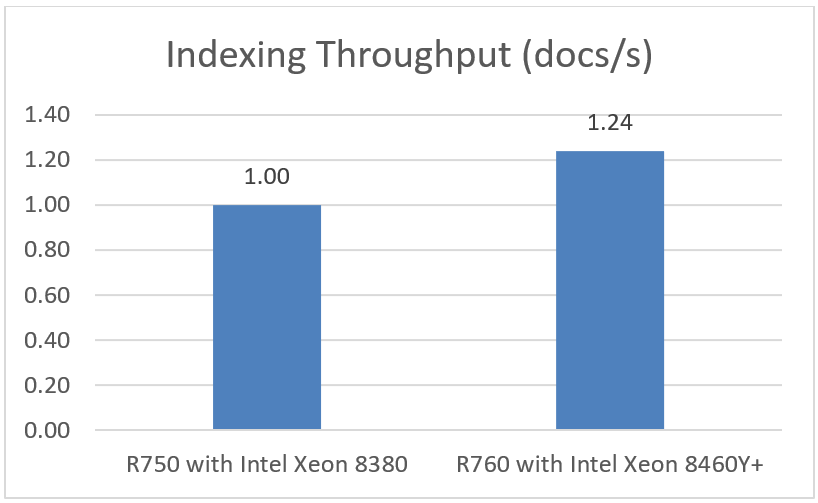
Note: Higher is better
Latency Improvement
Latency improvement indicates how much faster search query results return.
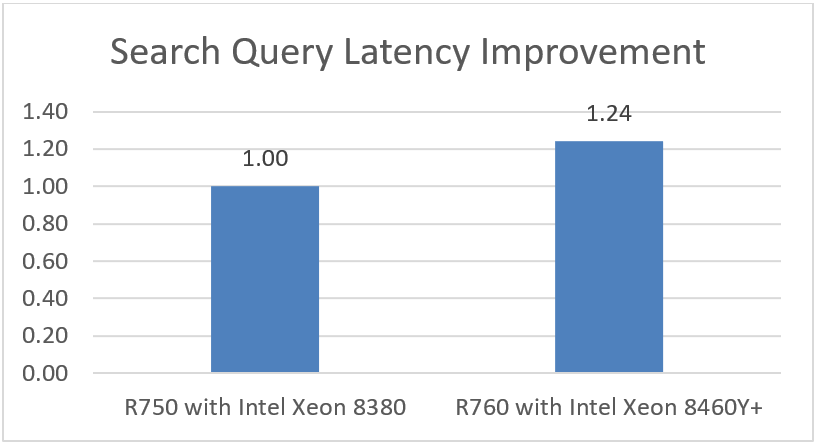
Note: Higher is better
Power consumption and calculations
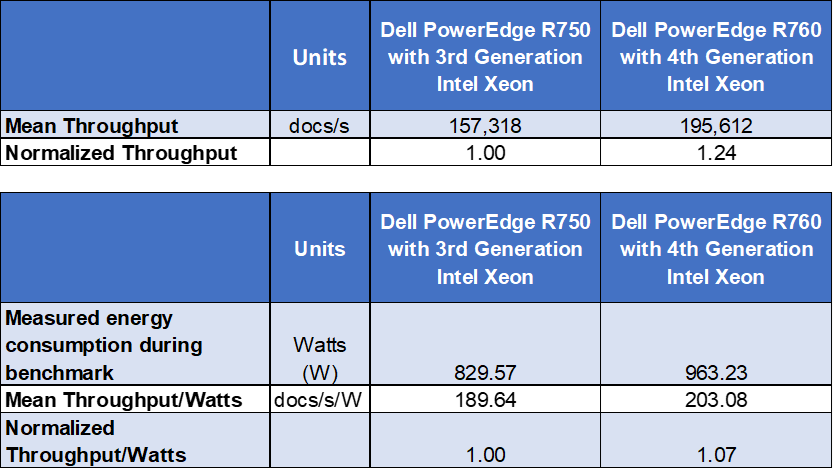
Conclusion
Choosing the right combination of server and processor can increase performance, reduce latency, and reduce cost. As this testing demonstrated, the Dell PowerEdge R760 with 4th Generation Intel Xeon Platinum 8460Y CPUs was up to 1.24x faster than the Dell PowerEdge R750 with 3rd Generation Intel Xeon Platinum 8380 CPUs.
An important element to consider is that the R760 was able to accomplish all of this using CPUs with a recommended customer price that was more than 40% less, thus reducing capital expense. The testing further demonstrated that customers can reduce operating costs by implementing new technologies that can deliver more work per watt.

Powering your Elasticsearch Solution with Dell PowerEdge Servers and Intel® 4th Generation Xeon® Processors
Wed, 02 Aug 2023 16:49:52 -0000
|Read Time: 0 minutes
Summary
This joint paper outlines a brief discussion on the key hardware considerations when configuring a successful deployment and recommends configurations based on Dell 16th Generation PowerEdge servers.
Elasticsearch is a distributed, open-source search and analytics engine for all types of data including textual, numerical, geospatial, structured, and unstructured. This proposal contains recommended configurations for Elasticsearch clusters on the Kubernetes platform (Red Hat OpenShift Container Platform with Elastic Cloud on Kubernetes (ECK) operator) running on 16th Generation Dell PowerEdge servers with 4th Generation Intel Xeon Scalable processors.
Key considerations
- Faster and scalable performance - Elasticsearch running on the latest Dell PowerEdge servers is built on high-performing Intel architecture and configured with 4th Generation Intel Xeon Scalable processors. Indexing is faster and capacity can scale with your needs.
- Better energy and data center space efficient - Running Elasticsearch on the latest generation of PowerEdge servers can save energy and power an even more effective search experience. Moving to the latest generation of PowerEdge servers based on Intel Xeon can help reduce emissions, protect our environment, and reduce operating costs.
- Reduced search times and increased number of concurrent searches - As data grows and needs to be accessed across the cluster, data-access response times are critical, especially for real-time analytics applications. Elasticsearch running on the latest PowerEdge servers is built on high-performing Intel architecture, including Intel Ethernet network controllers, adapters, and accessories to enable agility in the data center and support higher throughput with low latency response times.
- Index more data - Elasticsearch can handle and store more data by increasing DRAM capacity and using PCIe Gen 4 NVMe disk drives. PowerEdge R760 servers are ideally suited to this requirement with memory capacity of up to 8TB and storage expansion of up to 24 high performance NVMe drives.
- Easy and secure installation - The Elastic Cloud on Kubernetes (ECK) operator is an official Elasticsearch operator certified on the Red Hat OpenShift Container Platform, providing ease of deployment, management and operation of Elasticsearch, Kibana, APM Server, Beats, and Enterprise Search on OpenShift clusters. Elasticsearch clusters are secure by default (with enabled encryption and strong passwords).
- Multi Data Tiers - As data grows, costs do not also need to increase. With multiple tiers of data, you can extend capacity and drive storage costs down without performance loss. Each capacity layer can be scaled independently by using larger drives or mode nodes (or both), depending on your needs.
Available configurations
Elasticsearch cluster on Kubernetes (Red Hat OpenShift Kubernetes) platform | ||
| OpenShift Control Plane Master Nodes | Elasticsearch Master / Ingest / Hot tier data nodes |
Functions | OpenShift services, | Elasticsearch roles: |
Platform | Dell PowerEdge R760 chassis with up to 24x2.5” NVMe Direct Drives | |
CPU | 2 x Intel Xeon Gold 6430 processors | 2 x Intel Xeon Platinum 8460Y+ processors |
DRAM | 128GB (16x 8GB DDR5-4400) | 512 GB (16 x 32GB DDR5-4800) |
Boot Device | Dell BOSS-S2 with 2x 240GB or 2x 480GB M.2 SATA SSD (RAID1) | |
Storage adapter | Not needed for all-NVMe configurations | |
Storage (NVMe) | 1x 1.6TB Enterprise NVMe Mixed-Use AG Drive U.2 Gen4 | 2x (up to 24x) 3.2TB Enterprise NVMe Mixed-Use AG Drive U.2 Gen4 |
NIC | Intel E810-CQDA2 for OCP3 (dual-port 100GbE) | |
Learn more
Contact your Dell account team for a customized quote 1-877-289-3355.
Read the doc: What is Elasticsearch?
Read the doc: Data tiers | Elasticsearch Guide
Read the blog: Elastic Cloud on Kubernetes is now a Red Hat OpenShift Certified Operator

Powering your Elasticsearch Solution with Dell PowerEdge Servers and Intel® 3rd Generation Xeon® Processors
Wed, 02 Aug 2023 16:38:32 -0000
|Read Time: 0 minutes
Summary
This joint paper outlines a brief discussion on the key hardware considerations when configuring a successful deployment and recommends configurations based on Dell 15th Generation PowerEdge servers.
Elasticsearch is a distributed, open-source search and analytics engine for all types of data, including textual, numerical, geospatial, structured, and unstructured. This proposal contains recommended configurations for Elasticsearch clusters on the Kubernetes platform (Red Hat OpenShift Container Platform with the Elastic Cloud on Kubernetes (ECK) operator) running on 15th Generation Dell PowerEdge servers with 3rd Generation Intel Xeon Scalable processors.
Key considerations
- Faster and scalable performance - Elasticsearch running on Dell PowerEdge servers is built on high-performing Intel architecture and configured with 3rd Generation Intel Xeon Scalable processors. Indexing is faster and capacity can scale with your needs.
- Index more data - Elasticsearch can handle and store more data by increasing DRAM capacity and using PCIe Gen 4 NVMe disk drives. PowerEdge R650 and R750 servers are well suited to this requirement with memory capacity of up to 4TB and storage expansion of up to 10 high performance NVMe drives for the Control Plane and Master/Ingest and Hot tier nodes, as well as up to 12 high capacity SAS/SATA drives for the optional Cold Tier nodes.
- Reduced search times and increased # of concurrent searches - As data grows and needs to be accessed across the cluster, data-access response times are critical, especially for real-time analytics applications. Elasticsearch running on the latest Dell PowerEdge servers is built on a high-performing Intel architecture. Intel Ethernet network controllers, adapters, and accessories enable agility in the data center and support high throughput and low latency response times.
- Easy and secure installation - The Elastic Cloud on Kubernetes (ECK) operator is an official Elasticsearch operator certified on the Red Hat OpenShift Container Platform, providing ease of deployment, management, and operation of Elasticsearch, Kibana, APM Server, Beats, and Enterprise Search on OpenShift clusters. Elasticsearch clusters are secure by default (with enabled encryption and strong passwords).
- Multi data tiers - As data grows, costs do not also need to increase. With multiple tiers of data, you can extend capacity and drive storage costs down without performance loss. Each capacity layer can be scaled independently by using larger drives or mode nodes (or both), depending on your needs.
Available configurations
Elasticsearch cluster on Kubernetes (Red Hat OpenShift Kubernetes) platform | ||||
Required | Optional | |||
| OpenShift Control Plane Master Nodes | Elasticsearch Master / Ingest / Hot tier data nodes | Elasticsearch Warm tier data nodes (optional) | Elasticsearch Cold tier data nodes |
Functions | OpenShift services, Kubernetes services | Elasticsearch roles: master, ingest, hot tier data. Additional services, ex: Kibana | Elasticsearch roles: warm tier data | Elasticsearch roles: cold tier data |
Platform | Dell PowerEdge R650 chassis with up to 10x2.5” NVMe Direct Drives | Dell PowerEdge R750 chassis with up to 12x3.5” HDD with RAID | ||
CPU | 2 x Intel Xeon Gold 6326 processors (16cores @ 2.9GHz) or better | 2 x Intel Xeon Platinum 8380 processors (40cores @ 2.3GHz) | 2 x Intel Xeon Gold 5318Y processors (24cores @ 2.1GHz) | 2 x Intel Xeon Gold 5318N processors (24cores @ 2.1GHz) |
DRAM | 128GB (16x 8GB DDR4-3200) | 256 GB (16 x 16 GB DDR4-3200) | 128 GB (16 x 8 GB DDR4-3200) | |
Boot Device | Dell BOSS-S2 with 2x 240GB or 2x 480GB M.2 SATA SSD (RAID1) | |||
Storage | Not needed for all-NVMe configurations | Dell PERC H755 SAS/SATA RAID adapter | ||
Storage (NVMe) | 1x 1.6TB Enterprise NVMe Mixed-Use AG Drive U.2 Gen4 | 2x (up to 10x) 3.2TB Enterprise NVMe Mixed-Use AG Drive U.2 Gen4 | 10x 7.68TB Enterprise NVMe Read-Intensive AG Drive U.2 Gen4 | up to 12x 16TB / 18TB / 20TB 12Gbps SAS ISE 3.5” HDD, 7200RPM |
NIC | Intel E810-XXVDA2 for OCP3 (dual-port 25GbE) | |||
Learn more
Contact your Dell account team for a customized quote 1-877-289-3355.
Read the doc: What is Elasticsearch?
Read the doc: Data tiers | Elasticsearch Guide
Read the blog: Elastic Cloud on Kubernetes is now a Red Hat OpenShift Certified Operator

Testing of performance and VDI user density of PowerEdge R750 vs. PowerEdge R760 with Intel Xeon Platinum CPUs
Fri, 20 Oct 2023 11:06:47 -0000
|Read Time: 0 minutes
Summary
The new Dell PowerEdge R760 with 4th Generation Intel® Xeon® processors offers customers the increased scalability and performance necessary to improve operation of their virtual desktop infrastructure (VDI). The testing highlighted in this document was conducted in Dell Labs by Intel Engineers in December 2022 to provide customers with insights on the capabilities of these new systems and to quantify the value that the systems can provide in a VDI environment. Performance was measured on a previous-generation Dell PowerEdge R750 system and then compared to the results measured on the new Dell PowerEdge R760. Each cluster was configured with four identically configured systems. In this test, the R750 server used the 40-core Intel Xeon Platinum 8380 CPU, while the R760 used the 44-core Intel Xeon Platinum 8458P CPU. There is a correlation between cores and memory, which drove the R760 configuration to use 2 TB of RAM compared to the 1.5 TB of RAM used in the R750.
Login VSI VDI test tool
Login VSI by Login Consultants is the industry-standard tool for testing VDI environments and server-based computing (RDSH environments). It installs a standard collection of desktop application software (for example, Microsoft Office, Adobe Acrobat Reader) on each VDI desktop; it then uses launcher systems to connect a specified number of users to available desktops within the environment. Once a user is connected, a login script configures the user environment and starts the test script and workload. Each launcher system can launch connections to several ”target” machines (VDI desktops).
For Login VSI, the launchers and Login VSI environment are configured and managed by a centralized management console. Additionally, the following login and boot paradigm was used:
- Users were logged in within a login timeframe of 1 hour.
- All desktops were booted before logins were commenced.
- Data collection interval used was 1 minute.
Test configuration
The following table describes the hardware and software components of the infrastructure used for performance analysis and characterization test:
Table 1. Hardware and software components
Component | Compute host hardware and software | |
Server | PowerEdge R750 | PowerEdge R760 |
CPU | 2 x Intel Xeon Platinum 8380 CPU @ 2.30 GHz, 40-core processors | 2 x Intel Xeon Platinum 8458P @ 2.7 GHz, 44‑core processors |
Memory | 1,024 GB memory @ 3,200 MT/s (16 x 32 GB + 16 x 64 GB DDR4) | 2,048 TB memory @ 4,800 MT/s1 (16 x 128 GB DDR5) |
Network card | Intel E810-CQDA2 (2 x 100 Gbps) | Intel E810-CQDA2 (2 x 100 Gbps) |
Storage | VMware vSAN 8.0 (with OSA architecture) 2 x P5800X 400 GB (caching tier) and 6 x P5510 3.2 TB (capacity tier) | VMware vSAN 8.0 (with OSA architecture) 2 x P5800X 400 GB (caching tier) and 6 x P5510 3.2 TB (capacity tier) |
Network switch | S5248-ON Switch | |
Broker agent | VMware Horizon 8.7 | |
Hypervisor | vSphere ESXi 8.0.0 | |
Desktop operating system | Microsoft Windows 10 Enterprise 64-Bit, 22h2 version | |
Office | Office 365 | |
Profile management | FSLogix | |
Login VSI | Login VSI 4.1.40.1 | |
Anti-virus | Windows Defender | |
1 The memory used was rated at 4,800 MT/s when deployed with one DIMM per channel but will operate at 4,400 MT/s when configured with two DIMMs per channel. | ||
Profiles and workloads
For the purposes of this test, the following workload and profiles were used:
Table 2. Workload and profiles
Workload | VM profiles | ||||
vCPUs | RAM | RAM reserved | Desktop video resolution | Operating system | |
Knowledge Worker
| 2 | 4 GB | 2 GB | 1920 x 1080 | Windows 10 Enterprise 64-bit |
Dell PowerEdge R750 and Dell PowerEdge R760 comparison results
The following table summarizes the test results:
Table 3. Test results
Workload | Density per host |
PowerEdge R750 | 307 |
PowerEdge R760 | 358 |
Conclusion
In our testing, the R760 delivered over 16.6 percent more VDI users (358 compared with 307) while performing at the same average CPU utilization level.

Boost Existing Server Performance by 12%
Thu, 08 Jun 2023 23:15:15 -0000
|Read Time: 0 minutes
Intel® Speed Select Technology (Intel® SST) Performance Profiles can offer enhanced performance, reduced power, and flexibility
Executive Summary
In data center environments, workload performance and efficiency on a per-node basis is key to business operations. Extracting the maximum performance for a given workload on each server is essential.
What if there was a way to do more with what you already have?
This Direct from Development tech note describes how we lab-tested and explored the real-world benefits of Intel® Speed Select Technology Performance Profiles (Intel® SST-PP) on 4th Generation Intel® Xeon® Scalable processors running on Dell PowerEdge servers. Intel SST-PP has been available on Intel Xeon CPUs since 3rd Generation Xeon products came to market in 2021. On Dell PowerEdge servers with supported CPUs, SST-PP allows the enablement of Performance Profiles (Also called Operation Points), which reduces the number of active cores while increasing the frequency of cores still active.
As a result, you can match the CPU to your specific workload and so allocate performance as needed, meaning that you are reducing complexity in your data center and lowering cost.
The following chart shows the SST-PP available for the Intel Xeon Gold 5418Y Processor we tested, with Performance Profile 0 being the default mode:
Xeon Gold 5418Y | Core count | Frequency | Thermal design power (TDP) |
SST-PP 0 | 24 cores | 2.0 GHz | 185 W |
SST-PP 1 | 16 cores | 2.3 GHz | 165 W |
SST-PP 2 | 12 Cores | 2.7 GHz | 165 W |
Test Results
Different workloads respond differently to available resources or changes in configuration. In the arena of CPU configurations, some workloads demonstrate a greater affinity for higher frequency while others respond to an increase in the number of available CPU cores. In this instance, the tested SQL database workload performed optimally using SST-PP 1. This Performance Profile increases each core’s frequency by 300 MHz while reducing the number of available cores by eight.
The following chart illustrates a performance gain greater than 12 percent, which was attained by simply switching to a different SST-PP in the system BIOS.
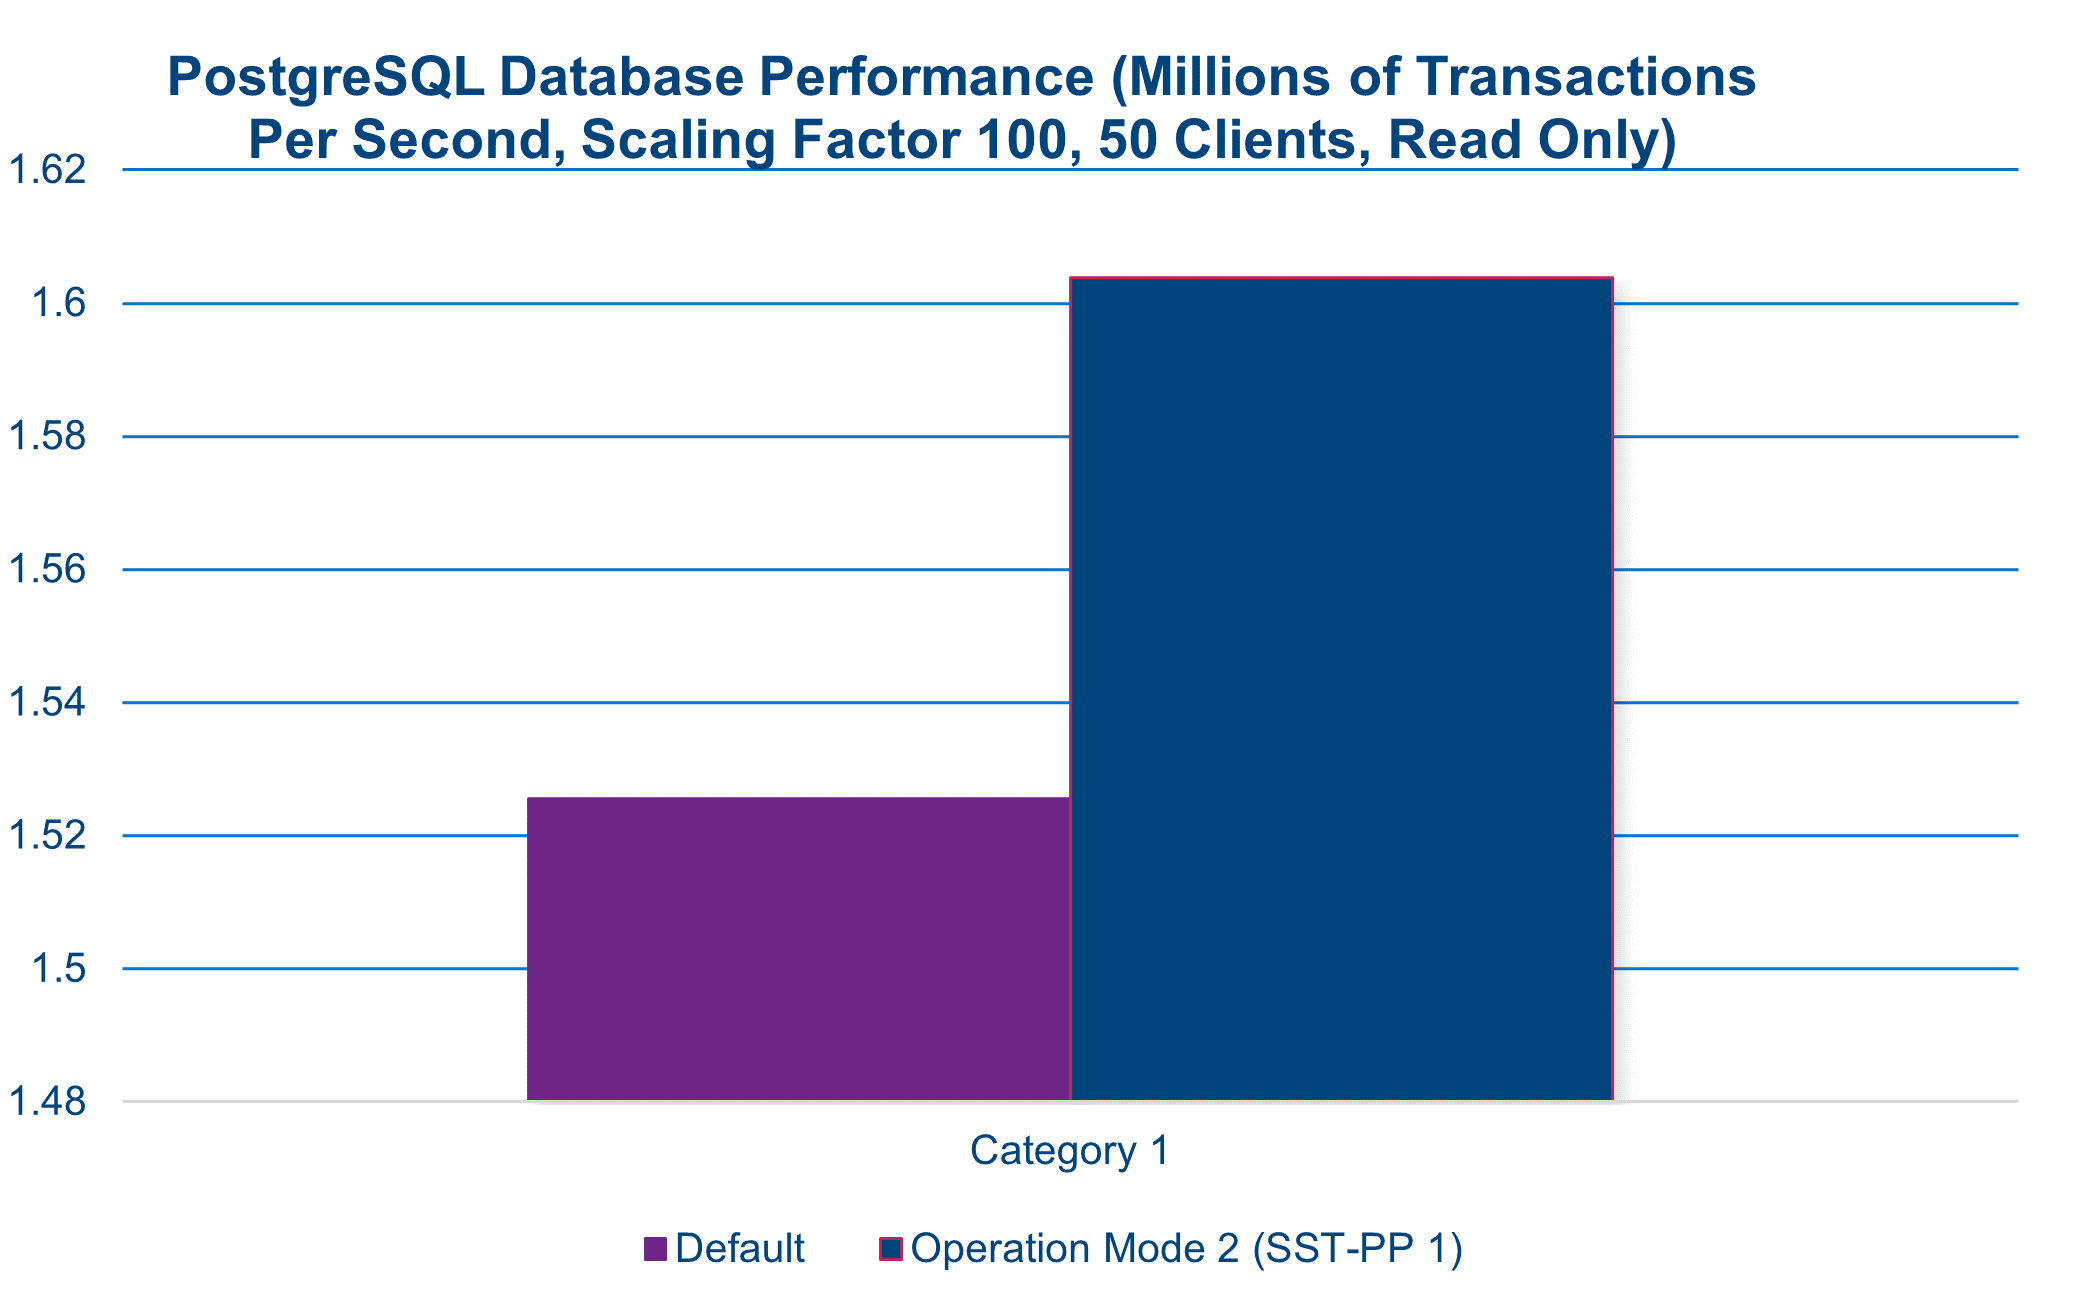
A performance increase is often associated with a commensurate increase in power draw. However, in this instance when leveraging SST-PP, this is not the case. During this benchmark test, we see a nearly 5 percent reduction in total system power while enjoying an increase in performance of approximately 12 percent.
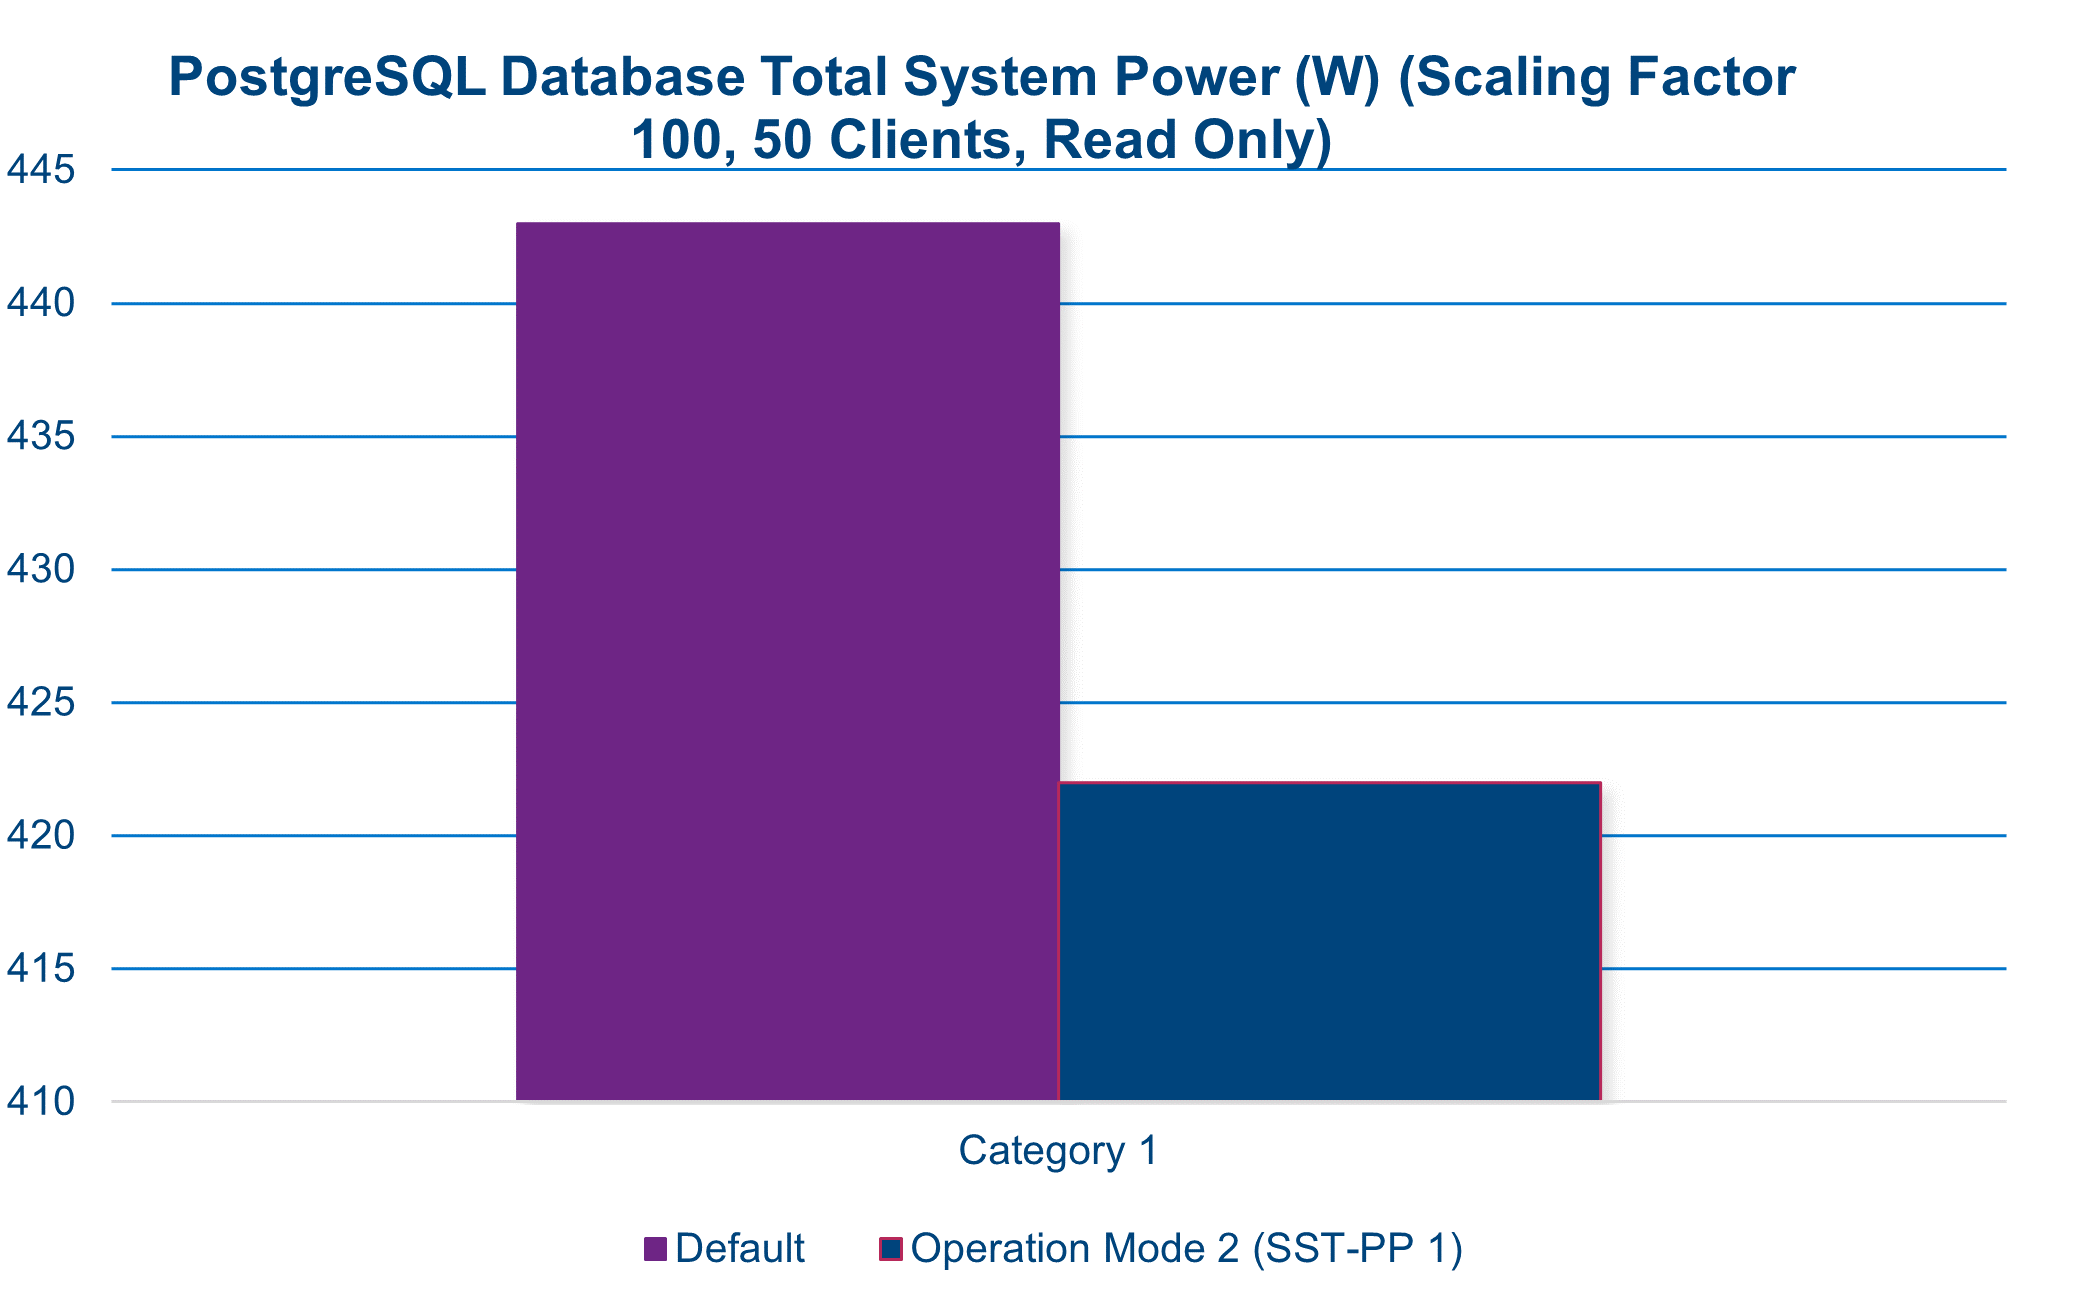

12% performance increase in SQL database workload(1)

Increase of 18% in performance per watt in SQL database workload (2)
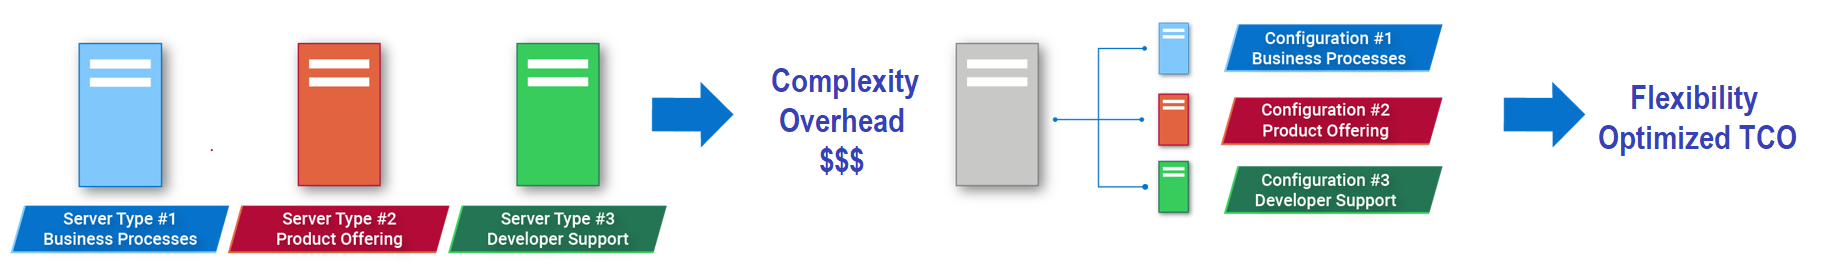
Conclusion
Intel SST-PP can enable increased performance and create per-node flexibility in workload specialization, allowing for a dynamic array of servers that can be allocated optimally for any task.
SST-PP technology is available on all servers in Dell’s mainstream server portfolio. It is also available in CSP and Edge focused servers when they are paired with processors featuring SST-PP. Listed here are Xeon 4th Gen processors featuring SST-PP technology. For more information, see the Intel Arc Product Specifications website.
Xeon 4th Gen processors with SST-PP
Intel® Xeon® Gold 6454S Processor | Intel® Xeon® Gold 6448Y Processor |
Intel® Xeon® Platinum 8460Y+ Processor | Intel® Xeon® Gold 6444Y Processor |
Intel® Xeon® Platinum 8468V Processor | Intel® Xeon® Gold 6458Q Processor |
Intel® Xeon® Platinum 8461V Processor | Intel® Xeon® Silver 4410T Processor |
Intel® Xeon® Platinum 8458P Processor | Intel® Xeon® Gold 6416H Processor |
Intel® Xeon® Platinum 8471N Processor | Intel® Xeon® Gold 6418H Processor |
Intel® Xeon® Platinum 8470N Processor | Intel® Xeon® Gold 6448H Processor |
Intel® Xeon® Platinum 8450H Processor | Intel® Xeon® Gold 5418N Processor |
Intel® Xeon® Platinum 8452Y Processor | Intel® Xeon® Gold 5411N Processor |
Intel® Xeon® Silver 4410Y Processor | Intel® Xeon® Gold 6428N Processor |
Intel® Xeon® Gold 6426Y Processor | Intel® Xeon® Gold 6421N Processor |
Intel® Xeon® Gold 5418Y Processor | Intel® Xeon® Gold 5416S Processor |
Intel® Xeon® Gold 6442Y Processor | Intel® Xeon® Gold 6438N Processor |
Intel® Xeon® Gold 6438Y+ Processor | Intel® Xeon® Gold 6438M Processor |
Intel® Xeon® Platinum 8462Y+ Processor |
Legal Disclosures
- Based on March 2023 Dell labs testing subjecting the PowerEdge HS5610 to Openbenchmarking.org PostgreSQL pgbench v1.130 benchmark. Actual results will vary.
- Based on March 2023 Dell labs testing subjecting the PowerEdge HS5610 to Openbenchmarking.org PostgreSQL pgbench v1.130 benchmark. Power collection performed with IPMItool. Actual results will vary.

IT Modernization with next-generation Dell PowerEdge Servers and 4th generation Intel® Xeon® Processors
Thu, 03 Aug 2023 22:50:03 -0000
|Read Time: 0 minutes
When transitioning to a new Server Technology, customers must weigh the cost of the solution against the benefits it can provide. A “solution” requires a combination of Hardware, Operating Environment, and Software. To gain maximum benefit from new technologies, it is important to consider all of them when making a decision. One of the biggest challenges this creates is that all three elements rarely emerge simultaneously, and customers can find themselves hindered by past choices.
A real-world example would be a Dell, Intel, and VMware customer planning to upgrade their existing infrastructure.
As the article below notes, vSAN 8.0 with Express Storage Architecture (ESA) represents “A revolutionary release that will deliver performance and efficiency enhancements to meet customers’ business needs of today and tomorrow!” “vSAN ESA will unlock the capabilities of modern hardware by adding optimization for high-performance, NVMe-based TLC flash devices with vSAN, building off vSAN’s Original Storage Architecture (vSAN OSA). vSAN was initially designed to deliver highly performant storage with SATA or SAS devices, the most common storage media at the time. vSAN 8 will give our customers the freedom of choice to decide which of the two existing architectures (vSAN OSA or vSAN ESA) to leverage to best suit their needs.”
The introduction of the next-generation PowerEdge Servers, such as the PowerEdge R760, brings exciting opportunities for customers to enhance their current and future workloads by utilizing the latest vSAN storage architecture. To fully leverage the performance benefits of this new storage architecture, customers can take advantage of the VMware certified hardware configurations for vSAN ESA on Dell vSAN Ready Nodes.
It's important to note that VMware vSAN ESA requires a different set of drives compared to the OSA hardware. With the release of vSAN 8.0, customers are faced with a decision. They likely have an existing infrastructure based on the vSAN OSA architecture running on vSAN 7.0U3. Now, they need to consider the advantages and disadvantages of sticking with the OSA architecture or upgrading to new hardware to unleash the performance of new ESA architecture. The ESA architecture serves as an optional and alternative storage architecture for vSAN software and hardware, offering customers a familiar yet upgraded solution. This choice allows customers to tailor their storage architecture to meet their specific needs and preferences.
There are links at the top of this page detailing recent testing by Intel and Dell on the PowerEdge R760 with vSAN. All tests were conducted using VMware’s HCIBench tool, which VMware describes as “an automation wrapper around the popular and proven open-source benchmark tools: Vdbench and FIO that make it easier to automate testing across an HCI cluster.”
All 4th generation Intel® Xeon® testing was conducted in Dell Labs by Engineers from Intel supported by Engineers from Dell. All testing on 1st generation Intel® Xeon® and 2nd generation Intel® Xeon® was conducted in Intel Labs by Engineers from Intel. The two tests were conducted between November 2022 and March 2023. Solidigm provided all NVMe drives used in these tests.
R760 vSAN 8.0 OSA vs. R640 vSAN 7.0U3 OSA
In the first paper, we configured HCIBench for Vdbench. We compared the performance of a 4 node cluster of PowerEdge R760’s with 4th generation Intel® Xeon® Platinum Processors using vSAN 8.0 (OSA) to a 4 node cluster of PowerEdge R640’s with 1st generation Intel® Xeon® Platinum Processors and a 4 node cluster of PowerEdge R640’s with 2nd generation Intel® Xeon® Platinum Processors with both configurations using vSAN7.0U3. All configurations used an “all flash” storage configuration using components certified and available for that server. The 14th Generation Dell servers were also configured with 2x10Gb/s Networking cards, which were common then. The R760 systems are the first generation of Dell Servers with the PCIe bandwidth necessary to support the OCP 3.0 2x100Gb/s Ethernet Networking cards used in the test. The Intel network cards that were chosen for the R760 also support ROCE v.2 (RDMA Over Converged Ethernet), which was enabled for this test. ROCE v.2 was not available in the NICs used in the prior generation servers. The R640 delivers comparable performance to the R740 and was chosen only for hardware availability reasons.
R760 vSAN 8.0 ESA vs. R640 vSAN 7.0U3 OSA
In the second paper, we configured HCIBench for FIO. We compared the performance of a 4 node cluster of PowerEdge R760’s with 4th generation Intel® Xeon® Platinum Processors using vSAN 8.0 (ESA) to a 4 node cluster of PowerEdge R640’s with 1st generation Intel® Xeon® Platinum Processors and a 4 node cluster of PowerEdge R640’s with 2nd generation Intel® Xeon® Platinum Processors both configurations using vSAN7.0U3. The R640 delivers comparable performance to the R740 and was chosen only for hardware availability reasons.
Vdbench and FIO test throughput (reported in IOPS) and storage latency (reported in milliseconds), but the results are not directly comparable. What is comparable are the ratios of performance gain. After conducting the initial testing with Vdbench to create a baseline, the team moved to FIO for the greater control it provides over tuning parameters. While this would affect performance, it would not be expected to affect the ratios because all systems in each test used a consistent approach for that test.
The 4th generation Intel® Xeon® processors used in these two tests were different. In the first set of tests, the 3rd generation Intel® Xeon® Platinum 8458 PP was used, while in the second test, the 4th generation Intel® Xeon® 8460Y+ was used. This was due to hardware constraints at the time of the test but is not expected to affect performance dramatically. This observation is offered based on the following key differences:
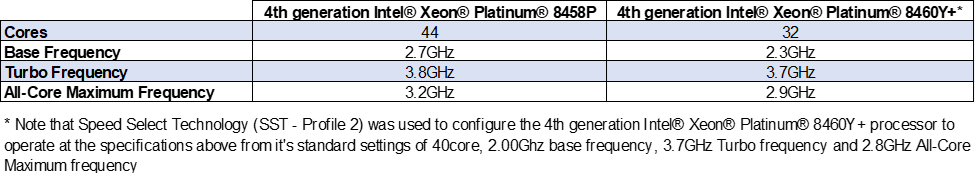
Test 1 Results
Vdbench Test Parameters: 8 K block size, 70% reads, 100% random.
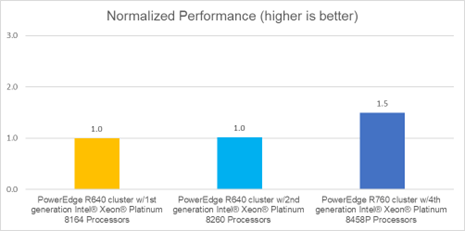
Measured in IO per second (IOPS)
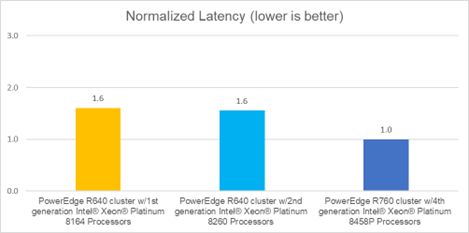 Measured in milliseconds
As these graphs show, vSAN performance in an OSA environment using the new R760 with 4th generation Intel® Xeon® Platinum Processors is up to 1.5x* faster than the two previous generations with up to 1.6x lower latency*. These performance increases were likely driven by the increase in network performance (100 Gb/s Ethernet vs. 10 Gb/s Ethernet). And the generational performance improvements of processors and the underlying NVMe drives benefit from the higher PCIe throughput available in the R760.
Test 2 Results
FIO Test Parameters: 8 K block size, 70% reads, 100% random.
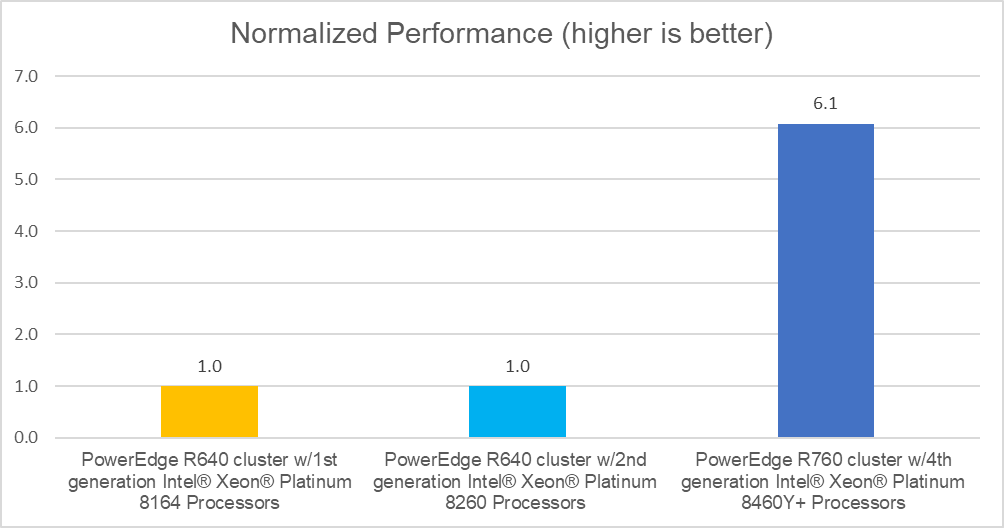
Measured in IO per second (IOPS)
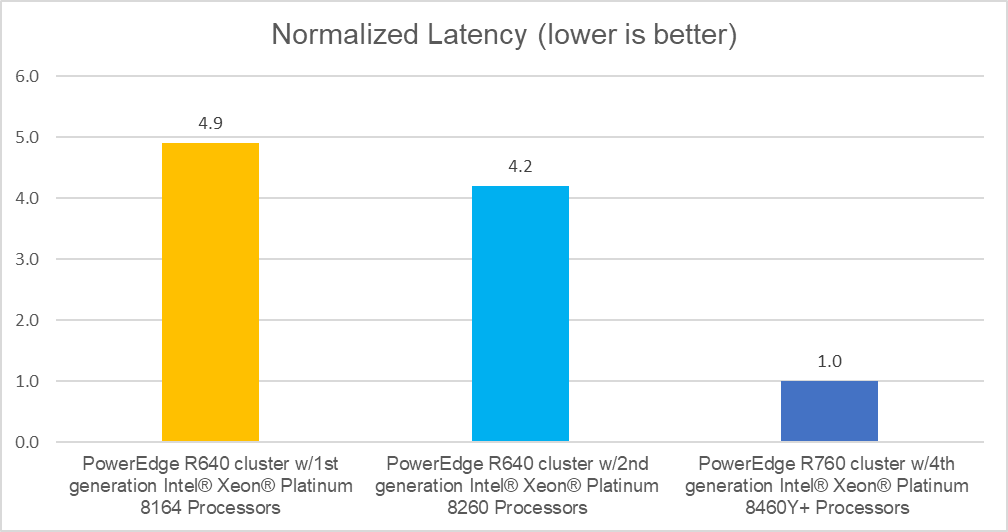
Measured in milliseconds
These graphs show that vSAN performance in an ESA environment using the new R760 with 4th generation Intel® Xeon® Platinum Processors is over 6x faster* than the two previous generations and delivers up to 4.9x lower latency*. With similar underlying hardware as the previous test, this performance increase is primarily a function of the new ESA architecture running on the latest generation Servers.
How to move from OSA to ESA
With higher performance and lower latency, the clear choice would be for customers to move to the vSAN 8.0 ESA architecture using the latest Dell PowerEdge Servers with 4th generation Intel® Xeon® Processors. Still, the question is, “How?”.
According to VMware[i], customers have three options:
- Deploy a new cluster and migrate workloads using vMotion and Storage vMotion.
- Convert existing OSA clusters to ESA by evacuating the cluster, upgrading the hardware, and redeploying it as an ESA solution.
- Perform a rolling cluster migration from OSA to a new cluster.
While the steps necessary for each of these options are different, they all use the same key process: “migrate workloads using vMotion and Storage vMotion.”
Option 1 – Pros and Cons
The choice of option 1 involves deploying new servers into a new cluster and, as it grows, migrate existing virtual machines and storage images to the new cluster.
Pro’s
- Requires the fewest steps
- It does not place any existing data at risk since it can be maintained in the existing cluster until it is ready to move.
- Performance and availability of the environment are affected only during the vMotion/Storage Motion activities.
- This option also provides the additional performance benefits of the new 4th generation Intel® Xeon® Processors and Dell PowerEdge Servers.
- The “Enhanced vMotion Compatibility” (EVC)[ii] feature of ESXi is designed to enable workloads to be live migrated between different generations of processors to ensure uptime for the workload
Con’s
- It requires the purchase of new hardware; however, this effect can be minimized by implementing this change as part of existing growth plans.
Option 2 – Pros and Cons
The choice of option 2 involves evacuating the existing cluster, upgrading the hardware (storage and network), and redeploying the existing servers into a new cluster. Once the hardware transition is complete, the final step would be to migrate the previously moved virtual machines and storage images to this new cluster.
Pro’s
- Some budget savings may be obtained due to reduced hardware replacement
- This approach may be suitable if existing hardware is certified for ESA[iii]. Details on ESA hardware requirements can be found at the link in this document’s end notes.
Con’s
- This approach requires that all nodes be reconfigured with NVMe drives. If the current environment uses a spinning disk with SSD as the cache layer, it can be expensive to purchase new drives, reprovision the hardware, and require many hours of work to effect the transition. Note, even for existing clusters that use all NVMe configurations, they would be using older technology drives that cannot deliver the same performance levels as the latest generation of NVMe. Depending on the choices made when the original hardware was purchased, this option may not exist. For example, this option is not available if the existing systems do not have the space and connections necessary to host the required number of NVMe drives.
- This option also adds additional time to the process as it involves first using vMotion/Storage Motion to vacate the cluster and then requires their reuse to repopulate the cluster.
- This option requires that sufficient capacity is available in other clusters to accommodate 100% of the capacity of the cluster being redeployed.
- This approach may require distributing virtual machines and storage images to multiple clusters to obtain the capacity needed. In this case, it adds additional complexity to the migration as the human resources who manage the environment will need to determine how to rebalance all these environments.
Option 3 – Pros and Cons
The choice of option 3 involves selectively removing servers from the existing cluster, allowing time for the vSAN environment to rebuild, downing the selected servers, upgrading the hardware (storage and network), and redeploying the existing servers into a new cluster. As this new cluster grows, the final stage would be migrating existing virtual machines and storage images to this new cluster.
Pro’s
- Some budget savings may be obtained due to reduced hardware replacement
- This approach may be suitable if existing hardware is certified for ESAv. Details on ESA hardware requirements can be found at the link in this document’s end notes.
Con’s
- The same as above, this approach requires that all nodes be reconfigured with NVMe drives. If the current environment uses a spinning disk with SSD as the cache layer, it can be expensive to purchase new drives, reprovision the hardware, and require many hours of work to effect the transition. Note, even for existing clusters that use all NVMe configurations, they would be using older technology drives that cannot deliver the same performance levels as the latest generation of NVMe. Depending on the choices made when the original hardware was purchased, this option may not exist. For example, this option is unavailable if the existing systems do not have the space and connections necessary to host the required NVMe drives.
- This option requires less time in each step to effect the transition but may require more time. This approach also requires appropriate planning to allow the old vSAN time to redistribute the data.
- This approach also introduces additional risk due to the high level of coordination required between resources to ensure that the correct server is removed from the cluster.
Conclusion
IT professionals’ primary responsibilities are reducing downtime, increasing performance and scalability, and optimizing infrastructure. As technology continues to evolve, engineers at Dell, Intel, and VMware are focused on optimizing new solutions to deliver greater value to customers. Deploying new technologies into old environments reduces or sometimes eliminates this value. Combining Dell PowerEdge Servers with 4th generation Intel® Xeon® Processors and the latest VMware hypervisor/vSAN software can dramatically improve performance, reduce latency, and significantly increase the business benefit. With storage devices forming a large portion of the cost of a server, reconfiguring existing hardware to optimize the capabilities of vSAN8.0 ESA requires a significant capital investment. Yet it will still not deliver maximum performance due to the reduced performance of legacy NVMe and Servers. In addition, this approach significantly increases the workload on existing IT staff. Based on this, Dell and Intel recommend that customers implement Option 1 to Modernize their IT infrastructure, reduce risk, and maximize business benefits.
*All performance claims noted in this document were based on measurements conducted in accordance with published standards for HCIBench. Performance varies by use, configuration, and other factors. Performance results are based on testing conducted between November 2022 and March 2023.
- https://www.intel.com/content/www/us/en/products/sku/231742/intel-xeon-platinum-8458p-processor-82-5m-cache-2-70-ghz/ordering.html?wapkw=8458
- https://ark.intel.com/content/www/us/en/ark/products/231736/intel-xeon-platinum-8460y-processor-105m-cache-2-00-ghz.html
- https://networkbuilders.intel.com/solutionslibrary/power-management-technology-overview-technology-guide
- https://blogs.VMware.com/virtualblocks/2022/08/30/announcing-vsan-8-with-vsan-express-storage-architecture/
- https://flings.VMware.com/hcibench
- https://core.VMware.com/resource/migrating-express-storage-architecture-vsan-8#sec23176-sub2
- https://core.VMware.com/resource/enhanced-vmotion-compatibility-evc-explained
- https://www.VMware.com/resources/compatibility/vsanesa_profile.php

PowerEdge “xs” vs. “Standard” vs. “xa” vs. “xd2”
Wed, 26 Apr 2023 22:34:11 -0000
|Read Time: 0 minutes
Summary
With the recent announcement of 4th Gen Intel® Xeon® Scalable processors, Dell has announced two different models of the R660 and four different models of the R760 to meet emerging customer demands. This paper highlights the engineering elements of each design and explains why we expanded the portfolio.
Balancing system cost, performance, scalability, and power consumption is difficult when designing a server. The evolution of workloads places additional demands on the design, with environments such as virtualization, artificial intelligence (AI), machine learning (ML), video surveillance, and object-based storage all centering on different optimization parameters.
The challenge for server design teams is to strike an effective balance that delivers maximum performance for each workload/environment but does not overly burden the customer with unnecessary cost for features they might not use. To illustrate this, consider that a server designed for maximum performance with an in-memory database might require higher memory density, while a server designed for AI/ML might benefit from enhanced GPU support. Similarly, a server designed for virtualization with software-defined storage might benefit from increased core counts and faster storage, while the massive amount of data generated by video surveillance workloads or object-based storage environments would benefit from larger storage capacities. Each of these environments requires different optimizations, as shown in the following figure.
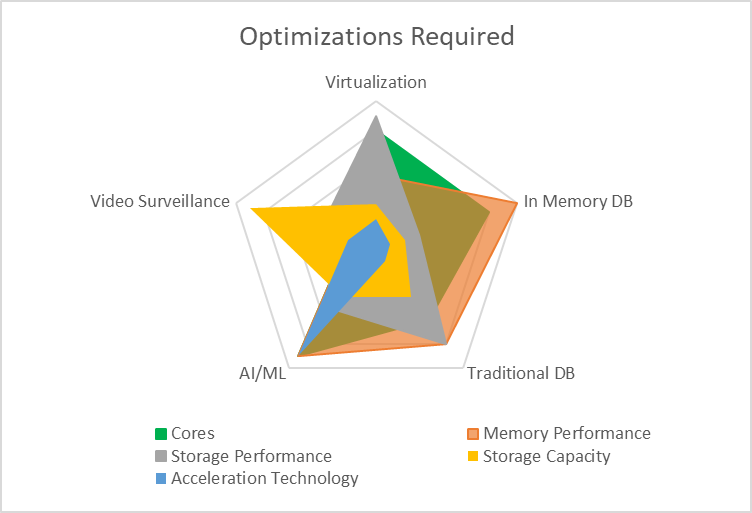
While it might be technically possible to build a single system that could achieve all this, the result would be much more expensive to purchase and could be potentially physically larger. For example, a system capable of powering and cooling multiple 350 W GPUs needs to have bigger power supplies, stronger fans, additional space (particularly for double-width GPUs), and high core count CPUs. Conversely, a system designed for video surveillance might require none of these optimizations and instead require a large number of high-capacity hard drives. Trying to optimize for all workloads/environments often results in unacceptable trade-offs for each.
To achieve truly optimized systems, Dell Technologies has launched four classes of its industry-leading PowerEdge rack servers: the “xa” model, the “standard” models, the “xs” models and the “xd2” model.
- The “xa” model is designed for optimization in AI/ML environments. It delivers larger power supplies, high-performance cooling, and support for a large number of GPUs to deliver the highest levels of performance.
- The “standard” models are flexible enough to deliver enhanced virtualization support (with software-defined storage) or database performance (“in memory” or traditional database) with the addition of high storage performance, large memory expansion, and increased core counts.
- The “xs” models deliver right-sized configurations for the most popular workloads, providing a balance of lower power consumption, a range of upgrade options, memory capacity, and performance as well as high-performance NVMe storage for demanding virtualization environments.
- The “xd2” model is designed for maximum storage capacity using large-form-factor spinning hard drives to deliver critical storage capacity for demanding environments such as video surveillance and object-based storage.
Design optimizations
As noted, the “xa” model is optimized for GPU density, the “standard” models are optimized for high performance compute, the “xs” models are optimized for virtualized environments, and the “xd2” model is optimized for storage density. Here is an overview of the key feature differences:
While key specifications are different between models, much remains the same. All models support key features such as:
- iDRAC9 and OpenManage
- OCP3.0 networking options
- PCIe 4.0/5.0 slots (PCIe 4.0 only on the R760xd2)
- PERC 11/PERC 12 RAID, including optional support for NVMe RAID on some models
- 4,800 MT/s memory
“xa” design
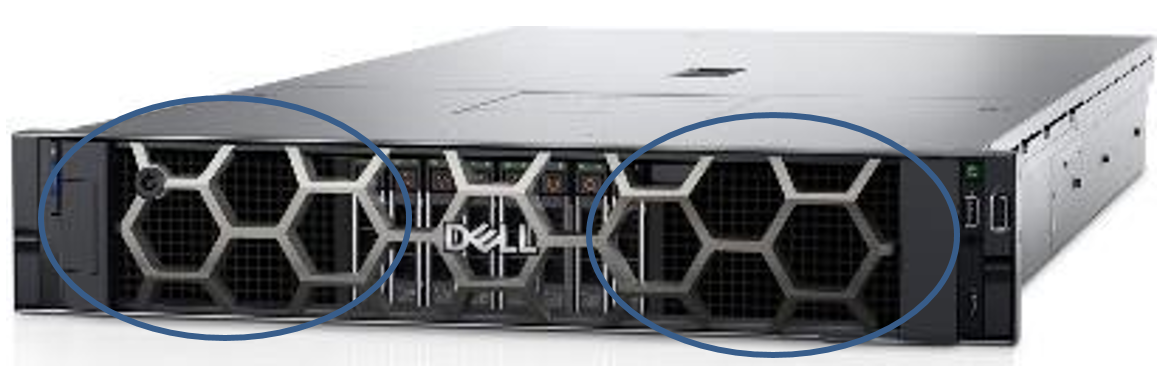
The R760xa is optimized for enhanced GPU support. This support is accomplished by moving two of the PCIe cages from the back to the front, as indicated in the figure. Each of these cages can support up to two double-width PCIe x16 Gen 5 GPUs, and, in the case of the NVIDIA A100, each pair can be linked together with NVLink bridges. The R760xa can also support up to eight of the latest-generation NVIDIA L4 GPUs. These cards are a low-profile, single-width design that operates at PCIe Gen 4 speeds using x16 slots. Additional PCIe slots are available in the back of the system. With this change, internal storage has been designed to fit in the middle of the front of the server and provide up to eight SAS/SATA or NVMe drives or a mix of drive types. All these configurations are available with optional support for RAID, using the new PERC 11 based H755 (SAS/SATA) or H755n (NVMe). This model supports up to 32 DDR5 DIMMs, allowing a maximum capacity of 8 TB using 256 GB DIMMs.
“Standard” design

The R660/R760 “standard” models have been designed to accommodate the flexibility necessary to address a wide variety of workloads. With support for large numbers of hard drives (12 in the R660 and 26 in the R760), these models also offer optional performance and reliability features with the new PERC 11 and PERC 12 RAID controllers. These RAID controllers are located directly behind the drive cage to save space and are connected directly to the system motherboard to ensure PCIe 4.0 speeds. To ensure the highest levels of performance, these models ship with support for up to 32 DIMMs, allowing up to 8 TB of memory expansion using 256 GB DIMMs and support processors with up to 56 cores. In addition, both models support GPU but to a lesser extent than the “xa” series.
“xs” design


When designing for virtualization, we see a number of key factors that emerge. For example, storage requirements often serve software-defined storage schemas (such as vSAN), while the ability of a hypervisor to segment memory and cores creates a need to balance between the two. To meet these demands, the new “xs” designs include support for up to 16 DIMMs. This translates to 1 TB of DRAM when using 64 GB DIMMs, CPUs with up to 32 cores, and internal storage of up to 24 drives (2U) or 10 drives (1U).
Not that many years ago, the cost per GB of memory made it difficult to design systems that could accommodate the required “memory/VM” ratios necessary for a balanced hypervisor. However, recent pricing trends have created an opportunity to achieve excellent performance, scalability, and balance with fewer DIMMs. Specifically, the cost/GB ratio of a 64 GB DIMM is evolving to be similar to the ratio of a 32 GB DIMM. This means that customers can achieve the same balance that was achieved with previous generations of servers with fewer DIMM sockets. As the following chart shows, an “xs” system with only 16 DIMM sockets populated with 64 GB DIMMs (1 TB total) can deliver compelling GB/VM.
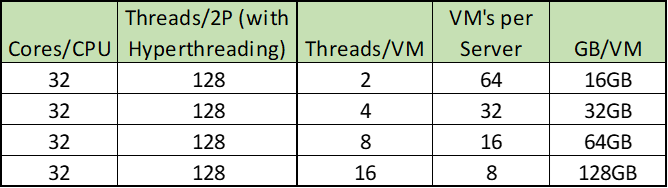
There are significant impacts to reducing the number of DIMM sockets. The most obvious is power and cooling. Any design needs to reserve enough “headroom” for a full configuration. For example, assuming a power requirement for memory of 5 W per socket, cutting the number of DIMM sockets in half, an “xs” power budget can be reduced by up to 80 W. This in turn reduces the amount of cooling required, which allows the use of more cost-effective fans and potentially reduced cost by limiting baffles and other hardware used to direct air flow. This also helps explain why an “xs” system can operate on a power supply as small as 600 W (R660xs), while a “standard” system requires a minimum of 800 W (R660) power supplies to operate.
“xd2” design
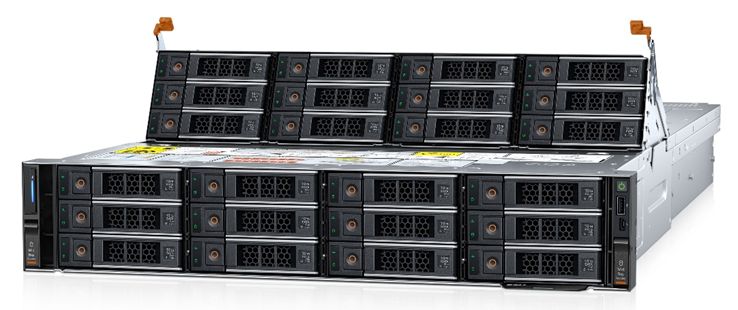
To deliver maximum storage capacity, the R760xd2 uses two rows of 3.5-inch drives in the front, each of which supports up to 12 drives for a total of 24 x 3.5-inch front-mounted drives. The chassis is designed to extend from the front, allowing for the hot-plug replacement of failed drives. This model also supports up to four E3.S NVMe-based drives in the back to allow customers to configure a PERC 11 or PERC 12 controller to natively tier 3.5-inch spinning disks with solid-state NVMe drives. This model supports up to two processors, each with up to 32 cores using the 185 W Intel® Xeon® Gold 6428N. Support for up to 16 DDR5 DIMM sockets allows for up to 1 TB of memory for demanding video surveillance and object storage environments.
Additional considerations for memory
It is important to note that each CPU has eight channels. When the processor is populated with one DIMM per channel (1DPC), the memory will operate at 4,800 MT/s; however, when populated with 2DPC (32 DIMMs total), the speed drops to 4,400 MT/s. In this context, models with only 16 DIMM sockets will operate at the fastest rated memory speed of the processor.
Another impact is cost. Increasing the number of DIMM sockets in a system increases the complexity of the design. The R660xs, R760xs, and R760xd2 all support 16 DIMMs. For every DIMM socket installed, space must be reserved in the motherboard design to accommodate the addition of electrical traces. In the case of DDR5, each DIMM has 288 pins. By reducing the number of supported DIMMs from 32 to 16, Dell engineers eliminated 4,608 electrical traces from these designs. A motherboard design with fewer traces often requires fewer “layers,” which translates directly into a lower cost for the motherboard.
Conclusion
With the launch of the new 4th Gen Intel® Xeon® Scalable processors, Dell Technologies can deliver a range of new technologies to meet customer requirements. With the “xa” model for high GPU density, “standard” models for a wide range of workloads, “xs” series for compelling price/performance, and the “xd2” model for maximum storage capacity, customers can now achieve a level of optimization not previously available.

BIOS Settings for Optimized Performance on Next-Generation Dell PowerEdge Servers
Thu, 02 Nov 2023 17:45:05 -0000
|Read Time: 0 minutes
Summary
Dell PowerEdge servers provide a wide range of tunable parameters to allow customers to achieve top performance. The information in this paper outlines the tunable parameters available in the latest generation of PowerEdge servers (for example, R660, R760, MX760, and C6620) and provides recommended settings for different workloads.
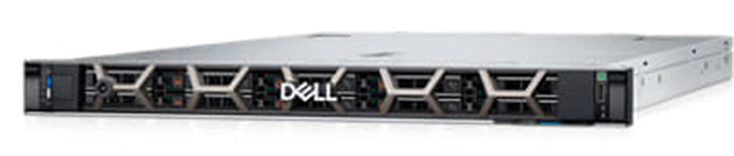 Figure 1. PowerEdge R660
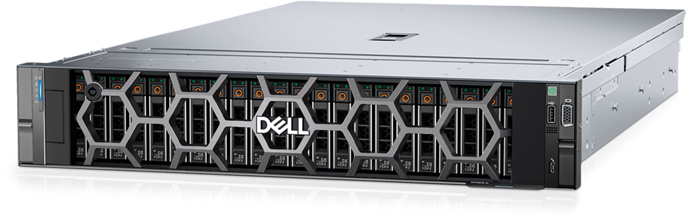
Figure 2. PowerEdge R760
The following tables provide the BIOS setting recommendations for the latest generation of PowerEdge servers.
Table 1. BIOS setting recommendations—System profile settings
System setup screen | Setting | Default | Recommended setting for performance | Recommended setting for low latency, Stream, and MLC environments | Recommended | |
System profile settings | System Profile | Performance Per Watt [1] | Performance Optimized | First select Performance Optimized and then select Custom [1] | Custom
| |
System profile settings | CPU Power Management | System DBPM | Maximum Performance | Maximum Performance | Maximum Performance | |
System profile settings | Memory Frequency | Maximum Performance | Maximum Performance | Maximum Performance | Maximum Performance | |
System profile settings | Turbo Boost [2] | Enabled | Enabled | Enabled | Enabled | |
System profile settings | C1E | Enabled | Disabled | Disabled | Disabled | |
System profile settings | C States | Enabled | Disabled | Disabled | Autonomous or Disabled [6] | |
System profile settings | Monitor/Mwait | Enabled | Enabled | Disabled [3] | Enabled | |
System profile settings | Memory Patrol Scrub | Standard | Standard [4] | Standard/Disabled [4] | Disabled | |
System profile settings | Memory Refresh Rate | 1x | 1x | 1x | 1x | |
System profile settings | Uncore Frequency | Dynamic | Maximum [5] | Maximum [5] | Dynamic | |
System profile settings | Energy Efficient Policy | Balanced Performance | Performance | Performance | Performance | |
System profile settings | CPU Interconnect Bus Link Power Management | Enabled | Disabled | Disabled | Disabled | |
System profile settings | PCI ASPM L1 Link Power Management | Enabled | Disabled | Disabled | Disabled | |
[1] Depends on how system was ordered. Other System Profile defaults are driven by this choice and may be different than the examples listed. Select Performance Profile first, and then select Custom to load optimal profile defaults for further modification
[2] SST Turbo Boost Technology is substantially better than previous generations for latency-sensitive environments, but specific Turbo residency cannot be guaranteed under all workload conditions. Evaluate Turbo Boost Technology in your own environment to choose which setting is most appropriate for your workload, and consider the Dell Controlled Turbo option in parallel.
[3] Monitor/Mwait should only be disabled in parallel with disabling Logical Processor. This will prevent the Linux intel_idle driver from enforcing C-states.
[4] You can test your own environment to determine whether disabling Memory Patrol Scrub is helpful.
[5] Dynamic selection can provide more TDP headroom at the expense of dynamic uncore frequency. Optimal setting is workload dependent.
[6] Autonomous on Air Cooled system or Disabled on Liquid Cooled Systems
Table 2. BIOS setting recommendations—Memory, processor, and iDRAC settings
System setup screen | Setting | Default | Recommended setting for performance | Recommended setting for low latency, Stream, and MLC environments | Recommended |
Memory settings | Memory Operating Mode | Optimizer | Optimizer [1] | Optimizer [1] | Optimizer [1] |
Memory settings | Memory Node Interleave | Disabled | Disabled | Disabled | Disabled |
Memory settings | DIMM Self Healing | Enabled | Disabled | Disabled | Disabled |
Memory settings | ADDDC setting | Disabled [2] | Disabled [2] | Disabled [2] | Disabled [2] |
Memory settings | Memory Training | Fast | Fast | Fast | Fast |
Memory settings | Correctable Error Logging | Enabled | Disabled | Disabled | Disabled |
Processor settings | Logical Processor | Enabled | Disabled [3] | Disabled [3] | Enabled |
Processor settings | Virtualization Technology | Enabled | Disabled | Disabled | Disabled |
Processor settings | CPU Interconnect Speed | Maximum Data Rate | Maximum Data Rate | Maximum Data Rate | Maximum Data Rate |
Processor settings | Adjacent Cache Line Prefetch | Enabled | Enabled | Enabled | Enabled |
Processor settings | Hardware Prefetcher | Enabled | Enabled | Enabled | Enabled |
Processor settings | DCU Streamer Prefetcher | Enabled | Enabled | Disabled | Disabled |
Processor settings | DCU IP Prefetcher | Enabled | Enabled | Enabled | Enabled |
Processor settings | Sub NUMA Cluster | Disabled | SNC 2 | SNC 4 on XCC SNC 2 on MCC | SNC 4 on XCC SNC 2 on MCC |
Processor settings | Dell Controlled Turbo | Disabled | Disabled | Enabled [4] | Disabled |
Processor settings | Dell Controlled Turbo Optimizer mode | Disabled | Enabled [5] | Enabled [5] | Enabled [5] |
Processor settings | XPT Prefetch | Enabled | Disabled | Disabled | Enabled |
Processor settings | UPI Prefetch | Enabled | Disabled | Disabled | Enabled |
Processor settings | LLC Prefetch | Disabled | Enabled | Disabled | Disabled |
Processor settings | DeadLine LLC Alloc | Enabled | Enabled | Enabled | Disabled |
Processor settings | Directory AtoS | Disabled | Disabled | Disabled | Disabled |
Processor settings | Dynamic SST Perf Profile | Disabled | Disabled | Enabled | Disabled |
Processor settings | SST-Perf- profile | Operating Point 1 | Operating Point 1 | Operating Point ? [6] | Operating Point 1 |
iDRAC settings | Thermal Profile | Default | Maximum Performance | Maximum Performance | Maximum Performance |
[1] Use Optimizer Mode when Memory Bandwidth Sensitive, up to 33% BW reduction with Fault Resilient Mode.
[2] Only available when x4 DIMMS installed in the system.
[3] Logical Processor (Hyper Threading) tends to benefit throughput-oriented workloads such as SPEC CPU2017 INT and FP_RATE. Many HPC workloads disable this option. This only benefits SPEC FP_rate if the thread count scales to the total logical processor count.
[4] Dell Controlled Turbo helps to keep core frequency at the maximum all-cores Turbo frequency, which reduces jitter. Disable if Turbo disabled.
[5] Option is available on liquid cooled systems only.
[6] Depends on if your program is affected by Base and Turbo frequency. Will reduce CPU core count and give higher Base and Turbo frequencies.
iDRAC recommendations
- Thermally challenged environments should increase fan speed through iDRAC Thermal section.
- All Power Capping should be removed in performance-sensitive environments.
BIOS settings glossary
- System Profile: (Default=Performance Per Watt)—It can be difficult to set each individual power/performance feature for a specific environment. Because of this, a menu option is provided that can help a customer optimize the system for things such as minimum power usage/acoustic levels, maximum efficiency, Energy Star optimization, or maximum performance.
- Performance Per Watt DAPC (Dell Advanced Power Control)—This mode uses Dell presets to maximize the performance/watt efficiency with a bias towards power savings. It provides the best features for reducing power and increasing performance in applications where maximum bus speeds are not critical. It is expected that this will be the favored mode for SPECpower testing. "Efficiency–Favor Power" mode maintains backwards compatibility with systems that included the preset operating modes before Energy Star for servers was released.
- Performance Per Watt OS—This mode optimizes the performance/watt efficiency with a bias towards performance. It is the favored mode for Energy Star. Note that this mode is slightly different than "Performance Per Watt DAPC" mode. In this mode, no bus speeds are derated as they are in the Performance Per Watt DAPC mode, leaving the operating system in control of those changes.
- Performance—This mode maximizes the absolute performance of the system without regard for power. In this mode, power consumption is not considered. Things like fan speed and heat output of the system, in addition to power consumption, might increase. Efficiency of the system might go down in this mode, but the absolute performance might increase depending on the workload that is running.
- Custom—Custom mode allows the user to individually modify any of the low-level settings that are preset and unchangeable in any of the other four preset modes.
- C-States—C-states reduce CPU idle power. There are three options in this mode:
- Enabled: When “Enabled” is selected, the operating system initiates the C-state transitions. Some operating system software might defeat the ACPI mapping (for example, intel_idle driver).
- Autonomous: When "Autonomous" is selected, HALT and C1 requests get converted to C6 requests in hardware.
- Disable: When "Disable" is selected, only C0 and C1 are used by the operating system. C1 gets enabled automatically when an OS auto-halts.
- C1 Enhanced Mode—Enabling C1E (C1 enhanced) state can save power by halting CPU cores that are idle.
- Turbo Mode—Enabling turbo mode can boost the overall CPU performance when all CPU cores are not being fully utilized. A CPU core can run above its rated frequency for a short period of time when it is in turbo mode.
- Hyper-Threading—Enabling Hyper-Threading lets the operating system address two virtual or logical cores for a physical presented core. Workloads can be shared between virtual or logical cores when possible. The main function of hyper-threading is to increase the number of independent instructions in the pipeline for using the processor resources more efficiently.
- Execute Disable Bit—The execute disable bit allows memory to be marked as executable or non-executable when used with a supporting operating system. This can improve system security by configuring the processor to raise an error to the operating system when code attempts to run in non-executable memory.
- DCA—DCA capable I/O devices such as network controllers can place data directly into the CPU cache, which improves response time.
- Power/Performance Bias—Power/performance bias determines how aggressively the CPU will be power managed and placed into turbo. With "Platform Controlled," the system controls the setting. Selecting "OS Controlled" allows the operating system to control it.
- Per Core P-state—When per-core P-states are enabled, each physical CPU core can operate at separate frequencies. If disabled, all cores in a package will operate at the highest resolved frequency of all active threads.
- CPU Frequency Limits—The maximum turbo frequency can be restricted with turbo limiting to a frequency that is between the maximum turbo frequency and the rated frequency for the CPU installed.
- Energy Efficient Turbo—When energy efficient turbo is enabled, the CPU's optimal turbo frequency will be tuned dynamically based on CPU utilization.
- Uncore Frequency Scaling—When enabled, the CPU uncore will dynamically change speed based on the workload.
- MONITOR/MWAIT—MONITOR/MWAIT instructions are used to engage C-states.
- Sub-NUMA Cluster (SNC)—SNC breaks up the last level cache (LLC) into disjoint clusters based on address range, with each cluster bound to a subset of the memory controllers in the system. SNC improves average latency to the LLC and memory. SNC is a replacement for the cluster on die (COD) feature found in previous processor families. For a multi-socketed system, all SNC clusters are mapped to unique NUMA domains. (See also IMC interleaving.) Values for this BIOS option can be:
- Disabled: The LLC is treated as one cluster when this option is disabled.
- Enabled: Uses LLC capacity more efficiently and reduces latency due to core/IMC proximity. This might provide performance improvement on NUMA-aware operating systems.
- Snoop Preference—Select the appropriate snoop mode based on the workload. There are two snoop modes:
- HS w. Directory + OSB + HitME cache: Best overall for most workloads (default setting)
- Home Snoop: Best for BW sensitive workloads
- XPT Prefetcher—XPT prefetch is a mechanism that enables a read request that is being sent to the last level cache to speculatively issue a copy of that read to the memory controller prefetcher.
- UPI Prefetcher—UPI prefetch is a mechanism to get the memory read started early on DDR bus. The UPI receive path will spawn a memory read to the memory controller prefetcher.
- Patrol Scrub—Patrol scrub is a memory RAS feature that runs a background memory scrub against all DIMMs. This feature can negatively affect performance.
- DCU Streamer Prefetcher—DCU (Level 1 Data Cache) streamer prefetcher is an L1 data cache prefetcher. Lightly threaded applications and some benchmarks can benefit from having the DCU streamer prefetcher enabled. Default setting is Enabled.
- LLC Dead Line Allocation—In some Intel CPU caching schemes, mid-level cache (MLC) evictions are filled into the last level cache (LLC). If a line is evicted from the MLC to the LLC, the core can flag the evicted MLC lines as "dead." This means that the lines are not likely to be read again. This option allows dead lines to be dropped and never fill the LLC if the option is disabled. Values for this BIOS option can be:
- Disabled: Disabling this option can save space in the LLC by never filling MLC dead lines into the LLC.
- Enabled: Opportunistically fill MLC dead lines in LLC, if space is available.
- Adjacent Cache Prefetch—Lightly threaded applications and some benchmarks can benefit from having the adjacent cache line prefetch enabled. Default is Enabled.
- Intel Virtualization Technology—Intel Virtualization Technology allows a platform to run multiple operating systems and applications in independent partitions, so that one computer system can function as multiple virtual systems. Default is Enabled.
- Hardware Prefetcher—Lightly threaded applications and some benchmarks can benefit from having the hardware prefetcher enabled. Default is Enabled.
- Trusted Execution Technology—Enable Intel Trusted Execution Technology (Intel TXT). Default is Disabled.

Extracting Insights on a Scalable and Security-Enabled Data Platform from Cloudera
Fri, 14 Jul 2023 19:48:55 -0000
|Read Time: 0 minutes
Summary
This joint paper outlines a brief discussion on the key hardware considerations when configuring a successful deployment and recommends configurations based on the most recent PowerEdge Server portfolio offerings.
Market positioning
Cloudera Data Platform (CDP) Private Cloud is a scalable data platform that allows data to be managed across its lifecycle—from ingestion to analysis—without leaving the data center. It comprises two products: Cloudera Private Cloud Base (the on-premises portion built on Dell PowerEdge servers) and Cloudera Private Cloud Data Services. The Data Services provide containerized compute analytics applications that scale dynamically and can be upgraded independently. This platform simplifies managing the growing volume and variety of data in your enterprise, and unleashes the business value of that data. By disaggregating compute and storage, and supporting a container based environment, CDP Private cloud helps enhance business agility and flexibility. The platform also includes secure user access and data governance features.
Key considerations
- Data throughput - CDP Private Cloud on Dell PowerEdge servers is built on high-performing Intel architecture. Intel® Ethernet network controllers, adapters, and accessories enable agility in the data center and support high throughput. Unlike many other point solutions, CDP Private Cloud is an end-to-end platform for data, from collecting and engineering to reporting and using AI capabilities.
- Balanced system configuration - CDP Private Cloud can handle multiple varying workloads, including analytics and machine learning (ML). Its capabilities are supported by generation-over-generation improvements in underlying Intel technologies that offer more cores and higher memory capacity.
- Data latency - As data grows and needs to be accessed across the cluster, data-access response times are critical, especially for real-time analytics applications.
Available configurations
Table 1. Cloudera Data Platform (CDP) Private Cloud Base Cluster
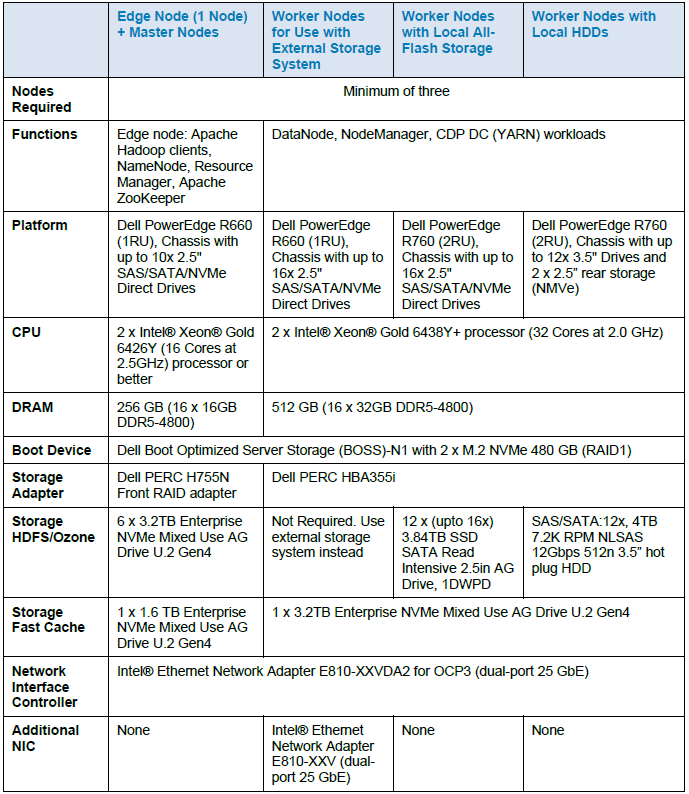
Note: For a storage-only configuration (HDFS/Ozone), customers can still choose traditional high-density storage nodes with high-capacity rotational HDDs based on the PowerEdge R740xd2 platform, although external storage systems, such as Dell PowerScale or Dell ECS, are recommended. Customers should be aware that using large capacity HDDs increases the time of background scans (bit-rot detection) and block report generation for HDFS. It also significantly increases recovery time after a full node failure. Also, using nodes with more than 100 TB of storage is not recommended by Cloudera. Source: https://blog.cloudera.com/disk-and-datanode-size-in-hdfs/. For more information and specifications, contact a Dell representative.
Table 2. CDP Private Cloud Data Services (Red Hat OpenShift Kubernetes)/Embedded Container Service (ECS) Cluster
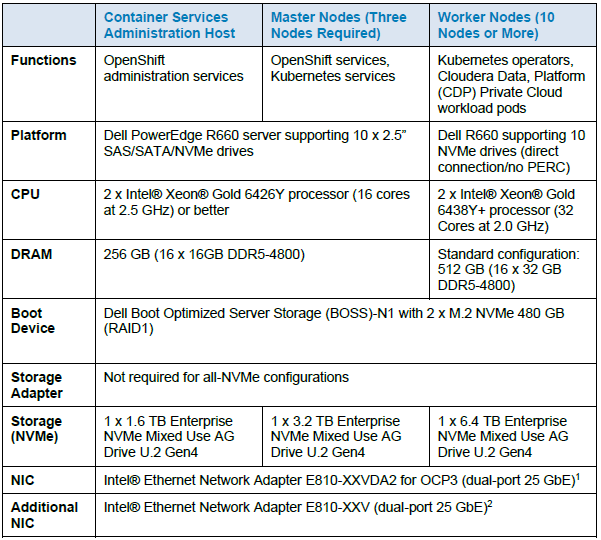
Learn more
Contact your Dell Technologies or Intel account team for a customized quote 1-877-289-3355.
Note: This document may contain language from third-party content that is not under Dell Technologies’ control and is not consistent with current guidelines for Dell Technologies’ own content. When such third-party content is updated by the relevant third parties, this document will be revised accordingly.

Microsoft SQL Server Solution Overview
Fri, 03 Mar 2023 17:23:10 -0000
|Read Time: 0 minutes
Summary
Microsoft SQL Server solution is a high-performance data platform that is optimized for Online Transaction Processing (OLTP) and Decision Support System or Analytics workloads. This solution helps to provide customers with system architectures that are optimized for a range of business operation and analysis needs. It also enables customers to achieve an efficient resource balance between the SQL Server data processing capability and the hardware throughput.
Market positioning
SQL Server enables organizations to gain intelligence from all types of data. By using SQL Server with Windows on the latest generation Dell PowerEdge servers with the latest Intel® Xeon® Scalable processors, organizations get faster insights from transaction processing and analytical processing.
Expanded product features
Intel Xeon Scalable Processors
The 4th Generation Intel® Xeon® Scalable processor family has the most built-in accelerators of any CPU on the market to speed up AI, databases, analytics, networking, storage, and HPC workloads.
Along with software optimizations, the following features help improve workload performance and power efficiency:
- Intel® Advanced Matrix Extensions (Intel® AMX)
- Intel® QuickAssist Technology (Intel® QAT)
- Intel® Data Streaming Accelerator (Intel® DSA)
- Intel® Dynamic Load Balancer (Intel® DLB)
- Intel® In-Memory Analytics Accelerator (Intel® IAA)
With Microsoft SQL Server 2022 and Intel® QuickAssist Technology, customers can efficiently speed-up compressed database backups without significanly increasing CPU utilization, leaving more resources for handling user queries and other database operations.
Memory
The latest Dell PowerEdge servers with Intel 4th Gen Xeon® Scalable processors supports eight channels of DDR5 memory modules per socket running at up to 4800MT/s with 1 DIMM per channel or up to 4400MT/s with 2 DIMMs per channel, offering up to 1.5x bandwidth improvement over previous generation platofrms with DDR4 memory, increased memory capacity, and power efficiency.
Storage/RAID
Intel® Optane™ SSDs deliver performance, Quality of Service (QoS), and capacity improvements to optimize storage efficiency, enabling data centers to do more per server, minimize service disruptions, and efficiently manage at scale. Intel® Optane™ SSD P5800X with next generation Intel® Optane™ storage media and advanced controller does not comprise I/O performance read or write (R/W) and high endurance, and provides unprecedented value over legacy storage. In the accelerating world of intelligent data, Intel® Optane™ SSD P5800X offers three times greater random 4k mixed R/W I/O operations per second (IOPS) over Intel® Optane™ SSD P4800X1 (PCIe* 3.x).
Key Considerations
- Higher performance with lower licensing costs - All configurations are based on the latest Dell PowerEdge servers with high-frequency 4th generation Intel® Xeon® Scalable Processors to achieve best Microsoft SQL Server performance and optimize software licensing costs.
- Data redundancy and high availability - The Dell PERC H755N NVMe RAID controller provides high performance local data redundancy, resilience, and reliability for critical workloads and applications such as Microsoft SQL Server. For high availability, performance, and capacity scaling, use multiple servers with SQL Server replication, log shipping, mirroring, clustering, or AlwaysOn Availability Groups (AG).
- Data throughput - Microsoft SQL Server Solution on Dell PowerEdge servers is built on high-performing Intel® architecture. The solution uses the high-performance Intel® Xeon® processors and better network, storage, and integrated platform acceleration products optimized for high workload density and performance.
- Optimized backup operations with QAT accelerator - The Intel® Xeon® Platinum 8462Y+ processor has a QAT accelerator that supports a high performance compression engine that can significantly shorten backup/restore operations on highly utilized servers running Microsoft SQL Server 2022.
Recommended Configurations
Base for SQL Server Standard Edition
Table 1. PowerEdge R660-based, up to 8 or 10 NVMe drives and optional HW RAID, 1RU
Feature | Description |
Platform[1] | Dell R660 chassis with NVMe backplane (10x 2.5” – direct connection without RAID, or 8x 2.5” with HW RAID support) |
CPU | 2x Xeon® Gold 6426Y with SST-PP (12c @ 2.5GHz base / 3.3GHz turbo), or 2x Xeon® Gold 5418Y with SST-PP (12c @ 2.7GHz base / 3.2GHz turbo) |
DRAM | 256GB (16x 16GB DDR5-4800) |
Boot device | Dell BOSS-S2 with 2x 480GB M.2 SATA SSD (RAID1) |
Storage adapter[1] | Optional Dell Front PERC H755N NVMe RAID |
Log drives | 2x 1.6TB Enterprise NVMe Mixed Use AG Drive U.2 Gen4 (RAID1) |
Data drives[2] | 4x (up to 6x/8x) 3.84TB (or larger) Enterprise NVMe Read Intensive AG Drive U.2 Gen4 |
NIC | Intel® E810-XXV for OCP3 (dual-port 25Gb) |
Base for SQL Server Enterprise Edition
Table 2. PowerEdge R660-based, up to 8 NVMe drives and HW RAID, 1RU
Feature | Description |
Platform | Dell R660 chassis with NVMe backplane (8x 2.5” with HW RAID support) |
CPU | 2x Xeon® Gold 6442Y (24c @ 2.6GHz base / 3.3GHz turbo) |
DRAM | 512GB (16x 32GB DDR5-4800) |
Boot device | Dell BOSS-S2 with 2x 480GB M.2 SATA SSD (RAID1) |
Storage adapter | Dell Front PERC H755N NVMe RAID |
Log drives | 2x 400GB or 800GB Intel Optane P5800X U.2 Gen4 (RAID1) |
Data drives | 6x 3.84TB (or larger) Enterprise NVMe Read Intensive AG Drive U.2 Gen4 |
NIC | Intel® E810-XXV for OCP3 (dual-port 25Gb) |
Plus for SQL Server Enterprise Edition
Table 3. PowerEdge R760-based, up to 16 or 24 NVMe drives and dual HW RAID, 2RU
Feature | Description |
Platform | Dell R750 chassis with NVMe backplane (16x 2.5” / 24x 2.5” with dual HW RAID support) |
CPU[3] | 2x Xeon® Platinum 8462Y+ (32c @ 2.8GHz base / 3.6GHz turbo) |
DRAM | 512GB (16x 32GB DDR5-4800) or more |
Boot device | Dell BOSS-S2 with 2x 480GB M.2 SATA SSD (RAID1) |
Storage adapter | Dual Dell Front PERC H755N NVMe RAID |
Log drives | 2x 400GB or 800GB Intel Optane P5800X U.2 Gen4 (RAID1) |
Data drives[4] | 6x (up to 14x/22x) 3.84TB (or larger) Enterprise NVMe Read Intensive AG Drive U.2 Gen4 |
NIC[5] | Intel® E810-XXV for OCP3 (dual-port 25Gb), or |
[1] optional Dell PERC H755N NVMe RAID controller supported only with 8-drive chassis
[2] max number of drives depends on the chassis version and HW RAID support
[3] The Xeon 8462Y+ SKU includes QAT engine for crypto and compression acceleration
[4] max number of drives depends on the chassis version and HW RAID support
[5] 100Gb NIC recommended for high throughput Data Warehouse loads and ETL processing
Learn more
Contact your Dell or Intel account team for a customized quote, at 1-877-289-3355.

The Future of Server Cooling - Part 2: New IT hardware Features and Power Trends

Fri, 03 Mar 2023 17:21:25 -0000
|Read Time: 0 minutes
Summary
Part 1 of this three-part series, titled The Future of Server Cooling, covered the history of server and data center cooling technologies.
Part 2 of this series covers new IT hardware features and power trends with an overview of the cooling solutions that Dell Technologies provides to keep IT infrastructure cool.
Overview
The Future of Server Cooling was written because future generations of PowerEdge servers may require liquid cooling to enable certain CPU or GPU configurations. Our intent is to educate customers about why the transition to liquid cooling may be required, and to prepare them ahead of time for these changes. Integrating liquid cooling solutions on future PowerEdge servers will allow for significant performance gains from new technologies, such as next-generation Intel® Xeon® and AMD EPYC CPUs, and NVIDIA, Intel, and AMD GPUs, as well as the emerging segment of DPUs.
Part 1 of this three-part series reviewed some major historical cooling milestones and evolution of cooling technologies over time both in the server and the data center.
Part 2 of this series describes the power and cooling trends in the server industry and Dell Technologies’ response to the challenges through intelligent hardware design and technology innovation.
Part 3 of this series will focus on technical details aimed to enable customers to prepare for the introduction, optimization, and evolution of these technologies within their current and future datacenters.
Increasing power requirements and heat generation trends within servers
CPU TDP trends over time – Over the past ten years, significant innovations in CPU design have included increased core counts, advancements in frequency management, and performance optimizations. As a result, CPU Thermal Design Power (TDP) has nearly doubled over just a few processor generations and is expected to continue increasing.
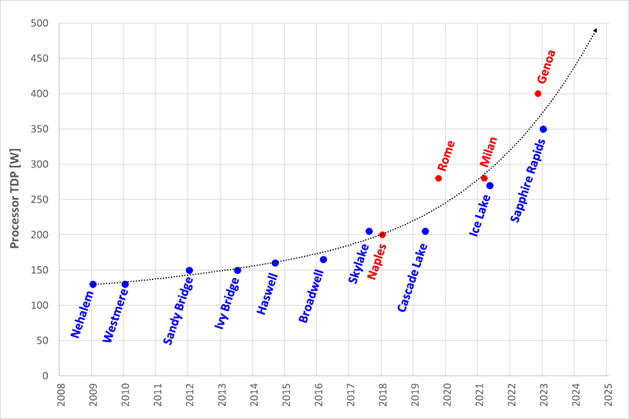
Figure 1. TDP trends over time
Emergence of GPUs – Workloads such as Artificial Intelligence (AI) and Machine Learning (ML) capitalize the parallel processing capabilities of Graphic Processing Units (GPUs). These subsystems require significant power and generate significant amounts of heat. As it has for CPUs, the power consumption of GPUs has rapidly increased. For example, while the power of an NVIDIA A100 GPU in 2021 was 300W, NVIDIA H100 GPUs are releasing soon at up to 700W. GPUs up to 1000W are expected in the next three years.
Memory – As CPU capabilities have increased, memory subsystems have also evolved to provide increased performance and density. A 128GB LRDIMM installed in an Intel-based Dell 14G server would operate at 2666MT/s and could require up to 11.5W per DIMM. The addition of 256GB LRDIMMs for subsequent Dell AMD platforms pushed the performance to 3200MT/s but required up to 14.5W per DIMM. The latest Intel and AMD based platforms from Dell operate at 4800MT/s and with 256GB RDIMMs consuming 19.2W each. Intel based systems can support up to 32 DIMMs, which could require over 600W of power for the memory subsystem alone.
Storage – Data storage is a key driver of power and cooling. Fewer than ten years ago, a 2U server could only support up to 16 2.5” hard drives. Today a 2U server can support up to 24 2.5” drives. In addition to the increased power and cooling that this trend has driven, these higher drive counts have resulted in significant air flow impedance both on the inlet side and exhaust side of the system. With the latest generation of PowerEdge servers, a new form factor called E3 (also known as EDSFF or “Enterprise & Data Center SSD Form Factor) brings the drive count to 16 in some models but reduces the width and height of the storage device, which gives more space for airflow. The “E3” family of devices includes “Short” (E3.S), “Short – Double Thickness”: (E3.S 2T), “Long” (E3.L), and “Long – Double Thickness” (E3L.2T). While traditional 2.5” SAS drives can require up to 25W, these new EDSFF designs can require up to 70W as shown in the following table.
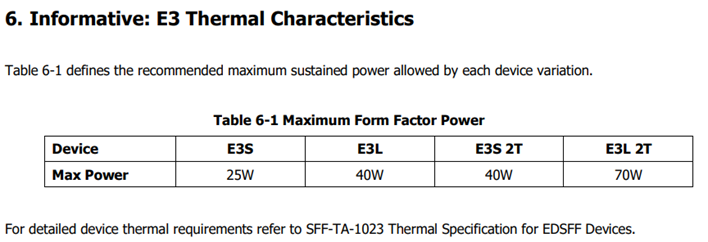
(Source: https://members.snia.org/document/dl/26716, page 25.)
Innovative Dell Technologies design elements and cooling techniques to help manage these trends
“Smart Flow” configurations
Dell ISG engineering teams have architected new system storage configurations to allow increased system airflow for high power configurations. These high flow configurations are referred to as “Smart Flow”. The high airflow aspect of Smart Flow is achieved using new low impedance airflow paths, new storage backplane ingredients, and optimized mechanical structures all tuned to provide up to a 15% higher airflow compared to traditional designs. Smart Flow configurations allow Dell’s latest generation of 1U and 2U servers to support new high-power CPUs, DDR5 DIMMs, and GPUs with minimal tradeoffs.

Figure 2. R660 “Smart Flow” chassis
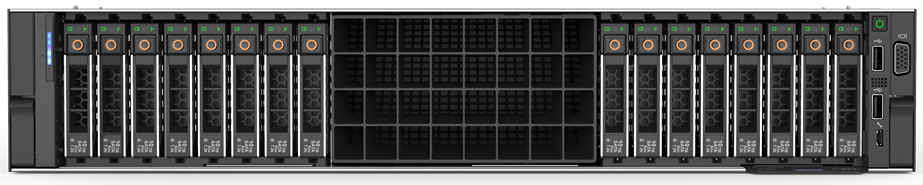
Figure 3. R760 “Smart Flow” chassis
FGPU configurations
The R750xa and R760xa continue the legacy of the Dell C4140, with GPUs located in the “first-class” seats at the front of the system. Dell thermal and system architecture teams designed these next generation GPU optimized systems with GPUs in the front to provide fresh (non-preheated) air to the GPUs in the front of the system. These systems also incorporate larger 60x76mm fans to provide the high airflow rates required by the GPUs and CPUs in the system. Look for additional fresh air GPU architectures in future Dell systems.
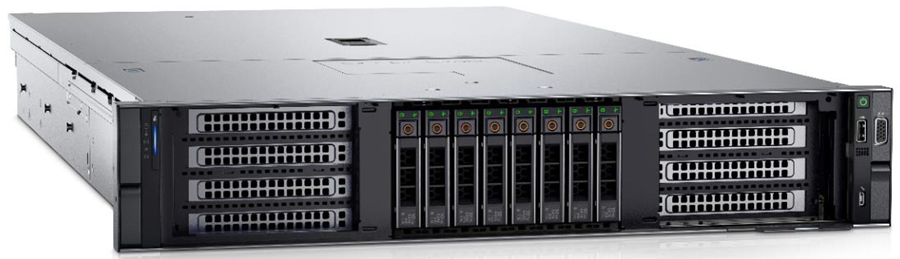
Figure 4. R760xa chassis showing “first class seats” for GPU at the front of the system
4th Generation DLC with leak detection
Dell’s latest generation of servers continue to expand on an already extensive support for direct liquid cooling (DLC). In fact, a total of 12 Dell platforms have a DLC option including an all-new offering of DLC in the MX760c. Dell’s 4th generation liquid cooling solution has been designed for robust operation under the most extreme conditions. If an excursion occurs, Dell has you covered. All platforms supporting DLC utilize Dell’s proprietary Leak Sensor solution. This solution is capable of detecting and differentiating small and large leaks which can be associated with configurable actions including email notification, event logging, and system shutdown.
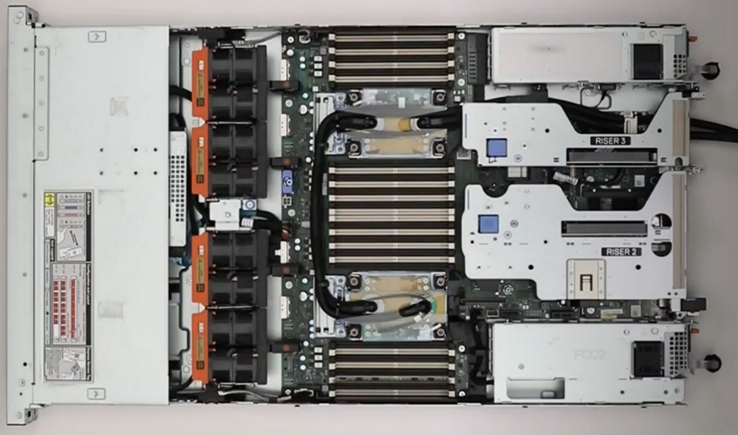
Figure 5. 2U chassis with Direct Liquid Cooling heatsink and tubing
Application optimized designs
Dell closely monitors not only the hardware configurations that customers choose but also the application environments they run on them. This information is used to determine when design changes might help customers to achieve a more efficient design for power and cooling with various workloads.
An example of this is in the Smart Flow designs discussed previously, in which engineers reduced the maximum storage potential of the designs to deliver more efficient air flow in configurations that do not require maximum storage expansion.
Another example is in the design of the “xs” (R650xs, R660xs, R750xs, and R760xs) platforms. These platforms are designed to be optimized specifically for virtualized environments. Using the R750xs as an example, it supports a maximum of 16 hard drives. This reduces the density of power supplies that must be supported and allows for the use of lower cost fans. This design supports a maximum of 16 DIMMs which means that the system can be optimized for a lower maximum power threshold, yet still deliver enough capacity to support large numbers of virtual machines. Dell also recognized that the licensing structure of VMware supports a maximum of 32 cores per license. This created an opportunity to reduce the power and cooling loads even further by supporting CPUs with a maximum of 32 cores which have a lower TDP than the higher core count CPUs.
Software design
As power and cooling requirements increase, Dell is also investing in software controls to help customers manage these new environments. iDRAC and Open Manage Enterprise (OME) with the Power Manager plug-in both provide power capping. OME Power Manager will automatically manipulate power based on policies set by the customer. In addition, iDRAC, OME Power Manager, and CloudIQ all report power usage to allow the customer the flexibility to monitor and adapt power usage based on their unique requirements.
Conclusion
As Server technology evolves, power and cooling challenges will continue. Fan power in air-cooled servers is one of largest contributors to wasted power. Minimizing fan power for typical operating conditions is the key to a thermally efficient server and has a large impact on customer sustainability footprint.
As the industry adopts liquid cooling solutions, Dell is ensuring that air cooling potentials are maximized to protect customer infrastructure investments in air cooling based data centers around the globe. The latest generation of Dell servers required advanced engineering simulations and analysis to improve system design to increase system airflow per unit watt of fan power, as compared to the previous generation of platforms, not only to maximize air cooling potential but to keep it efficient as well. Additional air-cooling opportunities are enabled with Smart Flow configurations – allowing higher CPU bins to be air cooled, as compared to the requirement for liquid cooling. A large number of thermal and power sensors have been implemented to manage both power and thermal transients using Dell proprietary adaptive closed loop algorithms that maximize cooling at the lowest fan power state and that protect systems at excursion conditions by closed loop power management.

Test Report: PowerEdge R760 with SQL Server
Fri, 03 Mar 2023 17:20:51 -0000
|Read Time: 0 minutes
Summary
The testing outlined in this paper was conducted in conjunction with Intel and Solidigm. Server hardware was provided by Dell, Processors and Network devices were provided by Intel, and Storage technology was provided by Solidigm. All tests were conducted in Dell Labs with contributions from Intel Performance Engineers and Dell System Performance Analysis Engineers.
The introduction of new server technologies allows customers to deploy new solutions using the newly introduced functionality, but it can also provide an opportunity for them to review their current infrastructure and determine whether the new technology might increase efficiency. With this in mind, Dell Technologies recently sponsored performance testing of a Microsoft SQL Server 2019 solution on the new Dell PowerEdge R760, and compared the results to the same solution running on the previous generation R750 to determine if customers could benefit from a transition.
Deciding which CPU to deploy with an advanced solution like SQL Server can be challenging. Customers looking for maximum performance would typically start with the most expensive CPU available while other customers might make a choice that offers a tradeoff between performance and price. With the evolution of new processor features such as Intel® Speed Select, and QAT, this choice can seem even more complicated. To reduce these complications, we decided to benchmark the new R760 with a lower cost processor that enables both Speed Select and QAT so that we can compare the results to an R750 using the top end Intel® Xeon® Platinum 8380 CPU.
Methodology
Testing was conducted in the Dell Systems Performance Analysis lab. To conduct the testing, we deployed MSFT SQL Server 2019 Enterprise Edition with HammerDB 4.5 on both systems as the benchmarking tool for On Line Transactional Processing (OLTP) to measure the New Operations per Minute (NOPM) performance of both, and compared the results. Next, we performed a backup of two different database configurations and measured the time required. Finally, we enabled QAT in the R760 and performed the same set of backups to determine the difference in time required.
Hardware configurations tested
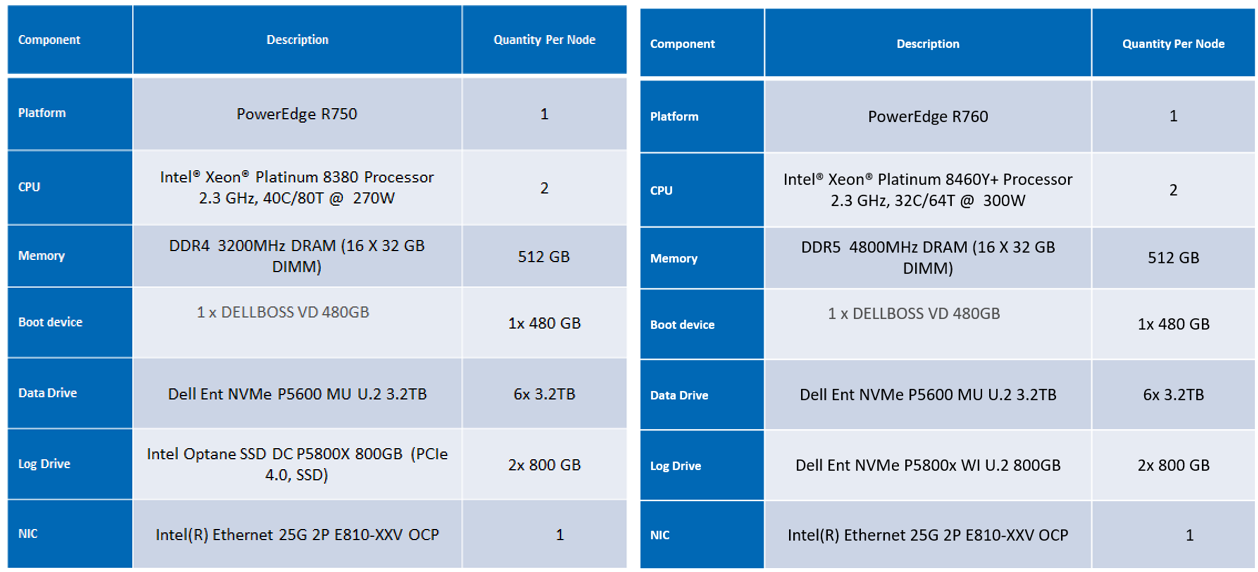
Note: The Dell Ent NVMe P5600 MU U.2 3.2TB Drives are manufactured by Solidigm.
Special features tested on the 4th Generation Intel® Xeon® Processor
The Platinum 8460Y was chosen for this test. This processor includes support for Intel® Speed Select Technology and Quick Assist Technology. For additional details about this processor, see Intel® Xeon® Platinum 8460Y Processor 105M Cache 2.00 GHz Product Specifications.
Intel® Speed Select Technology - Performance Profile[1]
This technology demonstrates a capability to configure the processor to run at three distinct operating points.
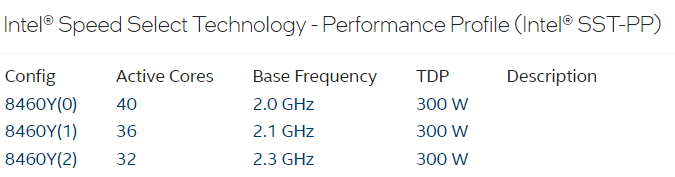
For this test, the Platinum 8460Y was configured for operation at 2.3Ghz which set the active cores to 32.
Intel® QuickAssist Technology (QAT)[2]
Intel® QAT saves cycles, time, space, and cost by offloading compute-intensive workloads to free up capacity. For this test, the time to conduct a backup of the database was measured with QAT off and QAT on.
Recommended customer pricing for the CPUs used in the tested configurations
(Based on pricing listed on Intel's website on January 11, 2023. Pricing may change without notice.)
R750 - Intel® Xeon® Platinum 8380 - $9,359
R760 - Intel® Xeon® Platinum 8460Y - $5,558
Price Delta:
R750 | R760 | CPU Price Delta |
$9,359.00 | $5,558.00 | -40.6% |
Source:
8380: Intel® Xeon® Platinum 8380 Processor 60M Cache 2.30 GHz Product Specifications
8460Y: Intel® Xeon® Platinum 8460Y Processor 105M Cache 2.00 GHz Product Specifications
Software configurations tested
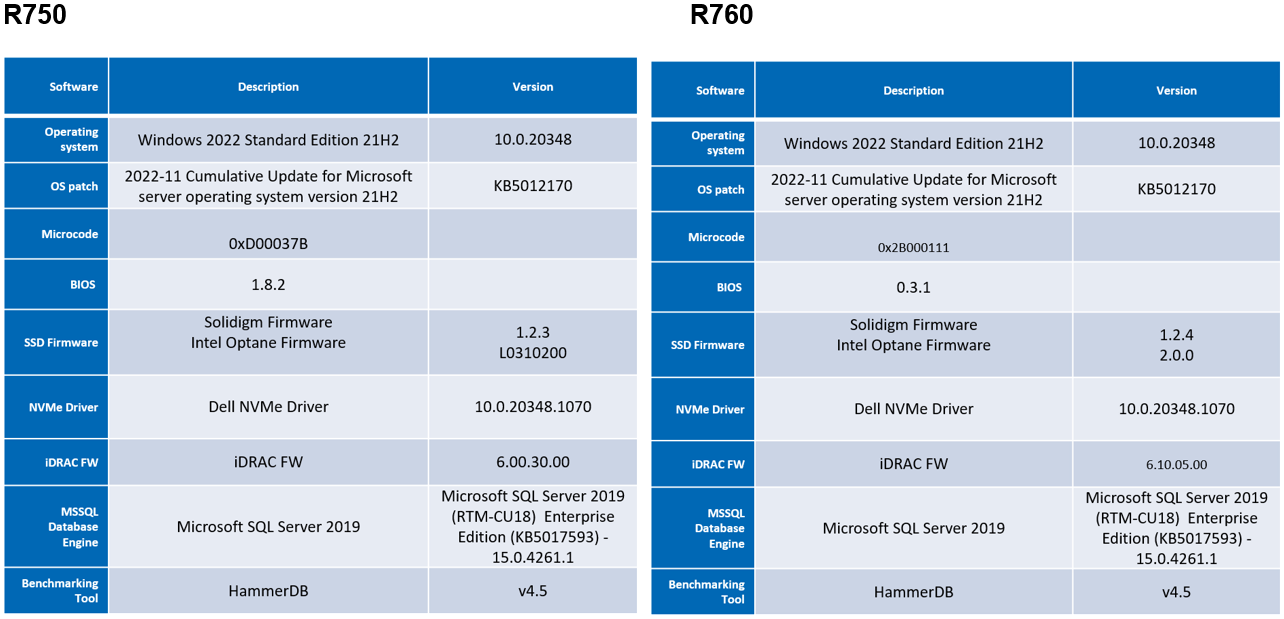
Test details
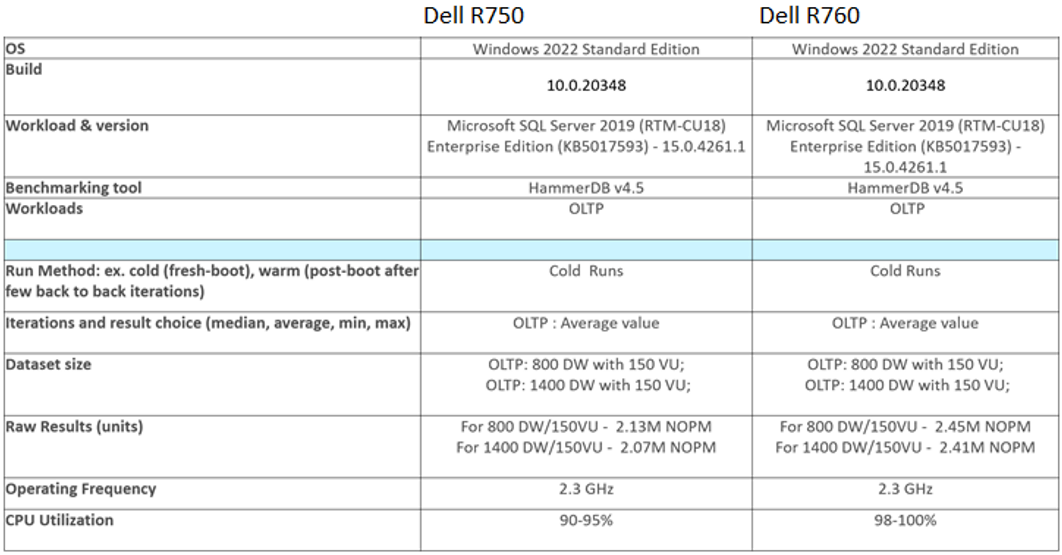
BIOS settings
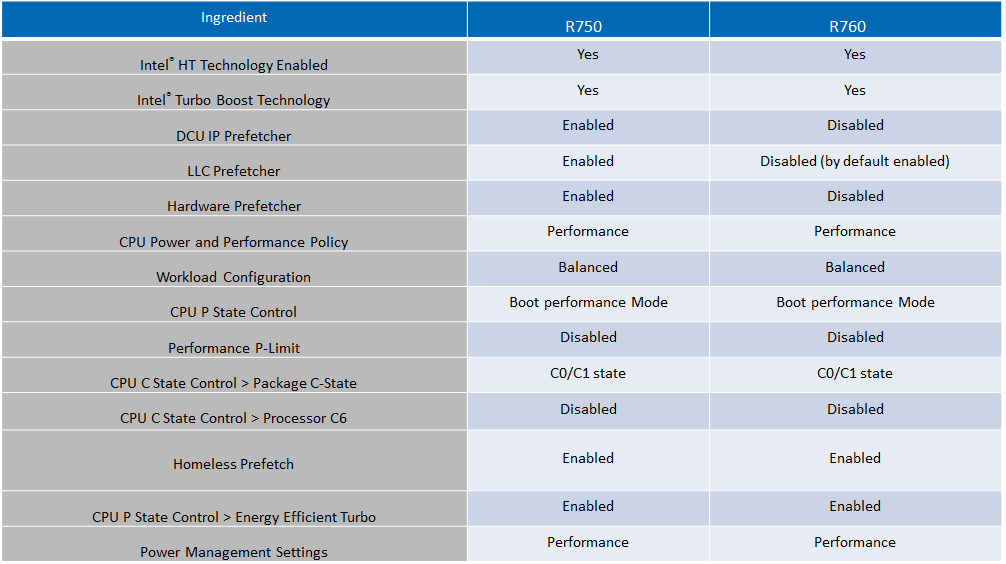
SQL Server settings
- Max server memory (MB): 460000 MB
- Min server memory (MB): 10240 MB
- Lightweight pooling: 1 (Enabled)
- Recovery interval: 32767
- Max degree of parallelism: 1
- Lightweight pooling: 1
- Default trace enabled: 0
- Priority boost: 1 (Enabled)
- Recovery interval (min): 32767
- Lock pages in memory: Enabled
- Max worker threads: 3000
Test results
All of the following results represent the average of five separate test runs.
NOPM Performance
Note: Higher is better
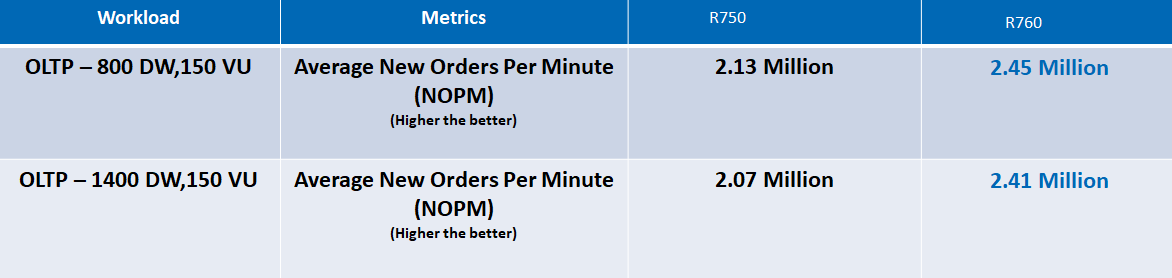

QAT Performance
Note: Lower is better
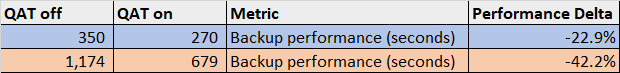
Conclusion
Choosing the right combination of Server and Processor can both increase performance as well as reduce cost. As this testing demonstrated, by using advanced features like Speed Select, the Dell PowerEdge R760 with 4th Generation Intel® Xeon® Platinum 8460Y CPU’s was up to 16% faster than the Dell PowerEdge R750 with 3rd Generation Intel® Xeon® Platinum 8380 CPU’s. Further, the R760 was able to accomplish this using CPU’s with a recommended Customer Price that was over 40% less.
The testing further demonstrated how Quick Assist Technology (QAT) could significant reduce backup times allowing key database services to bring services back online up to 42% faster after routine backups were performed.

Comparing the Performance and VDI User Density of the Dell PowerEdge R750 with the Dell PowerEdge R760
Fri, 03 Mar 2023 17:23:50 -0000
|Read Time: 0 minutes
Summary
The new Dell PowerEdge R760 with 4th Generation Intel® Xeon® Processors, offers customers the increased scalability and performance necessary to improve operation of their Virtual Desktop Infrastructure (VDI). The testing highlighted in this document was conducted (in November and December 2022 by Dell Engineers) to provide customers with insights on the capabilities of these new systems and to quantify the value that they can provide in a VDI environment. To accomplish this, performance was measured on a previous generation Dell PowerEdge R750 system and then compared to the results measured on the new Dell PowerEdge R760.
- The R750 server configuration reflects the guidance Dell Technologies provides customers, based on our rigorous test and profiling efforts for Dell Validated Designs.
- The R760 configuration tested was chosen to match the cost profile as closely as possible while also taking advantage of the increases in core count and memory performance delivered by this new generation of processors.
In this example, the R750 server used 28 core CPUs while the R760 used 32 core CPUs. The correlation between cores and memory drove the R760 configuration to use 2TB of RAM, as compared to the 1TB of RAM used in the R750.
VDI test tool used
Login VSI by Login Consultants is the de-facto industry standard tool for testing VDI environments and server-based computing (RDSH environments). It installs a standard collection of desktop application software (such as Microsoft Office, Adobe Acrobat Reader) on each VDI desktop. It then uses launcher systems to connect a specified number of users to available desktops within the environment. When the user is connected, the workload is started by a logon script which starts the test script after the user environment is configured by the login script. Each launcher system can launch connections to several ‘target’ machines (that is, VDI desktops).
VDI Test Methodology
To ensure the optimal combination of end-user experience (EUE) and cost-per-user, performance analysis and characterization (PAAC) on Dell VDI solutions is carried out using a carefully designed holistic methodology that monitors both hardware resource utilization parameters and EUE during load-testing.
Login VSI
For Login VSI, the launchers and Login VSI environment are configured and managed by a centralized management console. Additionally, the following login and boot paradigm is used:
- Users were logged in within a login timeframe of one hour.
- All desktops are pre-booted before logins can begin.
- We used a one-minute data collection interval.
Test configuration
The following table lists the hardware and software components of the infrastructure used for performance analysis and characterization testing.
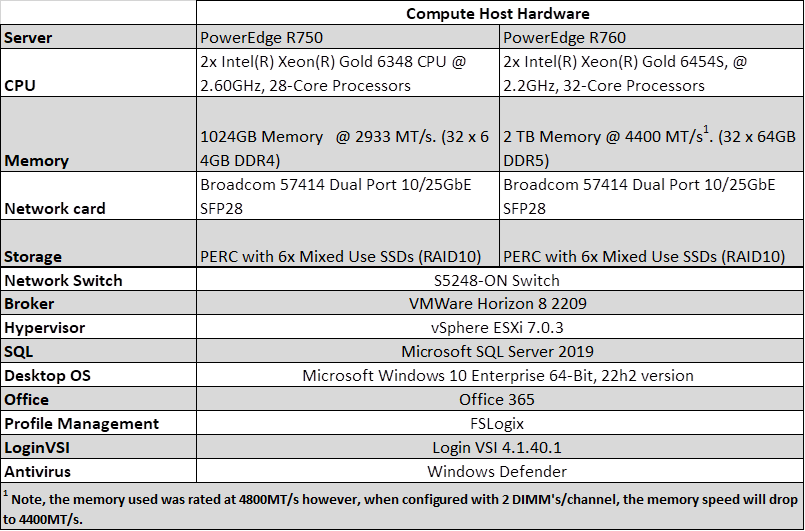
Profiles and workloads
For this test we used the following workload and profiles.
Workload | VM profiles | ||||
vCPUs | RAM | RAM reserved | Desktop video resolution | Operating system | |
Knowledge Worker | 2 | 4 GB | 2 GB | 1920 x 1080 | Windows 10 Enterprise 64-bit |
PowerEdge R750 vs. PowerEdge R760 comparison results
The following table summarizes the test results.
Server | Density per host | Avg. CPU % | Avg. memory consumed (GB) | Avg. memory active (GB) | Avg. net Mbps/user |
PowerEdge R750 | 183 | 85.05 | 733 | 236 | 207 |
PowerEdge R760 | 220 | 85.06 | 890 | 276 | 242 |
Conclusion
As shown in the results above, the R760 delivered over 20% more VDI users (220 vs.183) while performing at the same average CPU utilization level. While the core frequency of the R760 was lower, the increased core count allowed the system to expand the number of users while delivering a consistent performance level for the individual VDI sessions.
PowerEdge R760 ResNet50 Testing Overview and Results
Fri, 03 Mar 2023 17:20:51 -0000
|Read Time: 0 minutes
Summary
The testing outlined in this paper was conducted in conjunction with Intel and Solidigm. Server hardware was provided by Dell, processors and network devices were provided by Intel, and storage technology was provided by Solidigm. All tests were conducted in Dell Labs with contributions from Intel Performance Engineers and Dell System Performance Analysis Engineers.
With the introduction of the 4th Gen Intel® Xeon® Scalable processors, the new Dell PowerEdge R760 can benefit from important new features such as Advanced Matrix Extensions (AMX) to improve deep learning performance. To evaluate this, we recently tested the R760 using the TensorFlow framework with the ResNet50 (residual network) CNN model to determine the performance of these new features compared to previous generations of servers. This testing demonstrated more than 3x improvement in performance in the BF16 compared to FP32 precision and more than 2x improvement in performance compared to the previous generation R750 in INT8 precision.
Configurations tested
- BASELINE: Intel® Xeon Platinum 8380 (ICX Config): 4 Nodes, Each Node with 2x Intel® Xeon® Platinum 8380 Processor, 1x PowerEdge R750, Total Memory 1536 GB (16x 32GB + 16X64GB , DDR4 3200MHz), HyperThreading: Enabled, Turbo: Enabled, NUMA noSNC,, BIOS:Dell1.6.5 (ucode:0xd000375),Storage (boot): 1x 480 GB Micron SSD, Storage (cache): 2x 800 GB Intel® Optane™ DC SSD P5800X Series, Storage (capacity): 6x 3.2 TB SolidigmDC P5600 Series PCIe NVMe, Network devices: 1x Intel® Ethernet E810CQDA2 E810-CQDA2,at 100GbERoCEv2,Network speed: 100GbE, OS/Software: VMware 8.0, 20513097, Test by Dell & Intel as of 21/12/2022using Ubuntu Server 22.04 VM (vHW=20, vmxnet3), vSAN default policy (RAID-1, 2DG), Kernel 5.19.17, intel-optimized-tensorflow:2.11.0, ResNet50v1.5, Batch size=128, VM=80vCPU+96GBRAM
- SPRPlus: Intel® Xeon® Platinum 44 core Pre-Production Processors. 4 Nodes, Each Node with 2x Intel® Xeon® Platinum Pre-Production Processors, 1x PowerEdge R760, Total Memory 2048 GB (16x 128GB DDR5 4800MHz), HyperThreading: Enable, Turbo: Enabled, NUMA noSNC, BIOS: Dell 0.2.3.1(ucode:0x2b000081), Storage (boot):1x600GB Seagate Enterprise drive, Storage (cache): 2x 800 GB Intel® Optane™ DC SSD P5800X Series, Storage (capacity): 6x 3.2 TB Solidigm SSD DC P5600 Series PCIe NVMe, Network devices: 1x Intel® Ethernet E810CQDA2 E810-CQDA2,at 100GbERoCEv2,Network speed: 100GbE, OS/Software: VMware 8.0, 20513097, Test by Dell & Intel as of 11/21/2022using Ubuntu Server 22.04 (vHW=20, vmxnet3), vSANdefault policy (RAID-1, 2DG), Kernel 5.19.17, intel-optimized-tensorflow:2.11.0, ResNet50v1.5, Batch size=128, VM=88vCPU+96GBRAM
Security mitigations
The following security mitigations were evaluated and passed:
CVE-2017-5753, CVE-2017-5715, CVE-2017-5754, CVE-2018-3640, CVE-2018-3639, CVE-2018-3615, CVE-2018-3620, CVE-2018-3646, CVE-2018-12126, CVE-2018-12130, CVE-2018-12127, CVE-2018-11091, CVE-2018-11135, CVE-2018-12207, CVE-2020-0543, CVE-2022-0001, CVE-2022-0002
Systems architecture
Deep learning environments both process and generate large amounts of data. To facilitate this in our testing, we used a VMware vSAN 8 cluster to store all data.
Hypervisor, VM, and guest OS configuration
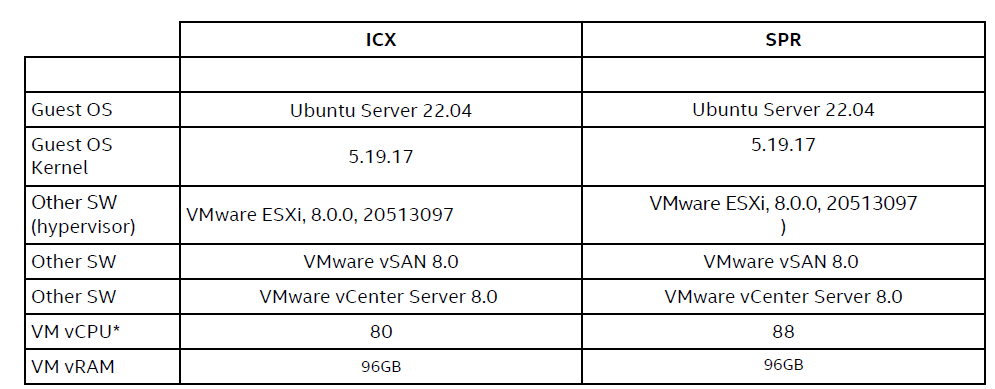
Benchmark configuration
Dell PowerEdge R750 Dell PowerEdge R760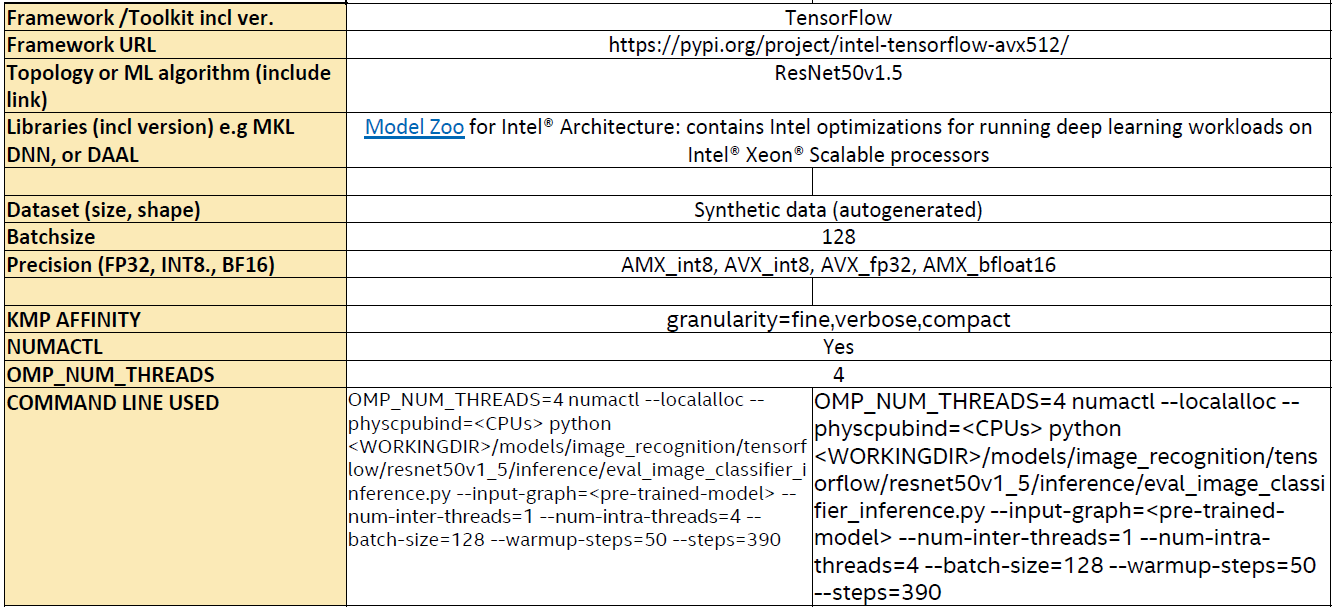
Test results
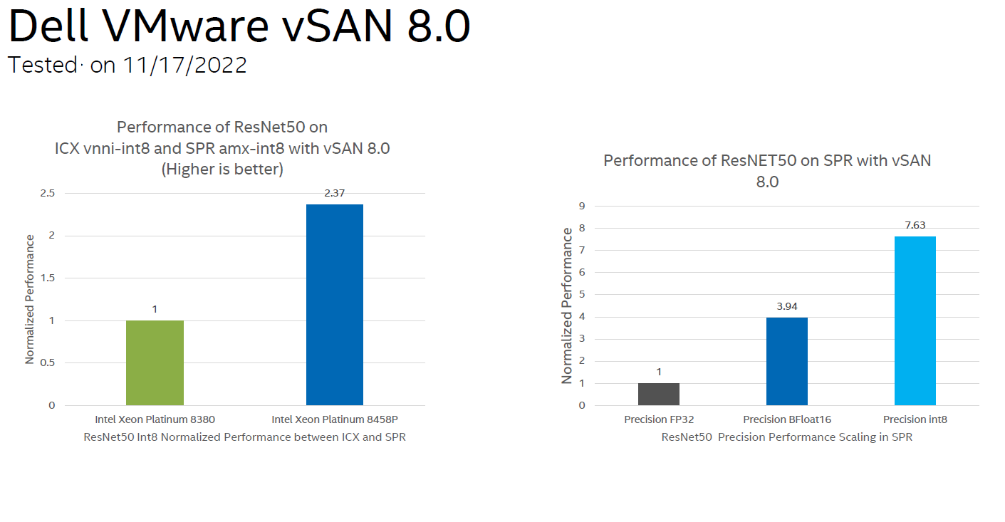
ICX – 3rd Gen Intel® Xeon® processors used in the R750
SPR – 4th Gen Intel® Xeon® processors used in the R760
Conclusion
The new Dell PowerEdge R760 with 4th Gen Intel® Xeon® processors delivers outstanding machine learning (ML) performance. Using the Intel® AMX features and AVX-512 instruction set delivers performance levels up to 2.37x better than previous generations. As customers look to expand their deployments of ML workloads, the combination of 4th Gen Intel® Xeon® processors and the innovative Dell PowerEdge R760 provide a cost-effective solution that does not require the addition of expensive GPU technologies.

Securing Critical AI Solutions with Fortanix
Tue, 17 Jan 2023 08:43:16 -0000
|Read Time: 0 minutes
Summary
This joint paper, written by Dell Technologies in collaboration with Intel, outlines the key components of the Intel® Security Solution for Fortanix Confidential AI and the available configurations based on the latest generation of Dell PowerEdge servers.
Introduction
Cybersecurity has become more tightly integrated into business objectives globally, with zero trust security strategies being established to ensure that the technologies being implemented to address business priorities are secure.
Organizations need to accelerate business insights and decision intelligence more securely as they optimize the hardware-software stack. In fact, the seriousness of cyber risks to organizations has become central to business risk as a whole, making it a board-level issue.
Data is your organization’s most valuable asset, but how do you secure that data in today’s hybrid cloud world? How do you keep your sensitive data or proprietary machine learning (ML) algorithms safe with hundreds of virtual machines (VMs) or containers running on a single server?
The Intel® Security Solution for Fortanix Confidential AI, built in collaboration with Fortanix and Dell Technologies, helps contribute to your zero trust security strategy. It is an enterprise-level, high-performance, security-enabled solution that encrypts data while it is in use by isolating data and code in Intel® Software Guard Extension (Intel® SGX) enclaves, without changing underlying software applications.
Key components
- Intel® Software Guard Extensions (Intel® SGX)—A set of security-related instruction codes that isolates software and data from the underlying infrastructure (hardware or operating system) in hardware enclaves. Intel® SGX helps defend against common software-based attacks and helps protect intellectual property (like models) from being accessed and reverse-engineered by hackers or cloud providers.
- Fortanix Confidential Computing Manager—A comprehensive turnkey solution that manages the entire confidential computing environment and enclave life cycle. No application rewriting is required. Fortanix Confidential Computing Manager manages and enforces security policies including identity verification, data access control, and attestation.
- Fortanix Confidential AI—An easy-to-use subscription service that provisions security-enabled infrastructure and software to orchestrate on-demand AI workloads for data teams with a click of a button. Data teams can operate on sensitive datasets and AI models in a confidential compute environment supported by Intel® SGX enclave, with the cloud provider having no visibility into the data, algorithms, or models.
- Dell PERC H755N NVM Express (NVMe) RAID controller with self-encrypting drives (SEDs)—A RAID controller that provides additional security for stored data. Whether drives are lost, stolen, or failed, unauthorized access is prevented by rendering the drive unreadable without the encryption key within the storage controller. The PERC H755N controller offers additional benefits including regulatory compliance and secure decommissioning. It supports local key management (LKM) and external key management systems through Dell OpenManage Secure Enterprise Key Manager (SEKM).
Solution benefits
The Intel® Security Solution for Fortanix Confidential AI enables confidential computing so that AI models and data can be shared without exposing intellectual property and sensitive data. This solution:
- Delivers a turnkey, enterprise-level, and high-performance security solution without requiring application modifications
- Addresses time-to-market concerns by providing a validated solution with an installation guide, containerized tools, and sample workloads
Whether you are deploying on-premises in the cloud, or at the edge, it is increasingly critical to protect data and maintain regulatory compliance. Accelerate performance across the fastest-growing workload types in AI, analytics, networking, storage and HPC, and help protect your business and innovate with confidence.
Available configurations
Table 1. Intel® Security Solution for Fortanix Confidential AI configurations
Component | Base configuration | Plus configuration* |
Platform | Dell PowerEdge R650 1U rack server, supporting up to 8 NVMe drives in RAID configuration | |
CPU | 2 x Intel® Xeon® Gold 6348 (28 cores at 2.6 GHz) with 64 GB/CPU Intel® SGX enclave capacity | 2 x Intel® Xeon® Platinum 8368 (38 cores at 2.4 GHz) with 512 GB/CPU Intel® SGX enclave capacity |
DRAM | 256 GB (16 x 16 GB DDR4-3200) | 512 GB (16 x 32 GB DDR4-3200) (supports options up to 4 TB) |
Boot device | Dell Boot Optimized Server Storage (BOSS)-S2 with 2 x 480 GB M.2 Serial ATA (SATA) (RAID 1) | |
Storage adapter | Dell PERC H755N front NVMe RAID controller | |
Storage | 2 x (up to 8 x) 1.6 TB Enterprise NVMe Mixed Use AG SED Drive, U2 Gen4 | |
NIC | Intel® Ethernet Network Adapter E810-XXV for OCP3 (dual-port 25 Gb) | |
* Larger enclave capacity for securing bigger AI models and end-to-end AI workloads
Learn More
Contact your Dell or Intel account team for a customized quote. 1-877-ASK-DELL.

Scaling and Optimizing ML in Enterprises
Tue, 16 May 2023 19:53:46 -0000
|Read Time: 0 minutes
Summary
This joint paper, written by Dell Technologies, in collaboration with Intel®, describes the key hardware considerations when configuring a successful MLOps deployment and recommends configurations based on the most recent 15th Generation Dell PowerEdge Server portfolio offerings.
Today’s enterprises are looking to operationalize machine learning to accelerate and scale data science across the organization. This is especially the case as their needs grow to deploy, monitor, and maintain data pipelines and models. Cloud native infrastructure, such as Kubernetes, offers a fast and scalable means to implement Machine Learning Operations (MLOps) by using Kubeflow, an open source platform for developing and deploying Machine Learning (ML) pipelines on Kubernetes.
Dell PowerEdge R650 servers with 3rd Generation Intel® Xeon® Scalable processors deliver a scalable, portable, and cost-effective solution to implement and operationalize machine learning within the Enterprise organization.
Key Considerations
- Portability. A single end-to-end platform to meet the machine learning needs of various use cases, including predictive analytics, inference, and transfer learning.
- Optimized performance. High-performance 3rd Generation Intel® Xeon® Scalable processors optimize performance for machine learning algorithms using AVX-512. Intel® performance optimizations that are built into Dell PowerEdge servers can help fine-tune large Transformers models across multi-node systems. These work in conjunction with open-source cloud native MLOps tools. Optimizations include Intel® and open-source software and hardware technologies such as Kubernetes stack, AVX-512, Horovod for distributed training, and Tensorflow 2.10.0.
- Scalability. As the machine learning workload grows, additional compute capacity needs to be added to the cloud native infrastructure. Dell PowerEdge R750 servers with 3rd Generation Intel® Xeon® Scalable processors deliver an efficient and scalable approach to MLOps.
Recommended Configurations
Cluster | ||
| Control Plane Nodes (Three Nodes Required) | Data Plane Nodes (4 Nodes or More) |
Functions | Kubernetes services | Develop, Deploy, Run Machine Learning (ML) workflows |
Platform | Dell PowerEdge R650 up to 10x 2.5” NVMe Direct Drives | |
CPU | 2x Intel® Xeon® Gold 6326 processor (16 cores @ 2.9GHz), or better | 2x Intel® Xeon® Platinum 8380 processor (40 cores at 2.3 GHz), or 2x Intel® Xeon® Platinum 8368 processor (38 cores @ 2.4GHz), or Intel® Xeon® Platinum 8360Y processor (36 cores @ 2.4GHz) |
DRAM | 128 GB (16x 8 GB DDR4-3200) | 512 GB (16x 32 GB DDR5-4800) |
Boot device | Dell Boot Optimized Server Storage (BOSS)-S2 with 2x 240GB or 2x 480 GB Intel® SSD S4510 M.2 SATA (RAID1) | |
Storage adapter | Not required for all-NVMe configuration. | |
Storage (NVMe) | 1x 1.6TB Enterprise NVMe Mixed- Use AG Drive U.2 Gen4 | 1x 1.6TB (or larger) Enterprise NVMe Mixed-Use AG Drive U.2 Gen4 |
NIC | Intel® E810-XXVDA2 for OCP3 (dual-port 25GbE) | Intel® E810-XXVDA2 for OCP3 (dual-port 25GbE), or Intel® E810-CQDA2 PCIe (dual-port 100Gb) |
Resources
Visit the Dell support page or contact your Dell or Intel account team for a customized quote 1-877-289-3355.

Powering Your Elasticsearch on Kubernetes
Tue, 17 Jan 2023 08:32:07 -0000
|Read Time: 0 minutes
Summary
This joint paper, written by Dell Technologies, in collaboration with Intel®, describes the key hardware considerations when configuring a successful Elasticsearch deployment and recommends configurations based on the most recent 15th Generation PowerEdge Server portfolio offerings.
Elasticsearch is a distributed, open-source search and analytics engine for all types of data, including textual, numerical, geospatial, structured, and unstructured. This proposal contains recommended configurations for Elasticsearch clusters on the Kubernetes platform (Red Hat OpenShift Container Platform with Elastic Cloud on Kubernetes (ECK) operator) running on 15th Generation Dell PowerEdge with 3rd Generation Intel® Xeon® Scalable processors (Ice Lake).
Key Considerations
- Faster and scalable performance. Elasticsearch running on the latest Dell PowerEdge servers is built on high- performing Intel® architecture and configured with 3rd Generation Intel® Xeon® Scalable processors. Indexing is faster and capacity can scale with your needs.
- Index more data. Elasticsearch can handle and store more data by increasing DRAM capacity and using PCIe Gen 4 NVMe disk drives attached to Dell PowerEdge servers.
- Reduced search times and increased # of concurrent searches. As data grows and needs to be accessed across the cluster, data-access response times are critical, especially for real-time analytics applications. Elasticsearch, running on the latest Dell PowerEdge servers, is built on high-performing Intel® architecture. Intel® Ethernet network controllers, adapters, and accessories enable agility in the data center and support high throughput and low latency response times.
- Easy and secure installation. The Elastic Cloud on Kubernetes (ECK) operator is an official Elasticsearch operator certified on Red Hat OpenShift Container Platform, providing easy deployment, management, and operation of Elasticsearch, Kibana, APM Server, Beats, and Enterprise Search on OpenShift clusters. Elasticsearch clusters deployed using this operator are secure by default (with enabled encryption and strong passwords).
- Multi Data Tiers. As data grows, costs do not have to. With multiple tiers of data, capacity can extend, and storage costs can be driven lower without performance loss. Each capacity layer can be scaled independently by using larger drives or mode nodes (or both), depending on customer needs.
Available Configurations
Elasticsearch cluster on Kubernetes (Red Hat OpenShift Kubernetes) platform | ||||
| OpenShift Control Plane Master Nodes (three nodes required) | Elasticsearch Master / Ingest / Hot tier data nodes (minimum of three nodes required) |
Elasticsearch Warm tier data nodes (optional) |
Elasticsearch Cold tier data nodes (optional) |
Functions |
OpenShift services, Kubernetes services | Elasticsearch roles: master, ingest, hot tier data Additional services, such as Kibana |
Elasticsearch roles: warm tier data |
Elasticsearch roles: cold tier data |
Platform |
Dell PowerEdge R650 chassis with up to 10x2.5” NVMe Direct Drives | Dell PowerEdge R750 chassis with up to 12x3.5” HDD with RAID | ||
CPU | 2 x Intel® Xeon® Gold 6326 processor (16 cores @ 2.9GHz) or better |
2 x Intel® Xeon® Gold 6338 processor (32 cores @ 2.0GHz) |
2 x Intel® Xeon® Gold 5318Y processor (24 cores @ 2.1GHz) |
2 x Intel® Xeon® Gold 5318N processor (24 cores @ 2.1GHz) |
DRAM | 128GB (16x 8GB DDR4- 3200) |
256 GB (16 x 16 GB DDR4-3200) | 128 GB (16 x 8 GB DDR4-3200) | |
Boot Device | Dell BOSS-S2 with 2x 240GB or 2x 480GB M.2 SATA SSD (RAID1) | |||
Storage adapter |
Not needed for all-NVMe configurations | Dell PERC H755 SAS/SATA RAID adapter | ||
Storage (NVMe) |
1x 1.6TB Enterprise NVMe Mixed-Use AG Drive U.2 Gen4 |
2x (up to 10x) 3.2TB Enterprise NVMe Mixed-Use AG Drive U.2 Gen4 |
10x 7.68TB Enterprise NVMe Read-Intensive AG Drive U.2 Gen4 |
up to 12x 16TB / 18TB / 20TB 12Gbps SAS ISE 3.5” HDD, 7200RPM |
NIC | Intel E810-XXVDA2 for OCP3 (dual-port 25GbE) | |||
Note: This document may contain language from third-party content that is not under Dell Technologies’ control and is not consistent with current guidelines for Dell Technologies’ own content. When such third-party content is updated by the relevant third parties, this document will be revised accordingly.
Resources
For more information:
- Contact your Dell or Intel® account team for a customized quote, at 1-877-ASK-DELL (1-877-275-3355).
- See the following documents:
Elastic Cloud on Kubernetes is now a Red Hat OpenShift Certified Operator

Top 5 Reasons to Migrate to the PowerEdge T550 from the Previous-Generation T440 and T640
Tue, 17 Jan 2023 08:25:05 -0000
|Read Time: 0 minutes
Summary
The Dell EMC PowerEdge T550 is the next-generation performance mainstream tower by Dell Technologies. By consolidating the most valuable features from the previous-generation T440 and T640, the T550 is offered as the successor intended to run performance use cases and workloads in medium businesses, Edge, ROBO and enterprise data centers. This DfD will inform readers on how decision making led to merging the T440 and T640 into the T550, as well as give five top reasons why customers will be excited to transition over to this new powerhouse - the T550.
Merging the T440 and T640
Development of the PowerEdge T550 heavily focused on aligning what it would offer to what customers actually used in ROBO, Edge, SMB, and enterprise datacenter environments. Sales data from the previous-generation T440 and T640 were often used to navigate decision-making and generally pointed to a clear, general consensus. A few examples are below:
- GPU attach rates on the more-capable T640 were rarely populated in full, resulting in under-utilized space
- Specific desirable features in the T640, such as NVMe support, were not present in the T440
- Top bin CPU support was not present in the T440
These observations allowed engineering to refine what the next performance mainstream PowerEdge tower would look like. By eliminating the less desirable features and keeping the most valuable ones, the T550 has essentially merged both of its predecessors into a handcrafted, next-generation powerhouse. The remainder of this DfD will highlight the top five reasons why we believe our customers will benefit from transitioning over to the T550, a few of which are direct results from the merger.
*Please note that the T640 lifecycle is extended to mid-2022 for customers who choose to stay on 2nd Generation Xeon®, and the T440 lifecycle is extended until mid-2023 for customers who choose to bridge from 2nd Generation Xeon® to 4th Generation Xeon®
Figure 1 – Side angle of the sleek, new PowerEdge T550
Five Most Valuable Impacts
3rd Generation Intel® Xeon® Scalable Processors
The 3rd Generation Intel® Xeon® Scalable processor family was designed to generate higher productivity and operational efficiency for dense workloads, such as AI, ML/DL and HPC. In addition to full-stack support for the T550, various architectural design refinements have returned significant performance improvements across multiple benchmarks, including:
- SPECrate 2017 (a throughput measurement metric) observed a 57.1% performance improvement for Floating Point when compared to 2nd Generation Xeon, as published here
- SPECspeed 2017 (a time-based measurement metric) observed a 50.3% performance improvement for Floating Point when compared to 2nd Generation Xeon, as published here
- Gen-on-Gen performance improvement average of 1.46x, as observed by Intel
Top-of-the-line features are integrated into 3rd Generation Xeon Scalable CPUs to give users more functionality. Enhanced Speed Select Technology (SST) functionalities, including base frequency, core power, and turbo frequency, offers a finer control over CPU performance for cost optimization. Intel Software Guard Extensions (SGX) offers maximum privacy and protection by encrypting sections of memory to create highly secured environments to store sensitive data.
3200 MT/s Memory Speed
Memory speeds have risen by 20% over the previous-generation T440 and T640, increasing from 2666 MT/s to 3200 MT/s. Additionally, the number of supported memory slots has jumped from 6 to 8 – a 33% increase in DIMM capacity. Allowing more data to be stored in memory, with faster DIMM speeds, will significantly reduce data transfer times for memory-intensive workloads like databases, CRM, ERP, or Exchange.
PowerEdge Enterprise Features
The PowerEdge advantage lies within the robust environment offered to enterprise customers. The PowerEdge Raid Controller 11 (PERC11) now provides NVMe HW RAID, granting users the ability to back up data from their most powerful storage devices. In addition to hard drives, fans, PSUs, and Internal Dual SD Modules (IDSDM), hot-plug support is now also offered for front access BOSS (2x M.2 internal), allowing the server to keep running when a critical component swap is needed. Even the T550s smaller form factor (10% less volume than T440 and 15% less volume than T640) now allows GPUs to be used in tower format, so that max performance can be achieved whether in the datacenter or in the office closet.
Legacy Boot support has been deprecated by Intel and replaced with the superior UEFI Secure Boot (Unified Extensible Firmware Interface), which has better programmability, greater scalability, and higher security. UEFI Secure Boot also provides faster booting times and support for 9ZB, while legacy BIOS is limited to 2.2TB boot drives. Lastly, although not a newly supported feature, customers can continue to optimize server management with iDRAC9 (Integrated Dell Remote Access Controller), which provides administrators with an abundance of server operation information to a dashboard screen that can be remotely accessed and managed. Countless operational conditions are always monitored, giving small businesses more flexibility to allocate limited resources and manpower elsewhere.
PCIe Gen4
Support for five slots of PCIe Gen4, the fourth iteration of the PCIe standard, is now included. Compared to PCIe Gen3, the throughput per lane doubles from 8GT/s to 16GT/s, effectively cutting transfer times in half for data traveling from PCIe devices to CPU. This feature will be extremely effective for customers adopting dense components, like NVMe drives or GPUs.
MVP (Most Valuable Peripherals)
Decision making for peripheral support came as a direct result from the T440 and T640 merger. Sales data indicated what customers valued most, and the T550 achieved a perfectly balanced blend of storage, PCIe and GPU capability. To begin, the number of storage devices supported was met in the middle, with availability for up to 24x SAS/SATA drives (T440 maxed out at 16x, and the T640 maxed out at 32x). This also includes NVMe drives support, with the inclusion of an 8x SAS/SATA + 8x NVMe configuration! *Note that customers seeking 32x SAS/SATA drives can still leverage the T640 tower until mid-2022, or R740xd2 rack if that is a better suited solution.
The number of PCIe slots were also blended, with five slots available for x16 PCIe Gen4, and one slot available for x8 PCIe Gen3. This is a great compromise, as customers will still be receiving more total lanes (88 lanes on T550 vs. 64 lanes on T640). Lastly, after observing low GPU attach rates on the T640, the T550 offers up to 2x DW or 5x SW GPUs – a much more accurate representation of what customers have been using for AI/HPC workload support. The latest and greatest GPU models are now supported, including the NVIDIA T4, A10, A30 and A40. Lastly, NVLink bridging can now be utilized to create a high-bandwidth link between compatible GPUs! This will drive performance for workloads like databases, virtualization, and medium duty AI/ML.
Performance Comparison
Dell Technologies commissioned Grid Dynamics to validate the performance uplift for various T550 use cases when compared to the previous-generation T640. Figures 2-4 below illustrate just a few examples of the boosted performance seen on the T550. The full whitepaper can be seen here.
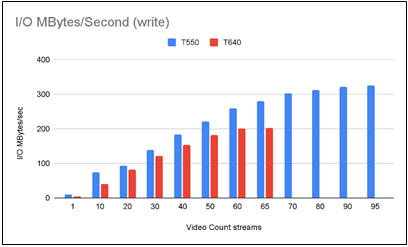
Figure 2 – I/O operations comparison for processing the same amount of retail video streams. The T550 does I/O writing 26.26% faster than T640.
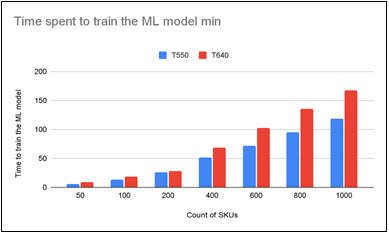
Figure 3 – Comparison of time spent to train an ML model depending on the number of SKUs for retail inventory decision making. The T550 uses 25.77% less time to train the ML model than T640.
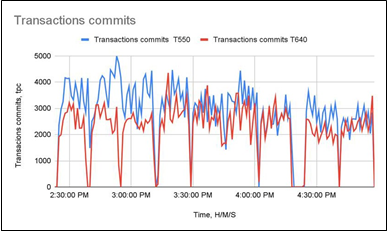
Figure 4 – Comparison of transactions committing speed when measuring database-related operations over a VM. The speed of transaction commits is 19.8% higher on the T550 compared to T640.
Final Words
The PowerEdge T550 has been handcrafted to offer a wide array of customers the most valuable features and support for performance workloads such as data analytic, virtualization, and medium duty AI/ML, in addition to more mainstream workloads such as collaboration, database, and CRM.

Driving Advanced Graph Analytics with TigerGraph
Tue, 17 Jan 2023 08:15:09 -0000
|Read Time: 0 minutes
Summary

This joint paper, written by Dell Technologies, in collaboration with Intel®, describes the key hardware considerations when configuring a successful graph database deployment and recommends configurations based on the most recent 15th Generation PowerEdge Server portfolio offerings. TigerGraph helps make graph technology more accessible. TigerGraph 3.x is democratizing the adoption of advanced analytics with the Intel® 3rd Generation Intel® Xeon® Scalable Processors by enabling non-technical users to accomplish as much with graphs as the experts do. TigerGraph is a native parallel graph database purpose-built for analyzing massive amounts (terabytes) of data.
Key Industries and Use Cases
Manufacturing/Supply Chain -- Delays in orders or shipments that can’t reach their final destination translate to poor customer experience, increased customer attrition, financial penalties for delivery delays, and the loss of potential customer revenue.
With the mounting strains on global supply chains, companies are now investing heavily in technologies and processes that enhance adaptability and resiliency in their supply chains.
Real-time analysis of supply and demand changes requires expensive database joins across the table with the data for suppliers, orders, products, locations, and with the inventory for parts and sub-assemblies. Global supply chains have multiple manufacturing partners, requiring integration of the external data from partners with the internal data. TigerGraph, Intel®, and Dell Technologies provide a powerful graph engine to find product relations and shipping alternatives for your business needs.
Financial Services -- Fraudsters are getting more sophisticated over time, creating a network of synthetic identities combined with legitimate information such as social security or national identification number, name, phone number, and physical address. TigerGraph solutions on 3rd Generation Intel® Xeon® Scalable Processors help you isolate and identify issues to keep your business safe.
Recommendation Engines -- Every business faces the challenge of maximizing the revenue opportunity from every customer interaction. Companies that offer a wide range of products or services face the additional challenge of matching the right product or service based on immediate browsing and search activity along with the historical data for the customer. TigerGraph’s Recommendation Engine on 3rd Generation Intel® Xeon® Scalable Processors powers purchases with increased click-through results, leading to higher average order value and increased per-visit spending by your shoppers.
Dell PERC H755N NVMe RAID controller with Self-Encrypting Drives (SED) provides additional security for stored data. Whether drives are lost, stolen, or failed, unauthorized access is prevented by rendering the drive unreadable without the encryption key. It also offers additional benefits including regulatory compliance and secure decommissioning. The PERC H755N controller supports Local Key Management (LKM) and external key management systems with Secure Enterprise Key Manager (SEKM).
Available Configurations
Cost-Optimized Configuration | |
Platform | PowerEdge R650 supporting up to 8 NVMe drives in RAID config |
CPU* | 2x Intel® Xeon® Gold 5320 processor (26 cores, 2.2GHz base/2.8GHz all core turbo frequency) |
DRAM | 256 GB (16x 16 GB DDR4-3200) |
Boot device | Dell BOSS-S2 with 2x 240GB or 2x 480GB M.2 SATA SSD (RAID1) |
Storage adapter | Dell PERC H755N Front NVMe RAID Controller |
Storage | 2x (up to 8x) 1.6TB Enterprise NVMe Mixed Use AG SED Drive, U2 Gen4 |
NIC | Intel® E810-XXVDA2 for OCP3 (dual-port 25Gb) |
* The Intel® Xeon® Gold 5320 processor supports only DDR4-2933 memory speed.
Balanced Configuration | |
Platform | PowerEdge R650 supporting up to 8 NVMe drives in RAID config |
CPU | 2x Intel® Xeon® Gold 6348 processor (28 cores, 2.6GHz base/3.4GHz all core turbo frequency) |
DRAM | 512 GB (16x 32 GB DDR4-3200) |
Boot device | Dell BOSS-S2 with 2x 240GB or 2x 480GB M.2 SATA SSD (RAID1) |
Storage adapter | Dell PERC H755N Front NVMe RAID Controller |
Storage | 2x (up to 8x) 1.6TB Enterprise NVMe Mixed Use AG SED Drive, U2 Gen4 |
NIC | Intel® E810-XXVDA2 for OCP3 (dual-port 25Gb) |
High-Performance Configuration | |
Platform | PowerEdge R650 supporting up to 8 NVMe drives in RAID config |
CPU | 2x Intel® Xeon® Platinum 8360Y processor (36 cores, 2.4GHz base/3.1GHz all core turbo frequency) with Intel® Speed Select technology |
DRAM | 1 TB (32x 32 GB DDR4-3200) |
Boot device | Dell BOSS-S2 with 2x 240GB or 2x 480GB M.2 SATA SSD (RAID1) |
Storage adapter | Dell PERC H755N Front NVMe RAID Controller |
Storage | 2x (up to 8x) 1.6TB Enterprise NVMe Mixed Use AG SED Drive, U2 Gen4 |
NIC | Intel® E810-XXVDA2 for OCP3 (dual-port 25Gb), or Intel® E810-CQDA2 PCIe (dual-port 100Gb) |
Resources
For more information:
- Visit the Dell support page or contact Dell for a customized quote 1-877-289-3355. You can also visit Dell and Intel Innovating for Today and Tomorrow.
- Read:
- Introducing TigerGraph DB the First Native Parallel Graph
- Connect, Analyze and Learn from Data with TigerGraph
- New Benchmark Shows TigerGraph’s Capacity To Handle Big Datasets

New PowerEdge T150 Overview
Tue, 17 Jan 2023 08:06:43 -0000
|Read Time: 0 minutes
Summary
After nearly three years, Dell Technologies has released the new PowerEdge T150 the entry level 1S tower server designed to power value workloads and applications for budget-conscious customers that prioritize reduced costs over expanded feature sets. This DfD was written to inform readers on what new capabilities they can expect from the PowerEdge T150, including coverage of the product features, systems management, security, and value proposition explaining which use cases are best suited for small businesses looking to invest in this value tower server.
Market Positioning
The PowerEdge T150 was designed to be the most economical entry within the single-socket 1U PowerEdge tower server space. Small businesses requiring the most affordable tower server, while still receiving the enterprise features and high-quality experience that the PowerEdge brand is known for, will gain the most from this offering.
In addition to being the lowest-cost PowerEdge tower server, the T150s diminutive footprint presents another value proposition – it is also the smallest PowerEdge tower offering at 14.17H x 6.89W x
17.9D (28.6 Liters). Customers seeking to occupy tight spaces in their Edge or ROBO environments can benefit from this small form factor to utilize every bit of space available. In layman’s terms, the T150 can be deployed where most other towers cannot. Regardless of where deployed – the PowerEdge T150 delivers new levels of performance, flexibility and affordability that will help drive both business and organizational success to SMB customers.
Expanded Product Features
Intel® Xeon® E-2300 Processors
Perhaps the most notable hardware addition to the PowerEdge T150 is the inclusion of Intel’s latest Xeon® E-2300 processor family. This uses the Cypress Cove CPU microarchitecture; offering a 19% increase of IPC (instructions per cycle) while also increasing IGP cores, L1 cache speeds and L2 cache speeds, when compared to previous generation Xeon® E-2200 processors. These performance increases, in tangent with other new features listed below, allow for up to 28% faster IO speeds when compared to the previous generation PowerEdge T140.
Memory
Memory capabilities have vastly improved, with the latest Xeon® E- series memory controllers now supporting up to four DDR4 UDIMMs at 3200MT/s (a 20% increase over the previous generation). The supported DIMM capacity has also doubled from 16GB to 32GB. Having twice as much data stored in faster DIMMs will significantly reduce data transfer times, resulting in increased productivity.
Storage/RAID
Support for up to four 2.5”/3.5” SATA/SAS drives is offered. Additionally, vSAS (Value SAS) SSD support has been expanded to provide more options to further offer an affordable, performance SSD tier. Drives can be configured with Dell Technologies BOSS-S1 and PERC SW/HW RAID solutions, and can be mapped to add-in cards such as the S150, H345/H355, H745/H755 and HBA355i.
I/O
Another major improvement is newly added support for one slot of PCIe Gen4 - the fourth iteration of the PCIe standard. Compared to PCIe Gen3, the throughput per lane doubles from 8GT/s to 16GT/s, effectively cutting transfer times in half for data traveling from storage to CPU.
Power/Cooling
Only one power supply unit is required to run the power-optimized PowerEdge T150 – both the 300W AC Cabled Bronze and 400W AC Cabled PSU are supported offerings. Non-hot swap fans reside in the middle of the chassis to cool the components that generate the most heat – a design intent focusing on power and cooling optimization.
Manageability (Size, Weight and Acoustics)
The tower dimensions are identical to the previous-gen PowerEdge T140, with dimensions of
14.17”H x 6.89”W x 17.9”D. The maximum weight with all drives populated is extremely light, at
11.68kg (or 25.74lb), allowing for easy relocation. Lastly, the acoustics were tailored to be most fitting for quiet environments, such as on a desk around a seated user’s head height, coming in at 25dBA for each work case, so any noise created is practically inaudible in office environments. These various chassis measurements are ideal for storefront, office and ROBO locations.
Figure 1 – Side angle of the sleek, new PowerEdge T150
Simple and Intuitive Systems Management
Managing the PowerEdge T150 is simple and intuitive with the Dell integrated systems management tool – iDRAC9 (Integrated Dell Remote Access Controller). iDRAC9 is a hardware device containing its own processor, memory and network interface that provides administrators with an abundance of server operation information to a dashboard screen that can be remotely accessed and managed. Operational conditions such as temperatures, fan speeds, chassis alarms, power supplies, RAID status and individual disk status are always monitored, giving small businesses more flexibility to allocate limited resources elsewhere.
Exceptional Security
Legacy Boot support has been deprecated by Intel® and replaced with the superior UEFI (Unified Extensible Firmware Interface) Secure Boot, which has better programmability, greater scalability, and higher security. UEFI Secure Boot also provides faster booting times and support for 9ZBs, while legacy BIOS is limited to 2.2TB boot drives. Customers who purchase the latest Xeon® E-2300 processors will also inherit Intel SGX (Software Guard Extensions) baked into their CPUs. SGX security provides maximum protection by encrypting sections of memory to create highly secured environments to store sensitive data. This feature is an instrumental security feature for Edge customers that consistently transfer data between the cloud and the client.
Recommended Use Cases
The PowerEdge T150 was designed to accommodate budget-conscious customers looking for the lowest-cost PowerEdge tower server. By trading non-critical features, such as hot-plug and redundancy support, for a reduced total cost, the baseline price of the T150 is significantly less than the baseline T350 that offers these enterprise features. This positions the PowerEdge T150 as our most affordable tower server solution - perfect for a small business that doesn’t yet need enterprise class hardware features or the ability to scale workloads.
Having office-friendly sizing and acoustics, the T150 can be deployed at virtually any location. Whether that be at Near/Mid Edge sites or within ROBO environments, the T150 brings new levels of performance, flexibility and affordability that help grow small businesses. Some common workloads that are powered by the PowerEdge T150 include filing, printing, mailing, messaging, billing, and collaboration/sharing.
Please keep in mind that the PowerEdge T150 was designed to value affordability over feature- richness, resulting in the removal of some features/support (to reduce cost) that may be valuable for customers intending to scale their workloads. Small businesses that value enterprise-class features, or intend to scale their workloads, should strongly consider investing in the PowerEdge T350 tower server instead.
Conclusion
The PowerEdge T150 has been crafted to be Dell Technologies most cost-effective PowerEdge tower server offering. By only including the most critical features a small business would need, budget-conscious customers can have the high-quality experience that the PowerEdge brand is known for at the most affordable price-point. The PowerEdge T150 the perfect solution for small businesses looking to invest in an entry-level tower server for their business needs.

New PowerEdge R250 Overview
Tue, 17 Jan 2023 07:59:12 -0000
|Read Time: 0 minutes
Summary
After nearly three years, Dell Technologies has released the new PowerEdge R250 - an entry level 1S rack server designed to power value workloads and applications for budget-conscious users that prioritize reduced costs over expanded feature sets. This DfD was written to inform readers on what new capabilities they can expect from the PowerEdge R250, including coverage of the product features, systems management, security, and value proposition explaining which use cases are best suited for small businesses looking to invest in this value rack server.
Market Positioning
The PowerEdge R250 was designed to be the most economical entry within the single-socket 1U PowerEdge rack server space. Small businesses requiring the most affordable rack server, while still receiving the enterprise features and high-quality experience that the PowerEdge brand is known for, will gain the most from this offering.
The standard-depth form factor and low acoustic footprint makes the R250 a perfect solution for storefront and ROBO locations, as it fits in most small spaces and is inaudible to those nearby. Customers intending to use this in enterprise data centers or near-Edge facilities can also utilize the small form factor to occupy small spaces within dedicated hosting racks or equipment closets. Regardless of where deployed – the PowerEdge R250 delivers new levels of performance, flexibility and affordability that will help drive both business and organizational success to budget-conscious customers.
Expanded Product Features
Intel® Xeon® E-2300 Processors
Perhaps the most notable hardware addition to the PowerEdge T150 is the inclusion of Intel’s latest Xeon® E-2300 processor family. This uses the Cypress Cove CPU microarchitecture; offering a 19% increase of IPC (instructions per cycle) while also increasing IGP cores, L1 cache speeds and L2 cache speeds, when compared to previous generation Xeon® E-2200 processors. These performance increases, in tangent with other new features listed below, allow for up to 28% faster IO speeds when compared to the previous generation PowerEdge R240.
Memory
Memory capabilities have vastly improved, with the latest Xeon® E- series memory controllers now supporting up to four DDR4 UDIMMs at 3200MT/s (a 20% increase over the previous generation). The supported DIMM capacity has also doubled from 16GB to 32GB. Having twice as much data stored in faster DIMMs will significantly reduce data transfer times, resulting in increased productivity.
Storage/RAID
Support for four cabled or hot-plug 3.5” HDD/SSD drives is offered. Additionally, vSAS (Value SAS) SSD support has been expanded to provide more options to further offer an affordable, performance SSD tier. Drives can be configured with Dell Technologies BOSS-S1 and PERC HW RAID solutions, and can be mapped to add-in cards options such as the S150, H345/H355, H745/H755 and HBA355i.
I/O
Another major improvement is newly added support for two slots of PCIe Gen4 - the fourth iteration of the PCIe standard. Compared to PCIe Gen3, the throughput per lane doubles from 8GT/s to 16GT/s, effectively cutting transfer times in half for data traveling from storage to CPU.
Power/Cooling
Only one power supply unit is required to run the power-optimized PowerEdge R250. This PSU has been upgraded from a 250W AC Cabled Bronze PSU to a 450W AC Cabled Bronze PSU. Four non-hot swap fans reside in the middle of the chassis to cool the components that generate the most heat – a design intent focusing on power and cooling optimization.
Manageability (Size, Weight and Acoustics)
The rack dimensions are marginally smaller than the previous-gen PowerEdge R240, with dimensions of 42.8mm (H) x 534.59mm (W) x 434mm (D). The maximum weight with all drives populated is extremely light, at 12.48kg (or 27.51lb), allowing for effortless deployment. Lastly, the acoustical output has a wide range, between 22db for entry-level configurations operations at idle conditions and 46db for feature-rich configurations operating at max performance conditions. More often than not, acoustics will fall in line with the quieter, office-friendly range. However, if this is not the case, customers can ensure office-friendly acoustics by keeping ambient floor temperatures at 230 C. These various chassis measurements make the R250 ideal for storefront, office and ROBO locations.
Figure 1 – Side angle of the sleek, new PowerEdge R250
Simple and Intuitive Systems Management
Managing the PowerEdge R250 is simple and intuitive with the Dell integrated systems management tool – iDRAC9 (Integrated Dell Remote Access Controller). iDRAC9 is a hardware device containing its own processor, memory and network interface that provides administrators with an abundance of server operation information to a dashboard screen that can be remotely accessed and managed. Operational conditions such as temperatures, fan speeds, chassis alarms, power supplies, RAID status and individual disk status are always monitored so businesses will have the flexibility to allocate limited resources to where they are most needed.
Exceptional Security
Legacy Boot support has been deprecated by Intel® and replaced with the superior UEFI (Unified Extensible Firmware Interface) Secure Boot, which has better programmability, greater scalability, and higher security. UEFI Secure Boot also provides faster booting times and support for 9ZBs, while legacy BIOS is limited to 2.2TB boot drives. Customers who purchase the latest Xeon® E-2300 processors will also inherit Intel SGX (Software Guard Extensions) baked into their CPUs. SGX security provides maximum protection by encrypting sections of memory to create highly secured environments to store sensitive data. This feature is an instrumental security feature for Edge customers that consistently transfer data between the cloud and the client.
Recommended Use Cases
The PowerEdge R250 was designed to accommodate budget-conscious customers looking for the lowest-cost PowerEdge rack server. By trading non-critical features, such as hot-plug and redundancy support, for a reduced total cost, the price of the baseline R250 is ~50% less than the baseline R350 that offers these enterprise features. This positions the PowerEdge R250 as our most affordable rack server solution - perfect for a small business that has no need for enterprise class hardware features or the ability to scale workloads.
With a standard-depth 1U chassis and low acoustical output, the R250 can be deployed at virtually any location. Whether that be an enterprise data center, near/mid Edge site, or inside the closet just down the hall, the R250 brings new levels of performance, efficiency and versatility that help grow small businesses. Some common workloads that are powered by the PowerEdge R250 include traditional business applications (filing, printing, mailing, messaging, billing), virtualization, private cloud, and collaboration/sharing.
Please keep in mind that the PowerEdge R250 was designed to value affordability over feature- richness, resulting in the removal of some features/support (to reduce cost) that may be valuable for customers intending to scale their workloads. Small businesses that value enterprise-class features, or intend to scale their workloads, should strongly consider investing in the PowerEdge R350 rack server.
Conclusion
The PowerEdge R250 has been crafted to be Dell Technologies most cost-effective PowerEdge rack server offering. By only including the most critical features a small business would need, budget conscious customers can have the high-quality experience that the PowerEdge brand is known for at the most affordable price-point. The PowerEdge R250 is the perfect solution for small businesses looking to invest in an entry-level rackmount server for their business needs.

New PowerEdge R350 Overview
Tue, 17 Jan 2023 07:50:02 -0000
|Read Time: 0 minutes
Summary
After nearly three years, Dell Technologies has released the new PowerEdge R350, a mainstream, scalable 1S rack server designed to power and scale value workloads and applications at a low price that provides customers optimal balance of useful enterprise features and affordability. This DfD describes the new capabilities you can expect from the PowerEdge R350, including coverage of the product features, systems management, security, and value proposition explaining which use cases are best suited for small businesses looking to invest in this mainstream rack server.
Market Positioning
The PowerEdge R350 was designed to be the mainstream entry within the single-socket 1U PowerEdge rack server space. With more storage support and enterprise features, such as hot swap and redundancy, the PowerEdge R350 is a scalable solution capable of expansion while remaining affordable. Small businesses seeking an affordable rack server that is capable of scaling to tackle enterprise- class workloads will benefit the most from this solution.
The standard-depth form factor and low acoustic footprint make the R350 a perfect solution for storefront and near-Edge locations, as it fits in most small spaces and is inaudible to those nearby. Customers intending to use this in enterprise data centers or near-Edge facilities can also fill small spaces within dedicated hosting racks or equipment closets. Regardless of where deployed, the PowerEdge R350 delivers new levels of performance, efficiency, and scalability to small businesses requiring enterprise features for their server environment.
Expanded Product Features
Intel® Xeon® E-2300 Processors
Perhaps the most notable hardware addition to the PowerEdge R350 is the inclusion of the latest Intel Xeon® E-2300 processor family. This uses the Cypress Cove CPU microarchitecture, offering a 19% increase of IPC (instructions per cycle) while also increasing IGP cores, L1 cache speeds, and L2 cache speeds, when compared to previous-generation Xeon® E-2200 processors. These performance increases, in tangent with the other new features listed below, allow for up to 28% faster IO speeds when compared to the previous- generation PowerEdge R340.
Memory
Memory capabilities have vastly improved, with the latest Xeon® E- series memory controllers now supporting up to four DDR4 UDIMMs at 3200 MT/s (a 20% increase over the previous generation). The supported DIMM capacity has also doubled from 16 GB to 32 GB. Having twice as much data stored in faster DIMMs will significantly reduce data transfer times, resulting in increased productivity.
Storage/RAID
Support for eight hot-plug 2.5”/3.5” HDD/SSD drives is offered. Value SAS (vSAS) SSD support has also been expanded to provide more options to further offer an affordable, performance SSD tier. These drives can be configured with Dell PERC HW RAID, and can be mapped to add-in card options such as the S150, H345/H355, H745/H755 and HBA355i.
Also, the R350 introduces support for the hot-plug Boot Optimized Storage Solution 2.0 (BOSS 2.0) accessibility for two M.2 drives at the front of the server with its own dedicated slot. This allows for the surprise removal of these M.2 drives so that the server does not need to be taken offline in case of any SSD failure. This feature, in tangent with two times as much drive support, are big differentiators that distinctly position the R350 over the R250 as the better rack solution for small businesses that require a scalable server optimized for enterprise-class workloads.
I/O
Another major improvement is newly added support for two slots of PCIe Gen4, the fourth iteration of the PCIe standard. Compared to PCIe Gen3, the throughput per lane doubles from 8 GT/s to 16 GT/s, effectively cutting transfer times in half for data traveling from storage to CPU.
Power and Cooling
Only one power supply unit is required to run the power-optimized PowerEdge R350. This PSU has been upgraded from a 350W AC Cabled Bronze PSU to a 600W AC Redundant Platinum PSU. Four non-hot swap fans reside in the middle of the chassis to cool the components that generate the most heat—a design intent focused on optimizing the power and cooling budget.
Manageability (Size, Weight, and Acoustics)
The rack dimensions are marginally larger than the PowerEdge R250, with dimensions of 42.8 mm (H) x 563 mm (W) x 512.5 mm (D) for the 4x 3.5” chassis, and 42.8 mm (H) x 483.9 mm
(W) x 534.6 mm (D) for the x 2.5” chassis. The maximum weight with all drives populated is considerably light, at 13.6 kg (or 29.98 lb) for 4x 3.5” drives and 36.3 kg (or 80.02 lb) for 8x 2.5” drives, allowing for easy deployment. Lastly, the acoustical output has a wide range, between 35 db for entry-level configurations operations at idle conditions and 63 db for feature-rich configurations operating at max performance conditions. In most operating conditions, customers can ensure office-friendly acoustics by keeping ambient floor temperatures at 230 C, but should keep in mind that when working at full power, the server may still be audible to nearby persons. These manageability measurements make the R350 ideal for labs, schools, restaurants, open office spaces, ROBO or Edge, and small, ventilated closets.
Figure 1 – Side angle of the sleek, new PowerEdge R350
Simple and Intuitive Systems Management
Managing the PowerEdge R350 is simple and intuitive with the Dell integrated systems management tool, the Integrated Dell Remote Access Controller 9 (iDRAC9). iDRAC9 is a hardware device containing its own processor, memory, and network interface that provides administrators with an abundance of server operation information to a dashboard screen that can be remotely accessed and managed. Operational conditions such as temperatures, fan speeds, chassis alarms, power supplies, RAID status, and individual disk status are always monitored so businesses have the flexibility to allocate limited resources to where they are most needed.
Exceptional Security
Legacy Boot support has been deprecated by Intel® and replaced with the superior Unified Extensible Firmware Interface (UEFI) Secure Boot, which has better programmability, greater scalability, and higher security. UEFI Secure Boot also provides faster booting times and support for 9ZBs, while legacy BIOS is limited to 2.2 TB boot drives. Customers who purchase the latest Xeon® E-2300 processors will also inherit Intel SGX (Software Guard Extensions) designed into their CPUs. SGX security provides maximum protection by encrypting sections of memory to create highly secured environments to store sensitive data. This feature is an instrumental security feature for Edge customers that consistently transfer data between the cloud and the client.
Performance
Dell Technologies ran internal testing comparing the R350 and R340 SPECrate® 2017_int_base results, which measures the ability to process identical programs on each of its available threads in parallel (throughput). The configurations were identical with the processor being the independent variable. The PowerEdge R350 used the latest Intel® Xeon® E-2300 processors, while the older PowerEdge R340 used Intel® Xeon® E-2200 processors. As seen in Figure 2 below, each processor bin from top to bottom saw performance increases ranging from 12.2% to 33.2%. Find more information about these studies here.
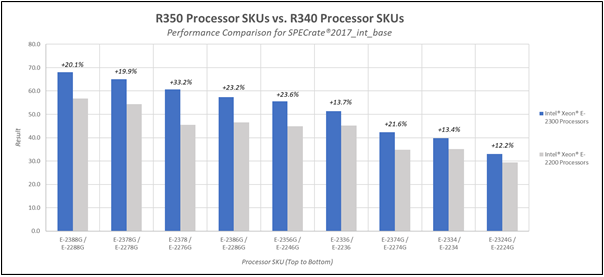
Figure 2 –SPECrate® 2017_int_base results for R350 CPUs (blue) vs. R340 CPUs (gray)
Recommended Use Cases
The PowerEdge R350 was designed to accommodate customers looking for an affordable, yet scalable, rackmount server. With support for up to eight drives and enterprise-class features, such as hot-swap BOSS and PSU redundancy, the R350 will best accommodate small businesses that desire scalability and the capability to tackle more data intensive applications. Some common workloads that are powered by the PowerEdge R350 include traditional business applications (filing, printing, mailing, messaging, billing), virtualization, data processing, video surveillance, private cloud, and collaboration or sharing.
Please keep in mind that the PowerEdge R350 was designed to value scalability and feature richness over affordability, resulting in a slight cost premium when compared to the PowerEdge R250. Small businesses that are looking for the lowest-cost, entry-level PowerEdge rackmount server should strongly consider investing in the PowerEdge R250 rack server.
Conclusion
The PowerEdge R350 has been crafted to be Dell Technologies mainstream entry within the single-socket 1U PowerEdge rack server space. With the inclusion of useful enterprise features and twice as much storage as the R250, small business customers can tackle more data-intensive workloads and scale out their solution as needed, all while at an affordable price point.

The New PowerEdge T350
Tue, 17 Jan 2023 07:40:19 -0000
|Read Time: 0 minutes
Summary
The Dell EMC PowerEdge T350 offers customers peak performance and enterprise features within a significantly smaller form factor – 37% smaller to be exact. The sleek new chassis was intentionally designed for the powerful T350 tower by shrinking the unused space inside - right-sizing the box so it can reside in smaller spaces that SMB, Edge and ROBO customers intend to deploy it at. This DfD was written to brief readers of the advantages brought to the PowerEdge T350, including improved performance, new features, and its smaller form factor.
Right-Sized for Deployment Anywhere
The new Dell EMC PowerEdge T350 chassis is 37% smaller than its predecessor, the T340. This decision was pioneered by feedback from customer feedback and sales data, which consistently pointed to one clear consensus – customers valued a smaller sized box.
This value proposition pushed our development team to forego the option of leveraging the T550 chassis design (to reduce cost) and to focus on developing a right-sized T350 chassis to best accommodate customers outside of the datacenter. By shrinking unoccupied space within the server, the dimensions reduced from 17.45” x 8.6” x 23.19” (T340) to 14.6” x 6.9” x 22” (T350) – a significant decrease in volume. What’s even more impressive is that no features or hardware support were removed to enable this change!
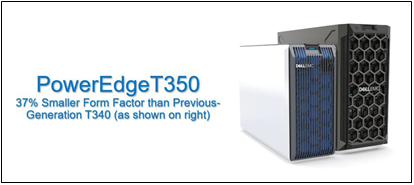
Figure 1 – Visual aid comparing the size of the T350 (left) and the T340 (right)
Right-sizing the mainstream T350 will be most advantageous to SMB customers deploying in remote offices, as this new, smaller solution is able to deliver higher performance technologies while in a quieter and more management-friendly enclosure. As explained in the next few paragraphs, many new features implemented onto the T350 will bring new levels of performance to SMB workloads like collaboration, file sharing, database, mail/messaging and web hosting.
Latest Hardware, New Features
Despite being 37% smaller, the PowerEdge T350 is packed with the latest hardware and new features to bring higher levels of performance, versatility, and optimization to your organization:
- The latest Intel® Xeon® E-2300 Processors offer a 19% increase of IPC (instructions per cycle) while also increasing IGP cores, L1 cache speed and L2 cache speed, allowing for up to 28% faster IO speeds when compared to the Xeon® E-2200 processor family.
- Supported UDIMM speeds have increased by 20% to 3200 MT/s and the max capacity per UDIMM has doubled from 16GB to 32GB. Having more memory at faster speeds will significantly reduce data transfer times, resulting in increased productivity.
- Up to 8x 2.5” or 3.5” SATA/SAS drives can be hosted on the backplane. Additionally, up to 2x M.2 drives are now hot-swappable with Dell Technologies BOSS-S2 card, allowing the server to keep running when a critical component swap is needed.
- Support for twenty lanes of PCIe Gen4 will double I/O throughput from 8GT/s to 16GT/s, effectively cutting transfer times in half for data traveling from storage to CPU.
In addition to the latest hardware and new feature support, customers will always get the high- quality enterprise features that the PowerEdge brand is known for, including:
- iDRAC9 which provides administrators with an abundance of server operation information to a dashboard screen that can be remotely accessed and managed.
- UEFI Secure Boot which has better programmability, scalability, security, booting speeds, feature support and user-friendliness than legacy BIOS.
- Redundant fans, PSUs, and hard drives
- Storage controllers that support HW RAID for SATA, SAS and NVMe interfaces
Performance Improvements
Dell Technologies ran internal testing comparing the T350 and T340 SPECrate® 2017_int_base results, which measures the ability to process identical programs on each of its available threads in parallel (or throughput, in layman’s terms). Both configurations were identical with the processor being the independent variable. The PowerEdge T350 used the latest Intel® Xeon® E-2300 processors while the older PowerEdge T340 used Intel® Xeon® E-2200 processors. As seen in Figure 2 below, each processor SKU from top bin to bottom bin observed a performance increase ranging from 14.8% to 32.3%. More information on these studies can be read here.
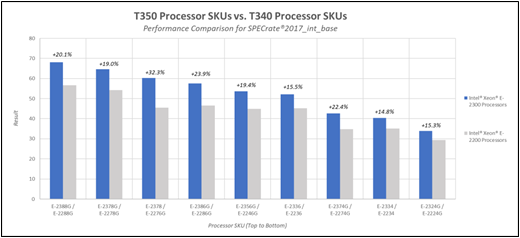
Figure 2 –SPECrate® 2017_int_base results for T350 CPUs (blue) vs. T340 CPUs (gray)
Dell Technologies also commissioned Grid Dynamics to carry out performance testing in retail and VDI environments to simulate tangible customer use-cases. Figure 3 below illustrates that, on average, the PowerEdge T350 performs I/O operations 36.1% faster than the T340 for the same amount of video streams. Figure 4 below illustrates that, on average, the PowerEdge T350 speed of transaction commits for the same size database is 37% higher than the T340. The scientific report can be read here and the executive summary can be read here.
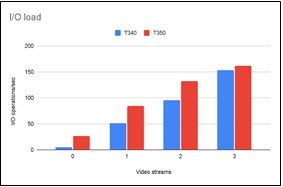
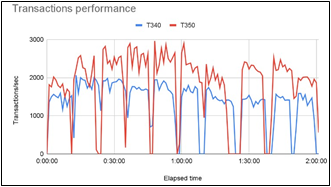
Figure 4 – Comparison of transactions committing speed
Conclusion
The Dell EMC PowerEdge T350 offers customers peak performance and new enterprise features within a right-sized form factor, so it can reside in smaller spaces to drive business growth where SMB, Edge and ROBO customers intend to deploy it at.

Intel® Xeon® E-2300 Processor Series
Tue, 17 Jan 2023 07:29:03 -0000
|Read Time: 0 minutes
Summary
The next-generation of entry level PowerEdge rack and tower servers (T150, T350, R250 & R350) are powered by the Intel® Xeon® E-2300 processor series. These CPUs are unique in that they were primarily designed for small-business customers. By focusing on maintaining a low cost, while simultaneously refining the architecture to include new capabilities and feature sets most relevant to SMB, Intel has developed a high- performing CPU for budget- conscious customers. This DfD was written to educate readers on why the latest Xeon® E-2300 series outperforms its predecessor and how SMB PowerEdge customers will benefit from these offerings in the next- generation of entry-level PowerEdge racks & towers.
Introduction
The next-generation of entry-level PowerEdge rack and tower servers (T150, T350, R250, R350) are the perfect solution for small business customers that want a high-quality server at an affordable price. This doctrine extends especially to the CPU, or the brains of the server. Historically, Intel® Xeon® E-series CPUs have done an excellent job in finding the ‘price vs. performance’ sweet spot, as seen with previous-generation Xeon® E-2200 series on past PowerEdge products, such as the T140 or T340. Intel’s new Xeon® E-2300 CPU series for next-generation PowerEdge rack and tower servers only continues the advancement of this affordable processor line – refining the features, performance, and security aspects most essential to small business customers.
So how well do the two Intel processor generations compare? Well, that is your call to make. We hope that the Xeon® E-2300 processor details presented below will excite customers for the new PowerEdge T150, T350, R250 and R350.
New Core Architecture Improves Performance
The Cypress Cove CPU microarchitecture delivers a 19% increase of IPC (instructions per cycle), while also increasing IGP cores, L1/L2 cache speeds, and DMI lanes. These improvements combined are expected to increase the total CPU performance by up to 28% when compared to the previous-generation, and will boost performance for virtually all SMB, Edge and remote office use cases.
Memory speeds have increased by 20%, jumping from 2666MT/s to 3200MT/s. Additionally, the max memory capacity for all Xeon® E- 2300 SKUs is now 128GB – 2x as much as most Xeon® E-2200 SKUs. Having twice as much data stored with faster DIMM speeds will significantly reduce data transfer times for memory-intensive workloads like databases, CRM, ERP, or Exchange.
PCIe support has also vastly improved, with support for 20 lanes of PCIe Gen4. This results in 2x more throughput per lane (16GT/s PCIe Gen4 vs 8GT/s PCIe Gen3) and 25% more lanes (20 lanes vs. 16 lanes) than the previous-generation. Features that support PCIe Gen4, like Dell Technologies HBA355i (Non-RAID) and H755 (RAID) storage controllers, will utilize this support to increase bandwidth.
Added Features to Expand Capability
The latest Xeon® E-2300 series also introduced support for multiple new features that will expand its capabilities:
- Legacy Boot support has been deprecated by Intel and replaced with the superior UEFI (Unified Extensible Firmware Interface) Secure Boot, which has better programmability, greater scalability, and higher security. UEFI Secure Boot also provides faster booting times and support for 9ZBs, while legacy BIOS is limited to 2.2TBs.
- Support for the latest Windows Server 2022 operating system, delivers the essential server performance, expandability and reliability small businesses depend on to support their critical business and customer data needs.
- 1 DDI (DP/HDMI) port of up to 4K/60fps resolution is supported with the intention to drive a display without the need for a discrete graphics card. One concurrent, independent display is also supported with Integrated HDCP 2.3.
Exceptional SGX Security
Customers who purchase the latest Xeon® E-2300 series will also inherit Intel SGX (Software Guard Extensions) baked into their CPUs. SGX security provides maximum protection by encrypting sections of memory to create highly secured environments to store targeted, sensitive data. Sensitive data like key protection, multi-party enterprise blockchain, AI/ML algorithm protection, and always-encrypted databases are protected even when the attacker has full control of the platform! This feature is an instrumental security feature for customers that consistently transfer data between the cloud and the client.
Final Words
The Xeon® E-2300 processor series is the most cost-effective Intel® offering, designed to deliver the performance, reliability, security, and management capabilities needed by small businesses to process and protect their critical business and customer data. When combined with the next- generation of entry-level PowerEdge racks and towers, customers can adequately tackle a broad variety of multi-user applications including email, messaging, print servers, calendar programs, databases, Enterprise Resource Planning (ERP), Customer Relationship Management (CRM), and other software that facilitates data sharing and collaboration.

Dell PowerEdge R940xa Server is the Leader in Price/Performance for SQL Server 2019
Tue, 17 Jan 2023 07:20:42 -0000
|Read Time: 0 minutes
Summary
The Transaction Processing Performance Council (TPC) published that the Dell EMC PE R940xa is the leader in Price per Performance for SQL Server 2019 in the 4S and 10TB category.1 This DfD will educate readers of what this means, and why this is so important for today’s compute intensive workloads.
Leader in Price/Performance
The Dell EMC PowerEdge R940xa 4 socket (4S) server ranked #1 in price/performance in the 10TB SQL Server category, as published by the Transaction Processing Performance Council (TPC). The analysis showed that the PowerEdge R940xa delivered $0.67 USD per query- per-hour for a 10TB SQL Server 2019 database in a non-clustered environment. This metric was computed by dividing the R940xa server price by the TPC-H Composite Query-per-Hour (QphH) performance. 1
The PowerEdge R940xa delivers these results with powerful performance from the combination of four CPUs and four GPUs to drive database acceleration at a competitive price point. This performance is ideal for compute-intensive workloads like SQL Server and allows users to scale business-critical workloads with:
- Up to four 2nd Generation Intel Xeon Scalable processors and up to 112 processing cores
- Up to four double-width GPUs or up to four double-width or eight single-width FPGAs to accelerate workloads
- Up to 48 DIMMs (24 of which can be DCPMMs) and up to 15.36TB of memory for large data sets
- 32 2.5” HDDs/SSDs, including four NVME drives
- Up to 12 PCIe slots for external connections
Impact to Server Users
This superior price per performance means that PowerEdge R940xa server users have optimized returns per dollar for compute-intensive workloads. Datacenter owners can also reinvest their financial savings into alternative segments to achieve their desired goals.
*To see the official TPC website results please click here.

Achieve Real-Time Data Processing with Confluent® Platform and Apache Kafka®
Tue, 17 Jan 2023 07:15:23 -0000
|Read Time: 0 minutes
Summary
Enabling mission critical application, system and connecting data to the entire organization with real-time data flow and process means that the system and software stack must be optimized. In this document Intel and Dell discuss key considerations and sample configurations for PowerEdge server deployments to ensure your Confluent Kafka architecture is robust and takes advantage of the most recent advancements in server technology.
Mission-critical applications need to analyze large amounts of data in real time, but this requires refined tools built on scalable platforms.
Originally developed at LinkedIn by the founders of Confluent, Apache Kafka® is an open-source, high-throughput message broker that fills this need. It quickly decouples, queues, processes, stores and consumes high-volume streams of event data. With Apache Kafka, enterprises can acquire data once and consume it multiple times.
Confluent continues to enhance the Kafka platform with tools like cluster management, additional security, and more connectors. Companies like Square, Bosch and The Home Depot use Confluent’s distribution of Apache Kafka to identify actionable patterns within business datai. Intel created an Apache Kafka data pipeline based on Confluent® Platform for faster security threat detection and response for its Cyber Intelligence Platform (CIP). Data flows to a Kafka message bus and then into the Splunk® platform.
Organizations that are looking for a solution to enable real-time processing of massive data streams should consider Confluent Platform and Apache Kafka running on Dell EMC™ PowerEdge™ servers with high-performing Intel compute, storage and networking technologies.
Key Considerations
- Compute. 3rd Generation Intel® Xeon® Scalable processors ingest and analyze massive quantities of data fast in the decoupling work common to Apache Kafka broker nodes.
- Storage. The Intel SSD P5500 is recommended for storage for all node types. Architected with 96-layer TLC and Intel 3D NAND Technology, it optimizes performance and capacity. The Dell™ PowerEdge RAID Controller (PERC) H755N is recommended for Brokers + Apache ZooKeeper™ nodes. It offers expandable storage capacity to improve performance.
- Networking. Network speed is one of the most important factors in Kafka performance. Intel Ethernet 800 Series network adapters enable scaling from 10 gigabit Ethernet (GbE) to 100 GbE for accelerated packet processing.
Available Configurations
Configurations for the control center node, ksqlDB + Kafka Connect + Schema Registry, and Brokers + Apache ZooKeeper are shown below.
| Control Center Node (One Node Required) | ksqlDB + Apache Kafka® Connect + Schema Registry (Minimum of Two Nodes Required) | Brokers + Apache ZooKeeper™ (Minimum of Three Nodes Required) |
Platform | Dell EMC™ PowerEdge™ R650 or R750 chassis supporting NVM Express® (NVMe®) drives | ||
CPUii | 2 x Intel® Xeon® Silver 4316 processor (20 cores at 2.3 GHz) | 2 x Intel® Xeon® Gold 6330 processor (28 cores at 2.0 GHz) | 2 x Intel® Xeon® Silver 4316 (20 cores at 2.3 GHz)—small throughput clusters 2 x Intel® Xeon® Gold 6338 (32 cores at 2.0 GHz)—medium throughput clusters 2 x Intel® Xeon® Platinum 8368 (38 cores at 2.4 GHz)—high throughput clusters with full encryption enabled |
DRAMiii | 64 GB (4 x 16 GB) | 128 GB (8 x 16 GB) | 128 GB (8 x 16 GB) or more |
Boot device | Dell EMC™ Boot Optimized Server Storage (BOSS)-S2 with 2 x 480 GB Intel® SSD D3-S4510 M.2 Serial ATA (SATA) | ||
Storage controlleriv | None | Dell™ PERC H755N Front NVMe | |
Storagev | 2 x 3.84 TB Intel® SSD P5500 | 4 x 3.84 TB Intel® SSD P5500 | |
Network interface controller (NIC) | Intel® Ethernet Network Adapter E810-XXVDA2 for OCP3 (dual-port 25 Gb) | Intel® E810-XXVDA2 for OCP3 (dual-port 25 Gb) or Intel® E810- CQDA2 PCIe® (dual-port 100 Gb) for high-throughput clusters | |
Learn More
Contact your dedicated Dell or Intel account team. 1-877-289+-3355
Download the solution briefs and white papers below:
- Enabling Real-Time Processing of Massive Data Streams
- IT@Intel: Building a Modern, Scalable Cyber Intelligence Platform with Apache Kafka
- IT@Intel: Transforming Intel’s Security Posture with Innovations in Data Intelligence
The information in this publication is provided as is. Dell Inc. makes no representations or warranties of any kind with respect to the information in this publication, and specifically disclaims implied warranties of merchantability or fitness for a particular purpose.
Use, copying, and distribution of any software described in this publication requires an applicable software license.
Copyright © 2021 Dell Inc. or its subsidiaries. All Rights Reserved. Dell, EMC, PowerEdge and other trademarks are trademarks of Dell Inc. or its subsidiaries. Other trademarks may be the property of their respective owners.
Dell Inc. believes the information in this document is accurate as of its publication date. The information is subject to change without notice.
i Confluent. “Set Your Data in Motion.” 2021. www.confluent.io/.
ii Small throughput: less than 10 gigabits per second (Gbps), medium throughput: less than 25 Gbps, high throughput: more than 25 Gbps
iii Brokers and Apache ZooKeeper™: More memory might be required to accommodate traffic bursts.
iv Brokers and Apache ZooKeeper™: An NVMe® RAID controller is optional for small- and medium-throughput clusters.
v Brokers and Apache ZooKeeper™: Add more drives or add higher capacity drives as needed for higher throughput, extended data-retention periods or desired (optional) RAID configurations.

Deliver Business Insights Faster with Microsoft SQL Server 2019 and VMware vSAN™
Tue, 17 Jan 2023 07:07:32 -0000
|Read Time: 0 minutes
Summary
This joint paper outlines a brief discussion on the key hardware considerations when planning and configuring a VMware vSAN™server configuration. Including sample PowerEdge server configurations for a starting deployment and quoting process.
Today’s enterprises need to move fast to stay competitive. For example, high- speed transactional processing solutions accelerate insights for financial trading or wholesale supply. High-speed analytics solutions enable users to quickly identify patterns in customer behavior or resource usage to inform better predictions and forecasts.
IT professionals are on point to deliver this high-performance data while reducing infrastructure costs. That is why IT pros choose Microsoft SQL Server 2019 running on VMware vSAN™.
They also choose Dell EMC™ PowerEdge™ rack servers configured with the latest generation of Intel® technologies. What are the benefits?
- Selecting SQL Server 2019 enables IT pros to deliver industry leading performancei.
- Adopting hyperconverged infrastructure (HCI) powered by vSAN, combined with VMware vSphere®, enables IT pros to manage compute and storage with a single platform that lowers infrastructure costs when compared to traditional three-tier architecturesii.
- Dell EMC PowerEdge servers running vSphere boost the orders per minute (OPM) of transactional databases more than 1.9 timesiii, and they allow users to complete 8x the analytics in 39 percent less timeiv, when compared to previous-generation servers.
Key Considerations
To get started, available server configurations for SQL server 2019 are shown in the “Available Configurations” section below. Key considerations include the following:
- CPU: High-frequency 3rd Generation Intel® Xeon® Scalable processors with 2.8 GHz clock speeds help optimize performance by enabling SQL Server 2019 locks to be released more quickly so multiple processes can access data faster. Additionally, Dell Technologies recommends using multiples of 24 CPU cores to make it easier to segment vSAN clusters and match the licensing structure of SQL Server 2019 Standard edition.
- Memory and Storage: The Base configuration can be set up with two storage groups and up to eight capacity drives, while the Plus configuration can be equipped with up to four storage groups and up to 12 capacity drives. In general, using more storage groups provides better write performance.
Dell Technologies recommends 1 TB of Intel® Optane™ persistent memory (PMem) 200 series per node. Intel Optane PMem creates a larger memory pool that enables SQL Server 2019 to run faster because data can be read from logical, in-memory storage, as opposed to a physical disk. For storage, Dell recommends using Intel Optane Solid State Drives (SSDs) for caching frequently accessed data. The Intel Optane SSD P5800X is the world’s fastest data center SSDv. PCIe® Gen4 NAND SSDs are recommended for the capacity tier.
- Networking: The configuration specifies Intel® Ethernet 800 Series network interface controllers (NICs) with Remote Direct Memory Access (RDMA), a hardware-acceleration feature that reduces the load on the CPU. Intel Ethernet 800 Series NICs start at 10 gigabit Ethernet (GbE) and scale up to 100 GbE. With Intel Ethernet 800 Series NICs, you will notice faster data speed between vSAN clusters, which becomes more important as node counts grow.
Available Configurations
The Plus configuration includes more cores, memory, and storage to support more or larger SQL Server 2019 instances and provide better performance.
Configuratio nsvi | Base Configuration
Dell EMC™ PowerEdge™ R650 Rack Server, up to 10 NVMe® Drives, 1 RU | Plus Configuration
Dell EMC PowerEdge R750 Rack Server, up to 16 NVMe Drives, 2 RU |
Platform | Dell EMC™ PowerEdge™ R650 rack server supporting up to 10 NVMe drives (direct connection with no Dell™ PowerEdge RAID Controller [PERC]) | Dell EMC PowerEdge R750 rack server supporting up to16 NVMe drives (direct connection with no Dell PERC) |
CPUvii | 2 x Intel® Xeon® Gold 6342 processor (24 cores at 2.8 GHz) | 2 x Intel® Xeon® Platinum 8362 processor (32 cores at 2.8 GHz) or Intel Xeon Platinum 8358 processor (32 cores at 2.6 GHz) |
DRAM | 256 GB (16 x 16 GB DDR4-3200) | |
Persistent memoryviii | 1 TB (8 x 128 GB Intel® Optane™ PMem 200 series) | |
Boot device | Dell EMC™ Boot Optimized Server Storage (BOSS)-S2 with 2 x 480 GB Intel® SSD S4510 M.2 Serial ATA (SATA) (RAID1) | Dell EMC™ Boot Optimized Server Storage (BOSS)-S2 with 2 x 480 GB Intel® SSD S4510 M.2 Serial ATA (SATA) (RAID1) |
Storage adapter | Not required for an all-NVMe configuration | |
Cache tier drivesix | 2 x 400 GB Intel Optane SSD P5800X (PCIe® Gen4) or 2 x 375 GB Intel Optane SSD DC P4800X (PCIe Gen3) | 3 x 400 GB Intel Optane SSD P5800X (PCIe Gen4) or 3 x 375 GB Intel Optane SSD DC P4800X (PCIe Gen3) |
Capacity tier drives | 4 x (up to 8 x) 3.84 TB Intel SSD P5500 (PCIe Gen4, read- intensive) | 6 x (up to 12 x) 3.84 TB Intel SSD P5500 (PCIe Gen4, read-intensive) |
NIC | Intel® Ethernet Network Adapter E810-XXV for OCP3 (dual-port 25 Gb) | Intel Ethernet Network Adapter E810-XXV for OCP3 (dual-port 25 Gb) or Intel Ethernet Network Adapter E810-CQDA2 PCIe add-in card (dual-port 100 Gb) |
Learn More
Contact your Dell or Intel account team for a customized quote 1-877-289+-3355
Visit the Dell vSAN Configuration Options Getting Started
Download “Dell EMC vSAN Ready Nodes.” to learn about hyperconverged building blocks for VMware vSAN™ environments.
Download “Microsoft SQL 2019 on Intel Optane Persistent Memory (PMem) Using Dell EMC PowerEdge Servers” to learn about advantages of using Intel Optane PMem with SQL Server 2019.
i TPC. TPC-E webpage. http://tpc.org/tpce/default5.asp.
ii Forrester Consulting. “The Total Economic Impact™ of VMware vSAN.” Commissioned by VMware. July 2019. www.vmware.com/learn/345149_REG.html.
iii Principled Technologies. “Dell EMC PowerEdge R650 servers running VMware vSphere 7.0 Update 2 can boost transactional database performance to help you become future ready.” Commissioned by Dell Technologies. June 2021. http://facts.pt/MbQ1xCy.
iv Principled Technologies. “Analyze more data, faster, by upgrading to latest-generation Dell EMC PowerEdge R750 servers.” Commissioned by Dell Technologies. June 2021. http://facts.pt/poJUNRK.
v Source: 14 at: Intel. “Intel® Optane™ SSD P5800X Series - Performance Index.” https://edc.intel.com/content/www/us/en/products/performance/benchmarks/intel-optane-ssd-p5800x-series/.
vi The “Plus” configuration supports more or larger Microsoft SQL Server 2019 instances with higher core count CPUs and additional disk
groups that deliver higher performance.
vii Plus configuration: the Intel Xeon Platinum 8362 processor is recommended, but the Intel Xeon Platinum 8358 processor can be used instead if the Intel Xeon Platinum 8362 processor is not yet available.
viii Base and Plus configurations: Intel Optane PMem in Memory Mode provides more memory at lower cost.
ix Base and Plus configurations: The Intel Optane SSD P5800X is recommended, but the previous-generation Intel Optane SSD DC P4800X can be used instead if the Intel Optane SSD P5800X is not yet available.

Deploy HCI with Ease on VMware vSAN Ready Nodes™
Tue, 17 Jan 2023 06:59:21 -0000
|Read Time: 0 minutes
Summary
Hyperconverged infrastructure is changing the way that IT organizations deliver resources to their users. In this short joint reference document with Dell Technologies and Intel we discuss the critical hardware components needed to successfully deploy vSAN. The information in this publication is provided as is. Dell Inc. makes no representations or warranties of any kind with respect to the information in this publication, and specifically disclaims implied warranties of merchantability or fitness for a particular purpose.
The surge in remote work and virtual desktop infrastructure (VDI) is increasing resource demands in the data center. As a result, many enterprises are turning to hyperconverged infrastructure (HCI). But HCI implementation can be complex and time-consuming. VMware vSAN ReadyNode™ provides a turnkey solution for accelerating HCI.
vSAN ReadyNode is a validated configuration on Dell EMC™ PowerEdge™ servers. These servers are tested and certified for VMware vSAN™ deployment, jointly recommended by Dell and VMware. vSAN ReadyNode on Dell EMC PowerEdge servers can help reduce HCI complexity, decrease total cost of ownership (TCO), scale with business needs and accommodate hybrid-cloud solutions such as VMware Cloud Foundation™. Benefits include the following:
- License efficiency—Get the most from each software license. vSAN ReadyNode on Dell EMC PowerEdge servers is designed to provide the best performance for each VMware® license per 32-core socket.
- High throughput—Elastic, scalable storage is one of many vSAN benefits. vSAN ReadyNode on Dell EMC PowerEdge servers, built on high-performing Intel architecture, prioritizes storage throughput with fast write caching and capacity storage tiers.
- Low latency—As a vSAN deployment grows, and data needs to be accessed across the cluster, data-access response times become increasingly important. This architecture, featuring Intel Ethernet Network Adapters, takes advantage of VMware’s recent addition of remote direct memory access (RDMA) to improve data response and user experience.
Key Considerations
- Available in two configurations—Both the “Base” and “Plus” configurations use similar all-flash NVM Express® (NVMe®) storage configurations. However, the Plus configuration is equipped with a higher-frequency CPU and Intel® Optane™ persistent memory (PMem). Both configurations are based on Intel® Select Solutions for VMware vSAN 7 HCI with 3rd Generation Intel® Xeon® Scalable processors.
- Networking—Both configurations are equipped with RDMA-capable Intel® Ethernet 800 Series network adapters that accelerate vSAN 7 performance (7.0 U2 or later). The Intel Ethernet Network Adapter E810- XXV network interface controller (NIC) can be used for network- and storage-intensive workloads requiring more than 25 gigabits per second (Gbps) of bandwidth.
- Rack-space requirements—The rack-space-optimized Dell EMC PowerEdge R650 server–based system can be used if large storage capacity is not needed (up to two storage groups are supported, each with a single cache drive and up to four capacity drives, with a maximum of 10 NVMe drives per system). For more drives or future- capacity scaling, the Dell EMC PowerEdge R750 server–based system is recommended.
Available Configurations
| Base configuration | Plus configuration | ||
Platform | Dell EMC™ PowerEdge™ R650, supporting 10 NVMe® drives (direct connection with no Dell™ PowerEdge RAID Controller [PERC]), 1RU | Dell EMC PowerEdge R750, supporting 24 NVMe drives (direct connection with no Dell PERC), 2RU | Dell EMC PowerEdge R650 supporting 10 NVMe drives (direct connection with no Dell PERC), 1RU | Dell EMC PowerEdge R750 supporting 24 NVMe drives (direct connection with no Dell PERC), 2RU |
CPU | 2 x Intel® Xeon® Gold 6338 processor (32 cores at 2.0 GHz) | 2 x Intel® Xeon® Platinum 8358 processor (32 cores at 2.6 GHz) or 2 x Intel® Xeon® Platinum 8362 processor (32 cores at 2.8 GHz) | ||
DRAM | 512 GB (16 x 32 GB DDR4-3200) | 256 GB (16 x 16 GB DDR4-3200) | ||
Persistent Memory | Optional | 1 TB (8 x 128 GB Intel® Optane™ PMem 200 series) | ||
Boot device | Dell EMC™ Boot Optimized Server Storage (BOSS)-S2 with 2 x 480 GB Intel® SSD S4510 M.2 Serial ATA (SATA) (RAID1) | |||
Storage adapter | Not required for an all-NVMe configuration | |||
Cache tier drives | 2 x 400 GB Intel Optane SSD P5800X (PCIe Gen4) or 2 x 375 GB Intel Optane SSD DC P4800X (PCIe Gen3)i | |||
Capacity tier drives | 6 x (up to 8 x) 3.84 TB Intel SSD DC P5500 (PCIe Gen4, read- intensive) | 6 x (up to 12 x) 3.84 TB Intel SSD DC P5500 (PCIe Gen4, read- intensive) | 6 x (up to 8 x) 3.84 TB Intel SSD DC P5500 (PCIe Gen4, read- intensive) | 6 x (up to 12 x) 3.84 TB Intel SSD DC P5500 (PCIe Gen4, read-intensive) |
NIC | Intel® Ethernet Network Adapter E810-XXV for OCP3 (dual-port 25 Gb)ii | |||
Get Started
View the vSAN Hardware Quick Reference Guide and VMware Compatibility Guide.
Learn More
- Contact your Dell or Intel account team. 1-877-289+-3355
- Read the Principled Technologies report: Reap better SQL Server OLTP performance with next-generation Dell EMC PowerEdge MX servers.
- Read the science behind the Principled Technologies report.
- View the Principled Technologies infographic.
i The Intel® Optane™ SSD P5800X is recommended, but the previous-generation Intel Optane SSD DC P4800X can be used instead if the Intel Optane SSD P5800X is not yet available.
ii When used with VMware vSAN™, the Intel® Ethernet Network Adapter E810-XXV for OCP3 requires appropriate RDMA firmware.

Experience Higher Performance with Splunk® Enterprise
Tue, 17 Jan 2023 06:53:02 -0000
|Read Time: 0 minutes
Summary
Splunk deployments require unique server and performance characteristics. In this brief document Intel and Dell technologists discuss key considerations to successful Splunk deployments and recommended configurations based on the most recent 15th Generation PowerEdge Server portfolio offerings.
Splunk® Enterprise provides high-performance data analytics for organizations looking for operational, security and business intelligence. With Splunk Enterprise, organizations experience reduced downtime, gain continuous thread remediation and benefit from smarter production insights.
Organizations can experience even higher performance with Splunk Enterprise by selecting the latest Dell EMC™ PowerEdge™ servers. These servers are configured with 3rd Generation Intel® Xeon® Scalable processors and Intel® Ethernet 800 Series network adapters. 3rd Generation Intel® Xeon® Scalable processors deliver an average 46 percent improvement on popular data center workloads, compared to the previous generationi. Intel® Ethernet 800 Series network adapters for OCP3 can help reduce latency and increase application throughput.
Intel and Splunk have partnered to develop recommended configurations for Dell EMC PowerEdge servers. Below, you will find configurations for the Splunk Enterprise admin server, search head and index servers (for either 120-day or 365-day retention) at three performance levels: reference, mid-range and high- performance.
Key Considerations
Splunk users should configure their server infrastructures to match their data-analysis needs. For example, optimizing for low search runtimes requires a different approach than optimizing for high data-ingestion rates.
Before you start, know your use case. Will your Splunk workload ingest data and then index it to make it available for search? Or will your Splunk workload primarily search—that is, query and report? Alternatively, do you envision balancing workloads between ingesting data and searching through data? First characterize your workloads, and then tune your infrastructure as outlined in the following steps:
- Tune your infrastructure for indexing. If most of your workloads ingest and index data, consider increasing the number of parallel ingestion pipelines on the indexer or increasing DRAM capacity.
- Tune your infrastructure for search. If most of your workloads search, consider adding more search heads, adding more computing power on the indexers, or increasing DRAM capacity. For dense search requirements, you might want to turn off hyper-threading.
- Tune balanced workloads. If your workloads are balanced, add indexers when you need to scale.
Recommended Configurations
The recommended configurations for the Splunk Enterprise admin server, search head, and indexers are shown in the table below. Note the following configuration definitions: Reference configuration: Ingestion up to 200 GB per day.
Mid-range configuration: Ingestion up to 250 GB per day.
High-performance configuration: Ingestion up to 300 GB per day.
| Admin Server | Search Head | Indexer (120-day retention) | Indexer (365-day retention) |
Configurations | The admin server and search head have the same configurations for reference, mid- range, and high-performance configurations. | Indexer CPU components are color-coded to indicate configuration. Blue: Reference configuration Green: Mid-range configuration Orange: High-performance configuration | ||
Platform | Dell EMC™ PowerEdge™ R650 supporting 8 x 2.5” Serial- Attached SCSI (SAS)/Serial ATA (SATA) drives | Dell EMC PowerEdge R750 chassis supporting 24 x 2.5” SAS/SATA drives | Dell EMC PowerEdge R750 chassis supporting 24 x + 4 x (rear) 2.5” SAS/SATA drives | |
CPU | 2 x Intel® Xeon® Gold 6326 processor (16 cores at 2.9 GHz) | 2 x Intel® Xeon® Gold 6326 processor (16 cores at 2.9 GHz) | 2 x Intel® Xeon® Gold 6326 processor (16 cores at 2.9 GHz) 2 x Intel® Xeon® Gold 6354 processor (18 cores at 3.0 GHz) 2 x Intel® Xeon® Gold 6348 processor (28 cores at 2.6 GHz) | |
DRAM | 64 GB (8 x 8 GB DDR4- 3200) | 128 GB (8 x 16 GB DDR4-3200) | ||
Boot device | Dell EMC™ Boot Optimized Server Storage (BOSS)-S2 with 2 x 480 GB Intel® SSD S4510 M.2 SATA (RAID1) | |||
Storage adapter | Dell™ PowerEdge RAID Controller (PERC) H345 | Dell PERC H755 | Dell PERC H755 + expander | |
Storage | 2 x 960 GB Intel® SSD S4610 SATA (mixed-use) | 2x 480 GB Intel® SSD S4610 SATA (mixed-use) |
| |
Storage (hot/warm) |
| 6 x 960 GB Intel® SSD S4610 SATA (RAID6) (mixed-use) | ||
Storage (cold tier) | 8 x 2.4 TB 10K rotations per minute (RPM) SAS hard-disk drive (HDD) (RAID6) | 18 x + 4 x (rear) 2.4 TB 10k RPM SAS HDD (RAID6) | ||
Network interface card (NIC) | Intel® Ethernet Network Adapter E810-XXVDA2 for OCP3 (dual-port 25 Gb) | |||
Learn More
Contact your Dell or Intel account team for a customized quote 1-877-289-3355
Learn more about Dell EMC PowerEdge R750 and R650 servers.
Learn more about high-performance data analytics with Splunk Enterprise running on Intel technologies.
i Source: 125 at Intel. “3rd Generation Intel® Xeon® ® Scalable Processors – Performance Index.” www.intel.com/3gen-Xeon® - config. Results may vary.

MLPerf™ Inference v1.0 – CPU Based Benchmarks on Dell PowerEdge R750 Server

Tue, 17 Jan 2023 06:44:49 -0000
|Read Time: 0 minutes
Summary
MLCommons™ Association has released the third round of results v1.0 for its machine learning inference performance benchmark suite MLPerf™. Dell EMC has participated in this effort by collaborating with several partners and using multiple configurations, spanning from Intel® CPU to accelerators such as GPU’s and FPGA’s. This blog is focused on the results for computer vision inference benchmarks (image classification and object detection), in the closed division / datacenter category, running on Dell EMC PowerEdge R750 in collaboration with Intel® and using its Optimized Inference System based on OpenVINO™ 2021.1.
Introduction
In this blog we present the MLPerf™ Inference v1.0 CPU based results submitted on PowerEdge R750 with Intel® processor using the Intel® optimized inference system based on OpenVINO™ 2021.1. Table 1 shows the technical specifications of this system.
Dell EMC PowerEdge R750 Server
System Name | PowerEdge R750 |
Status | Coming soon |
System Type | Data Center |
Number of Nodes | 1 |
Host Processor Model Name | Intel(R) Xeon(R) Gold 6330 CPU @ 2.0GHz |
Host Processors per Node | 2 |
Host Processor Core Count | 28 |
Host Processor Frequency | 2.00 GHz |
Host Memory Capacity | 1TB 1 DPC 3200 MHz |
Host Storage Capacity | 1.5TB |
Host Storage Type | NVMe |
3rd Generation Intel® Xeon® Scalable Processor
The 3rd Generation Intel® Xeon® Scalable processor family is designed for data center modernization to drive operational efficiency and higher productivity, leveraged with built-in AI acceleration tools, to provide the seamless performance foundation for data center and edge systems. Table 2 shows the technical specifications for CPU’s Intel® Xeon®.
Product Collection | 3rd Generation Intel® Xeon® Scalable Processors |
Code Name | Ice Lake |
Processor Name | Gold 6330 |
Status | Launched |
# of CPU Cores | 28 |
# of Threads | 56 |
Processor Base Frequency | 2.0GHz |
Max Turbo Speed | 3.10GHz |
Cache L3 | 42 MB |
Memory Type | DDR4-2933 |
ECC Memory Supported | Yes |
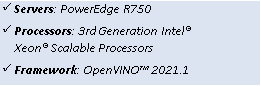
MLPerf™ Inference v1.0 - Datacenter
The MLPerf™ inference benchmark measures how fast a system can perform ML inference using a trained model with new data in a variety of deployment scenarios. There are two benchmark suites, one for Datacenter systems and one for Edge. Table 3 lists six mature models included in the official release v1.0 for Datacenter systems category and the vision models both image classification and object detection. The benchmark models highlighted below were run on PowerEdge R750.
Datacenter Benchmark Suite
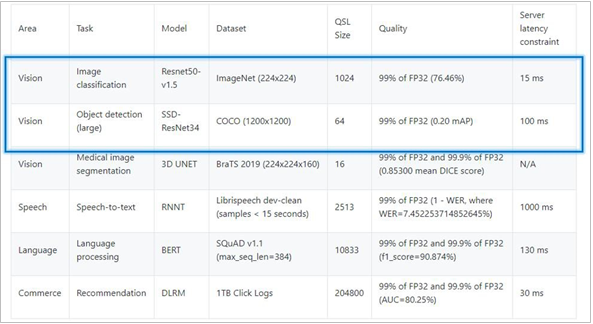
Table 3: Datacenter Suite Benchmarks. Source: MLCommons™
Scenarios
The above models are deployed in a variety of critical inference applications or use cases known as “scenarios”, where each scenario requires different metrics, demonstrating production environment performance in the real practice. Below is the description of each scenario and the Table 4 shows the scenarios required for each Datacenter benchmark included in this submission v1.0.
Offline scenario: represents applications that process the input in batches of data available immediately, and don’t have latency constraint for the metric performance measured as samples per second.
Server scenario: this scenario represents deployment of online applications with random input queries, the metric performance is queries per second (QPS) subject to latency bound. The server scenario is more complicated in terms of latency constraints and input queries generation, this complexity is reflected in the throughput-degradation results compared to offline scenario.
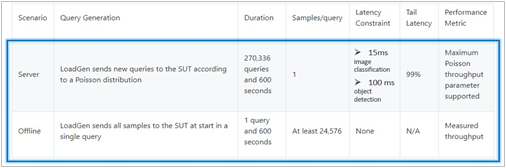
Table 4: MLPerf™ Inference Scenarios. Source: MLCommons™
Software Stack and System Configuration
The software stack and system configuration used for this submission is summarized in Table 5. Some of the settings that really mattered when looking at benchmark performance are captured in the table below.
OS | Ubuntu 20.10 (GNU/Linux 5.8.0-45-generic x86_64) |
Intel® Optimized Inference SW for MLPerf™ | MLPerf™ Intel OpenVino OMP CPP v1.0 Inference Build |
ECC memory mode | ON |
Host memory configuration | 1TiB | 64G per memory channel (1DPC) with 2933mt/s |
Turbo mode | ON |
CPU frequency governor | Performance |
OpenVINO™ Toolkit
The OpenVINO™ 2021.1 toolkit is used to optimize and run Deep Learning Neural Network models on Intel® hardware. The toolkit consists of three primary components: inference engine, model optimizer, and intermediate representation. The Model Optimizer is used to convert the MLPerf™ reference implementation benchmarks from a framework into quantized INT8 models to run on Intel® architecture.
Benchmark Parameter Configurations
The benchmarks and scenarios submitted for this round are ResNet50-v1.5 and SSD-ResNet34 in offline and server scenarios. Both benchmarks required tunning certain parameters to achieve maximum performance. The parameter configurations and expected performance depend on the processor characteristics including number on CPUs used (number of sockets), number of cores, number of threads, batch size, number of requests, CPU frequency, memory configuration and the software accelerator. Table 6 shows the parameter setting used to run the benchmarks to obtain optimal performance and produce VALID results to pass Compliance tests.
Model | Scenario | OpenVINO params & batch size |
ResNet50 INT8 | Offline | nireq = 224, nstreams = 112, nthreads = 56, batch = 4 |
Server | nireq = 28, nstreams = 14, nthreads = 56, batch = 1 | |
SSD-ResNet34 INT8 | Offline | nireq = 28, nstreams = 28, nthreads = 56, batch = 1 |
Server | nireq = 4, nstreams = 2, nthreads = 56, batch = 1 |
Results
From the scenario perspective, we benchmark the CPU performance by comparing server versus offline scenario and determine what is the delta. We also looked at results from our prior submission v0.7 to v1.0, so we can determine how the performance improved for Intel Xeon 3rd Generation compared to Intel Xeon 2nd.
ResNet50-v1.5 in server and offline scenarios
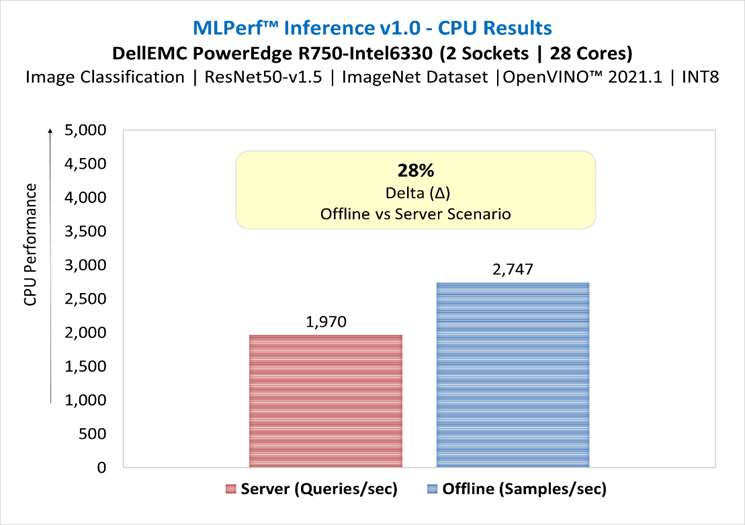
Figure 1: ResNet50-v1.5 in server and offline scenarios
SSD-ResNet34 in server and offline scenarios
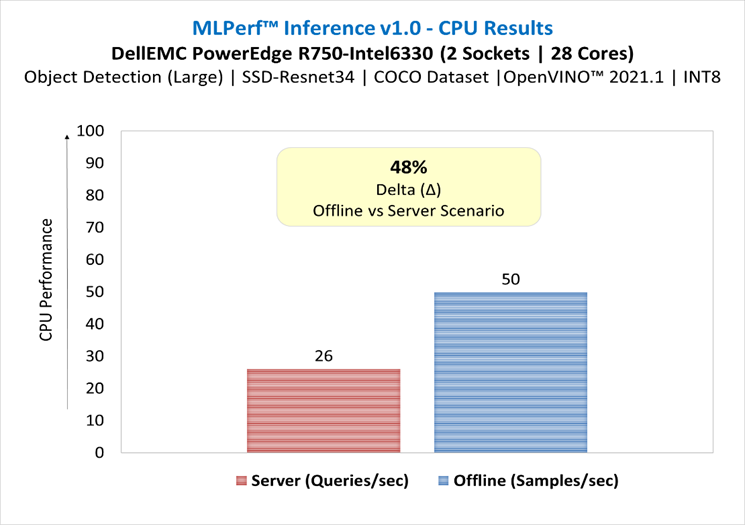
Figure 2: SSD-ResNet34 in server and offline scenario
Figure 3 illustrates the normalized server-to-offline performance for each model, scores close to 1 indicate that the model is delivering similar throughput in server scenario (constrained latency) as it is in offline scenario (unconstrained latency), scores close to zero indicate severe throughput degradation.
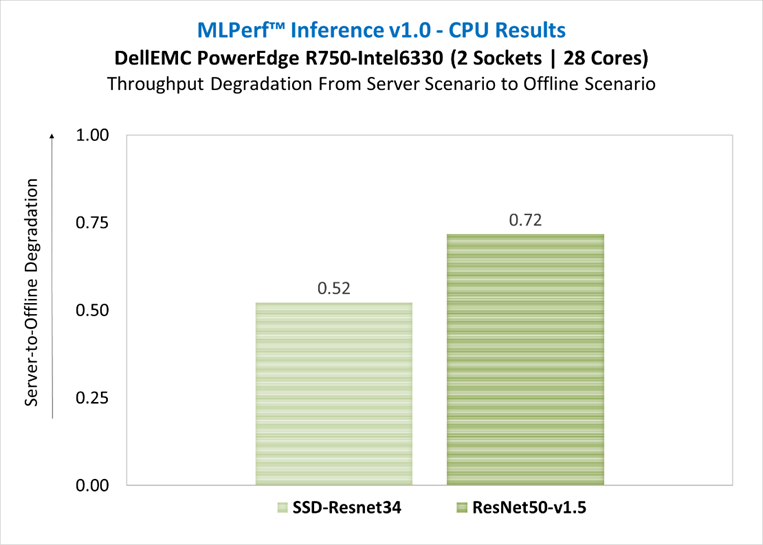
Figure 3: Throughput degradation from server scenario to offline scenario
Results submission v0.7 versus v1.0
In this section we compare the results from submission v0.7 versus this submission v1.0 to determine how the performance improved from servers with 2nd gen Xeon scalable processors vs. 3rd gen. The table below shows the server specifications used on each submission:
| Dell EMC Server for Submission v0.7 | Dell EMC Server for Submission v1.0 |
System Name | PowerEdge R740xd | PowerEdge R750 |
Host Processor Model Name | Intel(R) Xeon(R) Platinum 8280M | Intel(R) Xeon(R) Gold 6330 |
Host Processor Generation | 2nd | 3rd |
Host Processors per Node | 2 | 2 |
Host Processor Core Count | 28 | 28 |
Host Processor Frequency | 2.70 GHz | 2.00 GHz |
Host Processor TDP | 205W | 205W |
Host Memory Capacity | 376GB - 2 DPC 3200 MHz | 1TB - 1 DPC 3200 MHz |
Host Storage Capacity | 1.59TB | 1.5TB |
Host Storage Type | SATA | NVMe |
ResNet50-v1.5 in Offline Scenario | Submission v0.7 vs. v1.0
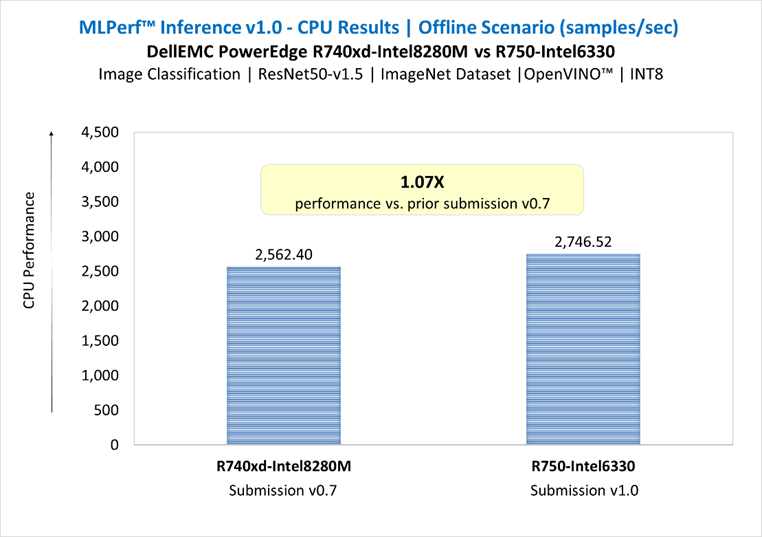
Figure 4: ResNet50-v1.5 in Offline Scenario | Submission v0.7 vs. v1.0
ResNet50-v1.5 in Server Scenario | Submission v0.7 vs. v1.0
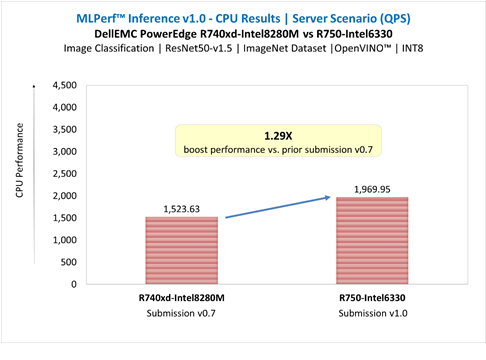
Figure 5: ResNet50-v1.5 in Server Scenario | Submission v0.7 vs. v1.0
SSD-ResNet34 in Offline Scenario | Submission v0.7 vs. v1.0
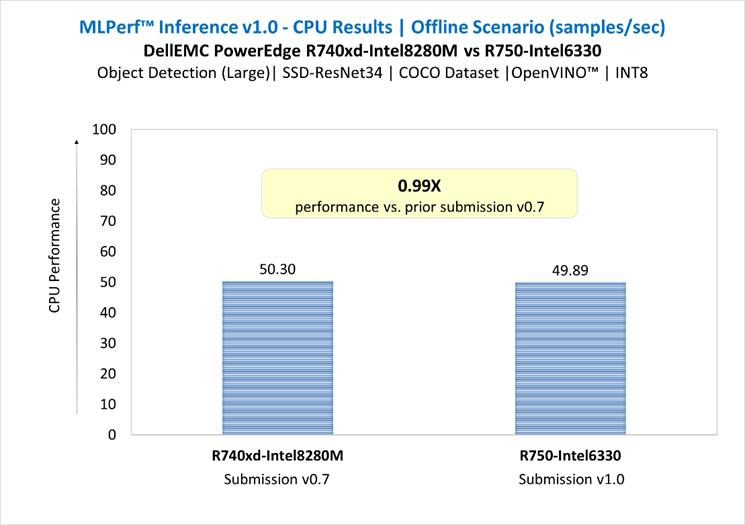
Figure 6: SSD-ResNet34 in Offline Scenario | Submission v0.7 vs. v1.0
SSD-ResNet34 in Server Scenario | Submission v0.7 vs. v1.0
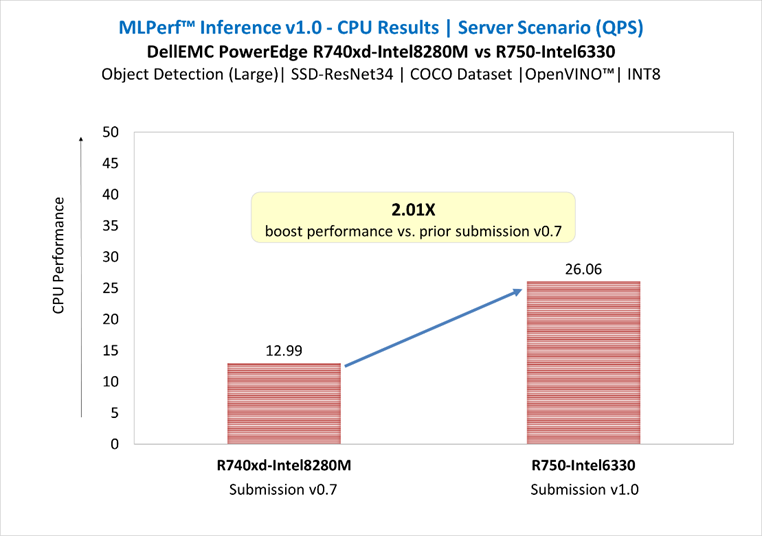
Figure 7: SSD-ResNet34 in Server Scenario | Submission v0.7 vs. v1.0
Conclusion
Both the Gold 6330 and the previous generation Platinum 8280 were chosen for this test because they have 28 cores and a memory interface that operates at 2933Mt/s. Customers with more demanding requirements could also consider higher performing variants of the 3rd Gen Intel® Xeon® scalable processor family up to the 40 core Platinum 8380 which uses a memory interface capable of 3200MT/s.
- The two-socket (dual CPU) server Dell EMC PowerEdge R750 equipped with 3rd Gen Intel® Xeon® scalable processors delivered:
- Up to 1.29X boost performance for image classification and up to 2.01X boost performance for object detection large in server scenario, compared to prior submission of PowerEdge R740xd equipped with 2nd Gen Intel® Xeon® processors.
- For ResNet50-v1.5 benchmark, there was a loss degradation around 28% from server scenario (constrained latency) to offline scenario (unconstrained latency). For SSD-ResNet34 benchmark, the loss was around 48%. These results demonstrate the complexity of server scenario in terms of latency constraints and input queries generation. The throughput degradation from server scenario is an indication of how well the system handles the latency constraint requirements, and it could be related to several factors such as the hardware architecture, the batching management, the inference software stack used to run the benchmarks. It is recommended to conduct performance analysis of the system including both scenarios.
- PowerEdge R750 server drives enhanced performance to suite computer vision inferencing tasks, as well as other complex workloads such as database and advanced analytics, VDI, AI, DL, and ML in datacenters deployments; it is an ideal solution for data center modernization to drive operational efficiency, lead higher productivity, and maximize total cost of ownership (TCO).
Citation
@misc{reddi2019mlperf,
title={MLPerf™ Inference Benchmark},
author={Vijay Janapa Reddi and Christine Cheng and David Kanter and Peter Mattson and Guenther Schmuelling and Carole-Jean Wu and Brian Anderson and Maximilien Breughe and Mark Charlebois and William Chou and Ramesh Chukka and Cody Coleman and Sam Davis and Pan Deng and Greg Diamos and Jared Duke and Dave Fick and J. Scott Gardner and Itay Hubara and Sachin Idgunji and Thomas B. Jablin and Jeff Jiao and Tom St. John and Pankaj Kanwar and David Lee and Jeffery Liao and Anton Lokhmotov and Francisco Massa and Peng Meng and Paulius Micikevicius and Colin Osborne and Gennady Pekhimenko and Arun Tejusve Raghunath Rajan and Dilip Sequeira and Ashish Sirasao and Fei Sun and Hanlin Tang and Michael Thomson and Frank Wei and Ephrem Wu and Lingjie Xu and Koichi Yamada and Bing Yu and George Yuan and Aaron Zhong and Peizhao Zhang and Yuchen Zhou}, year={2019},
eprint={1911.02549}, archivePrefix={arXiv}, primaryClass={cs.LG}

Next-Gen Dell PowerEdge Servers Deliver Encryption Protection without a Performance Hit Using KIOXIA PCIe
Tue, 17 Jan 2023 06:21:19 -0000
|Read Time: 0 minutes
Summary
This document is a summary of the performance comparison between SSDs that use encryption enabled vs. encryption disabled in a Dell PowerEdge server with PCIe 4.0 technology. All performance and characteristics discussed are based on performance testing conducted in the Americas Data Center (CET) labs. Results are accurate as of 5/1/21. Ad Ref #PROJ-000072
Introduction
Data encryption has been used for decades in data center computing environments to protect both data in transit and data at rest. In these environments, clients generate data continuously (24 hours per day, 7 days per week), and data collection continues to grow. This massive data generation comes from many different client devices such as desktops and laptops, smartphones and tablets, as well as IoT devices such as robots, drones, machines, and surveillance cameras, whether on-premises or ‘at-the-edge’ of the data center network (where data is captured and processed).
Massive data generation makes it more important than ever for companies to protect what they’ve captured both for short-term use and archival purposes, especially with technologies like artificial intelligence (AI) and machine learning (ML) that can help maximize the value of captured/archived data. Companies are turning more to encrypting data stored in their data centers to protect business-critical and sensitive information from unauthorized parties and hackers.
With each new generation of hardware and software that is produced, coupled with the exponential growth of data, it is critical for encryption methods to keep pace with technological advances. An ideal solution is to enable encryption so that access speed is comparable as if encryption was disabled, thereby delivering optimal system performance. The ability to protect data through encryption without experiencing performance degradation is the basis of this brief.
Data Encryption Performance Issues
Data encryption is the process of taking digital content (such as a document or email) and translating it into an unreadable format so that clients with a ‘secret key’ or password are the only ones that can view, access or read it. This helps protect the confidentiality of digital data stored on computer systems or transmitted over wireless networks and the Internet. A good example is when a smartphone is used for an ATM transaction or online purchase - encryption protects the information being transmitted.
Being a calculation-intensive operation, encryption is limited in use because of the amount of time and CPU cycles which can be lost to encrypting and decrypting data. These limitations may cause reduced system and application-level performance challenges that not only affect the applications themselves, but also the customer experience. To reduce CPU cycles being used for encryption, storage manufacturers have created devices that support encryption protocols inside of the drive itself. These drives are called Self Encrypting Drives1 (SEDs).
An SED implements on-board crypto-processers and uses an AES2-256 cryptographic module and media encryption key to encrypt plain-text data traversing through the SSD to the media inside of the SSD itself. This process ensures that data at rest is encrypted at a hardware layer to prevent unauthorized access.
System and Application Test Scenario
Mainstream servers and SSDs deployed with the PCIe 4.0 interface and NVMe protocol are becoming commercially available and typically deliver significant performance advantages over previous PCIe interface generations. Given the importance of encryption, delivering a solution that provides this capability without compromising performance was an SSD design goal for KIOXIA.
To find out if encryption leads to a performance hit, KIOXIA conducted transactions per minute (TPM) tests in a Dell® PCIe
4.0 server lab environment with and without encryption enabled. The test configuration included a Dell EMC PowerEdge R7525 rack server (with 3rd generation AMD EPYC™ CPUs) deployed with KIOXIA CM6 Series PCIe 4.0 enterprise NVMe SSDs that support the TCG-OPAL3 specification for SEDs. During the initial server boot-up, hardware level encryption was enabled throughout the BIOS on a Dell PowerEdge RAID Card (PERC) Model H755N. The ‘logical volume’ was created as an ‘encrypted volume’ that enables TCG-OPAL encryption across the KIOXIA CM6 Series SSDs, also creating a secured logical device.
The tests utilized an operational, high-performance Microsoft® SQL Server™ database workload based on comparable TPC- C™ benchmarks created by HammerDB software4. Supporting details include a description of the benchmark test criteria and the set-up and associated test procedures, as well as a visual representation of the test results, and a test analysis.
The test results provide a real-world scenario of the effects that encryption has on TPM performance when running a Microsoft SQL Server database using comparable equipment and performing queries against it. In this test configuration, a Dell EMC PowerEdge 7525 server utilizes KIOXIA CM6 Series enterprise SSDs when running this database application to demonstrate performance of a system with and without data encryption.
Test Criteria:
The hardware and software equipment used for these encryption tests included:
- Dell R7525 Server: One (1) dual socket server with two (2) AMD EPYC 7352 processors, featuring 24 processing cores, 2.3 GHz frequency, and 240 gigabytes5 (GB) of DDR4 RAM
- Operating System: Microsoft Windows® Server 2019
- Application: Microsoft SQL Server 2019.150.1600.8 – Database size of 440GB
- Test Software: Comparable TPC-C benchmark tests generated through HammerDB v4.0 test software
- PCIe 4.0 NVMe RAID Card: Dell PERC H755N
- Storage Devices (Table 1): Three (3) KIOXIA CM6-R Series PCIe 4.0 NVMe SSDs with 1.6 terabyte5 (TB) capacities
Specifications | CM6-R Series |
Interface | PCIe 4.0 NVMe U.3 |
Capacity | 1.6TB |
Form Factor | 2.5-inch6 (15mm) |
NAND Flash Type | BiCS FLASH™3D flash memory |
Drive Writes per Day7 (DWPD) | 3 (5 years) |
Power | 18W |
DRAM Allocation | 96GB |
Set-up & Test Procedures
Set-up: The test system was configured using the hardware and software equipment outlined above. An unsecured RAID5 set was created on the Dell H755N PERC using three (3) CM6-R Series SSDs with the SED option. RAID5 was selected because it is commonly used in data center environments. Once the SSD array was initialized, the RAID5 set was formatted to a Microsoft Windows NT file system (NTFS). The Microsoft SQL Server application was then installed and limited to 96GB of memory. A 440GB database was then loaded using HammerDB test software.
Test Procedures: The first test was run with encryption disabled. The comparable TPC-C workload utilized HammerDB software to run the test. The three (3) KIOXIA CM6-R Series SSDs were placed into a RAID5 set and the test was conducted with encryption disabled. Multiple iterations of the test were run on both configurations to determine an optimal configuration of virtual users. Both test scenarios showed the highest TPM performance when running a configuration of 480 virtual users. See Test Results section.
The second test was then run with encryption enabled. The RAID5 set was destroyed and a secure RAID5 set based on the TCG-OPAL specification was created. The three (3) KIOXIA CM6-R Series SSDs were placed into the secure RAID5 set and the same test was conducted with encryption enabled. The objective of this test was to showcase how the application and system provide the same level of performance whether data was encrypted or unencrypted. The comparable TPC-C workload was run using HammerDB test software. The same test process for this configuration was repeated to obtain the TPM performance results with encryption enabled. See Test Results section.
The TPM tests were conducted, with and without encryption enabled, with the performance result recorded. As it relates to TPM, the higher the test value, the better the result.
The CPU utilization tests were also conducted, with and without encryption enabled, with the result recorded. In this test instance, the lower the test value, the better the utilization.
Transactions Per Minute
In an Online Transaction Processing (OLTP) database environment, TPM is a measure of how many transactions in the TPC-C transaction profile are being executed per minute. HammerDB software, executing the HammerDB TPC-C transaction profile, randomly performs new order transactions and randomly executes additional transaction types such as payment, order status, delivery and stock levels. This benchmark simulates an OLTP environment where there are a large number of users that conduct simple, yet short transactions that require sub-second response times and return relatively few records. The TPM test results:
CM6-R Series Tests: SQL Server Comparable TPC-C Workload | Without Encryption | With Encryption |
Transactions per Minute | 720,672 | 720,697 |
Performance Difference | - | 0% |
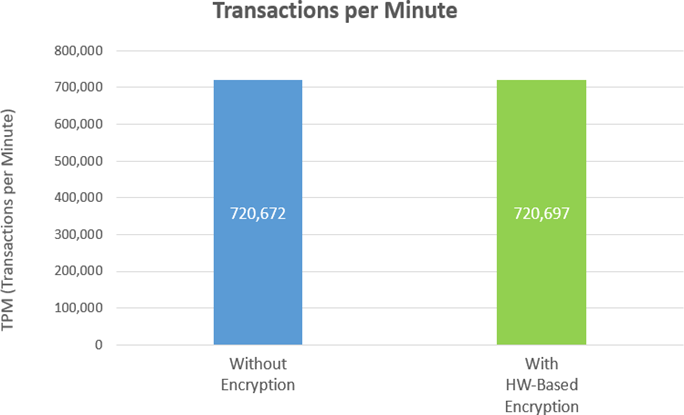
In both test cases, the margin of deviation when measuring the TPM, with or without encryption, was close to 0%, which implies no discernable difference in application level performance between the two approaches.
CPU Utilization
In general, CPU utilization represents a percentage of the total amount of computing tasks that are handled by the CPU, and is another estimation of system performance. Some forms of encryption require CPU cycles to encrypt and decrypt data on the storage media itself which can lead to a performance impact. For these tests, CPU utilization was measured to ensure the CPU was not incurring any extra processing for encryption, which should be handled in hardware at the RAID controller and SSD levels. The hardware based configuration from Dell with KIOXIA CM6-R Series SSDs enables the R7525 server CPU to be utilized for compute tasks instead of encryption. The graphs below show the CPU utilization was comparable (82.8% utilization without encryption and 79.5% utilization with encryption):
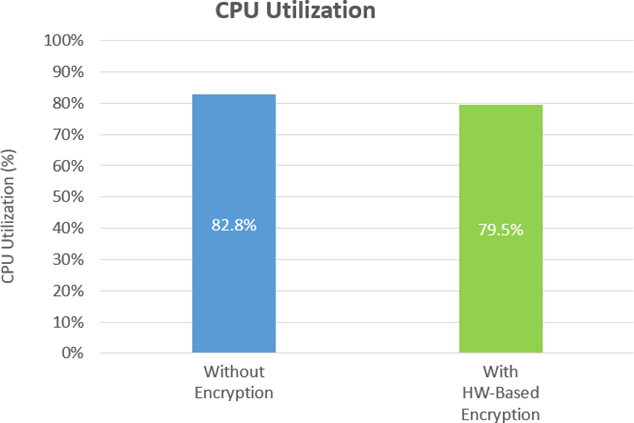
Test Analysis
The test results validated that KIOXIA CM6-R Series SSDs enabled the Dell R7525 rack server to deliver nearly identical TPM performance whether encryption was enabled or not. This particular PCIe 4.0 NVMe server/storage configuration was able to deliver more than 720,000 TPM without any TPM-related performance degradation regardless of encryption being enabled or disabled. As a result, systems and applications that use SSDs based on the TCG-OPAL standard are enabled to utilize the CPU for performance tasks instead of encryption tasks.
Whether hardware encryption was enabled or disabled, there was about 3% deviation of the CPU utilization during the testing process which demonstrated that the CPU wasn’t processing any extra workloads for encryption.
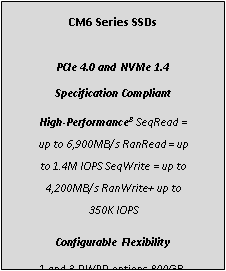
CM6 Series SSD Overview
The CM6 Series is KIOXIA’s 3rd generation enterprise-class NVMe SSD product line that features significantly improved performance from PCIe Gen3 to PCIe Gen4, 30.72TB maximum capacity, dual-port for high availability, 1 DWPD for read-intensive applications (CM6-R Series) and 3 DWPD for mixed use applications (CM6- V Series), up to a 25-watt power envelope and a host of security options – all of which are geared to support a wide variety of workload requirements. The CM6 Series SSD architecture has encryption built into the data path so as the drive is reading and writing from NAND flash memory, the encryption or decryption is performed in a way that it has no material impact to performance9.
Summary
Encryption becomes more important than ever to secure data. An ideal encrypted solution does not impact application or system performance. The test results presented validate that a PowerEdge R7525 PCIe 4.0 enabled server with KIOXIA CM6-R Series SSDs effectively delivered identical TPM performance of more than 720,000 TPM, whether encryption was enabled or not. As data usage scales over time, performance is not affected by encryption no matter how much data is being encrypted at rest. CPU utilization was also comparable with or without encryption enabled which validated that the CPU (at approximately 80% utilization) was not impacted when encryption was enabled. The Dell EMC and KIOXIA server solution delivered encryption protection without a performance hit!!!
Notes
1 Self-Encrypting Drives encrypt all data to SSDs and decrypt all data from SSDs, via an alphanumeric key (or password protection) to prevent data theft. It continuously scrambles and descrambles data written to and retrieved from SSDs.
2 The Advanced Encryption Standard (AES) is a specification for the encryption of electronic data established by the U.S. National Institute of Standards and Technology in 2001.
3 Developed by the Trusted Computing Group (TCG), a not-for-profit international standards organization, the OPAL specification is used for applying hardware-based encryption to solid state drives and often referred to as TCG-OPAL.
4 HammerDB is benchmarking and load testing software that is used to test popular databases. It simulates the stored workloads of multiple virtual users against specific databases to identify transactional scenarios and derive meaningful information about the data environment, such as performance comparisons. TPC Benchmark C is a supported OLTP benchmark that includes a mix of five concurrent transactions of different types, and nine types of tables with a wide range of record and population sizes and where results are measured in transactions per minute.
5 Definition of capacity - KIOXIA Corporation defines a megabyte (MB) as 1,000,000 bytes, a gigabyte (GB) as 1,000,000,000 bytes and a terabyte (TB) as 1,000,000,000,000 bytes. A computer operating system, however, reports storage capacity using powers of 2 for the definition of 1Gbit = 230 bits = 1,073,741,824 bits, 1GB = 230 bytes = 1,073,741,824 bytes and 1TB = 240 bytes = 1,099,511,627,776 bytes and therefore shows less storage capacity. Available storage capacity (including examples of various media files) will vary based on file size, formatting, settings, software and operating system, and/or pre-installed software applications, or media content. Actual formatted capacity may vary.
6 2.5-inch indicates the form factor of the SSD and not the drive’s physical size.
7 Drive Write(s) per Day: One full drive write per day means the drive can be written and re-written to full capacity once a day, every day, for the specified lifetime. Actual results may vary due to system configuration, usage, and other factors.
8 Read and write speed may vary depending on the host device, read and write conditions, and the file size.
9 Variances in individual test queries may occur in normal test runs. Average performance over time was consistent for encryption enabled and encryption disabled.
Trademarks
AMD, EPYC and combinations thereof are trademarks of Advanced Micro Devices, Inc. Dell, Dell EMC and PowerEdge are either registered trademarks or trademarks of Dell Inc. Microsoft, Windows and SQL Server are either registered trademarks or trademarks of Microsoft Corporation in the United States and/or other countries. NVMe is a registered trademark of NVM Express, Inc. PCIe is a registered trademark of PCI-SIG. TPC-C is a trademark of the Transaction Processing Performance Council. All company names, product names and service names may be the trademarks of their respective companies.
Disclaimers
© 2021 Dell, Inc. All rights reserved. Information in this performance brief, including product specifications, tested content, and assessments are current and believed to be accurate as of the date that the document was published, but is subject to change without prior notice. Technical and application information contained here is subject to the most recent applicable product specifications.

Protect Sensitive Data with a Confidential Computing Solution
Tue, 17 Jan 2023 06:08:27 -0000
|Read Time: 0 minutes
Summary
There are multiple considerations to take into account when deploying artificial intelligence and machine learning environments. This paper serves as a discussion and suggestion as to the possible hardware configurations to achieve a server infrastructure deployment that is secure and can grow with your increased need.
Enterprises in most industries are applying artificial intelligence/machine learning (AI/ML) to data. However, data privacy and sensitivity issues are preventing the use of AI/ML in health and financial sectors. This data cannot be shared, and it is limited to on- premises usage. Although this data must be protected from exposure to unauthorized parties, it is a valuable resource that could lead to groundbreaking discoveries and innovation in areas such as pandemic response, anti-money-laundering tactics and human trafficking
Confidential computing offers a way to expand the utility of such data while also keeping sensitive details sequestered and private. Dell EMC™ PowerEdge™ servers, built on 3rd Generation Intel® Xeon® Scalable processors, are available for the first time with confidential computing. A key feature is Intel Software Guard Extensions (Intel SGX), which provides an extra layer of hardware-based encryption in memory that helps protect data while it is being accessed. With Intel SGX, organizations can access and use multiple expansive datasets for AI applications, leading to greater insights. Intel SGX also helps ensure the integrity of the AI app to protect against intrusion, and it provides increased integrity to the platform whilst helping satisfy sovereignty requirements.
Key Considerations
- Decrease attack surfaces. Dell EMC PowerEdge servers based on Intel technologies expose fewer attack surfaces to hackers by making use of Intel SGX. The entire solution is built on an architecture that provides multiple layers of hardware- and software- based security. Security settings can be tailored to sequester only the most sensitive, privacy-protected data on Intel SGX to optimize performance.
- Accelerate inferencing. Intel performance optimizations that are built into Dell EMC PowerEdge servers can help speed AI inferencing. These optimizations include Intel and open-source software and hardware technologies, such as Intel Deep Learning Boost (Intel DL Boost) with Vector Neural Network Instructions (VNNI) for AI acceleration, Intel oneAPI Deep Neural Network Library (Intel oneDNN), the OpenVINO™ toolkit and optimized versions of TensorFlow™ and PyTorch®.
- Secure ecosystem. By creating a confidential computing environment with Intel SGX, ecosystem partners can improve the security of data collaboration between organizations that might have a need to keep data confidential and to protect intellectual property, even if a lack of trust exists between the parties. Secure ecosystem partners enable code and system integrity with Intel SGX for a growing list of AI solutions.
Available Configurations
| Base Configuration | Plus Configuration (More Memory for Larger Workloads) |
Platform | Dell EMC™ PowerEdge™ R650 servers, supporting 10 NVM Express® (NVMe®) drives (direct connection with no Dell™ PowerEdge RAID Controller [PERC]), 1 RU | |
CPU | 2 x Intel® Xeon® Gold 6348 processor (28 cores at 2.6 GHz) with 64 GB/CPU Intel® SGX enclave capacity | 2 x Intel® Xeon® Platinum 8368 processor (38 cores at 2.4 GHz) with 512 GB/CPU Intel® SGX enclave capacity |
DRAM | 256 GB (16 x 16 GB DDR4-3200) | 512 GB (16 x 32 GB DDR4-3200) |
Boot device | Dell EMC™ Boot Optimized Server Storage (BOSS)-S2 with 2 x 480 GB Intel® SSD S4510 M.2 Serial ATA (SATA) (RAID1) | |
Storage adapter | Dell PERC H755N front NVMe RAID adapteri | |
Cache storage (optional) | 1 x 400 GB Intel® Optane™ SSD P5800X (PCIe Gen4) or 1 x 375 GB Intel® Optane SSD DC P4800X (PCIe Gen3)ii | |
Capacity storage | 1 x (up to 9 x) 3.84 TB Intel® SSD P5500 (PCIe Gen4, read intensive) | |
Network interface controller (NIC) | Intel® Ethernet Network Adapter E810-XXV for OCP3 (dual-port 25 Gb) | |
Learn More
Written with Intel
Learn more about secure AI inferencing:
- “Intel and Consilient Join Forces to Fight Financial Fraud with AI”
- “Intel SGX Enables Magnit to Create a Trusted Computing Environment”
- “Spain’s largest hospitals connect for federated learning”
Contact your Dell or Intel account team. 1-877-289+-3355
- Read the Principled Technologies report: “Reap better SQL Server OLTP performance with next-generation Dell EMC PowerEdge MX servers.”
- View the Principled Technologies vSAN infographic.
i An NVM Express® (NVMe®) RAID adapter is optional, but it is recommended for configurations with a large number of capacity drives.
ii Cache storage is optional. Intel® Optane™ SSD P5800X drives are recommended when available, but the previous-generation Intel® Optane SSD DC P4800X can be used otherwise.
The information in this publication is provided as is. Dell Inc. makes no representations or warranties of any kind with respect to the information in this publication, and specifically disclaims implied warranties of merchantability or fitness for a particular purpose.

Memory Bandwidth for New PowerEdge Servers is Significantly Improved with Ice Lake Architecture
Tue, 17 Jan 2023 05:59:57 -0000
|Read Time: 0 minutes
Summary
New PowerEdge servers fueled by 3rd Generation Intel® Xeon® Scalable Processors can support sixteen DIMMs per CPU and 3200 MT/s memory speeds. This DfD will compare memory bandwidth readings observed on new PowerEdge servers with Ice Lake CPU architecture against prior-gen PowerEdge servers with Cascade Lake CPU architecture.
Ice Lake CPU Architecture
3rd Generation Intel® Xeon® Scalable Processors, known as Ice Lake processors, are the designated CPU for new Dell EMC Intel PowerEdge servers, like the R650 and R750. Compared to prior-gen 2nd Generation Intel® Xeon® Scalable Processors, Ice Lake architecture will support 33.3% more channels per CPU (an increase from six to eight) and 9.1% higher memory speeds (an increase from 2933 MT/s to 3200 MT/s.)
Performance Data
To quantify the impact of this increase in memory support, two studies were performed. The first study (see Figure 1) measured memory bandwidth determined by the number of DIMMs per CPU populated. The second study (see Figure 2) measured memory bandwidth determined by the number of CPU thread cores. Both STREAM bandwidth benchmarks have Ice Lake populated with eight 3200 MT/s DIMMs per channel, and Cascade Lake populated with six 2933 MT/s DIMMs per channel.
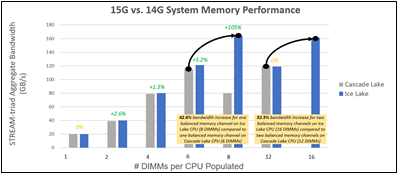
Figure 1 – Ice Lake and Cascade Lake bandwidth comparison by # of DIMMs per CPU
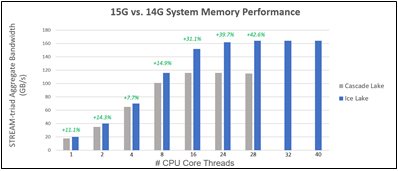
Figure 2 – Ice Lake and Cascade Lake bandwidth comparison by # of CPU core threads
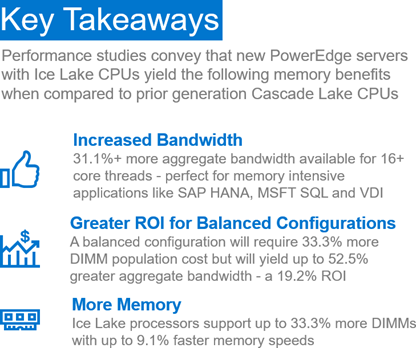

MLPerf Inference v0.7 Benchmarks on Dell EMC PowerEdge R740xd and R640 Servers
Tue, 17 Jan 2023 05:53:17 -0000
|Read Time: 0 minutes
Summary
MLPerf Consortium has released the second round of results v0.7 for its machine learning inference performance benchmark suite. Dell EMC has been participated in this contest in collaboration with several partners and configurations, including inferences with CPU only and with accelerators such as GPU’s and FPGA’s. This blog is focused on the submission results in the closed division/datacenter category for the servers Dell EMC PowerEdge R740xd and PowerEdge R640 with CPU only, in collaboration with Intel® and its Optimized Inference System based on OpenVINO™ 2020.4.
In this DfD we present the MLPerf Inference v0.7 results submission for the servers PowerEdge R740xd and R640 with Intel® processors, using the Intel® Optimized Inference System based on OpenVINO™ 2020.4. Table 1 shows the technical specifications of these systems.
Dell EMC PowerEdge R740xd and R640 Servers
Specs Dell EMC PowerEdge Servers
System Name | PowerEdge R740xd | PowerEdge R640 |
Status | Commercially Available | Commercially Available |
System Type | Data Center | Data Center |
Number of Nodes | 1 | 1 |
Host Processor Model Name | Intel®(R) Xeon(R) Platinum 8280M | Intel®(R) Xeon(R) Gold 6248R |
Host Processors per Node | 2 | 2 |
Host Processor Core Count | 28 | 24 |
Host Processor Frequency | 2.70 GHz | 3.00 GHz |
Host Memory Capacity | 384 GB 1 DPC 2933 MHz | 188 GB |
Host Storage Capacity | 1.59 TB | 200 GB |
Host Storage Type | SATA | SATA |
Accelerators per Node | n/a | n/a |
2nd Generation Intel® Xeon® Scalable Processors
The 2nd Generation Intel® Xeon® Scalable processor family is designed for data center modernization to drive operational efficiencies and higher productivity, leveraged with built-in AI acceleration tools, to provide the seamless performance foundation for data center and edge systems. Table 2 shows the technical specifications for CPU’s Intel® Xeon®.
Intel® Xeon® Processors
Product Collection | Platinum 8280M | Gold 6248R |
# of CPU Cores | 28 | 24 |
# of Threads | 56 | 48 |
Processor Base Frequency | 2.70 GHz | 3.00 GHz |
Max Turbo Speed | 4.00 GHz | 4.00 GHz |
Cache | 38.5 MB | 35.75 MB |
Memory Type | DDR4-2933 | DDR4-2933 |
Maximum memory Speed | 2933 MHz | 2933 MHz |
TDP | 205 W | 205 W |
ECC Memory Supported | Yes | Yes |
Table 2 - Intel Xeon Processors technical specifications
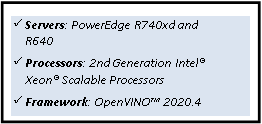
OpenVINO™ Toolkit
The OpenVINO™ toolkit optimizes and runs Deep Learning Neural Network models on Intel® Xeon CPUs. The toolkit consists of three primary components: inference engine, model optimizer, and intermediate representation (IP). The Model Optimizer is used to convert the MLPerf inference benchmark reference implementations from a framework into quantized INT8 models, optimized to run on Intel® architecture.
MLPerf Inference v0.7
The MLPerf inference benchmark measures how fast a system can perform ML inference using a trained model with new data in a variety of deployment scenarios. There are two benchmark suites, one for Datacenter systems and one for Edge as shown below in Table 3 with the list of six mature models included in the official release v0.7 for Datacenter systems category.
Area | Task | Model | Dataset |
Vision | Image classification | Resnet50-v1.5 | ImageNet (224x224) |
Vision | Object detection (large) | SSD-ResNet34 | COCO (1200x1200) |
Vision | Medical image segmentation | 3D UNET | BraTS 2019 (224x224x160) |
Speech | Speech-to-text | RNNT | Librispeech dev-clean (samples < 15 seconds) |
Language | Language processing | BERT | SQuAD v1.1 (max_seq_len=384) |
Commerce | Recommendation | DLRM | 1TB Click Logs |
The above models serve in a variety of critical inference applications or use cases known as “scenarios”, where each scenario requires different metrics, demonstrating production environment performance in the real practice. Below is the description of each scenario in Table 4 and the showing the scenarios required for each Datacenter benchmark.
Offline scenario: represents applications that process the input in batches of data available immediately, and don’t have latency constraint for the metric performance measured as samples per second.
Server scenario: this scenario represents deployment of online applications with random input queries, the metric performance is queries per second (QPS) subject to latency bound. The server scenario is more complicated in terms of latency constraints and input queries generation, this complexity is reflected in the throughput-degradation compared to offline scenario.
Area | Task | Required Scenarios |
Vision | Image classification | Server, Offline |
Vision | Object detection (large) | Server, Offline |
Vision | Medical image segmentation | Offline |
Speech | Speech-to-text | Server, Offline |
Language | Language processing | Server, Offline |
Commerce | Recommendation | Server, Offline |
Results
For MLPerf Inference v0.7, we focused on computer vision applications with the optimized models resnet50- v1.5 and ssd-resnet34 for offline and server scenarios (required for data center category). Figure 1 & Figure 2 show the graphs for Inference results on Dell EMC PowerEdge servers.
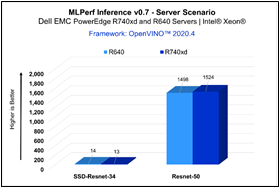
Figure 2 - Server Scenario
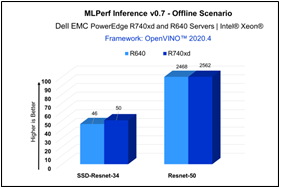
Figure 2 - Offline Scenario
| Resnet-50 | SSD-Resnet-34 | ||
Offline | Server | Offline | Server | |
PowerEdge R740xd | 2562 | 1524 | 50 | 13 |
PowerEdge R640 | 2468 | 1498 | 46 | 14 |
The results above demonstrate consistent inference performance using the 2nd Gen Intel® Xeon Scalable processors on the PowerEdge R640 and PowerEdge R740 platforms. The models Resnet-50 and SSD- Resnet34 are relatively smaller compared to other benchmarks included in the MLPerf Inference v0.7 suite, and customers looking to deploy image classification and object detection inference workloads with Intel CPUs can rely on these servers to meet their requirements, within the target throughput-latency budget.
Conclusion
Dell EMC PowerEdge R740xd and R640 servers with Intel® Xeon® processors and leveraging OpenVINO™ toolkit enables high-performance deep learning inference workloads for data center modernization, bringing efficiency and improved total cost of ownership (TCO).
Citation
@misc{reddi2019mlperf,
title={MLPerf Inference Benchmark},
author={Vijay Janapa Reddi and Christine Cheng and David Kanter and Peter Mattson and Guenther Schmuelling and Carole-Jean Wu and Brian Anderson and Maximilien Breughe and Mark Charlebois and William Chou and Ramesh Chukka and Cody Coleman and Sam Davis and Pan Deng and Greg Diamos and Jared Duke and Dave Fick and J. Scott Gardner and Itay Hubara and Sachin Idgunji and Thomas B. Jablin and Jeff Jiao and Tom St. John and Pankaj Kanwar and David Lee and Jeffery Liao and Anton Lokhmotov and Francisco Massa and Peng Meng and Paulius Micikevicius and Colin Osborne and Gennady Pekhimenko and Arun Tejusve Raghunath Rajan and Dilip Sequeira and Ashish Sirasao and Fei Sun and Hanlin Tang and Michael Thomson and Frank Wei and Ephrem Wu and Lingjie Xu and Koichi Yamada and Bing Yu and George Yuan and Aaron Zhong and Peizhao Zhang and Yuchen Zhou}, year={2019},
eprint={1911.02549}, archivePrefix={arXiv}, primaryClass={cs.LG}
}

NVMe Performance Increases for Next-Generation PowerEdge Servers with PERC11 Controller
Tue, 17 Jan 2023 05:48:58 -0000
|Read Time: 0 minutes
Summary
Dell Technologies newest RAID iteration, PERC11, has undergone significant change - most notably the inclusion of hardware RAID support for NVMe drives. To better understand the benefits that this will bring, various metrics were tested, including NVMe IOPS, disk bandwidth and latency. This DfD compares NVMe performance readings of the next-generation Dell EMC PowerEdge R650 server, powered by pre-production 3rd Generation Intel® Xeon® Scalable processors, to the prior-generation PowerEdge R640 server, powered by 2nd Generation Intel® Xeon® Scalable processors.
Introduction
With support for NVMe hardware RAID now available on the PERC11 H755N front, H755MX and H755 adapter form factors, we were eager to quanitfy how big of a performance boost next-generation PowerEdge servers with hardware RAID would obtain. Dell Technologies commissioned Principled Technologies to execute various studies that would compare the NVMe Input/Output Per Second (IOPS), disk bandwidth and latency readings of next-geneation PowerEdge servers (15G) with NVMe hardware RAID support against prior-generation PowerEdge servers (14G) without NVMe hardware RAID support.
Test Setup
Two servers were used for this study. The first was a PowerEdge R650 server populated with two 3rd Gen Intel® Xeon® Scalable processors, 1024GB of memory, 3.2TB of NVMe storage and a Dell PERC H755N storage controller. The second was a PowerEdge R640 server populated with two 2nd Gen Intel® Xeon® Gold Scalable processors, 128GB of memory, 1.9TB of SSD storage and a Dell PERC H730P Mini storage controller.
A tool called Flexible Input/Output (FIO) tester was used to create the I/O workloads used in testing. FIO invokes the production of threads or processes to do an I/O action as specified by the user. This test was chosen specifically because it injects the smallest system overhead of all the I/O benchmark tools we use. This in turn allows it to deliver enough data to the storage subsystem to reach 100% utilization. With the tool, five workloads were run at varied thread counts and queue depths on RAID 10, RAID 6, and RAID 5 levels of the Dell EMC PowerEdge R650 server with PERC H755n RAID controller and NVMe drives and the Dell EMC PowerEdge R640 server with a PERC H730P Mini controller and SATA SSD drives.
Read-heavy workloads indicate how quickly the servers can retrieve information from their disks, while write-heavy workloads indicate how quickly the servers can commit or save data to the disk. Additionally, random and sequential in the workload descriptions refer to the access patterns for reading or writing data. Random accesses require the server to pull data from multiple disks in a non-sequential fashion (i.e., visiting multiple websites), while sequential accesses require the server to pull data from a single continuous stream (i.e., streaming a video).
Performance Comparisons
IOPS
IOPS indicates the level of user requests that a server can handle. Based on the IOPS output seen during testing, upgrading from the prior-generation Dell EMC PowerEdge R640 server to the latest-generation Dell EMC PowerEdge R650 server could deliver performance gains for I/O-intensive applications. In all three RAID configurations tested, the PowerEdge R650 with NVMe SSDs delivered significantly more IOPS than the prior-generation server. Figures 1, 2 and 3 show how many average IOPS each configuration handled during testing:
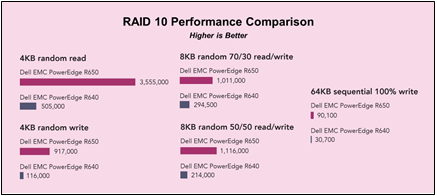
Figure 1: IOPS comparison for RAID 10 configurations
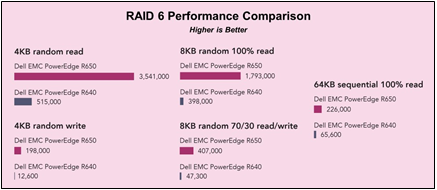
Figure 2: IOPS comparison for RAID 6 configurations
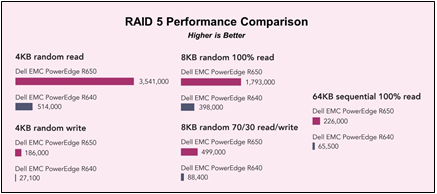
Figure 3: IOPS comparison for RAID 5 configurations
Disk Bandwidth
Disk bandwidth indicates the volume of data a system can read or write. A server with high disk bandwidth can process more data for large data requests, such as streaming video or big data applications. At all three RAID levels, the latest-generation Dell EMC PowerEdge R650 server with NVMe storage transferred significantly more MB per second than the prior-generation server. Figure 4 shows the disk bandwidth that each of the two servers supported for each RAID level:
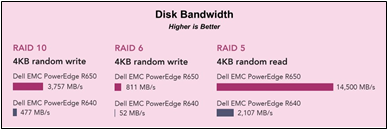
Figure 4: Disk bandwidth comparison for RAID 10, 6 and 5 configurations
Latency
Latency indicates how quickly the system can respond to a request for an I/O operation. Longer latency can impact application responsiveness and could contribute to a negative user experience. In addition to greater disk bandwidth, the Dell EMC PowerEdge R650 server delivered lower latency at each of the three RAID levels than the prior-generation server. Figure 5 shows the latency that each server delivered while running one workload at each RAID level.
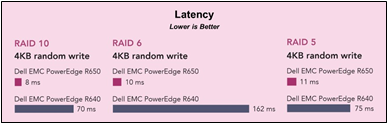
Figure 5: Latency comparison for RAID 10, 6 and 5 configurations
Conclusion
The next-generation PowerEdge R650 server with NVMe HW RAID support increased IOPS by up to 15.7x, disk bandwidth by up to 15.5x, and decreased latency by up to 93%. With the inclusion of NVMe HW RAID support on Dell Technologies’ new PERC11 controllers, now is a great time for PowerEdge customers to migrate their storage medium over to NVMe drives and yield the higher-performance that comes with it!
For more details, please read the full PT report Accelerate I/O with NVMe drives on the New PowerEdge R650 server

PowerEdge “xs” Optimizations for Virtualization
Tue, 17 Jan 2023 05:36:08 -0000
|Read Time: 0 minutes
Summary
With the recent announcement of 3rd Gen Intel® Xeon® Scalable processors Dell has announced 2 new PowerEdge models designed for virtualization. The new R650xs is a 1U design with support for up to 10 hard drives. Customers can choose between the following options:
- (10) 2.5” SAS/SATA
- (10) 2.5” NVMe
- (4) 3.5” SAS/SATA
The new R750xs is a 2U design with support for a maximum of 24 hard drives. Customers can choose between the following options:
- (16) 2.5” SAS/SATA
- (16) 2.5” SAS/SATA + (8) NVMe
- (12) 3.5” SAS/SATA
- (12) 3.5” SAS/SATA + (2) rear mounted 2.5” drives
The R650xs and R750xs systems support CPU’s with TDP’s up to 220W and 32 cores as well as new RDMA based network interface cards designed specifically to improve performance in a Software Defined Storage environment like vSAN. Both models support a maximum of 1TB of memory using 64GB DIMM’s.
Introduction
Virtualization environments place significant demands on server Hardware. The CPU subsystem is the most obvious since key specifications like core count, core frequency and the availability of technologies like “hyperthreading” play a key role in determining the number of virtual machines that can be hosted. Memory capacity and performance is another key area of consideration since the ability of the system to deliver optimal virtualization performance is contingent on its ability to deliver data to the CPU subsystem as quickly as possible. The communications subsystem is equally important not only to deliver the required Input/Output necessary for applications but also to deliver optimal performance for technologies like vSAN or other software defined storage solutions. Storage capacity and performance also plays a role even in environments where “boot from SAN” are utilized.
The new PowerEdge R650xs and R750x have been specifically designed to meet these needs by combining high performance options for each subsystem with optimal capacity and flexibility for virtualized environments.
Design Optimizations – CPU Subsystem
The current VMWare licensing structure is based on the number of processors installed however, it is important to note that the standard processor license is limited to 32 cores. Customers can go beyond this to support higher core counts however, incremental licensing cost is incurred when doing so. In addition, virtualization solutions are typically deployed in large numbers so power and cooling efficiency is a key requirement.
The design of the R650xs and the R750xs addresses these elements in multiple ways. First, the highest core count CPU supported on these models is the Intel® Xeon® Gold 6338 Processor. This processor provides 32 cores (64 threads) and operates at a Thermal Design Point (TDP) of 205 Watts with each core operating at a base frequency of 2.00 GHz and a Turbo frequency of up to 3.20 GHz.
As noted above, power and cooling are key considerations as well. The R650xs and R750xs are designed to support CPU’s with a maximum TDP of 220Watts. By limiting the TDP rating for these systems, Dell Engineers were able to focus on designing these systems to reduce operating cost by reducing fan speeds and reducing overall system power budget.
The R650xs and R750xs support a wide range of processor options with core counts ranging from 8 cores per CPU (Intel® Xeon® Gold 6334 – 3.70 GHz) to 32 cores per CPU (Intel® Xeon® Gold 6338 – 2.00GHz) and with options ranging from “Silver” class CPU’s to “Gold” class CPU’s.
Design Optimizations – Memory Subsystem
The R650xs and R750xs are designed to deliver 1 memory DIMM per CPU memory channel and optimal performance can only be achieved with a fully balanced configuration. A “fully balanced” configuration means that all channels are populated with the same number of DIMM’s. 3rd Generation Intel® Xeon® processors have 8 memory channels so the R650xs and R750xs have been designed to support up to 16 DIMM’s per system. While these processors can support up to 2 DIMM’s per channel, research conducted by Dell indicates that 99% of customers configure their virtualized systems with less than 1TB of memory. The R650xs and R750xs offer options for 16GB DIMM’s (x16 = 256GB), 32GB DIMM’s (x16 = 512GB) and 64GB DIMM’s (x16 = 1TB).
Memory capacity requirements are often determined by the GB/VM ratio. The challenge many customers face with this approach is cost. Higher capacity DIMM’s cost more than lower capacity DIMM’s, however, the $/GB ratio of a 64GB DIMM is becoming similar to the ratio of a 32GB DIMM. This means that customers can achieve the same balance that was achieved for previous server generations with fewer DIMM sockets. As the chart below shows, an “xs” system with only 16 DIMM sockets populated with 64GB DIMM’s (1TB total) gives compelling GB/VM even with 32 core CPU’s.
| Threads/2P (with |
| VM's per |
|
Cores/CPU | Hyperthreading) | Threads/VM | Server | GB/VM |
32 | 128 | 2 | 64 | 16GB |
32 | 128 | 4 | 32 | 32GB |
32 | 128 | 8 | 16 | 64GB |
32 | 128 | 16 | 8 | 128GB |
There are several additional advantages to systems like the R650xs and R750xs that offer 16 DIMM sockets rather than 32. The first is reduced power and cooling requirements. For example, assuming a power requirement for memory of 5W per socket, by cutting the number of DIMM sockets in half, an “xs” power budget can be reduced by up to 80W. This in turn reduces the amount of cooling required which allows the use of more cost effective fans and potentially reduced cost by limiting baffles and other hardware used to direct air flow. This also helps explains why an “xs” system can be configured with a power supply as small as 600W while a “standard” system requires a minimum of 800W power supplies to operate. Note that the size of the power supply required is dependent upon the final configuration but in many cases, an “xs” system will operate with a smaller power supply than a system with 32 DIMM sockets.
Another advantage is cost. While the cost of a DIMM socket might be quite low, DDR4 DIMM’s have 288 pins. Each socket needs to connect to the CPU and a design with 16 DIMM sockets requires 4,608 (288 x 16 = 4,608) fewer connections. Fewer connections translates to less complexity of the motherboard design and a drop of this scale can reduce the number of layers the board requires which has a significant impact on the cost of the system.
Design Optimizations – Communications Subsystem
Networking subsystems are vital for virtualized environments. The new R650xs and R750xs address this need by offering a wealth of networking options. Integrated within each design is an OCP3.0 connector. This connector provides and industry standard mechanism for embedding network controllers such as 10Gb/s NIC’s, 25GB/s NIC’s, 40Gb/s NIC’s and 100Gb/s NIC’s. Further, customers can expand the networking capabilities of these system through the addition of PCIe based network interface cards.
An additional benefit is the availability of new networking options that utilize RDMA (Remote Direct Memory Access) such as the Dell E810-XXV, which is a 25Gb/s dual port controller that offers specialized firmware options specific for VMWare vSAN. By offloading networking processing for vSAN, this board is able to offer significant performance improvements over previous generation technologies. Recent testing by a 3rd party showed up to 1.9x better performance of systems utilizing RDMA based NIC’s for vSAN compared to the previous generation, as seen here. While these tests were run on a different system, much of the performance gains can be attributed to this NIC.
Design Optimizations – Storage Subsystem
The R650xs and R750xs offer a number of different storage options including:
- Discrete drive support for vSAN:
- The R650xs supports up to (10) 2.5” SAS/SATA devices or (10) 2.5” NVMe devices
- Alternatively, the R650xs can also be purchased with support for (4) 3.5” devices
- The R750xs supports up to (16) 2.5” SAS/SATA devices or (16) SAS/SATA plus (8) NVMe devices
- Alternatively, the R750xs can also be purchased with support for (12) 3.5” devices
- The R750xs also supports an additional (2) 2.5” devices option in the rear of the system for the 3.5” configuration only
- Both systems support the BOSS system with redundant storage devices. The R750xs also supports the “Hot Plug” BOSS controller
- The R650xs supports up to (10) 2.5” SAS/SATA devices or (10) 2.5” NVMe devices
- PERC 11 RAID Controllers
- For customers who wish to utilize local storage for maximum performance, both the R650xs and the R750xs support the new H755 PERC controller (RAID 0,1,10,5,6) and the new H755n NVMe based PERC controller (RAID 0,1,10,5,6)
- Recent 3rd party testing of the H755n NVMe RAID controller demonstrated up to 15x better performance than previous generation technologies, as seen here.
Design Optimizations – Other Subsystems
It is important to note that all models support key PowerEdge features, such as:
- iDRAC 9 and OpenManage
- Support for OpenManage Integration for VMWare vCenter (OMIVV)
- PCIe 4.0 slots – up to 3 in the R650xs series and up to 6 in the R750xs series both with SNAP I/O options
- 3200MT/s Memory
- Installation in standard depth racks
Conclusion
The new R650xs and R750xs deliver an optimal virtualization experience with support for the latest industry standard technologies and configuration options ideal for virtualized environments.

PowerEdge “xs” vs. “Standard” vs. “xa” Servers

Tue, 17 Jan 2023 05:30:43 -0000
|Read Time: 0 minutes
Summary
With the recent announcement of 3rd Gen Intel® Xeon® Scalable processors, Dell has announced 2 different models of the R650 and 3 different models of the R750 to meet emerging customer demands. This paper is intended to highlight the engineering elements of each design and to describe the reason for the expansion of the portfolio.
These 3 classes of systems are designed to optimize for differing workloads.
- The R750xa design is optimized for heavy compute environments and to support this, it has been designed for maximum cooling with front mount slots for the use of GPU’s and support for CPU Thermal Design Points (TDP’s) up to 270W and 40 cores.
- The R650 and R750 systems are also designed for heavy compute environments but are designed for maximum flexibility. This includes enhanced drive counts to deliver optimal storage capacity, and CPU’s with TDP’s up to 270W and 40 cores.
- The R650xs and R750xs systems are designed for traditional virtualized environments and support CPU’s with TDP’s up to 220W and 32 cores. performance in a Software Defined Storage environment like vSAN. Both models support a maximum of 1TB of memory using 64GB DIMM’s.
Introduction
Optimizing between cost, performance and scalability is a difficult balancing act when designing a Server. Mainstream environments like virtualization have established design points that focus on cores, memory capacity and storage density to achieve the ideal configuration. The advent of new technologies like Persistent Memory places additional demands on the design and emerging applications like Artificial Intelligence (AI) and Machine Learning (ML) stretch these designs even further.
The challenge for server design teams is to strike an effective balance that delivers maximum performance for each workload/environment but doesn’t overly burden the customer with unnecessary cost for features they might not use. To illustrate this, consider that a server designed for maximum performance with an in-memory database will require higher memory density while a server designed for AI/ML might benefit from enhanced GPU support and a server designed for virtualization with software defined storage might benefit from enhanced disk counts as shown in the chart below. All of these technologies could take advantage of a new processor design and all need access to memory, but each requires a unique approach to deliver optimization.
| Virtualization | AI/ML | Database |
Memory Capacity |
|
|
|
GPU Support |
|
|
|
Storage Capacity |
|
|
|
While it may be technically possible to build a single system that could achieve all of this, the end result would be much more expensive to purchase and could be potentially larger. For example, a system capable of powering and cooling multiple 400W GPU’s needs to have bigger power supplies, stronger fans, additional space (particularly for double wide GPU’s) and high core count CPU’s. Conversely, a system designed as a virtualization node might require none of these optimizations. Trying to optimize for all often results in unacceptable trade-offs for each.
To achieve truly optimized systems, Dell Technologies is launching 3 classes of its industry leading PowerEdge Rack Servers. The “xa” model, the “standard” models and the “xs” models. The “xa” model is designed for optimization in AI/ML environments and to support that, delivers optimized power, cooling and enhanced GPU support. The “standard” models are flexible enough to deliver an enhanced virtualization or Database environment with the addition of storage capacity and extra memory expansion using DRAM or Persistent Memory (PMEM) and the “xs” models are designed for mainstream virtualization with large disk capacities, CPU support for up to 32 cores and cost effective memory capacities of up to 1TB.
Design Optimizations
As noted above, the “xa” model is optimized for GPU, the “standard” models are optimized for high performance compute and the “xs” models are optimized for virtualized environments. Below is an overview of the key feature differences:
| R650xs | R650 | R750xs | R750 | R750xa |
Height | 1U | 1U | 2U | 2U | 2U |
CPU | Up to 220W | Up to 270W | Up to 220W | Up to 270W | Up to 270W |
Max Core Count1 | 32 | 40 | 32 | 40 | 40 |
Memory slots | 16 | 32 | 16 | 32 | 32 |
Drives supported |
Up to 10 SAS/SATA or NVMe |
Up to 10 SAS/SATA or NVMe + 2 optional rear mount drives |
Up to 24 with 16 SAS/SATA + 8 NVMe | Up to 24 SAS/SATA or NVMe or mixed + 4 optional rear mount drives |
Up to 8 SAS/SATA or NVMe |
Intel® OptaneTM | None | Full Support | None | Full Support | Full Support |
GPU Support* |
None |
Up to 3 SW |
None | Up to 2 DW2 or 6 SW3 | up to 4 DW2 or 6 SW3 |
Boot Support | Boss2 | Hot Plug Boss 2 | Hot Plug Boss 2 | Hot Plug Boss 2 | Hot Plug Boss 2 |
Cooling | Cold Plug Fans | Hot Plug Fans | Hot Plug Fans | Hot Plug Fans | Hot Plug Fans |
Power Supplies |
Redundant 600W to 1400W |
Redundant 800W to 1400W |
Redundant 600W to 1400W |
Redundant 800W to 2400W | Redundant 1400W to 2400W |
Depth | 749mm | 823mm | 721mm | 736mm | 837.2mm |
1Based on current 3rd Gen Intel® Xeon® Scalable processor family
2DW=Double Wide GPU
3SW=Single Wide GPU
While key specifications differ between models, much remains the same. It is important to note that all models support key features such as:
- iDRAC 9 and OpenManage
- OCP3.0 Networking options
- PCIe 4.0 slots – up to 3 in the R650xx series and up to 8 in the R750xx series
- PERC 11 RAID including optional support for NVMe RAID
- 3200MT/s Memory
- Installation in standard depth racks
“xa” Design
As noted above, the R750xa is optimized for enhanced GPU support. This support is accomplished by moving 2 of the rear PCIe cages to the front as highlighted in the graphic below. Each of these cages can support up to 2 Double Width GPU’s and in the case of the NVidia A100, each pair can be linked together with NVLink bridges. Additional PCIe slots are available in the rear of the system. GPU workloads typically require less internal storage than mainstream workloads so with this change, internal storage has been located in middle of the front of the server and provide up to 8 SAS/SATA, NVMe or a mix of drive types. All of these configurations are available with optional support for RAID using the new PERC11 based H755 (SAS/SATA) or H755n (NVMe). These RAID controllers are located directly behind the drive cage to save space and are connected directly to the Motherboard of the system to ensure PCIe 4.0 speeds. To accommodate these new technologies, the depth of the chassis has been extended by 101.2mm (compared to the R750 “standard”) but will still fit within a standard depth rack. To ensure the highest levels of performance, this model ships with optional support for the 2nd Generation of Intel® OptaneTM Memory, up to 32 DIMM slots and Processors with up to 40 cores.
“Standard” Design
The R650/R750 “standard” models have been designed to accommodate the flexibility necessary to address a wide variety of workloads. With support for large numbers of hard drives (up to 12 in the R650 and up to 28 in the R750), these models also offer optional performance and reliability features with the new PERC 11 RAID controller using the PERC H755 (SAS/SATA) or H755n (NVMe) including a “Dual PERC” option with multiple controllers. These RAID controllers are located directly behind the drive cage to save space and are connected directly to the Motherboard of the system to ensure PCIe 4.0 speeds. To ensure the highest levels of performance, these model ship with optional support for the 2nd Generation of Intel® OptaneTM Memory, up to 32 DIMM slots and Processors with up to 40 cores. In addition, both models support GPU but to a lesser extent than the “xa” series.
“xs” Design
When designing for virtualization, a number of key factors emerge. Storage requirements often serve software defined storage schemas (like vSAN) while the ability of a hypervisor to segment memory and cores creates a need to balance between the two. To meet these demands, the new “xs” designs include support for up to 16 DIMM’s, which translates to 1TB of DRAM when using 64GB DIMM’s, CPU’s with up to 32 cores and internal storage of up to 24 drives (16 SAS/SATA+8 NVMe – R750xs) or 10 drives (SAS/SATA or NVMe – R650xs). These designs assign 1 DIMM socket per channel allowing customers to scale out with balanced configurations. These models were also optimized to provide a lower acquisition cost. While the cost of a DIMM socket might appear insignificant, the impact of reducing the number of DIMM sockets is large. The most obvious is power and cooling. Any design needs to reserve enough “headroom” for a full configuration and by cutting the number of DIMM sockets in half, an “xs” power budget can be reduced. This in turn reduces the amount of cooling required which allows the use of more cost effective fans and potentially reduced cost by limiting baffles and other hardware used to direct air flow. This also helps explains why an “xs” system can operate on a power supply as small as 600W while a “standard” system requires a minimum of 800W power supplies to operate. Another impact to cost is the fact that increasing the number of DIMM sockets in a system increases the complexity of the design. A DDR4 DIMM has 288 pins and by removing 16 sockets from the design, 4,608 electrical traces were also removed. Reducing the number of electrical traces by this scale allows the motherboard to be built with fewer “layers” which translates directly into a lower cost. Recent pricing trends for memory have created an opportunity to achieve excellent performance, scalability and balance with smaller numbers of DIMM’s. Specifically, the $/GB ratio of a 64GB DIMM is evolving to be similar to the ratio of a 32GB DIMM. This means that customers can achieve the same balance that was achieved with previous generations with fewer DIMM sockets.
Conclusion
With the launch of the new 3rd Gen Intel® Xeon® Scalable processors, Dell Technologies is able to deliver a range of new technologies to meet customer requirements. From the “xa” model and its ability to deliver high GPU density to the “standard” models that deliver a robust platform for a wide range of workloads through to the “xs” series that delivers compelling price:performance, customers can now achieve a level of optimization not previously available.

Speed Time to Production with a High-Performing Simulation and Modeling Solution from Dell and Intel
Tue, 17 Jan 2023 05:19:17 -0000
|Read Time: 0 minutes
Summary
Computer-aided engineering solutions use high- performance computing (HPC) configurations to deliver the required scalability and performance. In this document, Intel and Dell Technologies present hardware recommendations certified to deliver the optimal level of performance using PowerEdge servers.
Manufacturing companies and research organizations use computer-aided engineering (CAE) to reduce costs and design products that provide a competitive edge. CAE requires a lot of compute power for simulation and modeling applications that are often distributed across high-performance computing (HPC) clusters. These companies face challenges in deploying and maintaining scalable HPC clusters while also getting their final products to market in a reasonable amount of time.
Dell Technologies and Intel can help with a complete bill of materials (BoM) that is configured and certified to deliver the performance required for demanding simulation and modeling applications. The BoM features PowerEdge rack server nodes powered by 3rd Generation Intel® Xeon® Scalable processors and key hardware components that comply with industry standards and best practices for Intel® based clusters.
The Base configuration provides the foundation for simulation and modeling applications on a small cluster, while the Plus configuration provides a higher core count and memory capacity for more complex, demanding workloads. The configurations use Ethernet as a starting point, but they can be adapted as needed to use InfiniBand fabric.
Key considerations
Key considerations for deploying simulation and modeling workloads on PowerEdge servers include the following:
- Core count: Simulation and modeling applications can run on small clusters starting at 16 cores per CPU and increasing to 28 cores per CPU to meet performance requirements.
- Scalability: This BoM provides four nodes for both the Base and Plus configurations, which is the minimum recommended configuration for simulation and modeling use cases. You can scale the configurations horizontally depending on your workload and needs.
- Flexibility: Although the BoM provides storage components, you can easily integrate both configurations into any storage solution. Speak to your Dell Technologies representative to design a custom configuration suited for your specific needs.
Table 1. Available configurations
| Base configuration | Plus configuration |
Platform | 4 x PowerEdge R650 servers | |
CPU (per server) | 2 x Intel® Xeon® Gold 6326 processor (16 cores at 2.9 GHz) | 2 x Intel® Xeon® Gold 6348 processor (28 cores at 2.6 GHz) |
DRAM | 256 GB (16 x 16 GB DDR4-3200 MHz) | 512 GB (16 x 32 GB DDR4-3200 MHz) |
Boot device | Boot Optimized Server Storage (BOSS)-S2 with 2 x 480 GB M.2 Serial ATA (SATA) solid-state drives (SSD) (RAID1) | |
Local storage | 3.84 TB Intel® SSD P5500 | |
Management network | Dual-port 10 gigabit Ethernet (GbE) Intel® Ethernet Network Adapter X710 OCP3 adapter | |
Message fabric | 100 GbE Intel® Ethernet Network Adapter E810-CQDA2 | |
Learn more
Contact your dedicated Dell Technologies or Intel account team for a customized quote. 1-877-289-3355
- Read the Intel solution spotlight: www.intel.com/content/www/us/en/products/docs/select-solutions/simulation- modeling-ver3-spotlight.html
- Find out more about Intel Select Solutions: www.intel.com/content/www/us/en/architecture-and-technology/intel- select-solutions-overview.html

Deploy Splunk Enterprise Efficiently with Red Hat OpenShift on Dell Servers with Intel® Technologies
Tue, 17 Jan 2023 05:13:39 -0000
|Read Time: 0 minutes
Summary
Splunk Enterprise containerized deployments with Red Hat OpenShift can deliver substantial business benefits. In this brief, Intel and Dell technologists discuss key considerations to successfully deploy Splunk based containers, with recommendations on configurations based on the most recent 15th Generation PowerEdge Server portfolio offerings.
Integrating data strategy into business strategy is key to digital transformation. To harness the value of untapped data, many organizations are turning to Splunk Enterprise, a high-performance data-analytics platform that enables decision makers to bring data to every question, decision, and action.
To deploy workloads like Splunk Enterprise more efficiently, IT architects are choosing containerization. Red Hat OpenShift, an enterprise-ready Kubernetes container platform, is a popular choice. By using Red Hat OpenShift, architects don’t need to separate dedicated nodes for each Splunk Enterprise function, and they can add more nodes and scale them separately from storage.
Intel and Splunk have partnered to develop recommended hardware configurations for deploying Splunk Enterprise with Red Hat OpenShift on Dell PowerEdge servers. Organizations that use these configurations can benefit from the high performance enabled by Intel® compute, storage, and network technologies.
Key Considerations
Key considerations for deploying Splunk Enterprise with Red Hat OpenShift successfully include:
- Size local NVM Express (NVMe) storage. Size local NVMe storage for persistent volumes according to the expected ingestion rate and hot-data-retention period. Size by adding more or larger drives.
- Deploy additional storage nodes. Deploy additional storage nodes to scale object-store capacity for Splunk SmartStore independently of worker nodes. Optimize for the expected ingestion rate and warm or cold data retention using high-performance (with NVMe solid-state drives [SSDs]) or high-capacity (with rotational hard-disk drives [HDDs]) configurations with a set of storage policies. An in- cluster solution based on MinIO is recommended. Alternatively, an external S3-compatible object store like Dell PowerScale (Isilon) or Elastic Cloud Storage (ECS) can be used. For dedicated network storage, an additional network interface controller (NIC) can be used. Contact Dell Technologies for help choosing the proper storage solution.
- Manage NVMe drives. Manage NVMe drives for local and object storage using the Local Storage Operator. If necessary, partition the drives to get more volumes with smaller size. Configure proper redundancy and replication on the application layer.
Available Configurations
| Red Hat OpenShift Control Plane (Master) Nodes-3 Nodes Required | Splunk Worker Nodes | Optional Dedicated Storage Node for Object Storage | ||||
Platform | Dell PowerEdge R650 server supporting 10 x 2.5” drives with NVMe backplane | Dell PowerEdge R750 server supporting 16 x 2.5” drives with NVMe backplane (direct) | Dell PowerEdge R650 server supporting 10 x 2.5” drives with NVMe backplane (direct) | Dell PowerEdge R750 server supporting 12 x 3.5” drives with Serial- Attached SCSI (SAS)/Serial ATA (SATA) backplane | |||
Node type |
| Base configuration | Plus configuration | High performance | High capacity | ||
CPU | 2 x Intel® Xeon® Gold 6326 processor (16 cores at 2.9 GHz) or better | 2 x Intel® Xeon® Gold 6348 processor (28 cores at 2.6 GHz) | 2 x Intel® Xeon® Platinum 8360Y processor (36 cores at 2.4 GHz) | 2 x Intel® Xeon® Gold 6342 processor (24 cores at 2.8 GHz) | 2 x Intel® Xeon® Gold 6326 processor (16 cores at 2.9 GHz) | ||
DRAM | 128 GB (16 x 8 GB DDR4-3200) | 256 GB (16 x 16 GB DDR4-3200) | 512 GB (16 x 32 GB DDR4- 3200) | 128 GB (16 x 8 GB DDR4-3200) | |||
Storage controller | Not applicable (N/A) | HBA355i adapter | |||||
Persistent memory | Not applicable N/A | Optional | N/A | ||||
Boot device | Dell Boot Optimized Server Storage (BOSS)-S2 with 2 x 480 GB M.2 SATA SSD (RAID1) | ||||||
Ephemeral storagei |
1 x 1.6 TB Intel® SSD P5600 NVMe |
1 x 1.6 TB Intel® SSD P5600 (PCIe Gen4, mixed-use) |
N/A | ||||
Local storageii | N/A | 1 x (up to 5 x) 1.6 TB or 3.2 TB Intel® SSD P5600 (PCIe Gen4, mixed-use) | N/A | ||||
Object storageiii |
N/A |
4 x (up to 10 x) 2 TB, 4 TB or 8 TB Intel® SSD P5500 (PCIe Gen4, read-intensive) |
Up to 10 x 2 TB, 4 TB, 8 TB Intel® SSD P5500 (PCIe Gen4, read-intensive) |
Up to 12 x 8 TB, 12 TB, 18 TB 3.5-in 12 Gbps SAS HDD 7.2K rotations per minute (RPM) | |||
Network interface controller (NIC)iv | Intel® Ethernet Network Adapter E810-XXVDA2 for OCP3 (dual-port 25 gigabit Ethernet [GbE]) | Intel® Ethernet Network Adapter E810-XXV for OCP3 (dual-port 25 Gb) or Intel Ethernet Network Adapter E810-CQDA2 PCIe add-on card (dual-port 100 Gb) | Intel® Ethernet Network Adapter E810-CQDA2 PCIe add-on card (dual- port 100 Gb) | Intel® Ethernet Network Adapter E810-XXV for OCP3 (dual-port 25 Gb) | |||
Additional NIC for external storagev |
N/A | Intel® Ethernet Network Adapter E810-XXV PCIe add-on card (dual- port 25 Gb) or Intel® Ethernet Network Adapter E810-CQDA2 PCIe add-on card (dual-port 100 Gb) |
N/A | ||||
Learn More
Contact your dedicated Dell or Intel account team for a customized quote. 1-877-289-3355 “Build High Performance Splunk SmartStores with MinIO”
“Harness the Power of Splunk with Dell Storage”
i Ephemeral storage is used only for container images and ephemeral volumes.
ii Local storage for persistent volumes includes Splunk® hot tier.
iii The number of drives and capacity for MinIO® object storage depends on the dataset size and performance requirements.
iv 100 Gb NICs recommended for higher throughput.
v Optional; required only if dedicated storage network for external storage system is necessary.
Note: This document may contain language from third-party content that is not under
Dell Technologies’ control and is not consistent with current guidelines for Dell Technologies’ own content. When such third-party content is updated by the relevant third parties, this document will be revised accordingly.

Access Data Insights Faster by Deploying Splunk Enterprise with VMware Tanzu
Tue, 17 Jan 2023 05:06:20 -0000
|Read Time: 0 minutes
Summary
Splunk Enterprise containerized deployments with VMWare Tanzu can deliver substantial business benefits. In this brief, Intel and Dell technologists discuss key considerations to successfully deploy Splunk based containers, with recommendations on configurations based on the most recent 15th Generation PowerEdge Server portfolio offerings.
Enterprises have massive amounts of data available, but in raw form: there is still a lot of work to do. Data comes from different sources, in different structures, and on different time scales. To pull data together for analysis and gain insights for business transformation, enterprises turn to Splunk Enterprise, a data-analytics platform that enables enterprises to monitor, analyze, and act on data. The resulting insights enable decision makers to identify security threats, optimize application performance, understand customer behavior, and more.
To deploy Splunk Enterprise more efficiently, organizations are using Kubernetes container orchestration through tools like VMware Tanzu. Containers are lightweight, efficient ways to deploy and manage applications.
This article outlines recommended hardware configurations for deploying Splunk Enterprise with VMware Tanzu on Dell PowerEdge servers. These configurations feature Intel® Xeon® Scalable processors, Intel® Optane™ storage and Intel® Ethernet Network Adapters to enable high performance.
Key Considerations
Key considerations for deploying Splunk using VMware Tanzu include the following. Note that VMware Tanzu is deployed on VMware vSphere with VMware vSAN underneath.
- Size persistent volumes based on ingestion rate. Persistent volumes are stored on the vSAN storage and should be sized according to the expected ingestion rate and hot data retention period. More and/or larger drives for vSAN can be used if necessary.
- Use high-performance or high-capacity configurations for object storage. Object storage capacity can be scaled independently of worker nodes by deploying additional storage nodes. Both high- performance (with NVM Express [NVMe] solid-state drives [SSDs]) and high-capacity (with rotational hard-disk drives [HDDs]) configurations can be used. An in-cluster solution based on MinIO is recommended. Alternatively, an external S3-compatible object store like Dell PowerScale (Isilon) or Elastic Cloud Storage (ECS) is an option. An additional network interface controller (NIC) can be used for dedicated network storage. Contact Dell Technologies for help choosing the proper storage solution.
- Deploy VMware vCenter management virtual machines (VMs). Deploy VMware vCenter management VMs on the same cluster. Deployment outside the cluster on a separate machine is not covered in this hardware bill of materials (BoM).
Available Configurations
Node Type | Splunk Worker Nodes (Minimum of 4 Nodes Required, up to 64 Nodes per Cluster) | Optional Dedicated Storage Nodes | |||
High Performance | High Capacity | ||||
Platform | Dell PowerEdge R750 server supporting 16 x 2.5” drives with NVMe backplane— direct connection | Dell PowerEdge R650 server supporting 10 x 2.5” drives with NVMe backplane | Dell PowerEdge R750 supporting 12 x 3.5” drives with Serial- Attached SCSI (SAS)/Serial ATA (SATA) backplane | ||
CPU | Base Configuration | Plus Configuration | 2 x Intel® Xeon® Gold 6342 processor (24 cores at 2.8 GHz) | 2 x Intel® Xeon® Gold 6326 processor (16 cores at 2.9 GHz) | |
2 x Intel® Xeon® Gold 6348 processor (28 cores at 2.6 GHz) | 2 x Intel® Xeon® Platinum 8360Y processor (36 cores at 2.4 GHz) | ||||
DRAM | 256 GB (16 x 16 GB DDR4-3200) | 512 GB (16 x 32 GB DDR4-3200) | 128 GB (16 x 8 GB DDR4-3200) | ||
Storage controller | Not applicable (N/A) | HBA355i adapter | |||
Persistent memory | Optional | N/A | |||
Boot device | Dell Boot Optimized Server Storage (BOSS)-S2 with 2 x 480 GB M.2 SATA SSD (RAID1) | ||||
VMware vSAN cache tieri | 2 x 400 GB Intel® Optane™ SSD P5800X (PCIe Gen4) |
N/A | |||
VMware vSAN capacity tierii | 4 x 1.92 TB or 3.84 TB Intel® SSD P5500 (PCIe Gen4, read-intensive) | N/A | |||
Object storageiii | 4 x (up to 10 x) 1.92 TB, 3.84 TB or 7.68 TB Intel® SSD P5500 (PCIe Gen4, read- intensive) | Up to 10 x 1.92 TB, 3.84 TB or 7.68 TB Intel® SSD P5500 (PCIe Gen4, read-intensive) | Up to 12 x 8 TB, 12 TB or 18 TB 3.5-in 12 Gbps SAS HDD, 7.2K rotations per minute (RPM) | ||
NICiv |
Intel® Ethernet Network Adapter E810- XXV for OCP3 (dual-port 25 Gb) or Intel® Ethernet Network Adapter E810-CQDA2 PCIe add-on card (dual-port 100 Gb) | Intel® Ethernet Network Adapter E810-CQDA2 PCIe add-on card (dual-port 100 Gb) | Intel® Ethernet Network Adapter E810-XXV for OCP3 (dual-port 25 Gb) | ||
Additional NICv | Intel® Ethernet Network Adapter E810- XXV for OCP3 (dual-port 25 Gb) or Intel® Ethernet Network Adapter E810-CQDA2 PCIe add-on card (dual-port 100 Gb) |
N/A | |||
Learn More
Written With Intel
Contact your dedicated Dell or Intel account team for a customized quote. 1-877-289-3355 “Build High Performance Splunk SmartStores with MinIO”
“Harness the Power of Splunk with Dell Storage”
i VMware vSAN storage used for VMs and container ephemeral and persistent volumes.
ii VMware vSAN storage used for VMs and container ephemeral and persistent volumes.
iii Number of drives and capacity for MinIO object storage depends on the dataset size and performance requirements.
iv 100 Gb NICs recommended for higher throughput.
v Optional; required only if a dedicated storage network for external storage system is necessary.

Deploy DataStax Enterprise Quickly Using VMware vSphere with Tanzu
Tue, 17 Jan 2023 04:51:07 -0000
|Read Time: 0 minutes
Summary
DataStax Enterprise allows companies to architect for growth and scalability with a scale-out, cloud-native database that can be deployed with containers. In this document, Datastax, Intel, and Dell present three hardware configuration recommendations to consider with PowerEdge servers.
Looking for a scale-out, cloud-native database that will be a good fit for your financial-services applications, fraud detection, or Internet of Things (IoT) applications? Consider DataStax Enterprise built on Apache Cassandra. DataStax Enterprise is a popular NoSQL database that delivers low latency and high availability not found in traditional relational database management systems (RDBMSs).
DataStax Enterprise can be deployed with containers to manage growth and scalability. A popular Kubernetes container platform is VMware vSphere with Tanzu. vSphere with Tanzu lets IT teams set up a developer-ready Kubernetes platform quickly and run containers side by side with existing virtual machines (VMs).
For architects who are considering deploying DataStax Enterprise on VMware vSphere with Tanzu, this article provides three recommended hardware bill of materials (BoM) configurations to get started.
Key Considerations
Key considerations for using the recommended hardware BoMs are outlined below. Note that a minimum of four nodes are required.
- Account for storage overhead. For this workload, storage overhead is larger for bare-metal deployments. This is because both VMware vSAN and DataStax Enterprise require a layer of data replication. Because of this overhead, Tanzu is not well suited for large DataStax Enterprise deployments.
- Enable high performance. All configurations use remote direct memory access (RDMA)-capable Intel Ethernet 800 Series network adapters accelerating vSAN 7 performance (7.0 U2 or later) with the proper driver. For better performance of write-intensive workloads, use Intel SSD P5600 NVM Express (NVMe) drives in place of Intel SSD P5500 drives.
- Set performance levels. The Small, Base, and Plus configurations offer increasing levels of performance as the number of CPU cores and their frequency increases along with memory size, storage performance, and capacity. The Small and Base configurations can be set up with two storage groups and up to eight capacity drives, while the Plus configuration can be configured with up to four storage groups and up to 12 capacity drives. More storage groups can provide better write performance.
Available Configurations
| Configurations | ||
| Small | Base | Plus |
Platform |
Dell PowerEdge R650 server supporting 10 x 2.5” drives with an NVMe backplane | Dell PowerEdge R750 server supporting 24 x 2.5” drives with an NVMe backplane | |
CPU | 2 x Intel® Xeon® Gold 5320 processor (26 cores at 2.2 GHz) | 2x Intel® Xeon® Gold 6348 processor (28 cores at 2.6 GHz) | 2 x Intel® Xeon® Platinum 8362 processor (32 cores at 2.8 GHz) or 2 x Intel® Xeon® Platinum 8358 processor (32 cores at 2.6 GHz) |
DRAM | 256 GB (16 x 16 GB DDR4-3200) | 512 GB (16 x 32 GB DDR4- 3200) | 512 GB (16 x 32 GB DDR4-3200) or more |
Boot device | Dell Boot Optimized Server Storage (BOSS)-S2 with 2 x 480 GB M.2 SATA® solid- state drive (SSD) (RAID1) | ||
Storage-cache tier | 2 x 400 GB Intel® Optane™ SSD P5800X (PCIe® Gen4) | 3 x 400 GB Intel® Optane™ SSD P5800X (PCIe® Gen4) | |
Storage-capacity tier | 4 x (up to 8 x) 1.92 TB Intel® SSD P5500 (PCIe® Gen4, read- intensive) | 6 x (up to 8 x) 3.84 TB Intel® SSD P5500 (PCIe® Gen4, read-intensive) or 6 x (up to 8 x) 3.2 TB Intel® SSD P5600 (PCIe® Gen4, mixed-use) | 6 x (up to 12 x) 3.84 TB Intel® SSD P5500 (PCIe® Gen4, read- intensive) or 6 x (up to 12 x) 3.2 TB Intel® SSD P5600 (PCIe® Gen4, mixed-use) |
Network interface controller (NIC) | Intel® Ethernet Network Adapter E810-XXVDA2 for OCP3 (dual-port 25 gigabit Ethernet [GbE]) | Intel® Ethernet Network Adapter E810-XXVDA2 for OCP3 (dual-port 25 GbE) or Intel® Ethernet Network Adapter E810-CQDA2 PCIe® Add-on Card (dual-port 100 GbE) | |
Learn More
Written with Intel.
Contact your dedicated Dell or Intel account team for a customized quote. 1-877-289-3355