

Introducing the PowerEdge T360 & R360: Gain up to Double the Performance with Intel® Xeon® E-Series Processors
Download PDFThu, 04 Jan 2024 22:08:42 -0000
|Read Time: 0 minutes
Summary
The launch of the PowerEdge T360 and R360 is a prominent addition to the Dell Technologies PowerEdge portfolio. These cost-effective 1-socket servers deliver powerful performance with the latest Intel® Xeon® E-series processors, added GPU support, DDR5 memory, and PCIe Gen 5 I/O slots. They are designed to meet evolving compute demands in Small and Medium Businesses (SMB), Remote Office/Branch Office (ROBO) and Near-Edge deployments.
Both the T360 and R360 boost compute performance up to 108% compared to the prior generation servers. Consequently, customers gain up to 1.8x the performance per every dollar spent on the new E-series CPUs [1]. The rest of this document covers key product features and differentiators, as well as the details behind the performance testing conducted in our labs.
Feature Additions and Upgrades
We break down the new features that are common across both the rack and tower form factors as shown in the table below. Perhaps the most salient upgrades over the prior generation servers – the PowerEdge T350 and R350 – are the significantly more performant CPUs, added entry GPU support, and up to nearly 1.4x faster memory.
- T360 and R360 key feature additions
| Prior-Gen PowerEdge T350, R350 | New PowerEdge T360, R360 |
CPU | 1x Intel Xeon E-2300 Processor, up to 8 cores | 1x Intel Xeon E-2400 Processor, up to 8 cores |
Memory | 4x UDDR4, up to 3200 MT/s DIMM speed | 4x UDDR5, up to 4400 MT/s DIMM speed |
Storage | Hot Plug SATA BOSS S-2 | Hot Plug NVMe BOSS N-1 |
GPU | Not supported | 1 x NVIDIA A2 entry GPU |
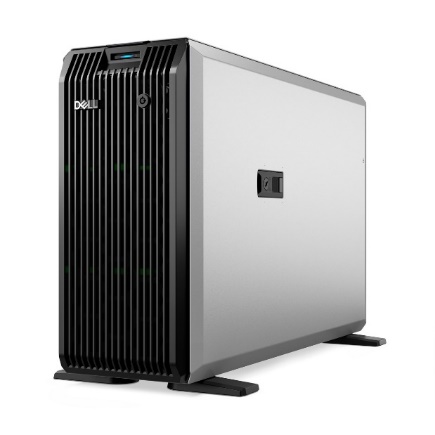

- From left to right, PowerEdge R360 and T360
Entry GPU Support
We have seen a growing demand for video and audio computing particularly in retail, manufacturing, and logistics industries.To meet this demand, the PowerEdge T360 and R360 now supports 1 NVIDIA A2 entry datacenter GPU that accelerates these media intensive workloads, as well as emerging AI inferencing workloads. The A2 is a single-width GPU stacked with 16GB of GPU memory and 40-60W configurable thermal design power (TDP). Read more about the A2 GPU’s up to 20x inference speedup and features here: A2 Tensor Core GPU | NVIDIA.
This upgrade could not come at a more apropos time for businesses looking to scale up and explore entry AI use cases. In fact, IDC projects $154 billion in global AI spending this year, with retail and banking topping the industries with the greatest AI investment. For example, a retailer could leverage the power of the A2 GPU and latest CPUs to stream video of store aisles for inventory management and customer behavior analytics.
Product Differentiation – Rack vs Tower Form Factor
The biggest differentiator between T360 and R360 is their form factors. The T360 is a tower server that can fit under a desk or even in a storage closet, while maintaining office-friendly acoustics. The R360 is a traditional 1U rack server. The table below further details the differences in the product specifications. Namely, the PowerEdge T360 has greater drive capacity for customers with data-intensive workloads or those who anticipate growing storage demand.
2. T360 and R360 differentiators
| PowerEdge R360 | PowerEdge T360 |
Storage | Up to 4 x 3.5'' or 8 x 2.5'' SATA/SAS, max 64GB | Up to 8 x 3.5'' or 8 x 2.5'' SATA/SAS, max 128G |
PCIe Slots | 2 x PCIe Gen 5 (QNS) or 2 x PCIe Gen4 | 3x PCIe Gen 4 + 1x PCIe Gen 5 |
Dimensions & Form Factor | H x W x D: 1U x 17.08 in x 22.18 in 1U Rack Server | H x W x D: 14.54 in x 6.88 in x 22.06 in 4.5U Tower Server |
Processor Performance Testing
The Dell Solutions Performance Analysis Lab (SPA) ran the SPEC CPU® 2017 benchmark on both the PowerEdge T360 and R360 servers with the latest Intel Xeon E-2400 series processors. SPEC CPU is an industry-standard benchmark that measures compute performance for both floating point (FP) and integer operations. We compare these new results with the prior-generation PowerEdge T350 and R350 servers that have Intel Xeon E-2300 series processors.
The following gen-over-gen comparisons represent common Intel CPU configurations for R350/T350 and R360/T360 customers, respectively:
3. Selected CPUs for T/R350 vs T/R360 comparison
Comparison # | PowerEdge R350/T350 | PowerEdge R360/T360 |
1 | E-2388G, 8 cores, 3.2 GHz base frequency | E-2488, 8 cores, 3.2 GHz base frequency |
2 | E-2374G, 4 cores, 3.7 GHz base frequency | E-2456, 6 cores, 3.3 GHz base frequency |
3 | E-2334, 4 cores, 3.4 GHz base frequency | E-2434, 4 cores, 3.4 GHz base frequency |
4 | E-2324G, 4 cores, 3.1 GHz base frequency | E-2414, 4 cores, 2.6 GHz base frequency
|
5 | E-2314, 4 cores, 2.8 GHz base frequency |
Results
We report SPEC CPU’s FP rate metric and integer rate metric which measures throughput in terms of work per unit of time (so higher results are better).[1] Across all CPU comparisons and for both FP and Int rates, there was a 20% or greater uplift in performance gen-over-gen. Overall, customers can expect up to 108% better CPU performance when upgrading from the PowerEdge T/R350 to the T/R360.[2] Below Figure 1 displays the results for the FP base metric, and Table 4 details results for integer rates and FP peak metric.
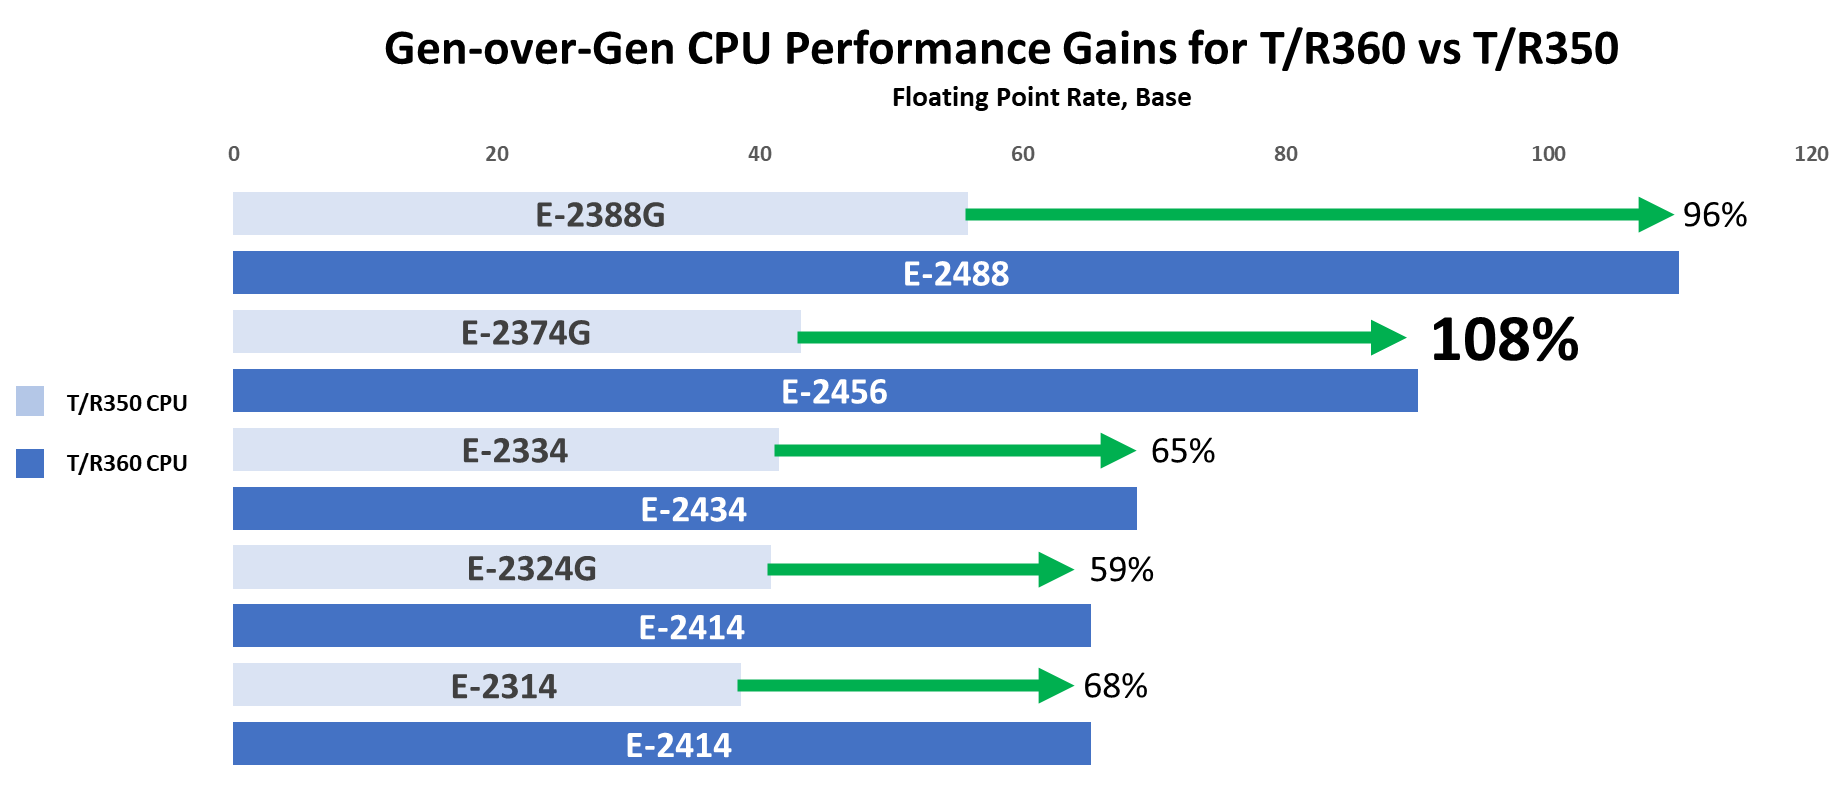
Figure 1. SPEC CPU results gen-over-gen
4. Results for each CPU comparison
Comparison # | Processor | Int Rate (Base) | Int Rate (Peak) | FP Rate (Base) | FP Rate (Peak) |
1 | E-2388G | 68.1 | 71.2 | 55.9 | 60.3 |
E-2488 | 95.1 | 99.2 | 110 | 110 | |
% Increase | 39.65% | 39.33% | 96.78% | 82.42% | |
2 | E-2374G | 42.3 | 43.8 | 43.2 | 45.3 |
E-2456 | 68.3 | 71.1 | 90.1 | 90.3 | |
% Increase | 61.47% | 62.33% | 108.56% | 99.34% | |
3 | E-2334 | 39.8 | 41.2 | 41.5 | 43.4 |
E-2434 | 50.8 | 52.6 | 68.7 | 68.9 | |
% Increase | 27.64% | 27.67% | 65.54% | 58.76% | |
4 | E-2324G | 33 | 34 | 40.9 | 41.4 |
E-2414 | 39.7 | 41.1 | 65.2 | 65.7 | |
% Increase | 20.30% | 20.88% | 59.41% | 58.70% | |
5 | E-2314 | 29.4 | 30.2 | 38.6 | 39 |
E-2414 | 39.7 | 41.1 | 65.2 | 65.7 | |
% Increase | 35.03% | 36.09% | 68.91% | 68.46% |
In addition to better performance, Figure 2 below illustrates the high return on investment associated with these new Intel Xeon E-2400 series processors. Specifically, customers gain up to 1.8x the performance per every dollar spent on CPUs [1]. We calculated performance by dollar by dividing the FP base results reported in Table 4 by the US list price for the corresponding CPU. Please note that pricing varies by region and is subject to change.
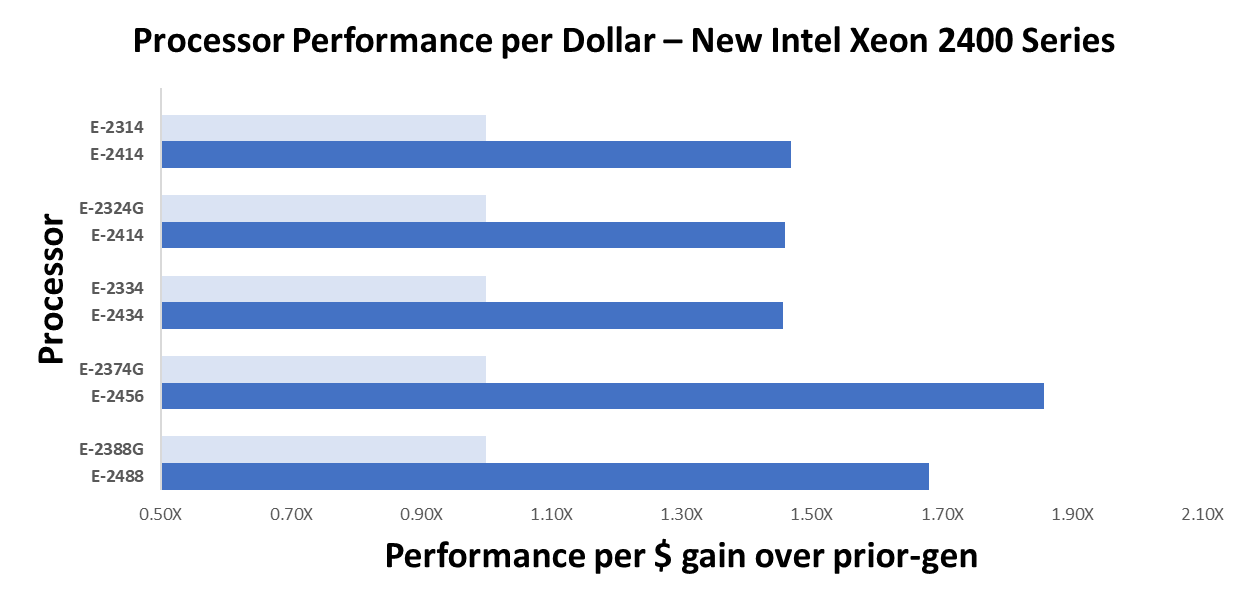
Figure 2. Performance per Dollar gen-over-gen
Conclusion
The PowerEdge T360 and R360 are impressive upgrades from the prior-generation servers, especially considering the performance gains with the latest Intel Xeon E-series CPUs and added GPU support. These highly cost-effective servers empower businesses to accelerate their traditional use cases while exploring the realm of emerging AI workloads.
References
- A2 Tensor Core GPU | NVIDIA
- Worldwide Spending on AI-Centric Systems Forecast to Reach $154 Billion in 2023, According to IDC
- Overview - CPU 2017 (spec.org)
Legal Disclosures
[1] Based on SPEC CPU® 2017 benchmarking of the E-2456 and E-2374G Intel Xeon E-series processors in the PowerEdge R360 and R350, respectively. Testing was conducted by Dell Performance Analysis Labs in October 2023, available on spec.org/cpu2017/. Actual results will vary. Pricing is based on Dell US list prices for Intel Xeon E-series processors and varies by region. Please contact your local sales representative for more information.
Related Documents

Accelerate Workload Performance with NVIDIA GPUs on VMware vSphere Tanzu and PowerEdge Servers
Wed, 21 Jun 2023 18:36:32 -0000
|Read Time: 0 minutes
VMware vSphere with Tanzu
VMware vSphere with Tanzu is used to transform vSphere to a platform for running Kubernetes workloads natively on the hypervisor layer. When enabled on a vSphere cluster, vSphere with Tanzu provides the capability to run Kubernetes workloads directly on ESXi hosts and to create upstream Kubernetes clusters within dedicated resource pools. Tanzu Kubernetes Grid is an enterprise ready Kubernetes runtime built to run consistently with any app on any cloud. It runs the same Kubernetes workloads across the data center, public cloud, and edge for a consistent, secure experience for on-demand access and to keep your workloads properly isolated and secure.

Graphics Processing Units
Graphics processing units (GPU) are dedicated parallel hardware accelerators originally designed for accelerating graphics intensive processing. Today, GPUs have become an essential part of artificial intelligence workloads, especially machine learning and deep learning. Moreover, containers help organizations modernize applications and to align closely with current business needs (see Consolidate your VMs and Modernize Aging Environments with PowerEdge MX750c Compute Sleds and VMware Tanzu). It is only logical to empower container-based applications and workloads to leverage any accelerators that the hardware infrastructure can provide.
As investments in artificial intelligence grow, and organizations explore using AI workloads for critical business workloads, VMware vSphere with Tanzu containerized environments provide the ability to rapidly deploy applications. Although generic applications do well with standard containers, computationally demanding workloads can benefit tremendously with GPU accelerators that can help process multiple computations concurrently. VMware Tanzu Kubernetes on NVIDIA GPUs enables enterprises to adopt and deploy artificial intelligence workloads, such as machine learning and deep learning.
NVIDIA Graphics Processing Units
The NVIDIA Ampere A100 is a powerful graphics processing unit (GPU). The A100 Tensor Core GPU runs diverse compute intensive applications at every scale running in modern cloud data centers. Some compute-intensive applications include AI deep learning (DL) training and inference, data analytics, scientific computing, genomics, edge video analytics and 5G services, graphics rendering, cloud gaming, and many more. Using NVIDIA GPUs to accelerate container workload performance is the key to rapid scalability and superior performance of containers with GPUs.
NVIDIA GPUs with their simultaneous processing capabilities, supported by thousands of cores, help accelerate a wide range of applications across industry segments such as:
- HPC: Deep Learning, Defense, Weather Forecasting, Bioscience research
- Consumer Applications: Transportation, Video Editing, 3D Graphics, Machine Learning
- Entertainment: Gaming, Visual Effects
- Automotive Sectors: Visual Data, Sensors, Automation
- Finance: Analytics, Security-Fraud Detection
Testing the benefits of workloads on containers with GPU acceleration
In this study, we used ResNet-50—a deep learning image classification workload—on a Dell PowerEdge R750 server with an NVIDIA A100 Tensor Core GPU running VMware vSphere with Tanzu. NVIDIA vGPU software “creates virtual GPUs that can be shared across multiple virtual machines, accessed by any device, anywhere”. Companies can use NVIDIA vGPU software for a wide range of workloads. This approach combines the management and security benefits of virtualization with the performance of GPUs, from which many modern workloads can benefit. The results show that the PowerEdge R750 with an NVIDIA A100 Tensor Core GPU in a VMware Tanzu Kubernetes environment with GPU virtualization can support flexibly apportioning GPU compute capability across multiple machine learning workloads in VMware Tanzu Kubernetes clusters.
Dell PowerEdge servers
Modern data centers require fast, flexible cloud enabled infrastructure to respond to complex compute demands. Dell PowerEdge servers provide a scalable business architecture, intelligent automation, and integrated security for workloads from traditional applications and virtualization to cloud-native workloads. The Dell PowerEdge difference is that we deliver the same user experience, and the same integrated management experience across all our servers, so you have one way to patch, manage, update, refresh, and retire servers across the entire data center. PowerEdge servers also incorporate the embedded efficiencies of OpenManage systems management that enable IT pros to focus more time on strategic business objectives and less time on routine IT tasks.
Dell PowerEdge R750
The Dell PowerEdge R750, powered by 3rd Generation Intel® Xeon® Scalable processors, is a rack server that optimizes application performance and acceleration. The R750 is a dual-socket 2U rack server that delivers outstanding performance for the most demanding workloads. It supports eight channels of memory per CPU, and up to 32 DDR4 DIMMs at 3200 MT/s speeds. In addition, to address substantial throughput improvements, the PowerEdge R750 supports PCIe Gen 4 and up to 24 NVMe drives with improved air-cooling features and optional Direct Liquid Cooling to support increasing power and thermal requirements. These features make the R750 an ideal server for data center standardization on a wide range of workloads, including database and analytics, high performance computing (HPC), traditional corporate IT, virtual desktop infrastructure, and AI/ML environments that require performance, extensive storage, with Data Processing Unit (DPU) and Graphics Processing Unit (GPU) support.
References
About the author: Thomas MM works in the technical marketing team that focuses on Dell PowerEdge with VMware software. With vast experience in the IT industry in various roles, Thomas specializes in PowerEdge servers and VMware software and works to create technical collateral that highlights the many unique benefits of running VMware software on PowerEdge servers for Dell and VMware customers and partners.

Up to 29% Higher Inference Performance: PowerEdge R750xa and NVIDIA H100 PCIe GPU
Tue, 11 Apr 2023 22:40:39 -0000
|Read Time: 0 minutes
Executive Summary - PowerEdge R750xa
The Dell PowerEdge R750xa, powered by the 3rd Generation Intel® Xeon® Scalable processors, is a dual-socket/2U rack server that delivers outstanding performance for the most demanding emerging and intensive GPU workloads. It supports eight channels/CPU, and up to 32 DDR4 DIMMs @ 3200 MT/s DIMM speed. In addition, the PowerEdge R750xa supports PCIe Gen 4, and up to eight SAS/SATA SSD or NVMe drives.

Up to 29% higher inference performance PowerEdge R750xa and NVIDIA H100 PCIe GPU(1)
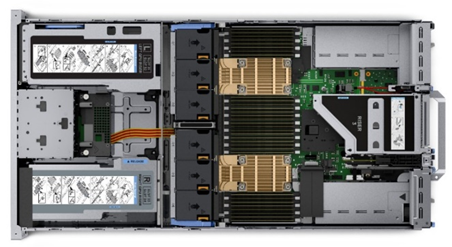 One platform that supports all of the PCIe GPUs in the PowerEdge portfolio makes the PowerEdge R750xa the ideal server for workloads including AI-ML/DL Training and Inferencing, High-Performance Computing, and virtualization environments. The PowerEdge R750xa includes all of the benefits of core PowerEdge: serviceability, consistent systems management with IDRAC, and the latest in extreme acceleration.
NVIDIA H100 PCIe GPU
The new NVIDIA® H100 PCIe GPU is optimal for delivering the fastest business outcomes with the latest accelerated servers in the Dell PowerEdge portfolio, starting with the R750xa. The PowerEdge R750xa boosts workloads to new performance heights with GPU and accelerator support for demanding workloads, including enterprise AI. With its enhanced, air-cooled design and support for up to four NVIDIA double-width GPUs, the PowerEdge R750xa server is purpose-built for optimal performance for the entire spectrum of HPC, AI-ML/DL training, and inferencing workloads. Learn more here.
Next-Generation GPU Performance Analysis
The Dell HPC & AI Innovation Lab compared the performance of the new NVIDIA® H100 PCIe 310W GPU to the last Gen A00 PCIe GPU in the Dell PowerEdge R750xa. They ran the popular TensorRT Inference benchmark across various batch sizes to evaluate inferencing performance.
The results are in Figure 1.
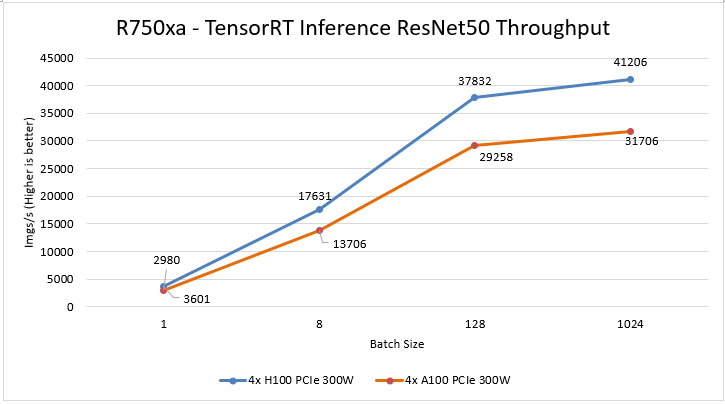
Figure 1. TensorRT
According to the industry standard TensorRT Inference Resnet50-v1.5 benchmark, the PowerEdge R750xa with NVIDIA's H100 PCIe 310W GPU processes approximately 29% more images per second than the NVIDIA A100 PCIe 300W GPU on the same server across various batch sizes. This significant improvement in image processing speed translates to higher overall throughput for inferencing workloads, making the PowerEdge R750xa with the H100 GPU an excellent choice for demanding applications.
Test Configuration
| R750xa with 4 NVIDIA H100 | R750xa with 4 NVIDIA A100 |
Server | PowerEdge R750xa | |
CPU | 2x Intel(R) Xeon(R) Gold 6338 CPU | |
Memory | 512G system memory | |
Storage | 1x 3.5T SSD | |
BIOS/iDRAC | 1.9.0/6.0.0.0 | |
Benchmark version | TensorRT Inference Resnet50-v1.5 | |
Operating System | Ubuntu 20.04 LTS | |
GPU | NVIDIA H100-PCIe-80GB (310W) | NVIDIA A100-PCIe-80GB (300W) |
Driver | CUDA 11.8 | CUDA 11.8 |
Conclusion
The PowerEdge R750xa supports up to four NVIDIA H100 PCIe adaptor GPUs and is available with new orders or as a customer upgrade kit for existing deployments.
Legal Disclosure
- Based on October 2022 Dell labs testing subjecting the PowerEdge R750xa 4x NVIDIA H100 PCIe Adaptor GPU configuration and the PowerEdge R750xa 4x NVIDIA A100 PCIe adaptor GPU configuration to TensorRT Inference Resnet50-v1.5 testing. Actual results will vary.


