


GPU Support for the PowerEdge R360 & T360 Servers Raises the Bar for Emerging Use Cases
Download PDF
Summary
As we enter the New Year, the market for AI solutions across numerous industries continues to grow. Specifically, UBS predicts a jump from $2.2 billion in 2022 to $255 billion in 2027 [1]. This growth is not limited to large enterprises; GPU support on the new PowerEdge T360 and R360 servers gives businesses of any size the freedom to explore entry AI inferencing use cases, in addition to graphic-heavy workloads.
We tested both a 3D rendering and AI inferencing workload on a PowerEdge R360 with one NVIDIA A2 GPU[1] to fully showcase the added performance possibilities.
Achieve 5x rendering performance with the NVIDIA A2 GPU
For our first test, we used Blender’s OpenData benchmark. This open-source benchmark measures rendering performance of various 3D scenes on either CPU or GPU. We achieved up to 5x better rendering performance on GPU, compared to the same workload run only on CPU [1]. As a result, customers gain up to 1.70x the performance per every dollar invested on an A2 GPU vs CPU [2].
[1] Similar results can be expected on a PowerEdge T360 with the same configuration.
Reach max inferencing performance with limited CPU consumption
Part of the motivation behind adding GPU support is the growing demand among SMBs for on-premise, real-time, video and audio processing. Thus, to evaluate AI inferencing performance, we installed NVIDIA’s open-source DeepStream toolkit (version 6.3). DeepStream is primarily used to develop AI vision applications that leverage sensor data and various camera and video streams as input. These applications can be used across various industrial sectors (for example, real-time traffic monitoring systems or retail store aisle footage analysis). With the same PowerEdge R360, we conducted inferencing on 48 streams while utilizing just over 50% of the GPU, and a limited amount of the CPU [3]. Our CPU utilization during testing averaged about 8%.
The rest of this document provides more details about the testing conducted for these two distinct use cases of a PowerEdge T360 or R360 with GPU support.
Product Overview
The PowerEdge T360 and R360 are the latest servers to join the PowerEdge family. Both are cost-effective 1-socket servers designed for small to medium businesses with growing compute demands. They can be deployed in the office, the near-edge, or in a typical data analytic environment.
The biggest differentiator between the T360 and R360 is the form factor. The T360 is a tower server that can fit under a desk or even in a storage closet, while maintaining office-friendly acoustics. The R360, on the other hand, is a traditional 1U rack server. Both servers support the newly launched Intel® Xeon® E-series CPUs, 1 NVIDIA A2 GPU, as well as DDR5 memory, NVMe BOSS, PCIe Gen5 I/O ports, and the latest remote management capabilities.
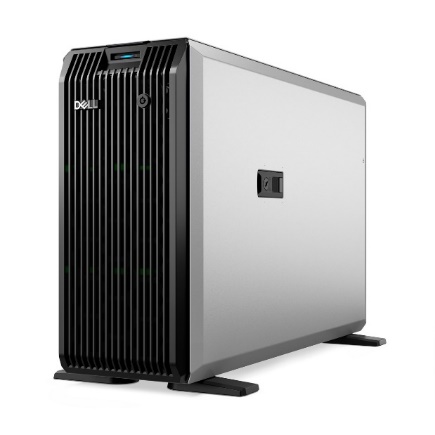

Figure 1. From left to right, PowerEdge T360 and R360
NVIDIA A2 GPU Information
Unlike the analogous prior-generation servers, the recently launched PowerEdge T360 and R360 now support 1 NVIDIA A2 entry GPU. The A2 accelerates media intensive workloads, as well as emerging AI inferencing workloads. It is a single-width GPU stacked with 16GB of GPU memory and 40-60W configurable thermal design power (TDP). Read more about the A2 GPU’s up to 20x inference speedup and features here: A2 Tensor Core GPU | NVIDIA.
Testing Configuration
We conducted benchmarking on one PowerEdge R360 with the configuration in the table below. Similar results can be expected for the PowerEdge T360 with this same configuration. We tested in a Linux Ubuntu Desktop environment, version 20.04.6.
Table 1. PowerEdge R360 System Configuration
Component | Configuration |
CPU | 1x Intel® Xeon® E-2488, 8 cores |
GPU | 1x NVIDIA A2 |
Memory | 4x 32 GB DIMMs, DDR5 |
Drives | 1x 2 TB SATA HDD |
OS | Ubuntu 20.04.6 |
NIC | 2x Broadcom NetXtreme Gigabit Ethernet |
Accelerate 3D Rendering Workloads
Entry GPUs are often used in the media and entertainment industry for 3D modeling and rending. The NVIDIA A2 GPU is a powerful accelerator for these workloads. To highlight the magnitude of the acceleration, we ran the same Blender OpenData benchmark on CPU, and then only on GPU. Blender is a popular open-source 3D modeling software.
The benchmark evaluates the system’s rendering performance for three different 3D scenes, either on CPU or GPU only. Results, or scores, are reported in sample per minute. We ran the benchmark on CPU (Intel Xeon-E2488) three times, and then on GPU (NVIDIA A2) three times. The results in Table 2 below represent the average score of each of the three trials.
Results
Compared to the benchmark run only on CPU, we attained up to 5x better rendering performance with the same workload run on the A2 GPU [1]. Although we achieved over 4x better performance for all three 3D scenes, the classroom scene corresponds to the best result and is illustrated in the figure below.
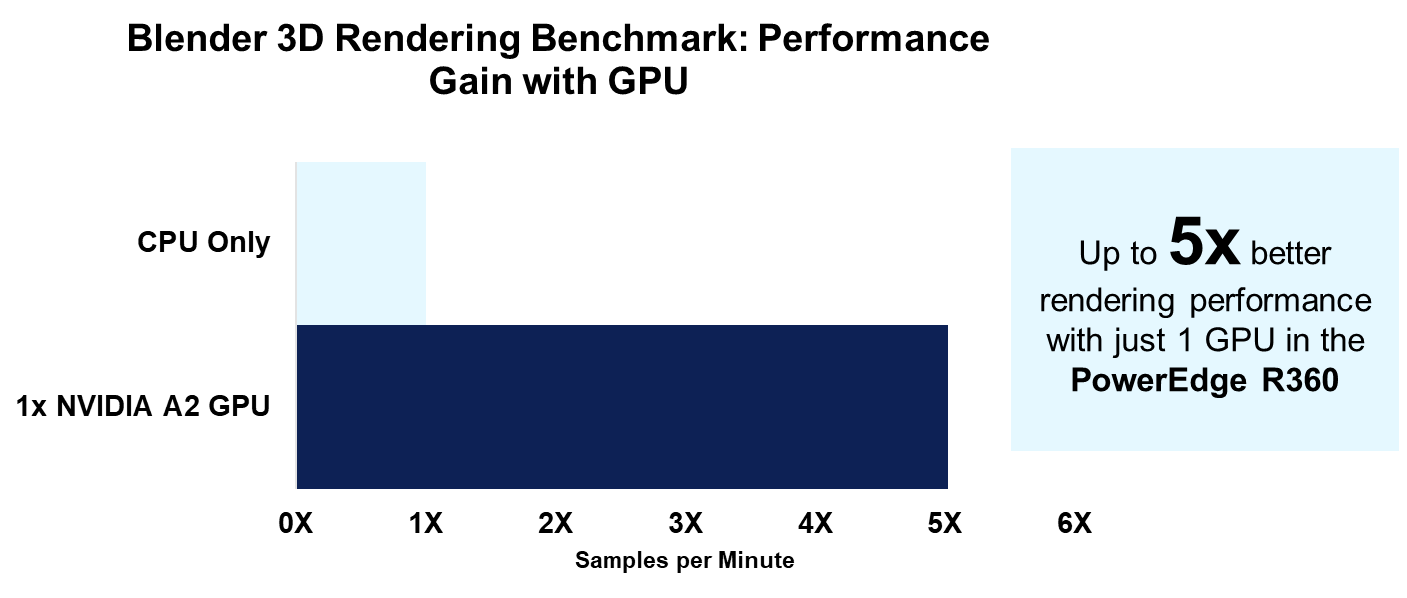
Figure 2. Rendering performance on CPU only and GPU only
Given this 5x better rendering performance, we calculated the performance per dollar for the cost of CPU compared to the cost of the GPU. For CPU performance, we divided the rendering score by the Dell US list price for the E-2488 CPU. For GPU performance, we divided the rendering score by the Dell US list price for the A2 GPU[2]. When comparing these results, we found customers can gain up to 1.70x the performance per every dollar spent on the GPU compared to the CPU [2].
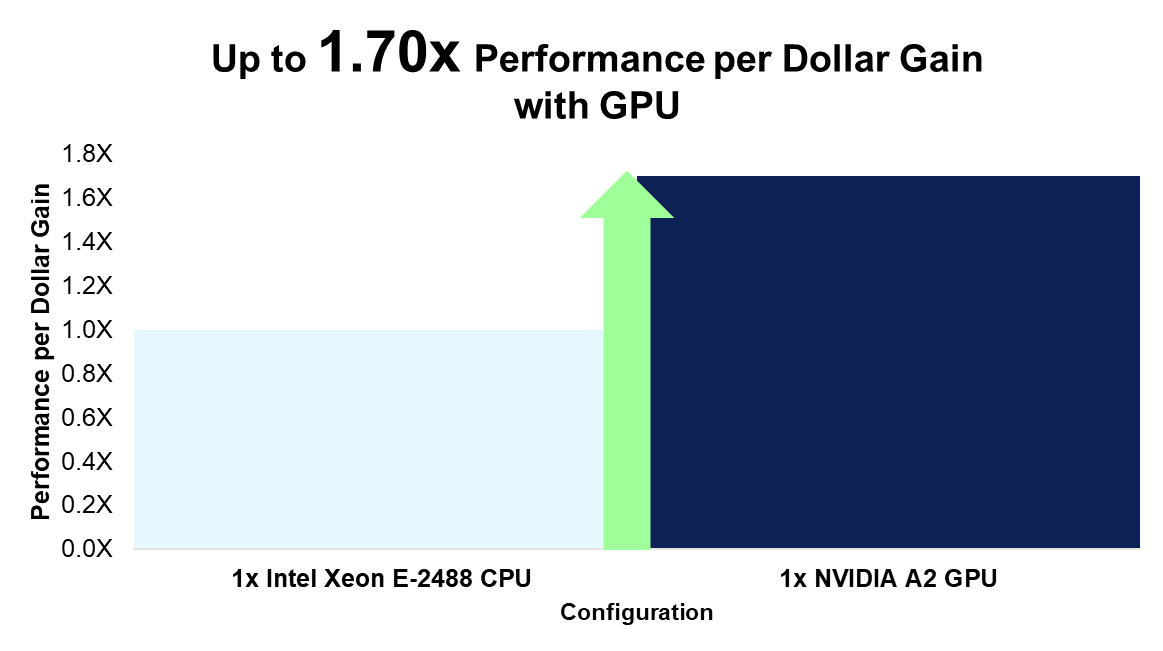
Figure 3. Rendering performance per dollar increase
Taking the analysis a step further, we also calculated the performance per dollar spent on a CPU compared to cost of both a CPU and GPU. This comparison is relevant for customers who are investing in both an Intel Xeon E-2488 CPU and NVIDIA A2 GPU for their PowerEdge R360/T360. While we calculated the CPU performance score the same way as above, we now divided the GPU rendering score by the Dell US list price for the A2 GPU + E-2488 CPU. When comparing these results, we found customers can gain up to 1.27x the performance per every dollar spent on both GPU and CPU compared to just CPU [2].
In other words, investing in an R360 with a E-2488 CPU and A2 GPU yields a higher return on investment for rendering performance compared to an R360 without an A2 GPU. It is also worth mentioning that the E-2488 CPU is the highest-end, and most expensive, CPU offered for both the T360 and R360. It is reasonable to expect an even higher return on investment for the A2 GPU when compared to the same system with a lower-end CPU.
The full results and scores are listed in the table below.
Table 2. Blender benchmark results
Scene | CPU Only, Samples per Min | NVIDIA A2 GPU, Samples per Min | Increase from CPU to GPU |
Monster | 98.664848 | 422.8827567 | 4.29x |
Junkshop | 62.561726 | 268.386526 | 4.29x |
Classroom | 47.35613467 | 237.8551867 | 5.02x |
Video Analytics Performance with NVIDIA DeepStream
While 3D rendering may be a more common workload for SMBs investing in entry-GPUs, the same GPU is also a powerful accelerator for entry AI inferencing and video analytic workloads. We used NVIDIA’s DeepStream version 6.3[3] to showcase the PowerEdge R360’s performance when running a sample video analytic application. DeepStream has a variety of sample applications and input streams available for testing. The given configuration files allow you to vary the number of streams for a run of the app which we explain in greater detail below. Input streams can range from photos, video files (with either h.264 or h.265 coding), or even RTSP IP cameras.
To better illustrate DeepStream’s functionality, consider the images below that were generated from our run of a DeepStream sample app. Instead of using a provided sample video, we used our own stock video of customers entering and leaving a bakery. The AI model in this scenario can identify people, cars, and bicycles. The images below, which are cropped outputs to zoom in on the person at the cash register, show how this vision application correctly identified these two customers with a bounding box and “person” label.
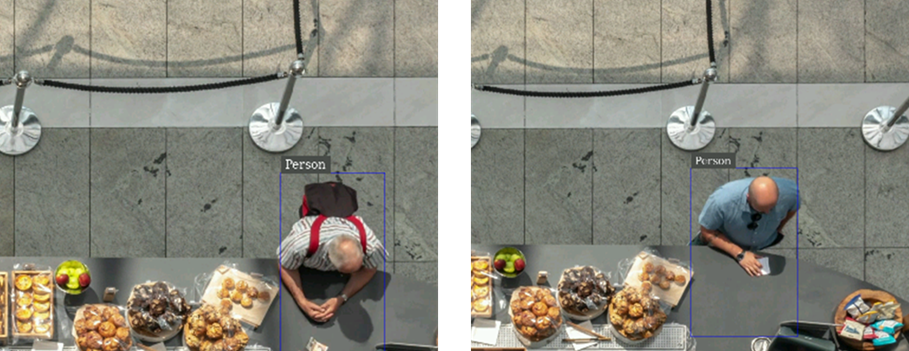
Figure 4. Cropped output of DeepStream sample app with modified source video
Instead of pre-recorded videos, an RTSP IP camera would theoretically allow a user to stream and analyze live footage of customers in a retail store. Check out this blog from the Dell AI Solutions team for a guide on how to get DeepStream up and running with a 1080p webcam for streaming RTSP output.
We also tested the DeepStream sample application with one of NVIDIA’s provided videos that shows cars, bicycles, and pedestrians on a busy road. The images below are screenshots of the sample app run with 1, 4, and 30 streams, respectively. In each tile, or stream, the given model places bounding boxes around the identified objects.
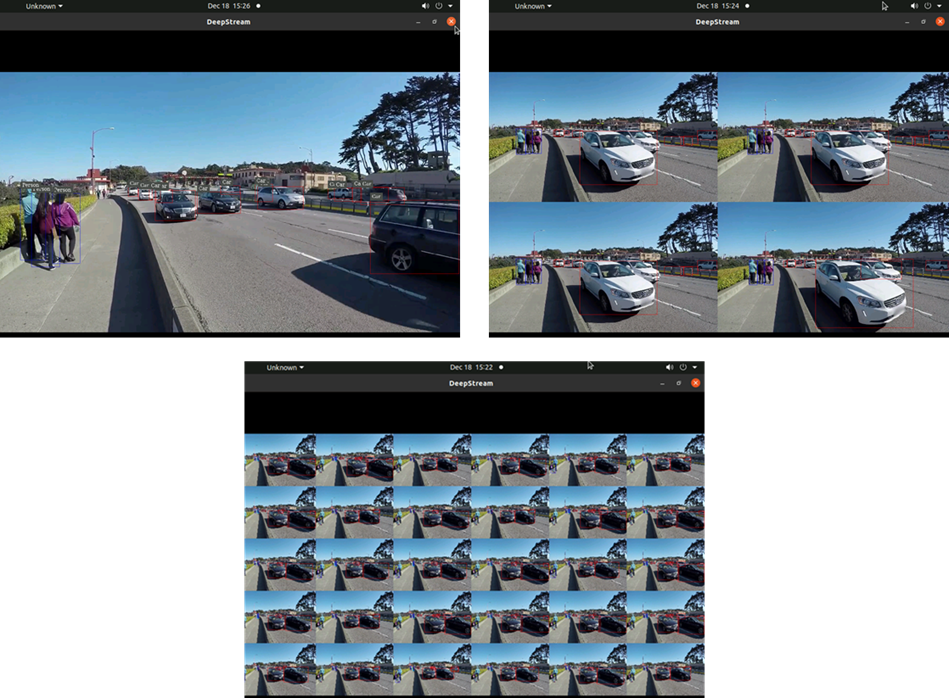
Figure 5. Deepstream sample video output with 1, 4, and 30 streams, respectively
Performance Testing Procedure
During a run of a sample application, NVIDIA measures performance as the number of frames per second (FPS) processed. An FPS score is displayed for each stream in 5 second intervals. For our testing, we followed the steps in the DeepStream 6.3 performance guide, which lists the appropriate modifications to the configuration file in order to maximize performance. All modifications were made to the source4_1080p_dec_infer-resnet_tracker_sgie_tiled_display_int8.txt configuration file, which is specifically described in the “Data center GPU – A2 section” of the tutorial. Tiled displays like in Figures 4 and 5 above impact performance, so NVIDIA recommends disabling on-screen display/output when evaluating performance. We did the same.
With the same sample video as shown in Figure 5, NVIDIA reports that using an H.264 source, it is possible to host 48 inferencing streams at 30 FPS each. To test this with our PowerEdge R360 and A2 GPU, we followed the benchmarking procedure below:
- Modify the sample application configuration file to take in 48 input streams by changing the parameter num-sources to 48, and the batch-size parameter under the streammux section to 48.[4] This is in addition to the other recommended configuration changes described in the guide above.
- Let the application run for 10 minutes[5]
- Record the average FPS for each of the 48 streams at the end of the run
- Repeat steps 1-3 with 40, 30, 20, 10, 5, and 1 streams. The only modification to the configuration file should be updating the num-sources and batch-size to match the number of streams currently under test.
Our results are illustrated in the section below. We used iDRAC tools and the nvidia-smi command to capture system telemetry data every 7 seconds during testing trials as well (i.e. CPU utilization, total power utilization, GPU power draw, and GPU utilization). Each reported utilization statistic (such a GPU utilization) is the average of 100 datapoints collected over the app run period.
Results
The figure below displays the average FPS (to the nearest whole number) achieved for varying number of streams. As the number of streams tested increases, the FPS per stream decreases.
Most notably, we achieved NVIDIA’s expected max performance with our PowerEdge R360; We ran 48 streams with an average of 30 FPS each at the end of the 10-minute run period [3]. In general, 30 FPS is an industry-accepted rate for standard video feeds such as live TV.
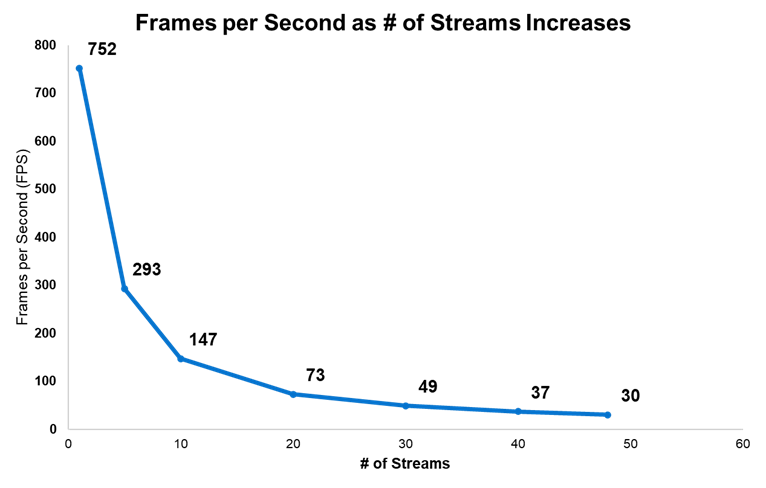
Figure 6. DeepStream FPS for varying number of streams
We also captured CPU utilization during our testing. Unsurprisingly, CPU utilization was highest with 48 streams. However, for all number of streams tested, CPU utilization only ranged between about 2-8%. This means most of the system’s CPU was still available for other work while we tested DeepStream.
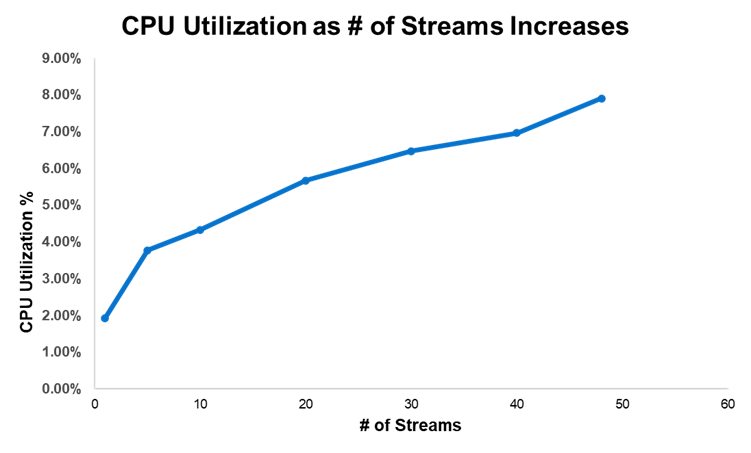
Figure 7. CPU utilization for varying number of streams
In terms of power consumption, the figure below shows GPU power draw overlayed on top of total system power utilization. Irrespective to the number of streams, GPU power draw represents only about 25-27% of the total system power utilization.
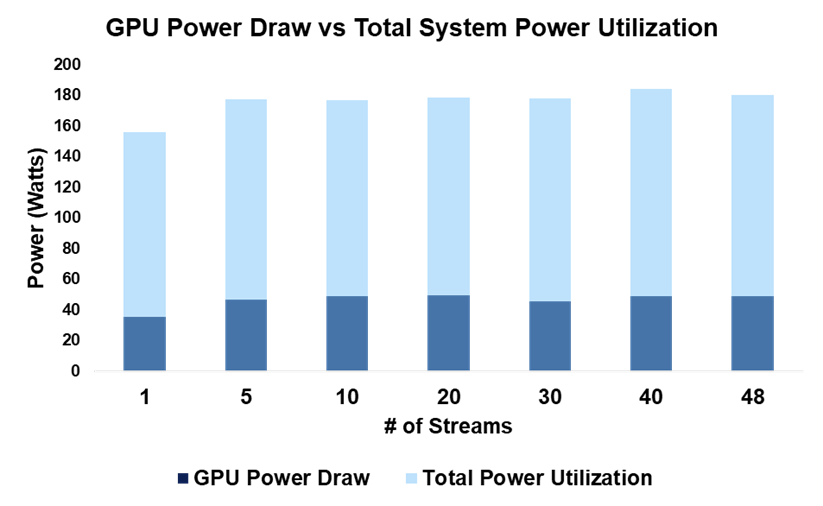
Figure 8. System power consumption for varying number of streams
Finally, we captured GPU utilization as number of streams increased. While it varied more so than the other telemetry data, at the max number of streams tested, GPU utilization was about 50%. We achieved these impressive results without driving the GPU to max utilization.
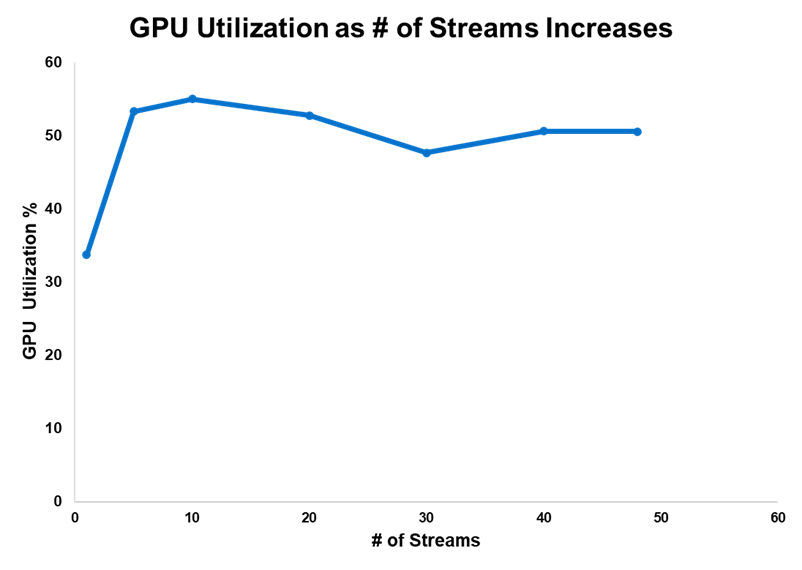
Figure 9. GPU utilization for varying number of streams
Conclusion
We have just scratched the surface on the performance capabilities of the PowerEdge T360 and R360. Between 3D rendering and entry AI-inferencing workloads; the added A2 GPU allows SMBs to explore compute-intensive use cases from the office to the near-edge. In other words, the R360 and T360 are equipped to scale with businesses as computing demand inevitably, and rapidly, evolves.
While GPU support is a defining feature of the PowerEdge T360 and R360, they also leverage the newly launched Intel® Xeon® E-series CPUs, 1.4x faster DDR5 memory, NVMe BOSS, and PCIe Gen5 I/O ports. For more information on these cost-effective, entry-level servers, you can read about their excellent performance across a variety of industry-relevant benchmarks and up to 108% better CPU performance.
References
- Daily: US tech gains set to continue on stronger AI growth | UBS Global
- Blender - Open Data
- DeepStream SDK | NVIDIA Developer | NVIDIA Developer
- A2 Tensor Core GPU | NVIDIA
- Ubuntu 20.04.6 LTS (Focal Fossa)
- Performance — DeepStream 6.3 Release documentation (nvidia.com)
- Understanding FPS Values: The Advanced Guide to Video Frame Rates (dacast.com)
- Battle of the Servers: PowerEdge T360 & R360 outperform prior-gen models across a range of benchmarks | Dell Technologies Info Hub
- Introducing the PowerEdge T360 & R360: Gain up to Double the Performance with Intel® Xeon® E-Series Processors | Dell Technologies Info Hub
Legal Disclosures
[1] Based on November 2023 Dell labs testing subjecting the PowerEdge R360 to Blender OpenData benchmark with 1x NVIDIA A2 GPU and 1x Intel Xeon E-2488 CPU. Actual results will vary. Similar results can be expected on a PowerEdge T360 with the same system configuration.
[2] Based on November 2023 Dell labs testing subjecting the PowerEdge R360 to Blender OpenData benchmark with 1x NVIDIA A2 GPU and 1x Intel Xeon E-2488 CPU. Actual results will vary. Similar results can be expected on a PowerEdge T360 with the same system configuration. Pricing analysis is based on Dell US R360 list prices for both the NVIDIA A2 GPU and Intel Xeon E-2488 processor. Pricing varies by region and is subject to change without notice. Please contact your local sales representative for more information.
[3] Based on November 2023 Dell labs testing subjecting the PowerEdge R360 with 1x A2 GPU to performance testing of NVIDIA’s DeepStream SDK, version 6.3. We tested the sample application with configuration file named:source4_1080p_dec_infer-resnet_tracker_sgie_tiled_display_int8.txt. The full testing procedure is described in this report. Similar results can be expected with a PowerEdge T360 with the same configuration. Actual results will vary.
Appendix
Dell provides an open-source Reference Toolset for iDRAC9 Telemetry Streaming. With streaming data, you can easily create a Grafana dashboard to visualize and monitor your system’s telemetry in real-time. Tutorials are available with this video and whitepaper.
The screenshot below is from a Grafana dashboard we created for capturing PowerEdge R360 telemetry. It displays GPU temperature and rotations per minute (RPM) for three fans (we ran the Blender benchmark to demonstrate a spike in GPU temperature). You can also track GPU power consumption and utilization, among many other system metrics.
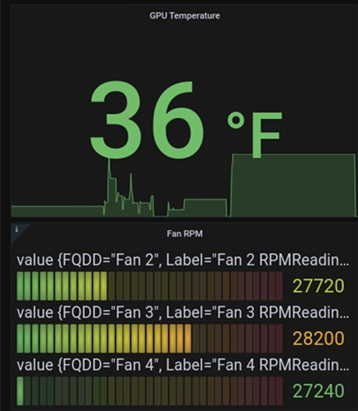
Figure 10. Grafana dashboard example
Related Documents

Introducing the PowerEdge T360 & R360: Gain up to Double the Performance with Intel® Xeon® E-Series Processors
Thu, 04 Jan 2024 22:08:42 -0000
|Read Time: 0 minutes
Summary
The launch of the PowerEdge T360 and R360 is a prominent addition to the Dell Technologies PowerEdge portfolio. These cost-effective 1-socket servers deliver powerful performance with the latest Intel® Xeon® E-series processors, added GPU support, DDR5 memory, and PCIe Gen 5 I/O slots. They are designed to meet evolving compute demands in Small and Medium Businesses (SMB), Remote Office/Branch Office (ROBO) and Near-Edge deployments.
Both the T360 and R360 boost compute performance up to 108% compared to the prior generation servers. Consequently, customers gain up to 1.8x the performance per every dollar spent on the new E-series CPUs [1]. The rest of this document covers key product features and differentiators, as well as the details behind the performance testing conducted in our labs.
Feature Additions and Upgrades
We break down the new features that are common across both the rack and tower form factors as shown in the table below. Perhaps the most salient upgrades over the prior generation servers – the PowerEdge T350 and R350 – are the significantly more performant CPUs, added entry GPU support, and up to nearly 1.4x faster memory.
- T360 and R360 key feature additions
| Prior-Gen PowerEdge T350, R350 | New PowerEdge T360, R360 |
CPU | 1x Intel Xeon E-2300 Processor, up to 8 cores | 1x Intel Xeon E-2400 Processor, up to 8 cores |
Memory | 4x UDDR4, up to 3200 MT/s DIMM speed | 4x UDDR5, up to 4400 MT/s DIMM speed |
Storage | Hot Plug SATA BOSS S-2 | Hot Plug NVMe BOSS N-1 |
GPU | Not supported | 1 x NVIDIA A2 entry GPU |

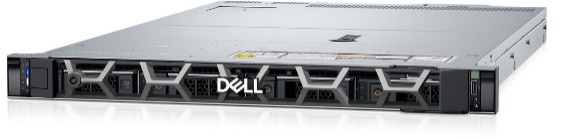
- From left to right, PowerEdge R360 and T360
Entry GPU Support
We have seen a growing demand for video and audio computing particularly in retail, manufacturing, and logistics industries.To meet this demand, the PowerEdge T360 and R360 now supports 1 NVIDIA A2 entry datacenter GPU that accelerates these media intensive workloads, as well as emerging AI inferencing workloads. The A2 is a single-width GPU stacked with 16GB of GPU memory and 40-60W configurable thermal design power (TDP). Read more about the A2 GPU’s up to 20x inference speedup and features here: A2 Tensor Core GPU | NVIDIA.
This upgrade could not come at a more apropos time for businesses looking to scale up and explore entry AI use cases. In fact, IDC projects $154 billion in global AI spending this year, with retail and banking topping the industries with the greatest AI investment. For example, a retailer could leverage the power of the A2 GPU and latest CPUs to stream video of store aisles for inventory management and customer behavior analytics.
Product Differentiation – Rack vs Tower Form Factor
The biggest differentiator between T360 and R360 is their form factors. The T360 is a tower server that can fit under a desk or even in a storage closet, while maintaining office-friendly acoustics. The R360 is a traditional 1U rack server. The table below further details the differences in the product specifications. Namely, the PowerEdge T360 has greater drive capacity for customers with data-intensive workloads or those who anticipate growing storage demand.
2. T360 and R360 differentiators
| PowerEdge R360 | PowerEdge T360 |
Storage | Up to 4 x 3.5'' or 8 x 2.5'' SATA/SAS, max 64GB | Up to 8 x 3.5'' or 8 x 2.5'' SATA/SAS, max 128G |
PCIe Slots | 2 x PCIe Gen 5 (QNS) or 2 x PCIe Gen4 | 3x PCIe Gen 4 + 1x PCIe Gen 5 |
Dimensions & Form Factor | H x W x D: 1U x 17.08 in x 22.18 in 1U Rack Server | H x W x D: 14.54 in x 6.88 in x 22.06 in 4.5U Tower Server |
Processor Performance Testing
The Dell Solutions Performance Analysis Lab (SPA) ran the SPEC CPU® 2017 benchmark on both the PowerEdge T360 and R360 servers with the latest Intel Xeon E-2400 series processors. SPEC CPU is an industry-standard benchmark that measures compute performance for both floating point (FP) and integer operations. We compare these new results with the prior-generation PowerEdge T350 and R350 servers that have Intel Xeon E-2300 series processors.
The following gen-over-gen comparisons represent common Intel CPU configurations for R350/T350 and R360/T360 customers, respectively:
3. Selected CPUs for T/R350 vs T/R360 comparison
Comparison # | PowerEdge R350/T350 | PowerEdge R360/T360 |
1 | E-2388G, 8 cores, 3.2 GHz base frequency | E-2488, 8 cores, 3.2 GHz base frequency |
2 | E-2374G, 4 cores, 3.7 GHz base frequency | E-2456, 6 cores, 3.3 GHz base frequency |
3 | E-2334, 4 cores, 3.4 GHz base frequency | E-2434, 4 cores, 3.4 GHz base frequency |
4 | E-2324G, 4 cores, 3.1 GHz base frequency | E-2414, 4 cores, 2.6 GHz base frequency
|
5 | E-2314, 4 cores, 2.8 GHz base frequency |
Results
We report SPEC CPU’s FP rate metric and integer rate metric which measures throughput in terms of work per unit of time (so higher results are better).[1] Across all CPU comparisons and for both FP and Int rates, there was a 20% or greater uplift in performance gen-over-gen. Overall, customers can expect up to 108% better CPU performance when upgrading from the PowerEdge T/R350 to the T/R360.[2] Below Figure 1 displays the results for the FP base metric, and Table 4 details results for integer rates and FP peak metric.
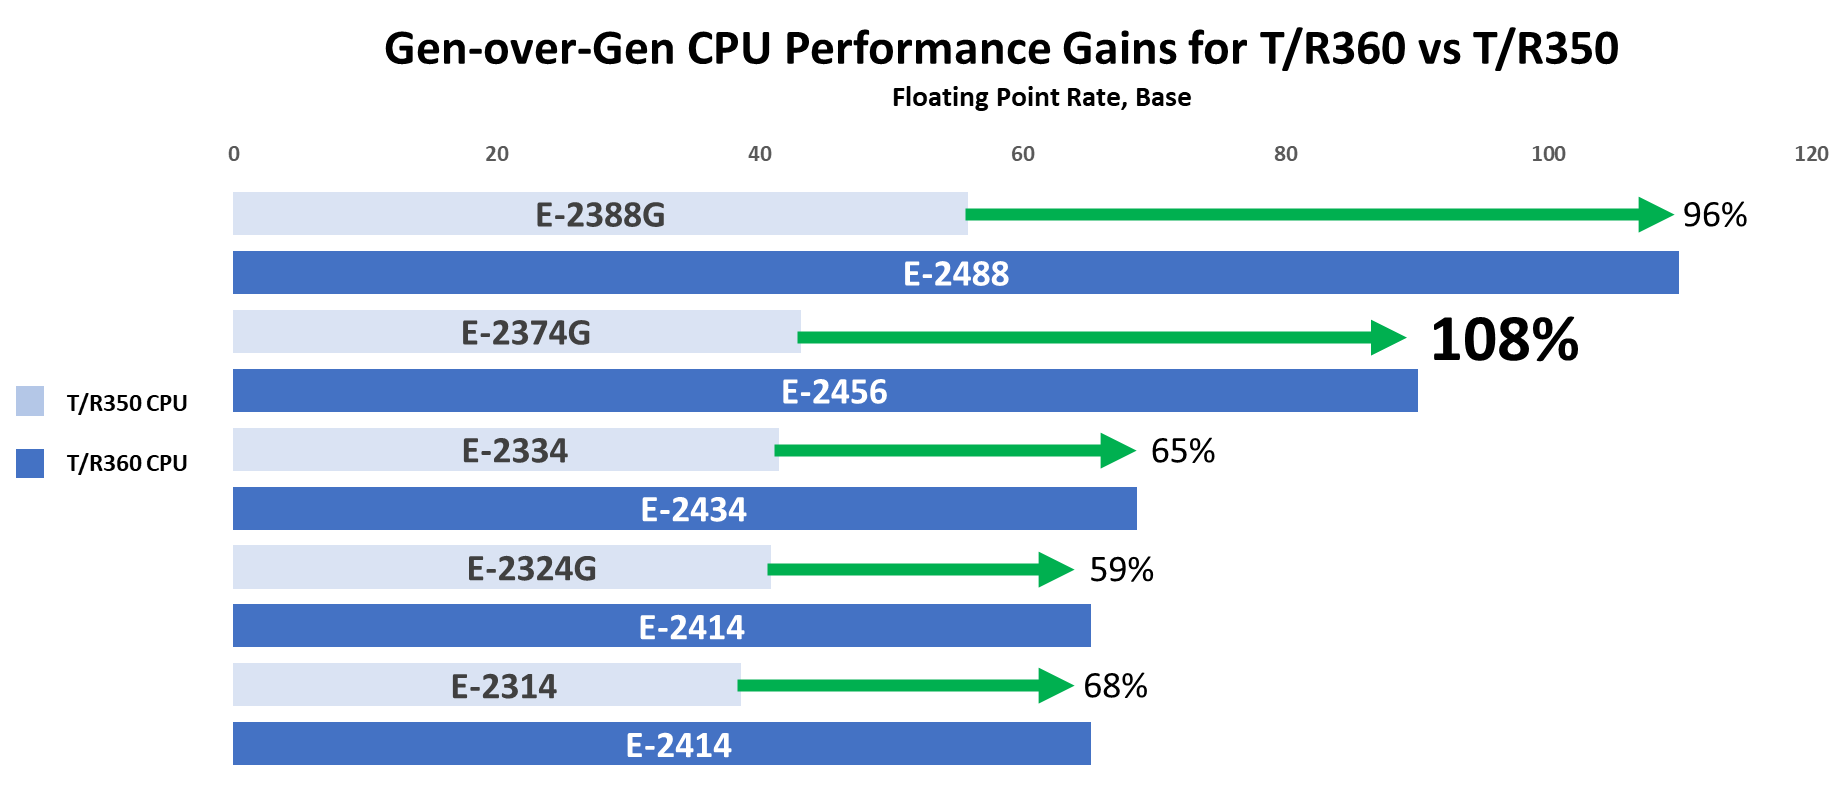
Figure 1. SPEC CPU results gen-over-gen
4. Results for each CPU comparison
Comparison # | Processor | Int Rate (Base) | Int Rate (Peak) | FP Rate (Base) | FP Rate (Peak) |
1 | E-2388G | 68.1 | 71.2 | 55.9 | 60.3 |
E-2488 | 95.1 | 99.2 | 110 | 110 | |
% Increase | 39.65% | 39.33% | 96.78% | 82.42% | |
2 | E-2374G | 42.3 | 43.8 | 43.2 | 45.3 |
E-2456 | 68.3 | 71.1 | 90.1 | 90.3 | |
% Increase | 61.47% | 62.33% | 108.56% | 99.34% | |
3 | E-2334 | 39.8 | 41.2 | 41.5 | 43.4 |
E-2434 | 50.8 | 52.6 | 68.7 | 68.9 | |
% Increase | 27.64% | 27.67% | 65.54% | 58.76% | |
4 | E-2324G | 33 | 34 | 40.9 | 41.4 |
E-2414 | 39.7 | 41.1 | 65.2 | 65.7 | |
% Increase | 20.30% | 20.88% | 59.41% | 58.70% | |
5 | E-2314 | 29.4 | 30.2 | 38.6 | 39 |
E-2414 | 39.7 | 41.1 | 65.2 | 65.7 | |
% Increase | 35.03% | 36.09% | 68.91% | 68.46% |
In addition to better performance, Figure 2 below illustrates the high return on investment associated with these new Intel Xeon E-2400 series processors. Specifically, customers gain up to 1.8x the performance per every dollar spent on CPUs [1]. We calculated performance by dollar by dividing the FP base results reported in Table 4 by the US list price for the corresponding CPU. Please note that pricing varies by region and is subject to change.
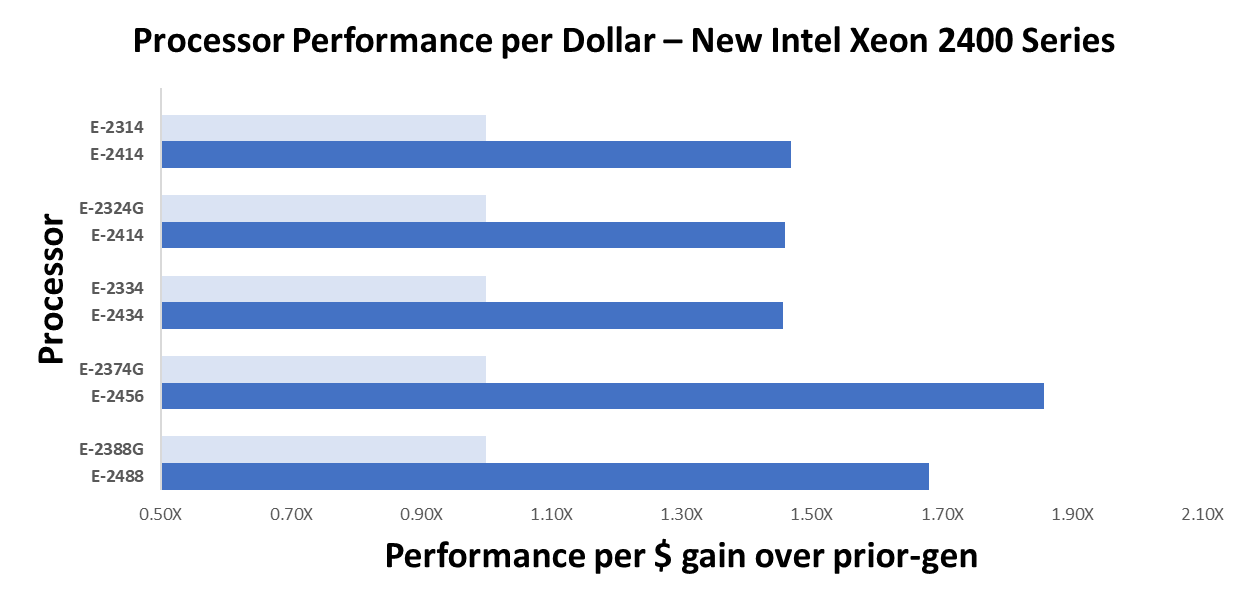
Figure 2. Performance per Dollar gen-over-gen
Conclusion
The PowerEdge T360 and R360 are impressive upgrades from the prior-generation servers, especially considering the performance gains with the latest Intel Xeon E-series CPUs and added GPU support. These highly cost-effective servers empower businesses to accelerate their traditional use cases while exploring the realm of emerging AI workloads.
References
- A2 Tensor Core GPU | NVIDIA
- Worldwide Spending on AI-Centric Systems Forecast to Reach $154 Billion in 2023, According to IDC
- Overview - CPU 2017 (spec.org)
Legal Disclosures
[1] Based on SPEC CPU® 2017 benchmarking of the E-2456 and E-2374G Intel Xeon E-series processors in the PowerEdge R360 and R350, respectively. Testing was conducted by Dell Performance Analysis Labs in October 2023, available on spec.org/cpu2017/. Actual results will vary. Pricing is based on Dell US list prices for Intel Xeon E-series processors and varies by region. Please contact your local sales representative for more information.

PowerEdge T560 Delivers Significant Performance Boost and Scalability
Thu, 24 Aug 2023 18:12:49 -0000
|Read Time: 0 minutes
Summary
Dell PowerEdge T560, with 4th Generation Intel® Xeon® Scalable Processors, boosts performance by up to 114% compared to the prior-gen T550 with 3rd Generation Intel® Xeon® Scalable Processors[1]. This document presents gen-over-gen CPU benchmarks for three common T560 CPU configurations, and highlights key features that enable enterprises to host a diverse set of workloads.
Advanced technology with accelerators
From retail, hospitality, and restaurants, to small healthcare, businesses continue to rely on tower servers to enable their day-to-day operations. IDC forecasts $2 billion in worldwide tower server spending for 2024.[2]
The Dell PowerEdge T560 exceeds these business needs while fitting where other servers cannot – under desks, in closets, tucked in any available space. It drives key enterprise workloads, including traditional business applications, virtualization, and data analytics. For customers looking to capture the advantages of AI, the T560 is also tuned to power medium duty AI or ML tailored inferencing algorithms that drive more timely and accurate business insights. In fact, the T560 has 20% more GPU capacity compared to prior-gen T550.
The table below details the gen-over-gen feature improvements that support the T560’s faster, more powerful, and balanced performance:
Table 1. PowerEdge T550 vs T560 key features
| Prior-Gen PowerEdge T550 | PowerEdge T560 |
CPU | 3rd Generation Intel Xeon Scalable Processors | 4th Generation Intel Xeon Scalable Processors |
GPU | Up to 2 DW or 5 SW GPUs | Up to 2 DW or 6 SW GPU |
Storage | Up to 8x3.5” Hot Plug SAS/SATA HDDs 120TB Storage Capacity | Up to 12x3.5” Hot Plug SAS/SATA HDDs 180TB Storage Capacity |
Memory | Up to 3200 MT/s DIMM Speed | Up to 4800 MT/S DIMM Speed |
PCIe Slots | PCIe Gen4 slots | PCIe Gen5 slots |
Performance data
We captured three benchmarks -- SPEC CPU, High-Performance Linpack (HPL), and STREAM -- to compare performance across three T550 3rd Generation Intel Xeon processors and two T560 4th Generation Intel Xeon processors. We report SPEC CPU’s fprate base metric which measures throughput in terms of work per unit of time. HPL is measured in Gflops, or floating-point operations per second, which assesses overall computational power. STREAM captures memory bandwidth in MB/s.
The tests were performed in the Dell Solutions Performance Analysis (SPA) Lab in March 2023. The following gen-over-gen comparisons represent common Intel CPU configurations for T550 and T560 customers, respectively:
Table 2. Selected CPUs for T550 vs T560 performance comparison
T550 CPU Config |
T560 CPU Config |
4309Y, 8 Cores, 2 Processors tested [16 Cores] | 4410Y, 12 Cores, 1 Processor tested |
4310, 12 Cores, 1 Processor tested | 4410Y, 12 Cores, 1 Processor tested |
4314, 16 Cores, 1 Processor tested | 5416S, 16 Cores, 1 Processor tested |
All tested T560 CPU configurations across both the SPEC CPU and HPL Benchmark demonstrate a greater than 47% performance uplift, gen over gen. Most notably, just one Intel Xeon 4410Y (12 core) processor in the T560 performed 114% better than two prior-gen 4309Y processors (16 cores total) in the T550. For these same processors, the HPL benchmark saw a performance uplift of 78%, and STREAM saw an uplift of up to 57%.
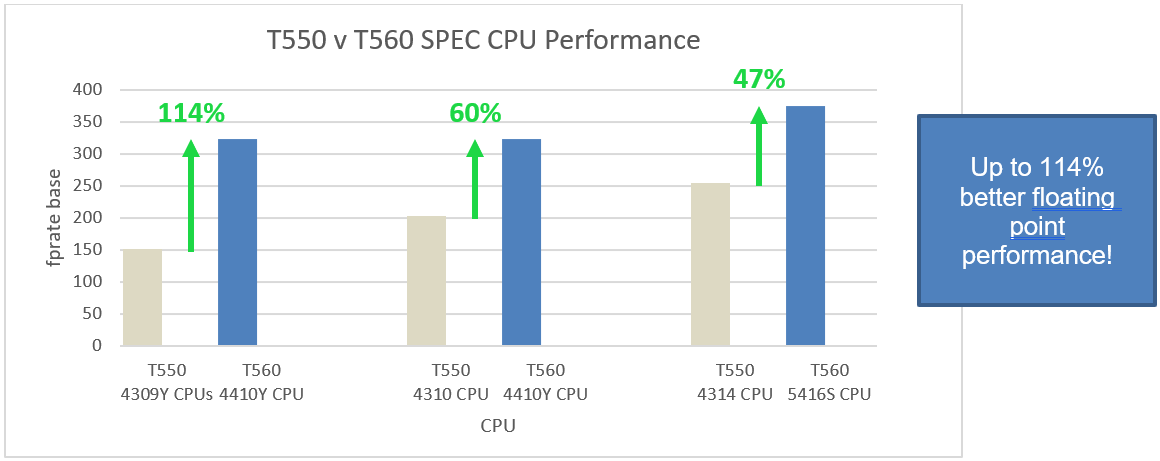
Figure 1. Three CPU comparisons demonstrating gen-over-gen performance uplift for SPEC CPU benchmark
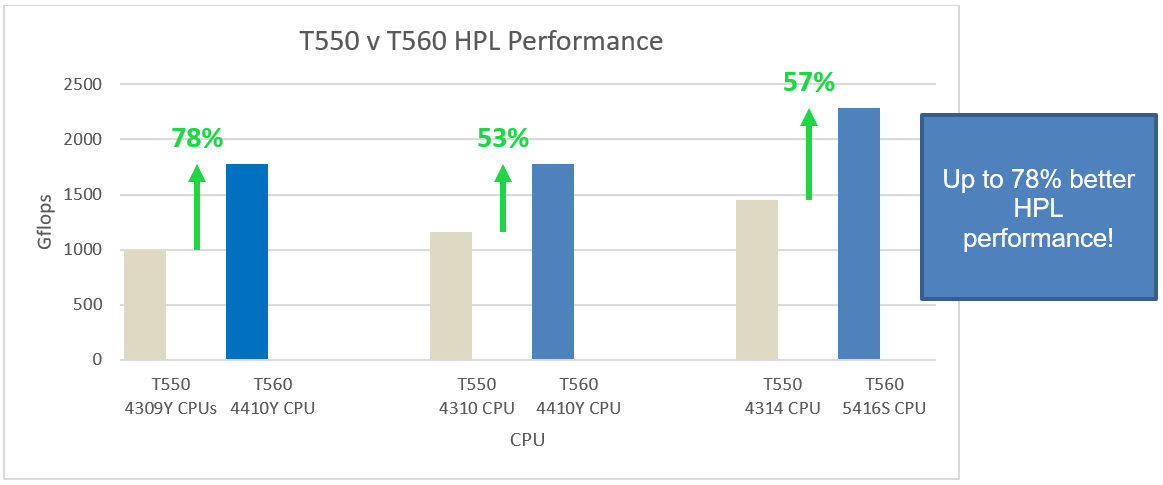
Figure 2. Three CPU comparisons demonstrating gen-over-gen performance uplift for HPL benchmark
Conclusion
For customers looking to upgrade their tower server, the Dell PowerEdge T560 captures up to 114% better performance over the prior-gen. Combined with its increased GPU capacity and 1.5x faster memory, the T560 gives enterprises the freedom to expand and explore AI/ML workloads while still powering its core business operations.
References
[1] March 2023, Dell Solutions Performance Analysis (SPA) lab test comparing 4309Y and 4410Y CPU on www.spec.org