


Battle of the Servers: PowerEdge T360 & R360 outperform prior-gen models across a range of benchmarks
Download PDF
Summary
With the launch of the PowerEdge T360 and R360, we decided to put these systems to the test against their predecessors, the T350 and R360. Our benchmarking revealed:
Workload | Use Case | T360 and R360 Performance Increase vs Prior Gen |
Database | Data Storage | Up to 50% |
Data Query | Web Host | Up to 160% |
Data Analytics | Big Data Processing | Up to 47% |
The rest of this document gives more details about the T360 & R360 and describes the testing behind these impressive results.
PowerEdge T360 and R360 Specs
Dell Technologies just announced the next servers to join the PowerEdge family: the T360 and R360. They are cost-effective 1-socket servers designed for small to medium businesses with growing compute demands. They can be deployed in the office, the near-edge, or in a typical data analytic environment.
The biggest differentiator between the T360 and R360 is form factor. The T360 is a tower server that can fit under a desk or even in a storage closet, while maintaining office-friendly acoustics. The R360, on the other hand, is a traditional 1U rack server. Both servers support the newly launched Intel® Xeon® E-series CPUs, 1 NVIDIA A2 GPU, as well as DDR5 memory, NVMe BOSS, and PCIe Gen5 I/O ports. Read this paper for more details about new features and CPU performance gains compared to prior-gen servers.
Testing Methodology, Configurations & Results
In our Dell Technologies labs, we evaluated four different industry-relevant benchmarks on the PowerEdge T350 and T360 servers using open-source Phoronix Test Suites.[1] The table below details the configurations for each system under test. While the drive configuration is the same, the PowerEdge T360 was configured with the latest DDR5 memory and the corresponding next-generation Intel CPU with equal number of cores.
Although we tested the PowerEdge T360, similar results can be expected for the PowerEdge R360 with the same configuration below. To replicate our results, see the Appendix of this report for the terminal commands to run each of the Phoronix Test Suites described in the following sections. We tested in a Linux Ubuntu Desktop environment, version 22.04.3
- Testing Configuration
Component | PowerEdge T350 | PowerEdge T360 |
CPU | Intel Xeon E-2388G, 8 cores | Intel Xeon E-2488, 8 cores |
Memory | 4x 32GB DDR4 | 4x 32GB DDR5 |
Drives | 4x 1 TB SATA HDD, PERC H345 | 4x 1 TB SATA HDD, PERC H355 |
Database Benchmarks
Businesses of any size place great importance on efficiently and securely storing large amounts data. It should come as no surprise that a key workload for both the R360 and T360 is database hosting.
We first evaluated database performance on the T360 and T350 using PostgreSQL, an open-source SQL relational database that is popular with small to medium businesses. The benchmark reports database read/write performance in number of transactions per second. Figures 1 and 2 below show two different test configurations, one with a scaling factor 1,000 and the other with scaling factor 10,000. Scaling factor is a multiplier for the number of rows in each table.
In both configurations, as the number of clients (or number of users) increases, so does transactions per second. While both the T360 and T350 follow this trend, the T360 handles up to 50% more transactions per second than the T350 [1].
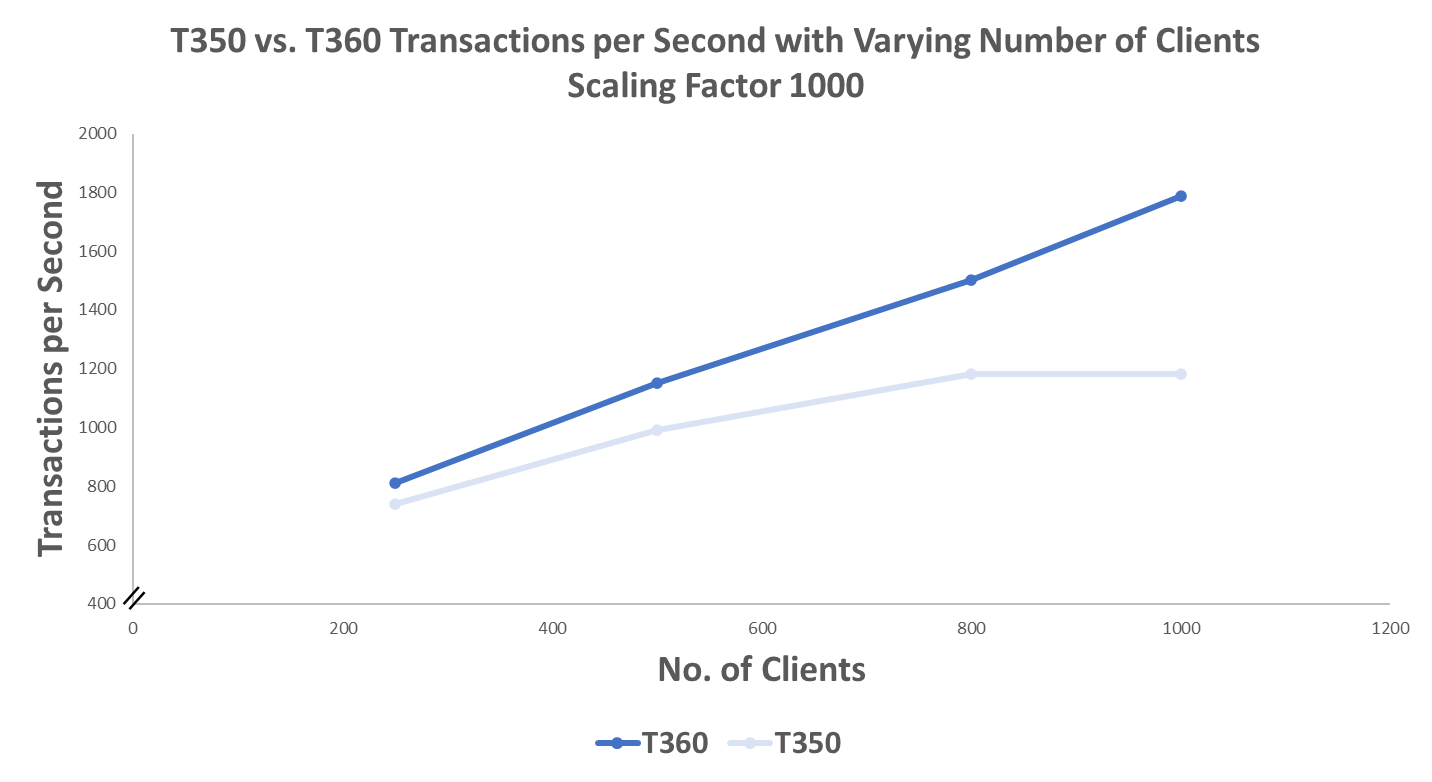
- PostgreSQL performance, Scaling Factor 1000
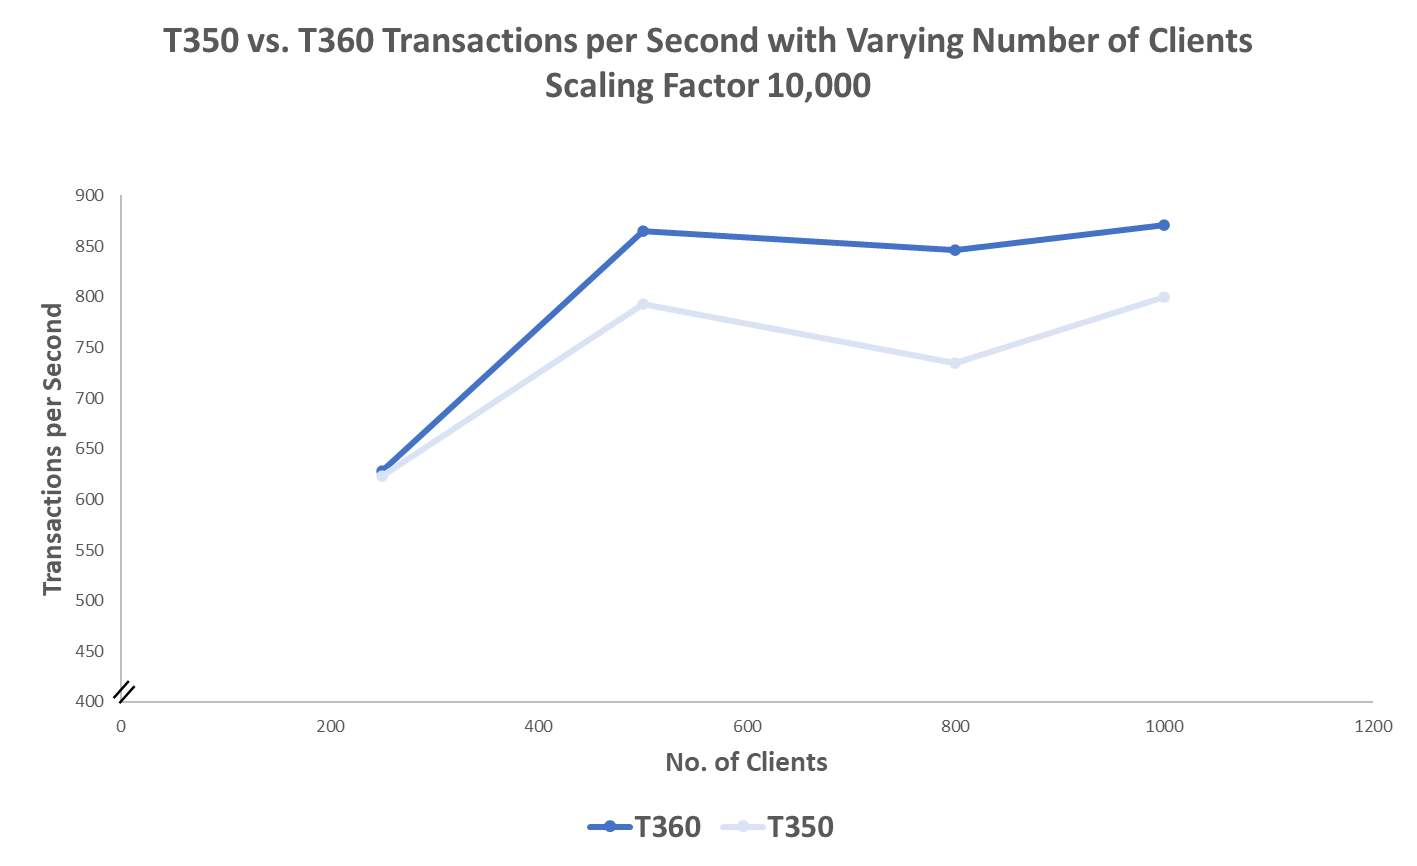
2. PostgreSQL performance, Scaling Factor 10,000
We see comparable results when testing performance with MariaDB, another open-source relational database. In this case, as the number of clients increases, the T360 handles a greater number of queries per second compared to the T350. At its peak, the T360 demonstrates an 11% performance increase over the T350 [2].
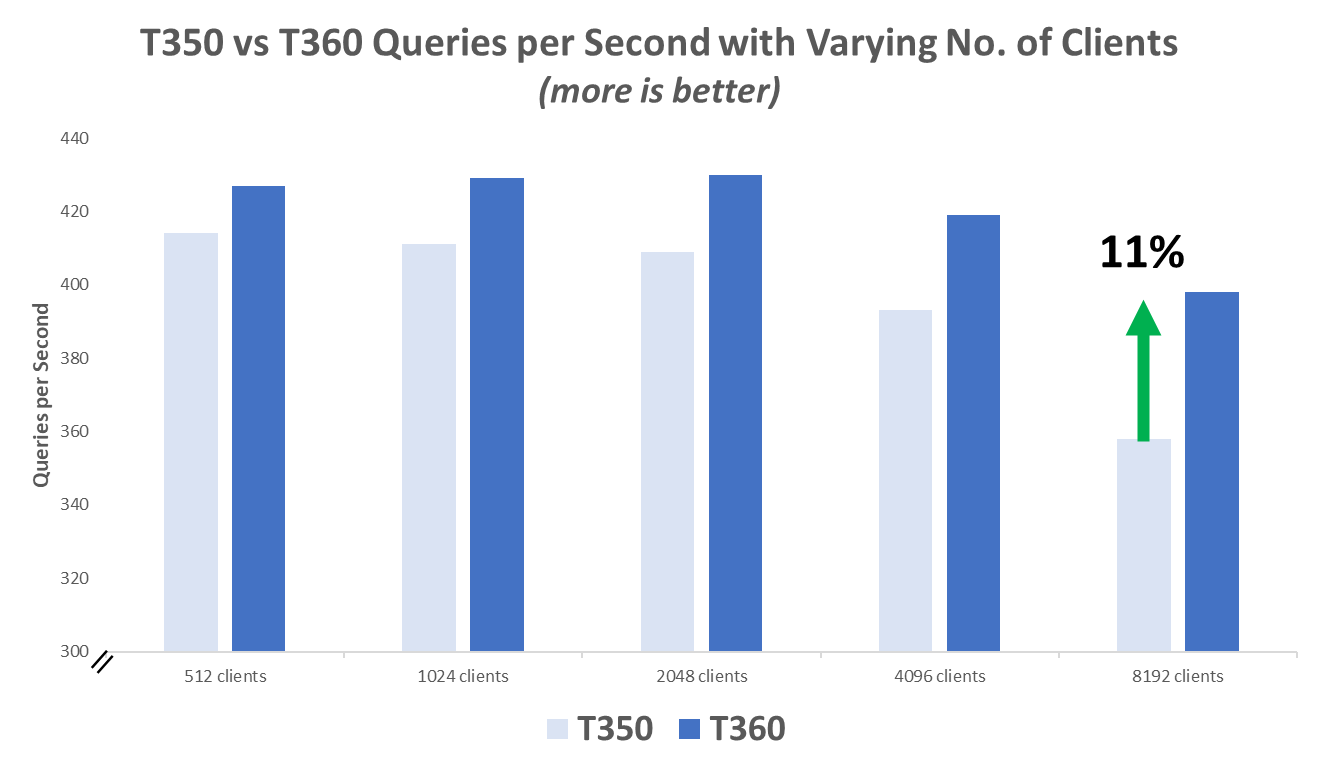
3. Queries per Second, T350 vs T360
The performance gains are impressive when you consider both servers were configured very similarly with the same drives and varied only in CPU and memory generations. These results also point to the T360 as better equipped to scale with heavier database workloads as number of clients increases and more compute is required.
Web Server Benchmark
Web hosting is a common, and critical, workload for entry-level servers. Organizations count on their websites to run efficiently, securely, and handle increasingly heavy traffic loads.
We evaluated web server performance on the T360 and T350 with Apache HTTP Server, which is a completely free, open-source, and widely used web server software. The benchmark reports the number of requests handled per second with a set number of concurrent clients, or visitors. The figure below illustrates that as the number of concurrent clients increases, the T360 is able to handle up to 160% more requests per second than the T350.
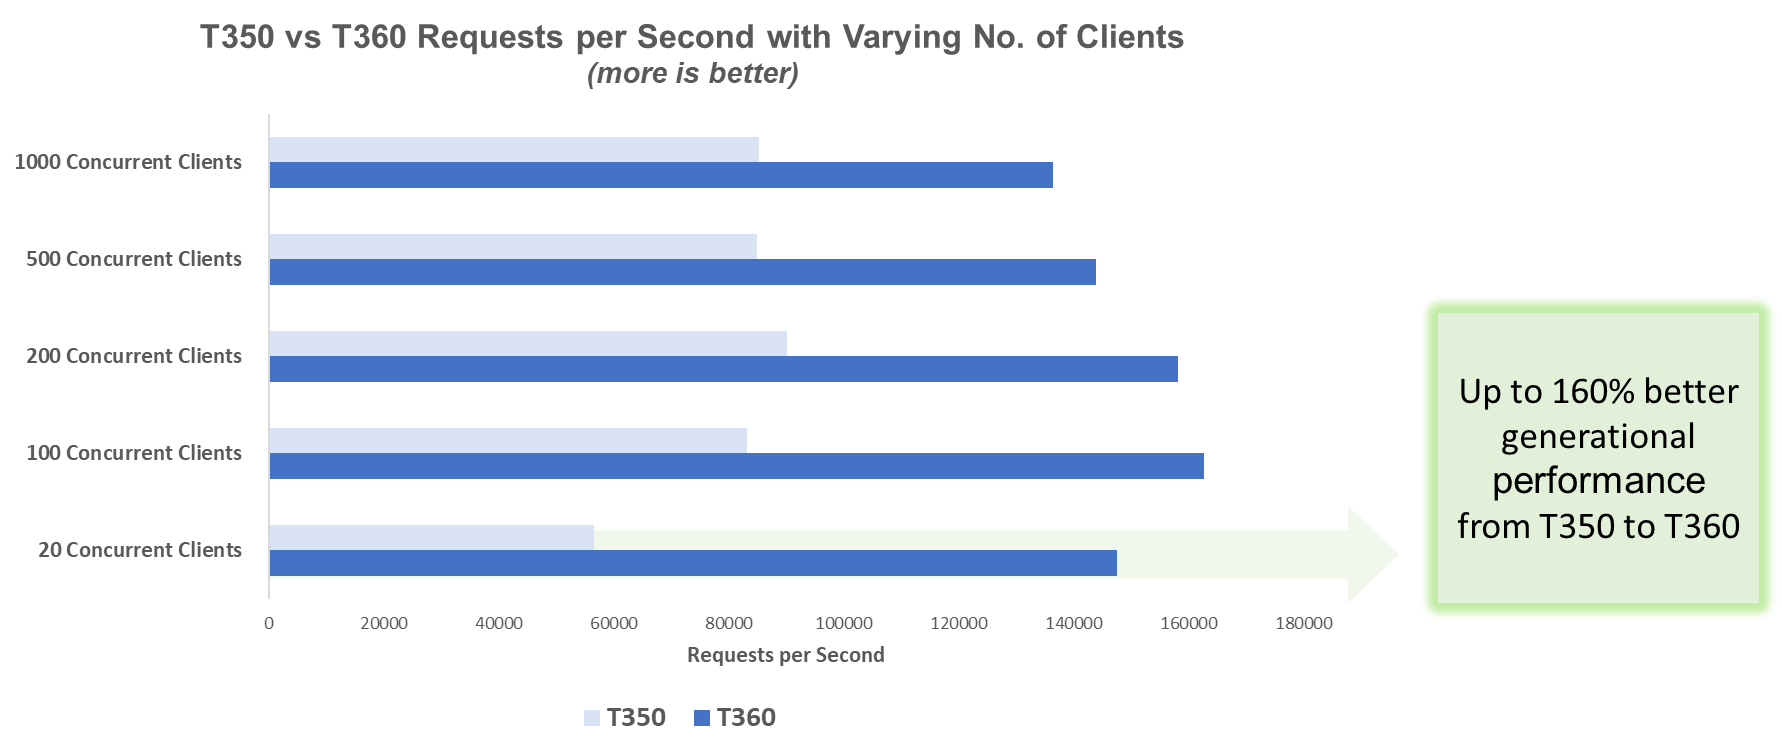
4. Requests per Second, T350 vs T360
Data Analytics Benchmark
With the growing amount of data available to all businesses, there is ample opportunity to leverage data-driven insights. Although large-scale data processing requires immense compute power, the PowerEdge R360 and T360 are more than up for the challenge.
We evaluated data analytics performance on the T360 and T350 using Apache Spark, which is an open-source analytics engine built for managing big data. The benchmark reports the time it takes to complete different Spark operations in seconds. As illustrated in the figure below, the T360 is up to 47% faster than the T350 for this workload [4].
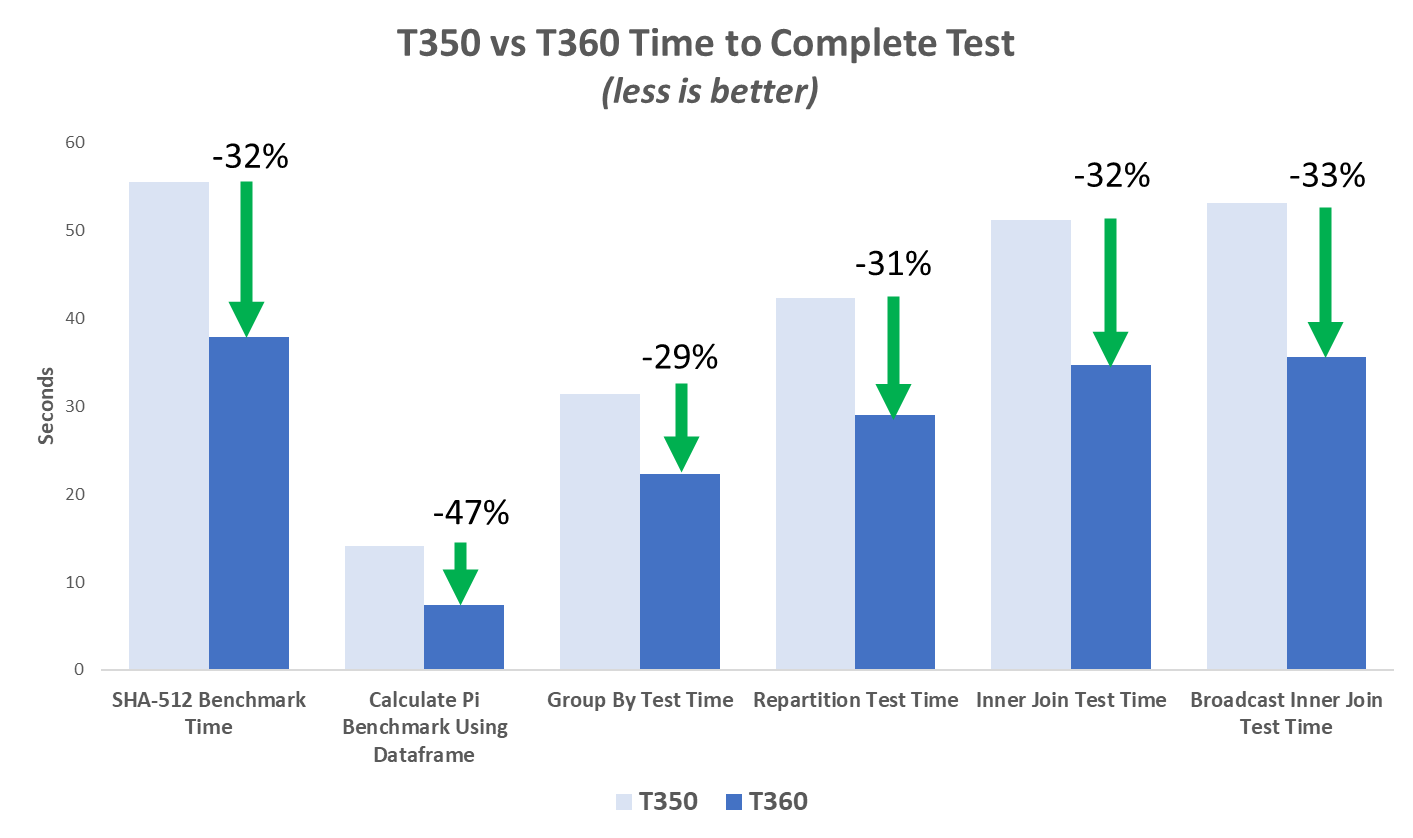
5. Time to Complete Test, T350 vs T360
Conclusion
Whether it is database workloads, web hosting, or data analytics, both the PowerEdge T360 & R360 exhibit impressive performance gains over the prior generation servers. There is a clear winner in this battle. Explore and read more about the benefits of upgrading to a PowerEdge server at PowerEdge Servers | Dell USA
References
Legal Disclosures
[1] Based on November 2023 Dell labs testing subjecting the PowerEdge T350 and T360 tower servers to a PostgreSQL benchmark with scaling factor 1000, 1000 clients, and both read and write operations. Results were obtained via a Phoronix test suite. Similar results can be expected comparing the PowerEdge R360 and R350 with the same system configurations.
[2] Based on November 2023 Dell labs testing subjecting the PowerEdge T350 and T360 tower servers to a MariaDB benchmark with 8192 clients via a Phoronix test suite. Similar results can be expected comparing the PowerEdge R360 and R350 with the same system configurations.
[3] Based on November 2023 Dell labs testing subjecting the PowerEdge T350 and T360 tower servers to an Apache HTTP Server benchmark with 20 concurrent users, via Phoronix Test Suite. Actual results will vary. Similar results can be expected comparing the PowerEdge R360 and R350 with the same system configurations.
[4] Based on November 2023 Dell labs testing subjecting the PowerEdge T350 and T360 tower servers to an Apache Spark benchmark via a Phoronix test suite. Benchmark results were obtained during a run with 40000000 rows and 1000 Partitions to calculate the Pi benchmark using Dataframe. Actual results will vary. Similar results can be expected comparing the PowerEdge R360 and R350 with the same system configurations.
Appendix
2. Phoronix Test Suite Commands
Workload |
|
Database, PostgreSQL | phoronix-test-suite run pgbench |
Database, MariaDB | phoronix-test-suite run mysqlslap |
Analytics, Apache Spark | phoronix-test-suite run spark |
Web Server, Apache HTTP | phoronix-test-suite run apache |
Note: If you do not have the required dependencies for each test, they will automatically be installed after running the command above. You will be prompted to enter “Y” for yes to kick-off the installation before testing resumes. To download Phoronix Test Suite visit Phoronix Test Suite - Linux Testing & Benchmarking Platform, Automated Testing, Open-Source Benchmarking (phoronix-test-suite.com)
Related Documents

PowerEdge T560 Delivers Significant Performance Boost and Scalability
Thu, 24 Aug 2023 18:12:49 -0000
|Read Time: 0 minutes
Summary
Dell PowerEdge T560, with 4th Generation Intel® Xeon® Scalable Processors, boosts performance by up to 114% compared to the prior-gen T550 with 3rd Generation Intel® Xeon® Scalable Processors[1]. This document presents gen-over-gen CPU benchmarks for three common T560 CPU configurations, and highlights key features that enable enterprises to host a diverse set of workloads.
Advanced technology with accelerators
From retail, hospitality, and restaurants, to small healthcare, businesses continue to rely on tower servers to enable their day-to-day operations. IDC forecasts $2 billion in worldwide tower server spending for 2024.[2]
The Dell PowerEdge T560 exceeds these business needs while fitting where other servers cannot – under desks, in closets, tucked in any available space. It drives key enterprise workloads, including traditional business applications, virtualization, and data analytics. For customers looking to capture the advantages of AI, the T560 is also tuned to power medium duty AI or ML tailored inferencing algorithms that drive more timely and accurate business insights. In fact, the T560 has 20% more GPU capacity compared to prior-gen T550.
The table below details the gen-over-gen feature improvements that support the T560’s faster, more powerful, and balanced performance:
Table 1. PowerEdge T550 vs T560 key features
| Prior-Gen PowerEdge T550 | PowerEdge T560 |
CPU | 3rd Generation Intel Xeon Scalable Processors | 4th Generation Intel Xeon Scalable Processors |
GPU | Up to 2 DW or 5 SW GPUs | Up to 2 DW or 6 SW GPU |
Storage | Up to 8x3.5” Hot Plug SAS/SATA HDDs 120TB Storage Capacity | Up to 12x3.5” Hot Plug SAS/SATA HDDs 180TB Storage Capacity |
Memory | Up to 3200 MT/s DIMM Speed | Up to 4800 MT/S DIMM Speed |
PCIe Slots | PCIe Gen4 slots | PCIe Gen5 slots |
Performance data
We captured three benchmarks -- SPEC CPU, High-Performance Linpack (HPL), and STREAM -- to compare performance across three T550 3rd Generation Intel Xeon processors and two T560 4th Generation Intel Xeon processors. We report SPEC CPU’s fprate base metric which measures throughput in terms of work per unit of time. HPL is measured in Gflops, or floating-point operations per second, which assesses overall computational power. STREAM captures memory bandwidth in MB/s.
The tests were performed in the Dell Solutions Performance Analysis (SPA) Lab in March 2023. The following gen-over-gen comparisons represent common Intel CPU configurations for T550 and T560 customers, respectively:
Table 2. Selected CPUs for T550 vs T560 performance comparison
T550 CPU Config |
T560 CPU Config |
4309Y, 8 Cores, 2 Processors tested [16 Cores] | 4410Y, 12 Cores, 1 Processor tested |
4310, 12 Cores, 1 Processor tested | 4410Y, 12 Cores, 1 Processor tested |
4314, 16 Cores, 1 Processor tested | 5416S, 16 Cores, 1 Processor tested |
All tested T560 CPU configurations across both the SPEC CPU and HPL Benchmark demonstrate a greater than 47% performance uplift, gen over gen. Most notably, just one Intel Xeon 4410Y (12 core) processor in the T560 performed 114% better than two prior-gen 4309Y processors (16 cores total) in the T550. For these same processors, the HPL benchmark saw a performance uplift of 78%, and STREAM saw an uplift of up to 57%.
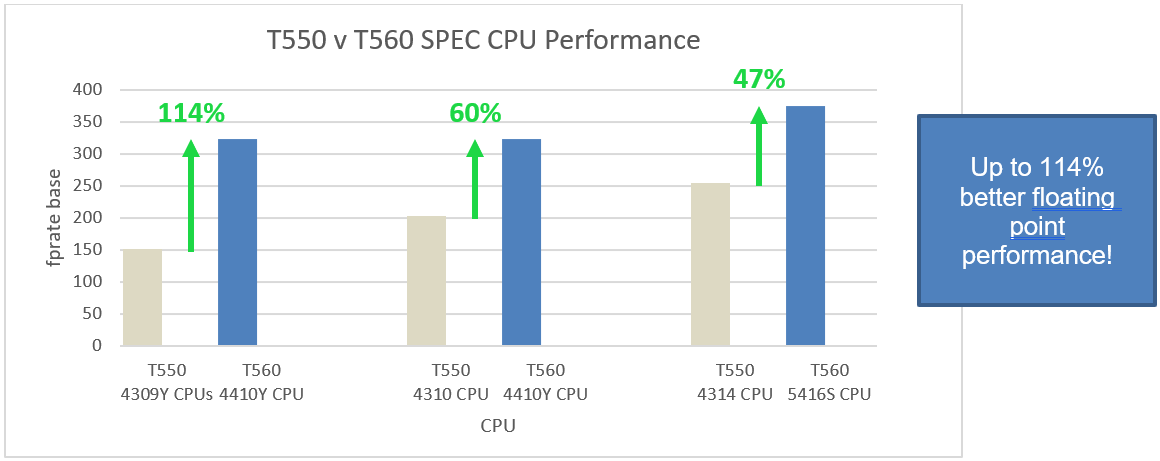
Figure 1. Three CPU comparisons demonstrating gen-over-gen performance uplift for SPEC CPU benchmark
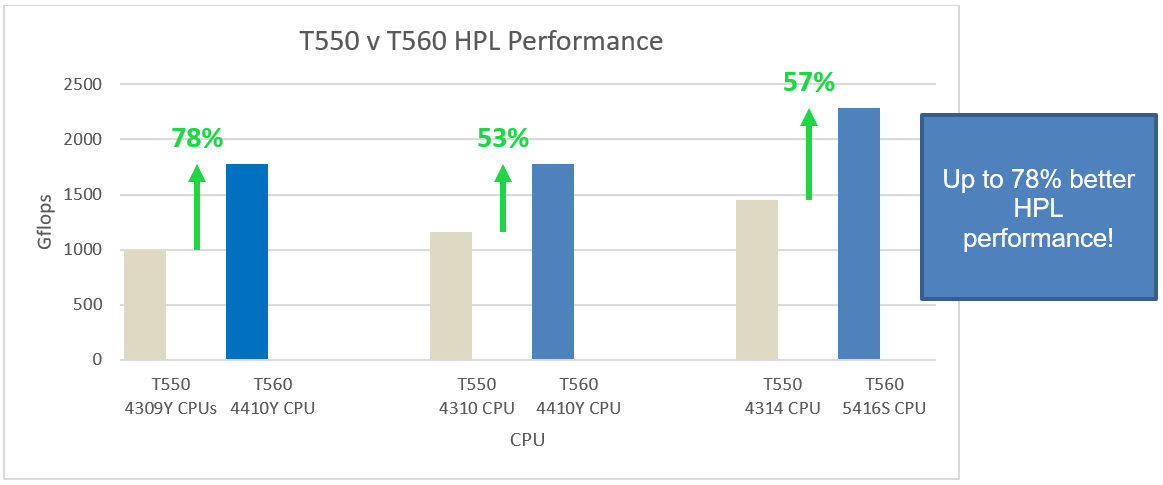
Figure 2. Three CPU comparisons demonstrating gen-over-gen performance uplift for HPL benchmark
Conclusion
For customers looking to upgrade their tower server, the Dell PowerEdge T560 captures up to 114% better performance over the prior-gen. Combined with its increased GPU capacity and 1.5x faster memory, the T560 gives enterprises the freedom to expand and explore AI/ML workloads while still powering its core business operations.
References
[1] March 2023, Dell Solutions Performance Analysis (SPA) lab test comparing 4309Y and 4410Y CPU on www.spec.org

AI Acceleration using Red Hat OpenShift with Dell PowerEdge Servers with 4th Gen Intel® Xeon® Processors
Mon, 29 Apr 2024 19:43:07 -0000
|Read Time: 0 minutes
Summary
Intel® Xeon® Scalable processors feature built-in accelerators for more performance-per-core and accelerated AI performance for a CPU, with advanced security technologies for the most in-demand workload requirements - all while offering cloud choice and application portability[1]. Red Hat OpenShift (RHOS)[2] provides a robust platform for running Large Language Model (LLM) inference and fine-tuning experiments. Red Hat OpenShift Container Platform (RHOCP) leverages Kubernetes containerization technology, allowing us to package the LLM model and its dependencies in a container for ease of deployment and portability. This ensures consistent and isolated execution across different environments. To demonstrate the combined benefits of both the advanced hardware and software products, including full end to end orchestration, Dell and Intel recently conducted Large Language Model (LLM) Artificial Intelligence (AI) performance testing. This document summaries the key features incorporated at a system level along with performance results for both LLM fine-tuning and inference use cases.
Solution overview
OpenShift is a family of containerization software products developed by Red Hat. Its flagship product is the OpenShift Container Platform - a hybrid cloud platform as a service built around Linux containers orchestrated and managed by Kubernetes on a foundation of Red Hat Enterprise Linux[3].
Some of the key changes incorporated into 4th generation Intel Xeon Scalable processors that we used for this test included:
- New Advanced Matrix Extension (AMX) capabilities[4]
- Improved Advanced Vector Extension (AVX) performance
- The new Intel Extension for PyTorch® open-source solution[5]
System configurations tested
To conduct the testing, we first deployed a 16th generation Dell PowerEdge R760 with Red Hat Enterprise Linux 8.8 as an “Administration node”. Next, we deployed a cluster of three 16th generation Dell PowerEdge R660s with Red Hat Enterprise Linux CoreOS 4.13.92 as the “Control Plane” nodes providing the Kubernetes services. These systems were chosen simply for hardware availability reasons to provided administration and orchestration of the OpenShift cluster. Table 1 shows the hardware configuration used; Table 2 shows the associated software configuration.
Hardware configuration
Table 1. Hardware configuration
| Admin Node | Control Plane Node |
System | Dell Inc. PowerEdge R760 | Dell Inc. PowerEdge R660 |
CPU Model | Intel Xeon Platinum 8452Y | Intel Xeon Platinum 8452Y |
Sockets | 2 | 2 |
Core per Socket | 36 | 36 |
All Core Turbo Freq | 2.8GHz | 2.8GHz |
TDP | 300W | 300W |
Memory | 1024GB (16x64GB DDR5 4800 MT/s) | 1024GB (16x64GB DDR5 4800 MT/s) |
Microcode | 0x2b0001b0 | 0x2b0001b0 |
Test Date | Tested by Intel as of 11/30/23 | Tested by Intel as of 11/30/23 |
Software configuration
Table 2. Software configuration
Component | Version |
Kernel | 5.14.0-284.18.1.el9_2.x86_64 |
OS | RHEL CoreOS 4.13.92 |
RHOCP | v1.26.5 |
Framework | PyTorch 2.1.0+cpu |
Other Software | Python: 3.9, IPEX: 2.1.0+cpu, transformers: 4.31.0 |
Workload configuration
Table 3. Workload configuration
Component | Version |
Model | Llama2-7B-hf |
Dataset | Finance-Alpaca |
Fine-tuning | 1,2 and 3-node cluster |
Inference | Single node |
Precision | Bfloat16 and INT8 |
Batch Size | 1,2,4,6, and 8 |
Inference SLA | 100ms for second token latency |
Performance results
All the figures in this section demonstrate the performance results of LLAMA-2-7B. Figure 1 shows the training (fine-tuning) efficiency of LLAMA-2-7B from 1 to 3 nodes in terms of time to train (hours) as Key Performance Indicator (KPI). Figure 2 shows the single node inference performance for both INT8 and BFloat16 datatypes accelerated via 4th Gen Xeon built-in AI Acceleration with AMX. Figure 3 shows the performance with multi-instance scenarios. Figures 4-11 show the performance sweeps across various batch sizes.
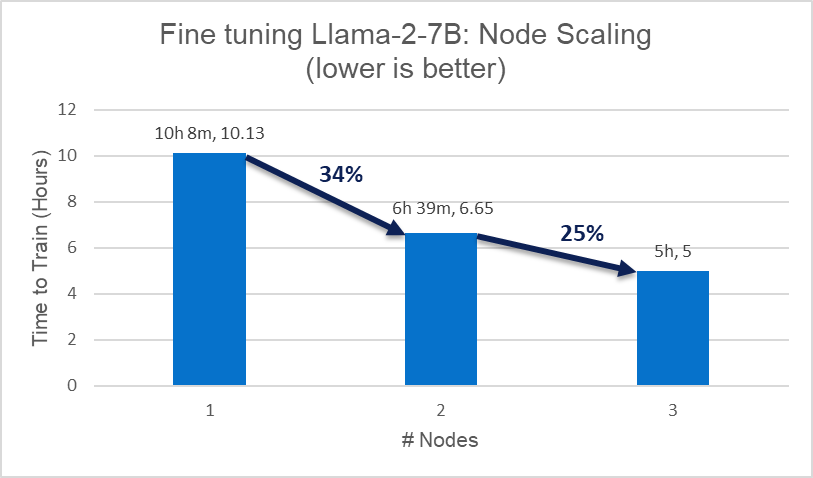
Figure 1. Fine-tuning scaling efficiency
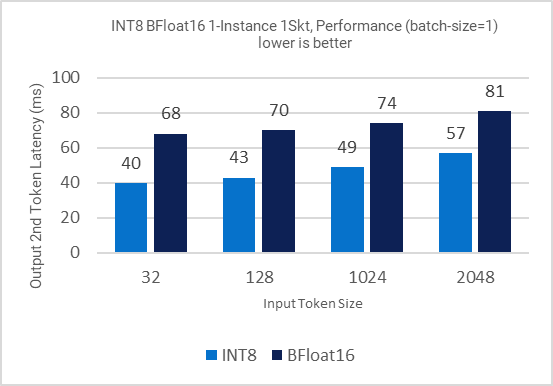
Figure 2. Inference performance for different input token sizes
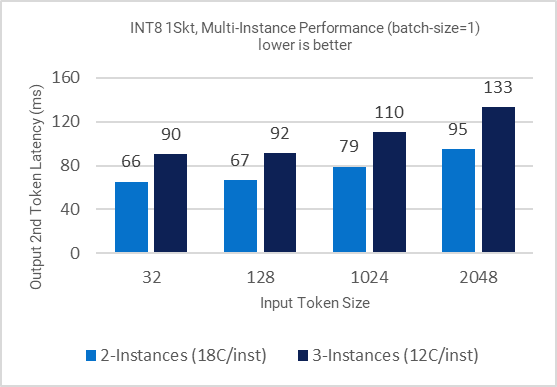
Figure 3: Multi-Instance Inference performance for different input token sizes
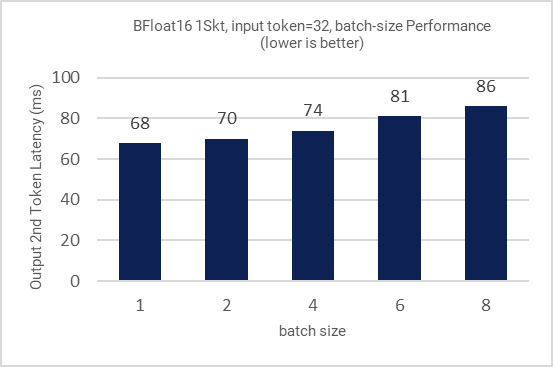
Figure 4: Inference performance for different batch sizes
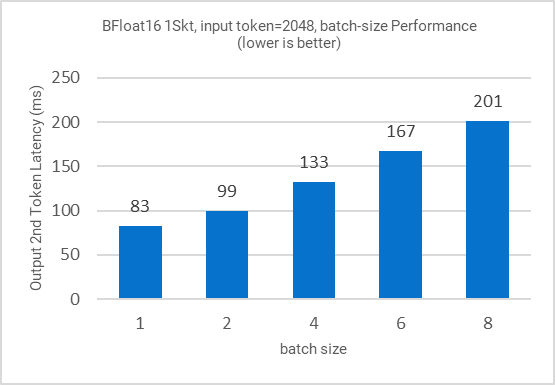
Figure 5: Inference performance for different batch sizes
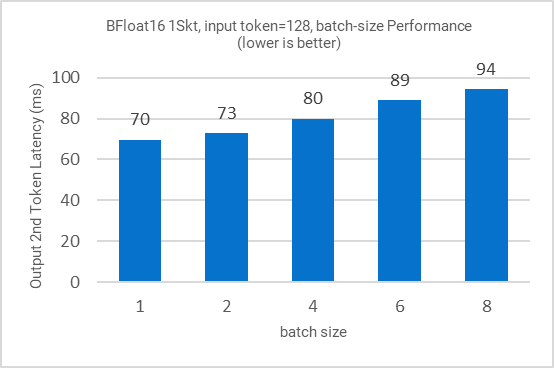
Figure 6: Inference performance for different batch sizes
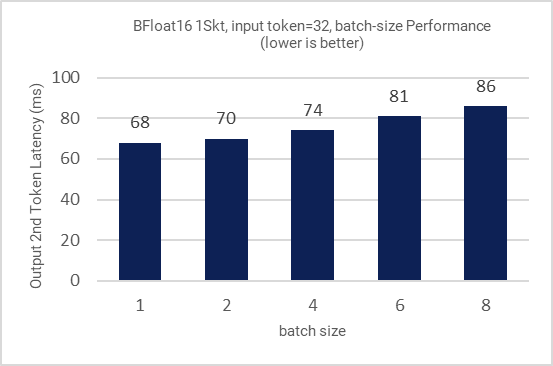
Figure 7: Inference performance for different batch sizes
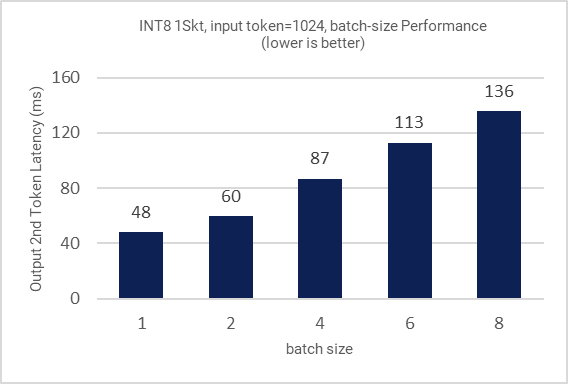
Figure 8: Inference performance for different batch sizes
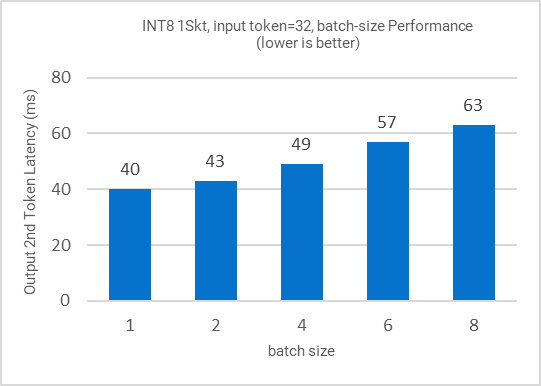
Figure 9: Inference performance for different batch sizes
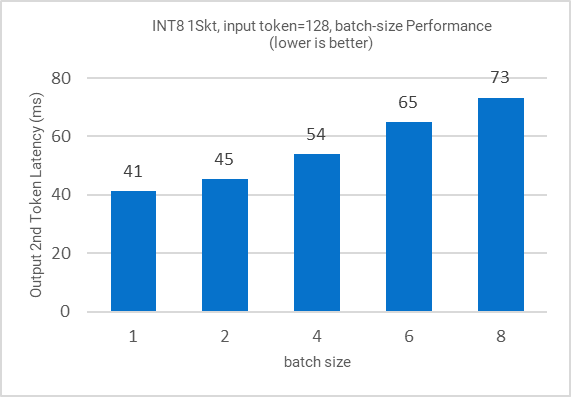
Figure 10: Inference performance for different batch sizes
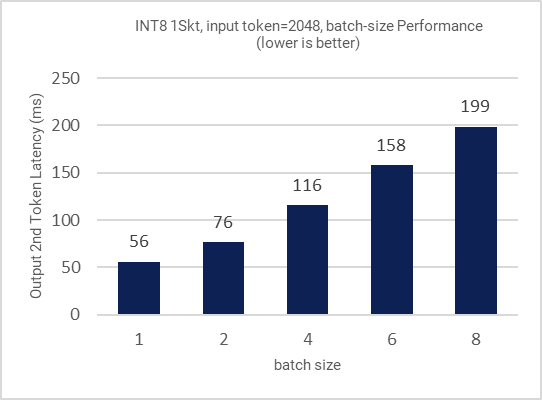
Figure 11: Inference performance for different batch sizes
Key takeaways
- Fine-tuning node scaling from 1 to 3 nodes can be easily orchestrated with Kubernetes + RHOS with 25%-35% scaling efficiency.
- Across input tokens (32, 128, 1K, 2K), INT8 1 instance/socket can deliver inference with avg. latency under 50ms.
- Across input tokens (32, 128, 1K, 2K), INT8 2 instances/socket can deliver inference with avg. latency under 100ms.
- Across input tokens (32, 128), INT8 3 instances/socket can deliver inference with avg. latency under 100ms.
- Across input tokens (32, 128, 1K, 2K), BF16 1 instance 1 socket can deliver inference with avg. latency under 100ms.
- Across input tokens (32, 128, 1K, 2K), INT8 speed up is up to 1.7x of BF16 model.
Conclusion and future work
This work demonstrated the performance effectiveness of 4th Gen Xeon on Dell PowerEdge servers for AI Large Language Model (LLM) with RHOS, the Meta LLAMA 2 Large Language Model (LLM) fine-tuning and inference. Additionally, this work demonstrates that choosing the right combination of server, processor, and software products can help provide scale out with increased performance. We would like to extend the scope of this study for larger LLMs with a variety of network topologies of varying speeds and feeds to identify optimal compute vs. communication tradeoffs for best performance.
Notices and disclaimers
Performance varies by use, configuration and other factors. Learn more at www.intel.com/PerformanceIndex.
Performance results are based on testing as of dates shown in configurations and may not reflect all publicly available updates. See backup for configuration details. No product or component can be absolutely secure.
Your costs and results may vary. Intel technologies may require enabled hardware, software or service activation.
© Intel Corporation. Intel, the Intel logo, and other Intel marks are trademarks of Intel Corporation or its subsidiaries. Other names and brands may be claimed as the property of others.
Learn more
Contact your Dell or Intel account team for a customized quote.
_____________