


Testing of performance and VDI user density of PowerEdge R750 vs. PowerEdge R760 with Intel Xeon Platinum CPUs
Download PDFFri, 20 Oct 2023 11:06:47 -0000
|Read Time: 0 minutes
Related Documents

Test Report: PowerEdge R760 with Elasticsearch
Wed, 02 Aug 2023 17:04:20 -0000
|Read Time: 0 minutes
Summary
The introduction of new server technologies allows customers to use the new functionality to deploy solutions. It can also provide an opportunity for them to review their current infrastructure to see whether the new technology can increase efficiency. With this in mind, Dell Technologies recently conducted performance testing of an Elasticsearch solution on the new Dell PowerEdge R760 and compared the results to the same solution running on the previous generation R750 to determine whether customers could benefit from a transition. All testing was conducted in Dell Labs by Intel and Dell engineers in April 2023.
Choosing which CPU to deploy with an advanced solution like Elasticsearch can be challenging. A customer looking for maximum performance would typically start with the most expensive CPU available, while another customer might make a choice that offers a tradeoff between performance and price. For the purposes of this test, we decided to benchmark the new R760 with a lower cost processor so that we could compare the results to a previous generation R750 server using the top end Intel® Xeon® Platinum 8380 CPU.
Workload overview
An Elasticsearch solution includes multiple key components that combine into the “Elastic Stack”.
- Elasticsearch: RESTful, JSON-based search engine
- Logstash: Log ingestion pipeline
- Kibana: Flexible visualization tool
- Beats: Lightweight, single purpose data shippers
Methodology
To conduct the testing, we deployed Rally 2.7.1 as the benchmarking tool. Using an OpenShift Kubernetes cluster, each server was configured to create an Elasticsearch clus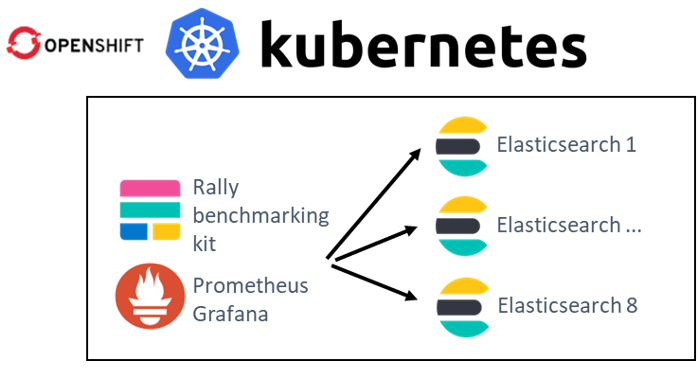 ter with eight instances (containers). Next, each system ran 10 cycles of searches to establish a “steady-state” flow of data as an indexing test. The performance of each system was measured by capturing the mean throughput of the bulk index (doc/s) and the search query latency (ms).
The benchmark simulated storing log files (application, http_logs, and system logs) and users who use Kibana to run analytics on this data. The test executes indexing and querying concurrently. Data replication was enabled, and software configuration was the same on both platforms.
The average CPU utilization during the test was 80%.
Dataset
Logging - server log data
The logging-indexing-querying workload generates multiple server logs before the test. The benchmark executes indexing and querying concurrently. Queries were issued until indexing was complete.
We used the following log types:
- Nginx access and error logs
- Apache access and error logs
- Mysql slowlog and error logs
- Kafka logs
- Redis app logs
- System syslog logs
- System auth logs
Who uses it? This data is typically produced by web services and could be used to validate HTTP responses, track web traffic, and monitor databases and system logs.
Hardware configurations tested
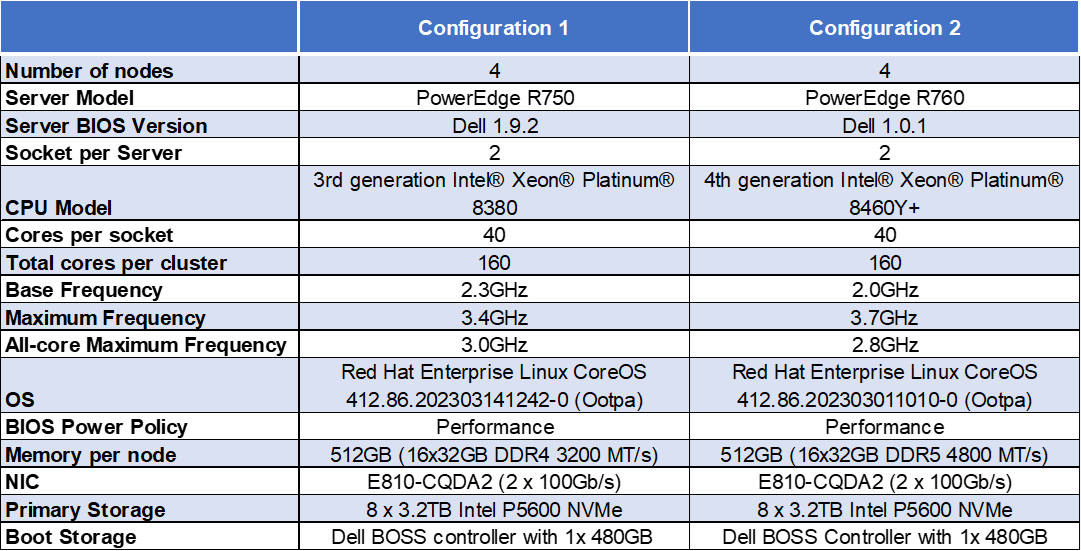
Note: The Dell Ent NVMe P5600 MU U.2 3.2TB Drives are manufactured by Solidigm.
Recommended customer pricing for the CPUs used in the tested configurations
- R750 - Intel Xeon Platinum 8380 - $9,359 - reviewed on June 6, 2023
- R760 - Intel Xeon Platinum 8460Y+ - $5,558 – reviewed on June 6, 2023
Price Delta:

Sources:
8380: Intel Xeon Platinum 8380 Processor 60M Cache 2.30 GHz Product Specifications
8460Y: Intel Xeon Platinum 8460Y Processor 105M Cache 2.00 GHz Product Specifications
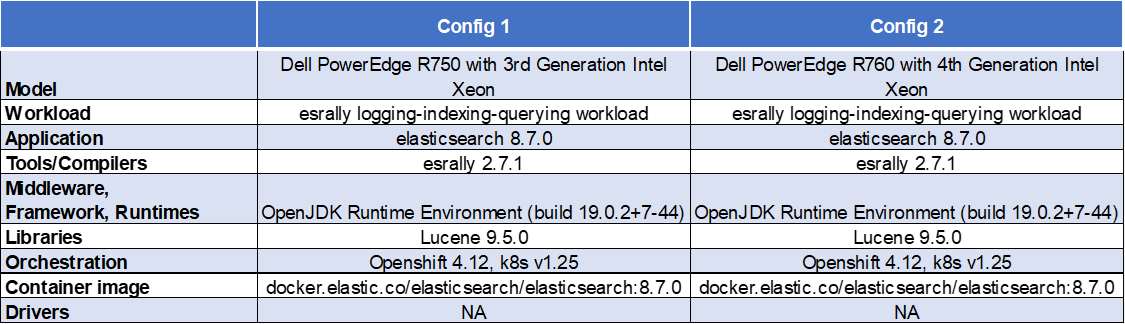
Software configuration
Test results
The following results represent the mean of 10 separate test runs.
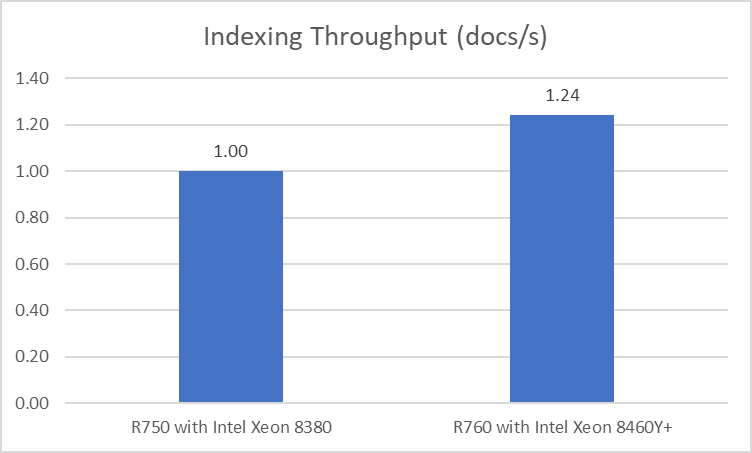
Indexing Throughput (docs/s)
Indexing throughput indicates how many documents (log lines) that Elasticsearch can index per second.
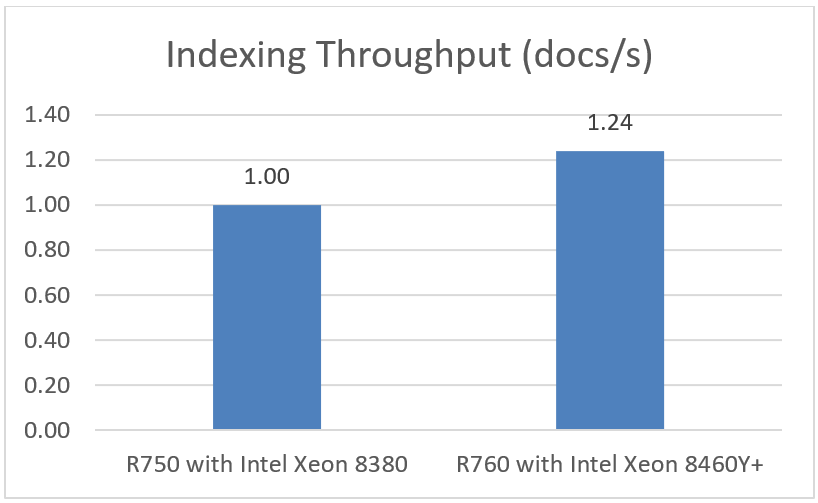
Note: Higher is better
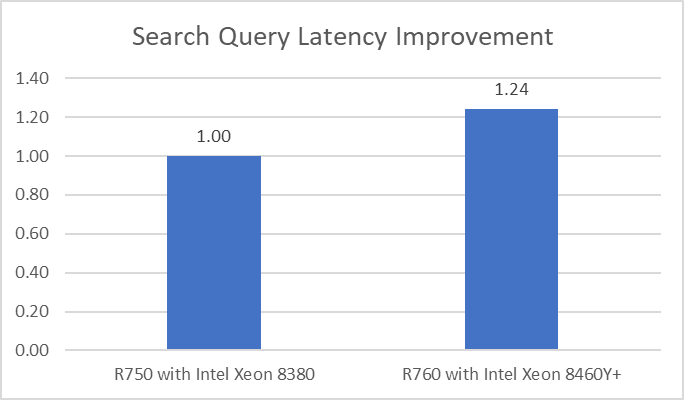
Latency Improvement
Latency improvement indicates how much faster search query results return.
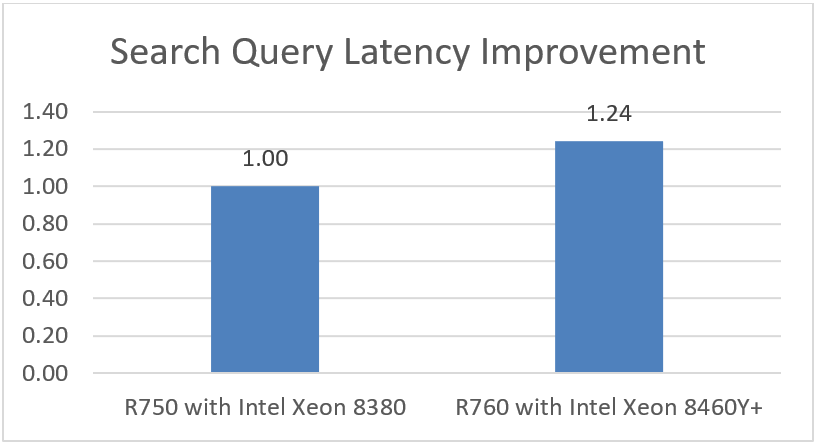
Note: Higher is better
Power consumption and calculations
Conclusion
Choosing the right combination of server and processor can increase performance, reduce latency, and reduce cost. As this testing demonstrated, the Dell PowerEdge R760 with 4th Generation Intel Xeon Platinum 8460Y CPUs was up to 1.24x faster than the Dell PowerEdge R750 with 3rd Generation Intel Xeon Platinum 8380 CPUs.
An important element to consider is that the R760 was able to accomplish all of this using CPUs with a recommended customer price that was more than 40% less, thus reducing capital expense. The testing further demonstrated that customers can reduce operating costs by implementing new technologies that can deliver more work per watt.

Delivering Insights with Intel based PowerEdge Servers and Elasticsearch
Wed, 02 Aug 2023 17:23:31 -0000
|Read Time: 0 minutes
Elasticsearch with Dell PowerEdge
At the top of this page are links to three documents: two recommended configurations of Dell PowerEdge servers and one test results paper. All testing was conducted in Dell Labs by Intel and Dell engineers in April 2023:
- Powering your Elasticsearch Solution on Kubernetes with Dell PowerEdge Servers and Intel® 3rd Generation Xeon® Scalable Processors – Highlights the recommended configurations for Dell PowerEdge servers using 3rd Generation Intel Xeon processors
- Powering your Elasticsearch solution on Kubernetes with Dell PowerEdge Servers and Intel® 4th Generation Xeon® Scalable Processors – Highlights the recommended configurations for Dell PowerEdge servers using 4th Generation Intel Xeon processors
- Test Report: PowerEdge R760 with Elasticsearch – Describes the performance test results on both architectures, including comparisons of performance and power consumption
Solution overview
According to the DB-Engines ranking, Elasticsearch is the most popular enterprise search engine[1]. Wikipedia describes Elasticsearch as, “a search engine based on the Lucene library. It provides a distributed, multitenant-capable full-text search engine with an HTTP web interface and schema-free JSON documents. Elasticsearch is developed in Java and is dual-licensed under the source-available Server-Side Public License and the Elastic license[2], while other parts[3] fall under the proprietary (source-available) Elastic License. Official clients are available in Java, .NET (C#), PHP, Python, Ruby and many other languages.”
Implementations of Elasticsearch use the “Elastic Stack,” which consists of Elasticsearch, Kibana, Beats, and Logstash (previously known as the “ELK stack”)[4]. Each of these components is described below:
- Elasticsearch: RESTful, JSON-based search engine
- Logstash: Log ingestion pipeline
- Kibana: Flexible visualization tool
- Beats: Lightweight, single purpose data shippers
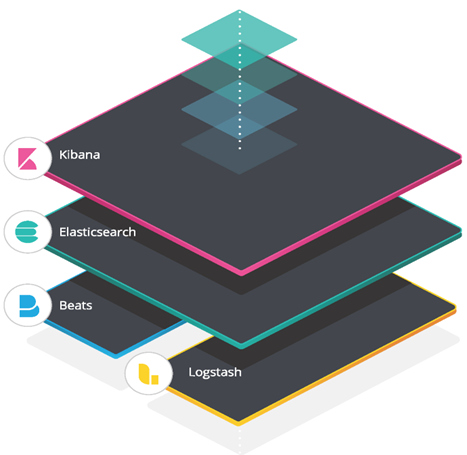
Figure 1. Elasticsearch architecture model
The benefits: Elasticsearch with Dell PowerEdge and Intel processors
Capital budget savings
As the testing document outlines, we compared the performance of two generations of platforms. To provide a meaningful comparison, we chose 40 core CPUs for each platform. For the R750, this meant the Intel Xeon Platinum 8380; for the R760, this meant the Intel Xeon Platinum 8460Y+. The result was a significant cost difference:
R750 - Intel Xeon Platinum 8380 - $9,359 - reviewed on June 6, 2023
R760 - Intel Xeon Platinum 8460Y+ - $5,558 – reviewed on June 6, 2023
Price Delta:

Sources:
8380: Intel Xeon Platinum 8380 Processor 60M Cache 2.30 GHz Product Specifications
8460Y: Intel Xeon Platinum 8460Y Processor 105M Cache 2.00 GHz Product Specifications
Note that while the R750 had the highest performing processor available in its generation, for even higher performance, R760 customers have the choice of moving up to the Intel Platinum 8480+ processor, which delivers 56 cores.
Operational budget savings
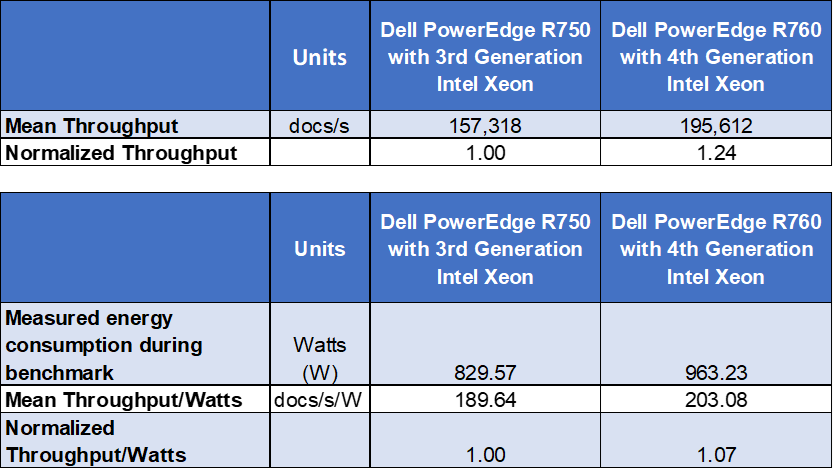
When measuring power, it is important to consider not just raw power consumption but more importantly, the amount of work that can be achieved per watt. In our tests we found that the R750 system averaged 829.57 watts of power consumption; the R760 required 963.23 watts. Although the R760 used more power, it also delivered significantly higher performance (24%). The end result was that the R760 delivered 7% more queries/watt than the R750.
Raw performance
As noted above, our tests showed a 24% increase in the number of documents per second that could be indexed.
Reduced latency
In addition to higher performance, the R760 also provided the data 24% faster than the previous generation:
Raw data
We obtained the following raw data from our tests:
 Note: The same dataset was used for both tests, however, results may vary based on the size of the dataset being used and the types of logs being indexed.
Conclusion
Choosing the right combination of server and processor can increase performance, reduce latency, and reduce cost. As this testing demonstrated, the Dell PowerEdge R760 with 4th Generation Intel Xeon Platinum 8460Y CPUs was up to 1.24x faster than the Dell PowerEdge R750 with 3rd Generation Intel Xeon Platinum 8380 CPUs.
Importantly, the R760 was able to accomplish all of this using CPUs with a recommended Customer Price that was more than 40% less, thus reducing capital expense. The testing also showed that customers can reduce operating costs by implementing new technologies that can deliver more work per watt.
[1] https://db-engines.com/en/ranking/search+engine, as of June 6, 2023
[2] https://www.protocol.com/enterprise/about/aws-targeted-by-elastic, as of June 6, 2023
[3] No, Elastic X-Pack is not going to be open source - according to Elastic themselves - (flax.co.uk), as of June 6, 2023
[4] https://en.wikipedia.org/wiki/Elastic_NV, as of June 6, 2023