


MLPerf™ Inference v1.0 – CPU Based Benchmarks on Dell PowerEdge R750 Server
Download PDF
Summary
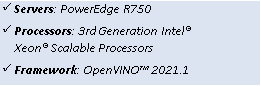
MLCommons™ Association has released the third round of results v1.0 for its machine learning inference performance benchmark suite MLPerf™. Dell EMC has participated in this effort by collaborating with several partners and using multiple configurations, spanning from Intel® CPU to accelerators such as GPU’s and FPGA’s. This blog is focused on the results for computer vision inference benchmarks (image classification and object detection), in the closed division / datacenter category, running on Dell EMC PowerEdge R750 in collaboration with Intel® and using its Optimized Inference System based on OpenVINO™ 2021.1.
Introduction
In this blog we present the MLPerf™ Inference v1.0 CPU based results submitted on PowerEdge R750 with Intel® processor using the Intel® optimized inference system based on OpenVINO™ 2021.1. Table 1 shows the technical specifications of this system.
Dell EMC PowerEdge R750 Server
System Name | PowerEdge R750 |
Status | Coming soon |
System Type | Data Center |
Number of Nodes | 1 |
Host Processor Model Name | Intel(R) Xeon(R) Gold 6330 CPU @ 2.0GHz |
Host Processors per Node | 2 |
Host Processor Core Count | 28 |
Host Processor Frequency | 2.00 GHz |
Host Memory Capacity | 1TB 1 DPC 3200 MHz |
Host Storage Capacity | 1.5TB |
Host Storage Type | NVMe |
3rd Generation Intel® Xeon® Scalable Processor
The 3rd Generation Intel® Xeon® Scalable processor family is designed for data center modernization to drive operational efficiency and higher productivity, leveraged with built-in AI acceleration tools, to provide the seamless performance foundation for data center and edge systems. Table 2 shows the technical specifications for CPU’s Intel® Xeon®.
Product Collection | 3rd Generation Intel® Xeon® Scalable Processors |
Code Name | Ice Lake |
Processor Name | Gold 6330 |
Status | Launched |
# of CPU Cores | 28 |
# of Threads | 56 |
Processor Base Frequency | 2.0GHz |
Max Turbo Speed | 3.10GHz |
Cache L3 | 42 MB |
Memory Type | DDR4-2933 |
ECC Memory Supported | Yes |
MLPerf™ Inference v1.0 - Datacenter
The MLPerf™ inference benchmark measures how fast a system can perform ML inference using a trained model with new data in a variety of deployment scenarios. There are two benchmark suites, one for Datacenter systems and one for Edge. Table 3 lists six mature models included in the official release v1.0 for Datacenter systems category and the vision models both image classification and object detection. The benchmark models highlighted below were run on PowerEdge R750.
Datacenter Benchmark Suite
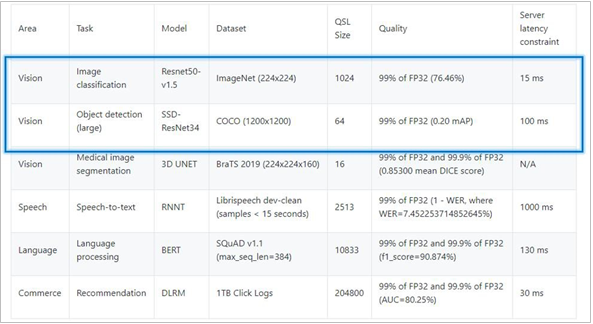
Table 3: Datacenter Suite Benchmarks. Source: MLCommons™
Scenarios
The above models are deployed in a variety of critical inference applications or use cases known as “scenarios”, where each scenario requires different metrics, demonstrating production environment performance in the real practice. Below is the description of each scenario and the Table 4 shows the scenarios required for each Datacenter benchmark included in this submission v1.0.
Offline scenario: represents applications that process the input in batches of data available immediately, and don’t have latency constraint for the metric performance measured as samples per second.
Server scenario: this scenario represents deployment of online applications with random input queries, the metric performance is queries per second (QPS) subject to latency bound. The server scenario is more complicated in terms of latency constraints and input queries generation, this complexity is reflected in the throughput-degradation results compared to offline scenario.
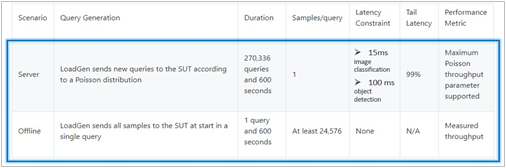
Table 4: MLPerf™ Inference Scenarios. Source: MLCommons™
Software Stack and System Configuration
The software stack and system configuration used for this submission is summarized in Table 5. Some of the settings that really mattered when looking at benchmark performance are captured in the table below.
OS | Ubuntu 20.10 (GNU/Linux 5.8.0-45-generic x86_64) |
Intel® Optimized Inference SW for MLPerf™ | MLPerf™ Intel OpenVino OMP CPP v1.0 Inference Build |
ECC memory mode | ON |
Host memory configuration | 1TiB | 64G per memory channel (1DPC) with 2933mt/s |
Turbo mode | ON |
CPU frequency governor | Performance |
OpenVINO™ Toolkit
The OpenVINO™ 2021.1 toolkit is used to optimize and run Deep Learning Neural Network models on Intel® hardware. The toolkit consists of three primary components: inference engine, model optimizer, and intermediate representation. The Model Optimizer is used to convert the MLPerf™ reference implementation benchmarks from a framework into quantized INT8 models to run on Intel® architecture.
Benchmark Parameter Configurations
The benchmarks and scenarios submitted for this round are ResNet50-v1.5 and SSD-ResNet34 in offline and server scenarios. Both benchmarks required tunning certain parameters to achieve maximum performance. The parameter configurations and expected performance depend on the processor characteristics including number on CPUs used (number of sockets), number of cores, number of threads, batch size, number of requests, CPU frequency, memory configuration and the software accelerator. Table 6 shows the parameter setting used to run the benchmarks to obtain optimal performance and produce VALID results to pass Compliance tests.
Model | Scenario | OpenVINO params & batch size |
ResNet50 INT8 | Offline | nireq = 224, nstreams = 112, nthreads = 56, batch = 4 |
Server | nireq = 28, nstreams = 14, nthreads = 56, batch = 1 | |
SSD-ResNet34 INT8 | Offline | nireq = 28, nstreams = 28, nthreads = 56, batch = 1 |
Server | nireq = 4, nstreams = 2, nthreads = 56, batch = 1 |
Results
From the scenario perspective, we benchmark the CPU performance by comparing server versus offline scenario and determine what is the delta. We also looked at results from our prior submission v0.7 to v1.0, so we can determine how the performance improved for Intel Xeon 3rd Generation compared to Intel Xeon 2nd.
ResNet50-v1.5 in server and offline scenarios
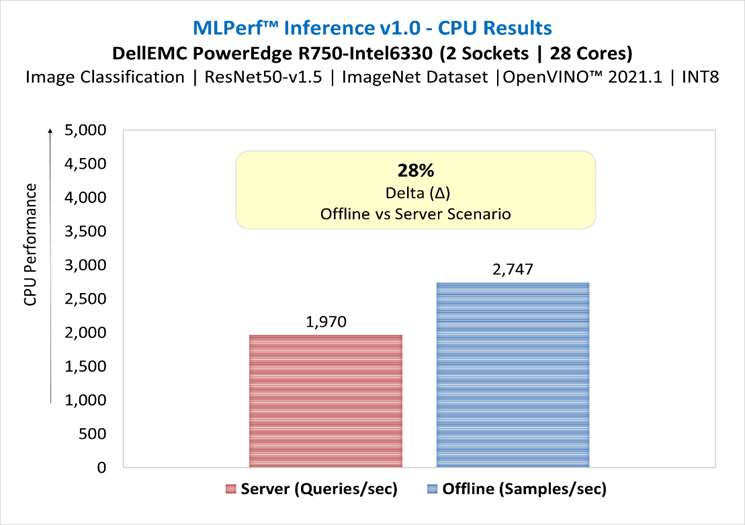
Figure 1: ResNet50-v1.5 in server and offline scenarios
SSD-ResNet34 in server and offline scenarios
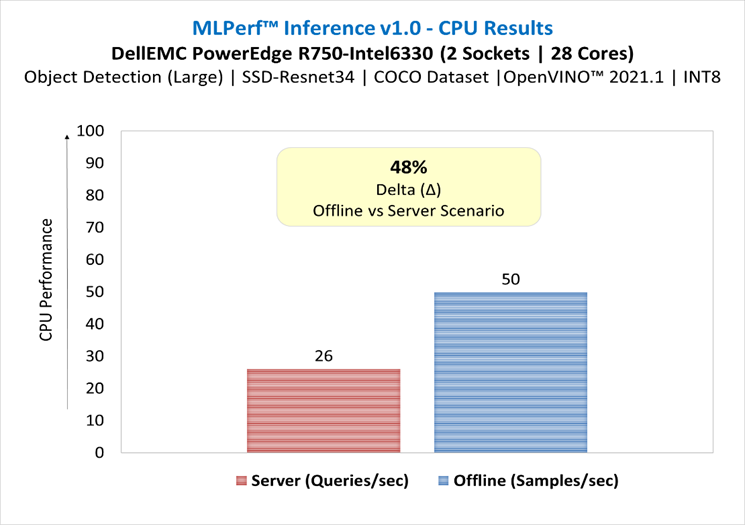
Figure 2: SSD-ResNet34 in server and offline scenario
Figure 3 illustrates the normalized server-to-offline performance for each model, scores close to 1 indicate that the model is delivering similar throughput in server scenario (constrained latency) as it is in offline scenario (unconstrained latency), scores close to zero indicate severe throughput degradation.
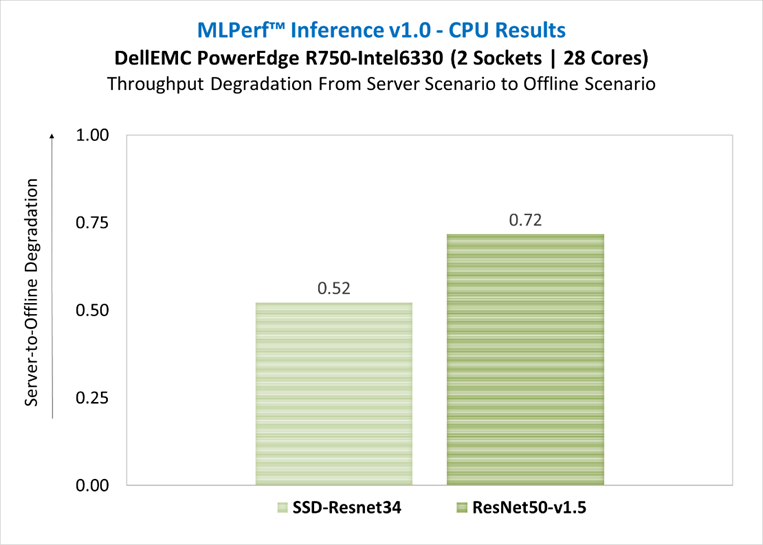
Figure 3: Throughput degradation from server scenario to offline scenario
Results submission v0.7 versus v1.0
In this section we compare the results from submission v0.7 versus this submission v1.0 to determine how the performance improved from servers with 2nd gen Xeon scalable processors vs. 3rd gen. The table below shows the server specifications used on each submission:
| Dell EMC Server for Submission v0.7 | Dell EMC Server for Submission v1.0 |
System Name | PowerEdge R740xd | PowerEdge R750 |
Host Processor Model Name | Intel(R) Xeon(R) Platinum 8280M | Intel(R) Xeon(R) Gold 6330 |
Host Processor Generation | 2nd | 3rd |
Host Processors per Node | 2 | 2 |
Host Processor Core Count | 28 | 28 |
Host Processor Frequency | 2.70 GHz | 2.00 GHz |
Host Processor TDP | 205W | 205W |
Host Memory Capacity | 376GB - 2 DPC 3200 MHz | 1TB - 1 DPC 3200 MHz |
Host Storage Capacity | 1.59TB | 1.5TB |
Host Storage Type | SATA | NVMe |
ResNet50-v1.5 in Offline Scenario | Submission v0.7 vs. v1.0
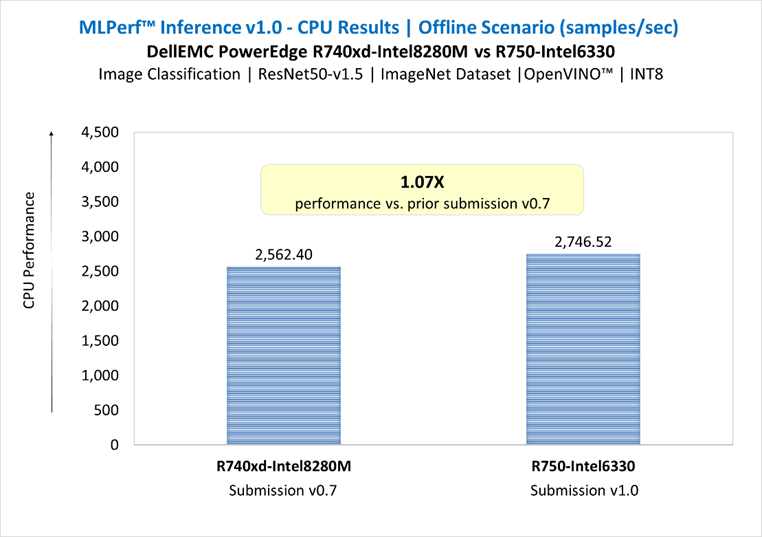
Figure 4: ResNet50-v1.5 in Offline Scenario | Submission v0.7 vs. v1.0
ResNet50-v1.5 in Server Scenario | Submission v0.7 vs. v1.0
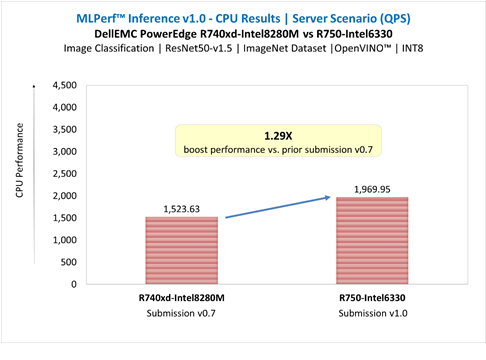
Figure 5: ResNet50-v1.5 in Server Scenario | Submission v0.7 vs. v1.0
SSD-ResNet34 in Offline Scenario | Submission v0.7 vs. v1.0
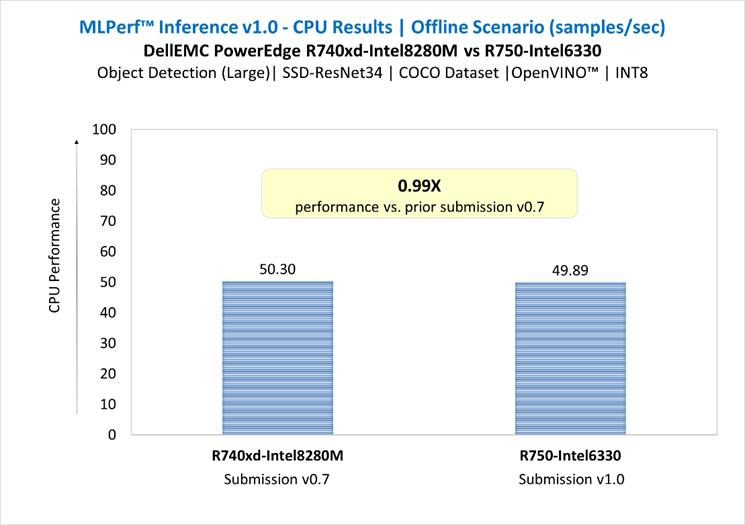
Figure 6: SSD-ResNet34 in Offline Scenario | Submission v0.7 vs. v1.0
SSD-ResNet34 in Server Scenario | Submission v0.7 vs. v1.0
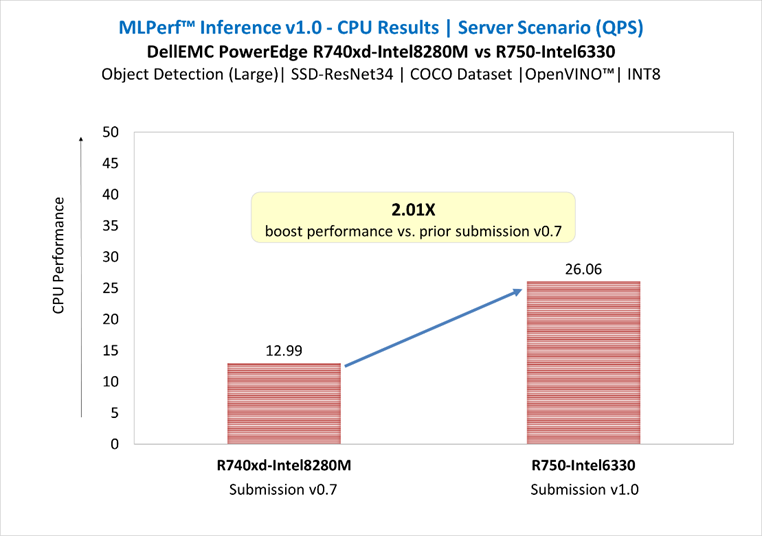
Figure 7: SSD-ResNet34 in Server Scenario | Submission v0.7 vs. v1.0
Conclusion
Both the Gold 6330 and the previous generation Platinum 8280 were chosen for this test because they have 28 cores and a memory interface that operates at 2933Mt/s. Customers with more demanding requirements could also consider higher performing variants of the 3rd Gen Intel® Xeon® scalable processor family up to the 40 core Platinum 8380 which uses a memory interface capable of 3200MT/s.
- The two-socket (dual CPU) server Dell EMC PowerEdge R750 equipped with 3rd Gen Intel® Xeon® scalable processors delivered:
- Up to 1.29X boost performance for image classification and up to 2.01X boost performance for object detection large in server scenario, compared to prior submission of PowerEdge R740xd equipped with 2nd Gen Intel® Xeon® processors.
- For ResNet50-v1.5 benchmark, there was a loss degradation around 28% from server scenario (constrained latency) to offline scenario (unconstrained latency). For SSD-ResNet34 benchmark, the loss was around 48%. These results demonstrate the complexity of server scenario in terms of latency constraints and input queries generation. The throughput degradation from server scenario is an indication of how well the system handles the latency constraint requirements, and it could be related to several factors such as the hardware architecture, the batching management, the inference software stack used to run the benchmarks. It is recommended to conduct performance analysis of the system including both scenarios.
- PowerEdge R750 server drives enhanced performance to suite computer vision inferencing tasks, as well as other complex workloads such as database and advanced analytics, VDI, AI, DL, and ML in datacenters deployments; it is an ideal solution for data center modernization to drive operational efficiency, lead higher productivity, and maximize total cost of ownership (TCO).
Citation
@misc{reddi2019mlperf,
title={MLPerf™ Inference Benchmark},
author={Vijay Janapa Reddi and Christine Cheng and David Kanter and Peter Mattson and Guenther Schmuelling and Carole-Jean Wu and Brian Anderson and Maximilien Breughe and Mark Charlebois and William Chou and Ramesh Chukka and Cody Coleman and Sam Davis and Pan Deng and Greg Diamos and Jared Duke and Dave Fick and J. Scott Gardner and Itay Hubara and Sachin Idgunji and Thomas B. Jablin and Jeff Jiao and Tom St. John and Pankaj Kanwar and David Lee and Jeffery Liao and Anton Lokhmotov and Francisco Massa and Peng Meng and Paulius Micikevicius and Colin Osborne and Gennady Pekhimenko and Arun Tejusve Raghunath Rajan and Dilip Sequeira and Ashish Sirasao and Fei Sun and Hanlin Tang and Michael Thomson and Frank Wei and Ephrem Wu and Lingjie Xu and Koichi Yamada and Bing Yu and George Yuan and Aaron Zhong and Peizhao Zhang and Yuchen Zhou}, year={2019},
eprint={1911.02549}, archivePrefix={arXiv}, primaryClass={cs.LG}
Related Documents

MLPerf Inference v0.7 Benchmarks on Dell EMC PowerEdge R740xd and R640 Servers
Mon, 16 Jan 2023 13:44:22 -0000
|Read Time: 0 minutes
Summary
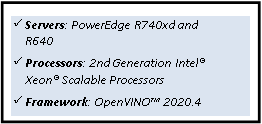
MLPerf Consortium has released the second round of results v0.7 for its machine learning inference performance benchmark suite. Dell EMC has been participated in this contest in collaboration with several partners and configurations, including inferences with CPU only and with accelerators such as GPU’s and FPGA’s. This blog is focused on the submission results in the closed division/datacenter category for the servers Dell EMC PowerEdge R740xd and PowerEdge R640 with CPU only, in collaboration with Intel® and its Optimized Inference System based on OpenVINO™ 2020.4.
In this DfD we present the MLPerf Inference v0.7 results submission for the servers PowerEdge R740xd and R640 with Intel® processors, using the Intel® Optimized Inference System based on OpenVINO™ 2020.4. Table 1 shows the technical specifications of these systems.
Dell EMC PowerEdge R740xd and R640 Servers
Specs Dell EMC PowerEdge Servers
System Name | PowerEdge R740xd | PowerEdge R640 |
Status | Commercially Available | Commercially Available |
System Type | Data Center | Data Center |
Number of Nodes | 1 | 1 |
Host Processor Model Name | Intel®(R) Xeon(R) Platinum 8280M | Intel®(R) Xeon(R) Gold 6248R |
Host Processors per Node | 2 | 2 |
Host Processor Core Count | 28 | 24 |
Host Processor Frequency | 2.70 GHz | 3.00 GHz |
Host Memory Capacity | 384 GB 1 DPC 2933 MHz | 188 GB |
Host Storage Capacity | 1.59 TB | 200 GB |
Host Storage Type | SATA | SATA |
Accelerators per Node | n/a | n/a |
2nd Generation Intel® Xeon® Scalable Processors
The 2nd Generation Intel® Xeon® Scalable processor family is designed for data center modernization to drive operational efficiencies and higher productivity, leveraged with built-in AI acceleration tools, to provide the seamless performance foundation for data center and edge systems. Table 2 shows the technical specifications for CPU’s Intel® Xeon®.
Intel® Xeon® Processors
Product Collection | Platinum 8280M | Gold 6248R |
# of CPU Cores | 28 | 24 |
# of Threads | 56 | 48 |
Processor Base Frequency | 2.70 GHz | 3.00 GHz |
Max Turbo Speed | 4.00 GHz | 4.00 GHz |
Cache | 38.5 MB | 35.75 MB |
Memory Type | DDR4-2933 | DDR4-2933 |
Maximum memory Speed | 2933 MHz | 2933 MHz |
TDP | 205 W | 205 W |
ECC Memory Supported | Yes | Yes |
Table 2 - Intel Xeon Processors technical specifications
OpenVINO™ Toolkit
The OpenVINO™ toolkit optimizes and runs Deep Learning Neural Network models on Intel® Xeon CPUs. The toolkit consists of three primary components: inference engine, model optimizer, and intermediate representation (IP). The Model Optimizer is used to convert the MLPerf inference benchmark reference implementations from a framework into quantized INT8 models, optimized to run on Intel® architecture.
MLPerf Inference v0.7
The MLPerf inference benchmark measures how fast a system can perform ML inference using a trained model with new data in a variety of deployment scenarios. There are two benchmark suites, one for Datacenter systems and one for Edge as shown below in Table 3 with the list of six mature models included in the official release v0.7 for Datacenter systems category.
Area | Task | Model | Dataset |
Vision | Image classification | Resnet50-v1.5 | ImageNet (224x224) |
Vision | Object detection (large) | SSD-ResNet34 | COCO (1200x1200) |
Vision | Medical image segmentation | 3D UNET | BraTS 2019 (224x224x160) |
Speech | Speech-to-text | RNNT | Librispeech dev-clean (samples < 15 seconds) |
Language | Language processing | BERT | SQuAD v1.1 (max_seq_len=384) |
Commerce | Recommendation | DLRM | 1TB Click Logs |
The above models serve in a variety of critical inference applications or use cases known as “scenarios”, where each scenario requires different metrics, demonstrating production environment performance in the real practice. Below is the description of each scenario in Table 4 and the showing the scenarios required for each Datacenter benchmark.
Offline scenario: represents applications that process the input in batches of data available immediately, and don’t have latency constraint for the metric performance measured as samples per second.
Server scenario: this scenario represents deployment of online applications with random input queries, the metric performance is queries per second (QPS) subject to latency bound. The server scenario is more complicated in terms of latency constraints and input queries generation, this complexity is reflected in the throughput-degradation compared to offline scenario.
Area | Task | Required Scenarios |
Vision | Image classification | Server, Offline |
Vision | Object detection (large) | Server, Offline |
Vision | Medical image segmentation | Offline |
Speech | Speech-to-text | Server, Offline |
Language | Language processing | Server, Offline |
Commerce | Recommendation | Server, Offline |
Results
For MLPerf Inference v0.7, we focused on computer vision applications with the optimized models resnet50- v1.5 and ssd-resnet34 for offline and server scenarios (required for data center category). Figure 1 & Figure 2 show the graphs for Inference results on Dell EMC PowerEdge servers.
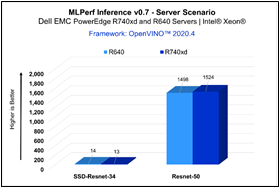
Figure 2 - Server Scenario
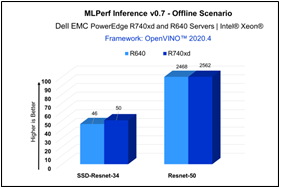
Figure 2 - Offline Scenario
| Resnet-50 | SSD-Resnet-34 | ||
Offline | Server | Offline | Server | |
PowerEdge R740xd | 2562 | 1524 | 50 | 13 |
PowerEdge R640 | 2468 | 1498 | 46 | 14 |
The results above demonstrate consistent inference performance using the 2nd Gen Intel® Xeon Scalable processors on the PowerEdge R640 and PowerEdge R740 platforms. The models Resnet-50 and SSD- Resnet34 are relatively smaller compared to other benchmarks included in the MLPerf Inference v0.7 suite, and customers looking to deploy image classification and object detection inference workloads with Intel CPUs can rely on these servers to meet their requirements, within the target throughput-latency budget.
Conclusion
Dell EMC PowerEdge R740xd and R640 servers with Intel® Xeon® processors and leveraging OpenVINO™ toolkit enables high-performance deep learning inference workloads for data center modernization, bringing efficiency and improved total cost of ownership (TCO).
Citation
@misc{reddi2019mlperf,
title={MLPerf Inference Benchmark},
author={Vijay Janapa Reddi and Christine Cheng and David Kanter and Peter Mattson and Guenther Schmuelling and Carole-Jean Wu and Brian Anderson and Maximilien Breughe and Mark Charlebois and William Chou and Ramesh Chukka and Cody Coleman and Sam Davis and Pan Deng and Greg Diamos and Jared Duke and Dave Fick and J. Scott Gardner and Itay Hubara and Sachin Idgunji and Thomas B. Jablin and Jeff Jiao and Tom St. John and Pankaj Kanwar and David Lee and Jeffery Liao and Anton Lokhmotov and Francisco Massa and Peng Meng and Paulius Micikevicius and Colin Osborne and Gennady Pekhimenko and Arun Tejusve Raghunath Rajan and Dilip Sequeira and Ashish Sirasao and Fei Sun and Hanlin Tang and Michael Thomson and Frank Wei and Ephrem Wu and Lingjie Xu and Koichi Yamada and Bing Yu and George Yuan and Aaron Zhong and Peizhao Zhang and Yuchen Zhou}, year={2019},
eprint={1911.02549}, archivePrefix={arXiv}, primaryClass={cs.LG}
}

Test Report: PowerEdge R760 with Elasticsearch
Wed, 02 Aug 2023 17:04:20 -0000
|Read Time: 0 minutes
Summary
The introduction of new server technologies allows customers to use the new functionality to deploy solutions. It can also provide an opportunity for them to review their current infrastructure to see whether the new technology can increase efficiency. With this in mind, Dell Technologies recently conducted performance testing of an Elasticsearch solution on the new Dell PowerEdge R760 and compared the results to the same solution running on the previous generation R750 to determine whether customers could benefit from a transition. All testing was conducted in Dell Labs by Intel and Dell engineers in April 2023.
Choosing which CPU to deploy with an advanced solution like Elasticsearch can be challenging. A customer looking for maximum performance would typically start with the most expensive CPU available, while another customer might make a choice that offers a tradeoff between performance and price. For the purposes of this test, we decided to benchmark the new R760 with a lower cost processor so that we could compare the results to a previous generation R750 server using the top end Intel® Xeon® Platinum 8380 CPU.
Workload overview
An Elasticsearch solution includes multiple key components that combine into the “Elastic Stack”.
- Elasticsearch: RESTful, JSON-based search engine
- Logstash: Log ingestion pipeline
- Kibana: Flexible visualization tool
- Beats: Lightweight, single purpose data shippers
Methodology
To conduct the testing, we deployed Rally 2.7.1 as the benchmarking tool. Using an OpenShift Kubernetes cluster, each server was configured to create an Elasticsearch clus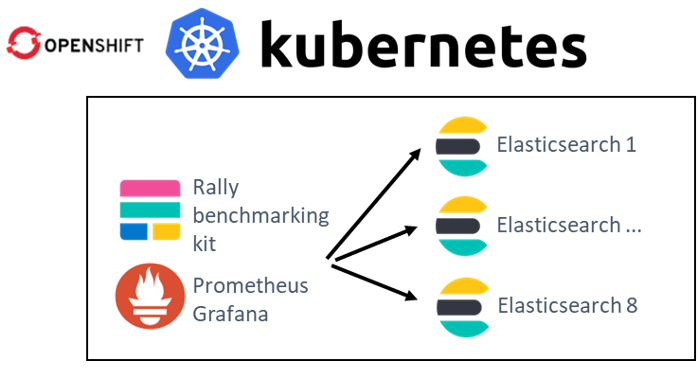 ter with eight instances (containers). Next, each system ran 10 cycles of searches to establish a “steady-state” flow of data as an indexing test. The performance of each system was measured by capturing the mean throughput of the bulk index (doc/s) and the search query latency (ms).
The benchmark simulated storing log files (application, http_logs, and system logs) and users who use Kibana to run analytics on this data. The test executes indexing and querying concurrently. Data replication was enabled, and software configuration was the same on both platforms.
The average CPU utilization during the test was 80%.
Dataset
Logging - server log data
The logging-indexing-querying workload generates multiple server logs before the test. The benchmark executes indexing and querying concurrently. Queries were issued until indexing was complete.
We used the following log types:
- Nginx access and error logs
- Apache access and error logs
- Mysql slowlog and error logs
- Kafka logs
- Redis app logs
- System syslog logs
- System auth logs
Who uses it? This data is typically produced by web services and could be used to validate HTTP responses, track web traffic, and monitor databases and system logs.
Hardware configurations tested
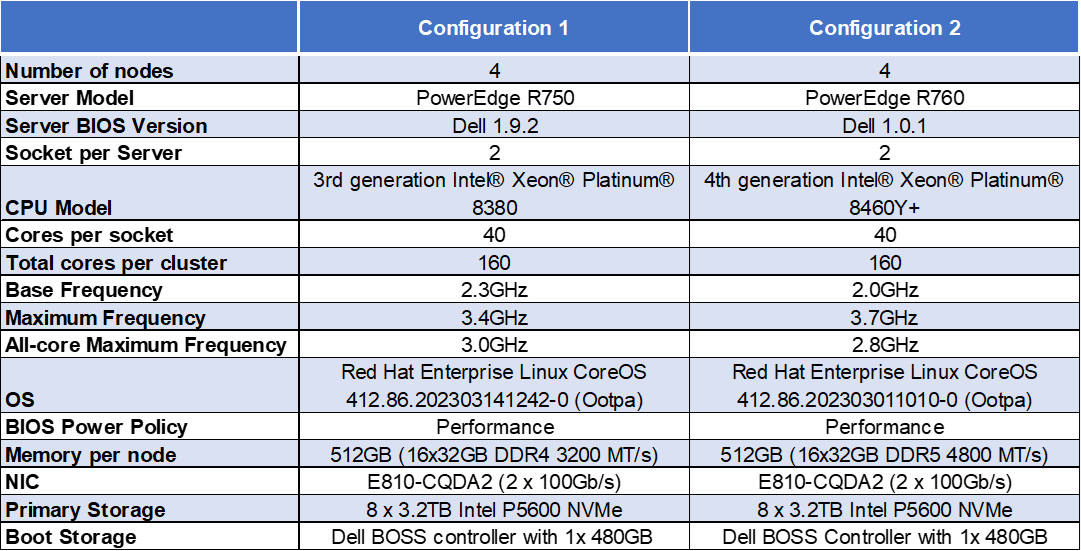
Note: The Dell Ent NVMe P5600 MU U.2 3.2TB Drives are manufactured by Solidigm.
Recommended customer pricing for the CPUs used in the tested configurations
- R750 - Intel Xeon Platinum 8380 - $9,359 - reviewed on June 6, 2023
- R760 - Intel Xeon Platinum 8460Y+ - $5,558 – reviewed on June 6, 2023
Price Delta:

Sources:
8380: Intel Xeon Platinum 8380 Processor 60M Cache 2.30 GHz Product Specifications
8460Y: Intel Xeon Platinum 8460Y Processor 105M Cache 2.00 GHz Product Specifications
Software configuration
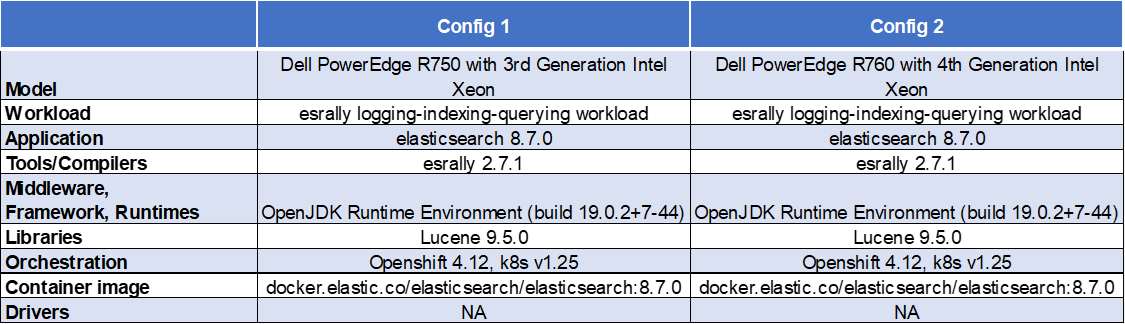
Test results
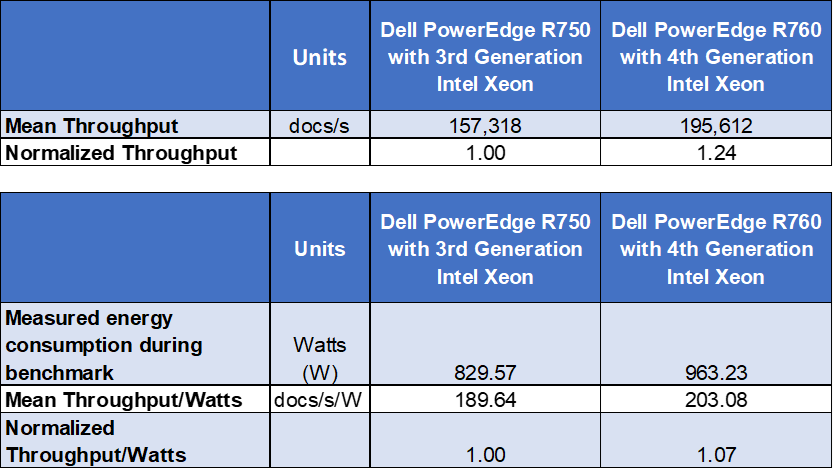
The following results represent the mean of 10 separate test runs.
Indexing Throughput (docs/s)
Indexing throughput indicates how many documents (log lines) that Elasticsearch can index per second.
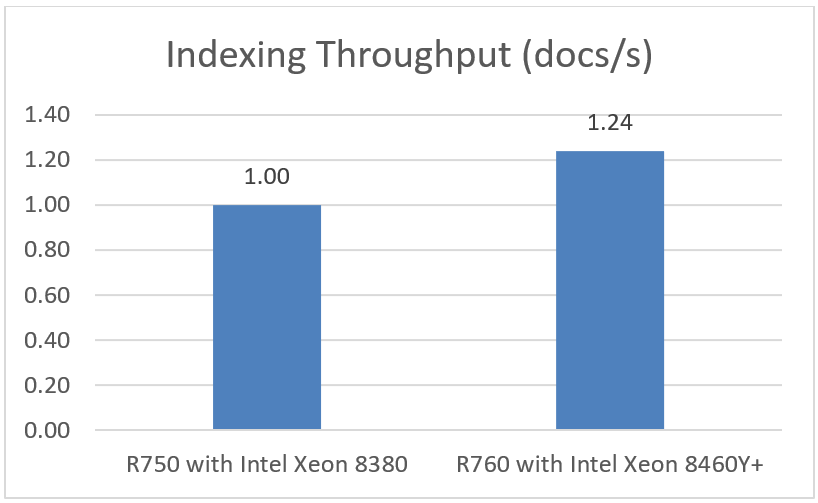
Note: Higher is better
Latency Improvement
Latency improvement indicates how much faster search query results return.
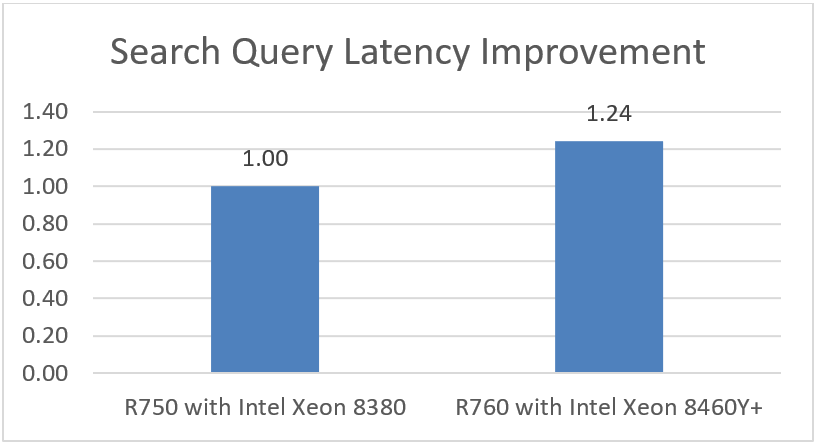
Note: Higher is better
Power consumption and calculations
Conclusion
Choosing the right combination of server and processor can increase performance, reduce latency, and reduce cost. As this testing demonstrated, the Dell PowerEdge R760 with 4th Generation Intel Xeon Platinum 8460Y CPUs was up to 1.24x faster than the Dell PowerEdge R750 with 3rd Generation Intel Xeon Platinum 8380 CPUs.
An important element to consider is that the R760 was able to accomplish all of this using CPUs with a recommended customer price that was more than 40% less, thus reducing capital expense. The testing further demonstrated that customers can reduce operating costs by implementing new technologies that can deliver more work per watt.