

Achieving Significant Virtualization Performance Gains with New 16G Dell® PowerEdge™ R760 Servers
Download PDFThu, 25 Jan 2024 17:43:01 -0000
|Read Time: 0 minutes
Summary
With the latest Dell PowerEdge R760 16G servers utilizing the PCIe® 5.0 interface to connect networking and storage to the CPU, there are great performance increases in data movement over previous PCIe generations. These improvements can be utilized by hyperconverged infrastructures running on these servers.
This Direct from Development (DfD) tech note presents a generational server performance comparison in a virtualized environment comparing new 16G Dell PowerEdge R760 servers deployed with new KIOXIA CM7 Series SSDs with prior generation 14G Dell PowerEdge R740xd servers deployed with prior generation KIOXIA CM6 Series SSDs.
As presented by the test results, the latest Dell generation PowerEdge servers perform the same amount of work in less time and deliver faster performance in a virtualized environment when compared with prior PCIe server generations.
Market positioning
Data center infrastructures typically fall into three categories: traditional, converged and hyperconverged. Hyperconverged infrastructures enable users to add compute, memory and storage requirements as needed, delivering the flexibility of horizontal and vertical scaling. However, many virtual machine (VM) configurations run in converged infrastructures, and their ability to scale is often difficult when VM clusters require more storage.
VMware®, Inc. enables hyperconverged infrastructures through VMware ESXi™ and VMware vSAN™ platforms. The VMware ESXi platform is a popular enterprise-grade virtualization platform that scales compute and memory as needed and provides simple management of large VM clusters. The VMware vSAN platform enables the infrastructure to transition from converged to hyperconverged, delivering incredibly fast performance since storage is local to the servers themselves. The platforms support a new VMware vSAN Express Storage Architecture™ (ESA) that has gone through a series of optimizations to utilize NVMe™ SSDs more efficiently than in the past.
Product features
Dell PowerEdge 760 Rack Server (Figure 1)
Specifications: https://www.delltechnologies.com/asset/en-us/products/servers/technical-support/poweredge-r760-spec-sheet.pdf.

Figure 1: Side angle of Dell PowerEdge 760 Rack Server1
KIOXIA CM7 Series Enterprise NVMe SSD (Figure 2) Specifications:https://americas.kioxia.com/en-us/business/ssd/enterprise-ssd.html.
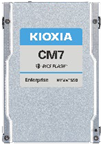
Figure 2: Front view of KIOXIA CM7 Series SSD2
PCIe 5.0 and NVMe 2.0 specification compliant; Two configurations: CM7-R Series (read intensive), 1 Drive Write Per Day3 (DWPD), up to 30,720 gigabyte4 (GB) capacities and CM7-V Series (higher endurance mixed use), 3 DWPD, up to 12,800 GB capacities.
Performance specifications: SeqRead = up to 14,000 MB/s; SeqWrite = up to 7,000 MB/s; RanRead = up to 2.7M IOPS; RanWrite = up to 600K IOPS.
Hardware/Software test configuration
The hardware and software equipment used in this virtualization comparison (Figure 3):
Server Information | ||
Server Model | Dell PowerEdge R7605 | Dell PowerEdge R740xd6 |
No. of Servers | 3 | 3 |
BIOS Version | 1.3.2 | 2.18.1 |
CPU Information | ||
CPU Model | Intel® Xeon® Gold 6430 | Intel Xeon Silver 4214 |
No. of Sockets | 2 | 2 |
No. of Cores | 64 | 24 |
Frequency (in gigahertz) | 2.1 GHz | 2.2 GHz |
Memory Information | ||
Memory Type | DDR5 | DDR4 |
Memory Speed (in megatransfers per second) | 4,400 MT/s | 2,400 MT/s |
Memory Size (in gigabytes) | 16 GB | 32 GB |
No. of DIMMs | 16 | 12 |
Total Memory (in gigabytes) | 256 GB | 384 GB |
SSD Information | ||
SSD Model | KIOXIA CM7-R Series | KIOXIA CM6-R Series |
Form Factor | 2.5-inch7 | 2.5-inch |
Interface | PCIe 5.0 x4 | PCIe 4.0 x4 |
No. of SSDs | 12 | 12 |
SSD Capacity (in terabytes4) | 3.84 TB | 3.84 TB |
Drive Write(s) Per Day (DWPD) | 1 | 1 |
Active Power | 25 watts | 19 watts |
Operating System Information | ||
Operating System (OS) | VMware ESXi | VMware ESXi |
OS Version | 8.0.1, 21813344 | 8.0.1, 21495797 |
VMware vCenter® Version | 8.0.1.00200 | 8.0.1.00200 |
Storage Type | vSAN ESA | vSAN ESA |
Load Generator Information (Test Software) | ||
Load Generator | HyperConverged Infrastructure Benchmark (HCIBench) | HCIBench |
Load Generator Version | 2.8.2 | 2.8.2 |
Figure 3: Hardware/Software configuration used in the comparison
Set-up and test procedures
Set-up:
The latest VMware ESXi 8.0 operating system was installed on all hosts.
Two clusters were created in VMware’s vCenter management interface with ‘High Availability’ and ‘Distributed Resource Scheduler’ disabled for testing.
Each Dell PowerEdge R760 host was added into a cluster - then each Dell PowerEdge R740xd host was added into a separate cluster.
VMkernel adapters were set up to have VMware vMotion™ migration, provisioning, management and the VMware vSAN platform enabled for both test configurations.
In the VMware vSAN configurations, twelve KIOXIA CM7 Series drives were added for the Dell PowerEdge R760 cluster (four drives per server), and twelve KIOXIA CM6 Series drives were added for the Dell PowerEdge R740xd cluster (four drives per server). The default storage policy was set to ‘vSAN ESA Default Policy – RAID 5’ for both configurations.
The HCIBench load generator (virtual appliance) was then imported and configured on the network.
Test procedures:
The latest VMware ESXi 8.0 operating system was installed on all hosts.
Six tests were run on each cluster – four performance tests and two power consumption tests as follows:
Performance tests:
IOPS: This metric measured the number of Input/Output operations per second that the system completed. Throughput: This metric measured the amount of data transferred per second to and from the storage devices.
Read Latency: This metric measured the time it took to perform a read operation. It included the average time it took for the load generator to not only issue the read operation, but also the time it took to complete the operation and receive a ‘successfully completed’ acknowledgement.
Write Latency: This metric measured the time it took to perform a write operation. It included the average time it took for the load generator to not only issue the write operation, but also the time it took to complete the operation and receive a ‘successfully completed’ acknowledgement.
Power consumption tests:
IOPS per Watt: This metric measured the amount of IOPS performed in conjunction with the power consumed by the cluster.
Throughput per Watt: This metric measured the amount of throughput performed in conjunction with the power consumed by the cluster.
For the four performance tests, the following five workloads were run with the test results recorded. For the two power consumption tests, the latter four workloads were run with the test results recorded.
100% Sequential Write (256K block size, 1 thread): This workload is representative of a data logging use case. 100% Random Read (4K block size, 4 threads): This workload is representative of a read cache system.
Random 70% Read / 30% Write (4K block size, 4 threads): This workload is representative of a common mixed read/write ratio used in commercial database systems.
Random 50% Read /50% Write (4K block size, 4 threads): This workload is representative of other common IT use cases such as email.
Blender (block sizes/threads vary): This workload is representative of a mix of many types of sequential and random workloads at various block sizes and thread counts as VMs request storage against the vSAN storage pool.
Test results8
IOPS (Figure 4): The results are in IOPS - the higher result for each is better.
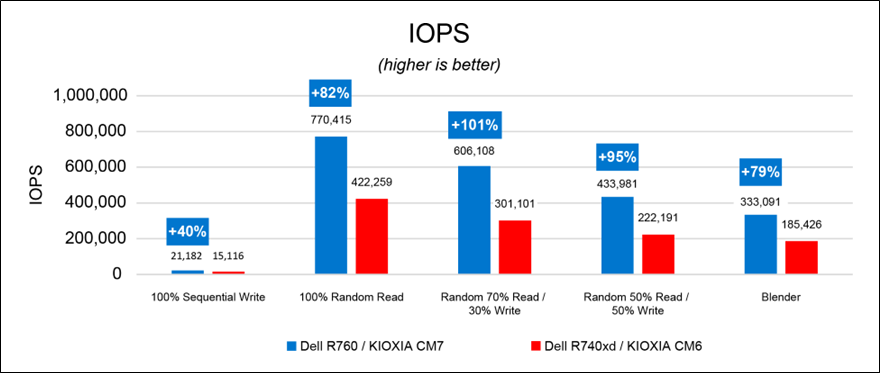
Figure 4: IOPS results
Throughput (Figure 5): The results are in megabytes per second (MB/s) - the higher result for each is better.
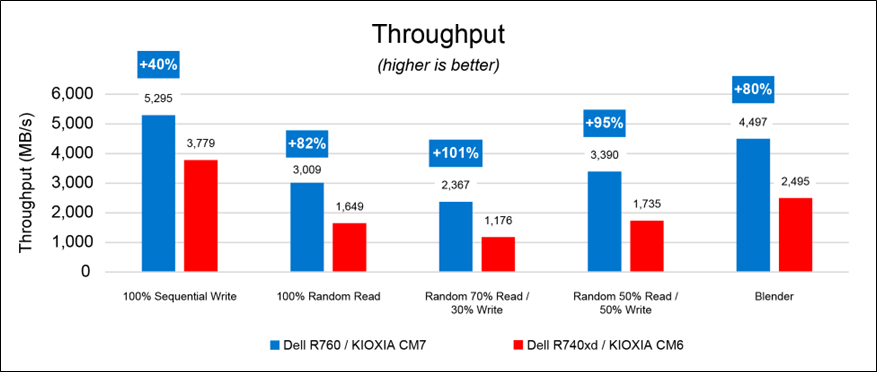
Figure 5: throughput results
Read Latency (Figure 6): The results are in milliseconds (ms) - the lower result for each is better. The 100% sequential write workloads for both configurations were not included for this test as the workload does not include read operations.
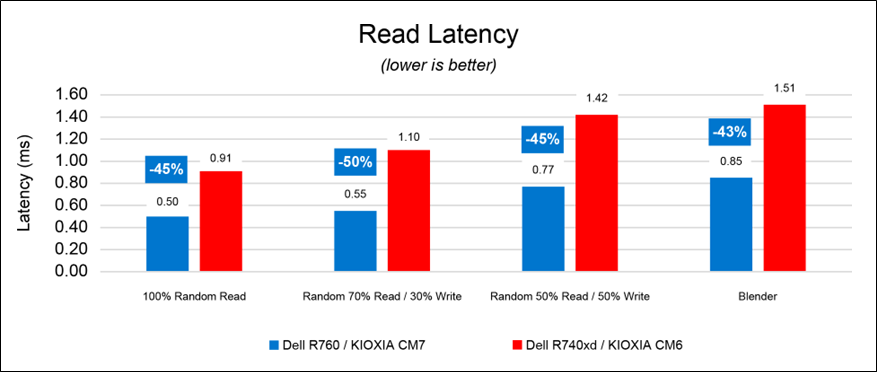
Figure 6: read latency results
Write Latency (Figure 7): The results are in milliseconds - the lower result for each is better. The 100% random read workloads for both PCIe configurations were not included for this test as the workload does not include write operations.
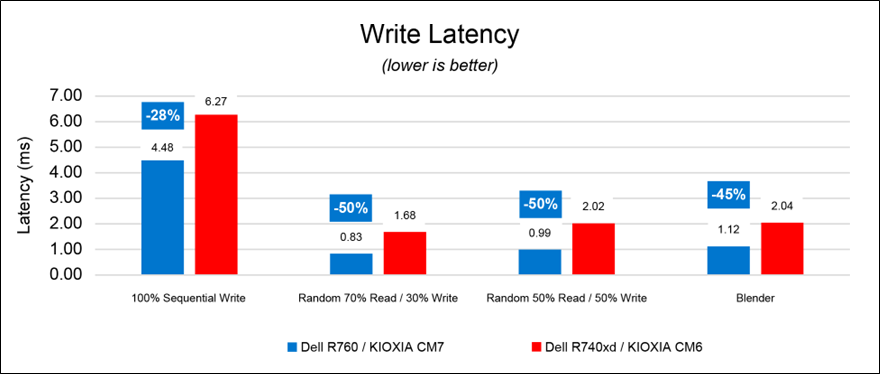
Figure 7: write latency results
IOPS per Watt (Figure 8): The results show the amount of IOPS performed per power consumed by the cluster and are in IOPS per watt (IOPS/W). The higher result for each is better.
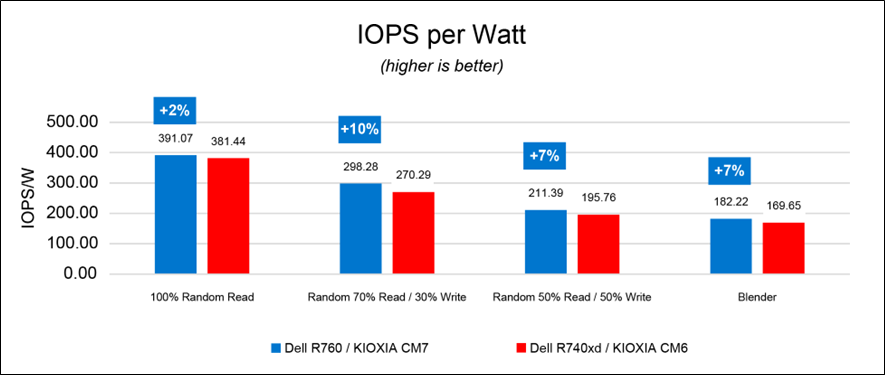
Figure 8: IOPS per watt results
Throughput per Watt (Figure 9): The results show the amount of throughput performed per power consumed by the cluster and are in MB/s per watt (MBps/W). The higher result for each is better.
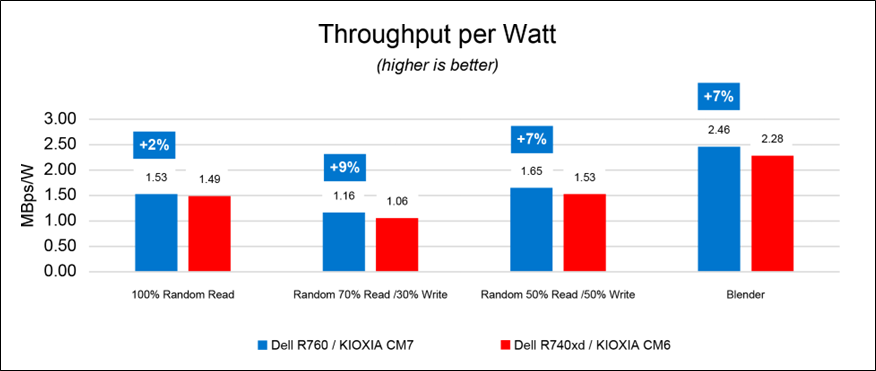
Figure 9: throughput per watt results
Final analysis
The Dell PowerEdge R760 servers equipped with new KIOXIA CM7 Series enterprise NVMe SSDs outperformed the Dell PowerEdge 740xd servers and SSDs in IOPS, throughput and latency. They also delivered higher performance per watt. With the newer generation of Dell PowerEdge servers, there are notable performance increases associated with hyperconverged infrastructures that directly affect server, CPU, memory and storage performance when compared with prior generations.
References
Footnotes
1. The product image shown is a representation of the design model and not an accurate product depiction.
2. The product image shown was provided with permission from KIOXIA America, Inc. and is a representation of the design model and not an accurate product depiction.
3. Drive Write Per Day (DWPD) means the drive can be written and re-written to full capacity once a day, every day for five years, the stated product warranty period. Actual results may vary due to system configuration, usage and other factors. Read and write speed may vary depending on the host device, read and write conditions and file size.
4. Definition of capacity - KIOXIA Corporation defines a megabyte (MB) as 1,000,000 bytes, a gigabyte (GB) as 1,000,000,000 bytes and a terabyte (TB) as 1,000,000,000,000 bytes. A computer operating system, however, reports storage capacity using powers of 2 for the definition of 1Gbit = 230 bits = 1,073,741,824 bits, 1GB = 230 bytes = 1,073,741,824 bytes and 1TB = 240 bytes = 1,099,511,627,776 bytes and therefore shows less storage capacity. Available storage capacity (including examples of various media files) will vary based on file size, formatting, settings, software and operating system, and/or pre-installed software applications, or media content. Actual formatted capacity may vary.
5. The Dell PowerEdge R760 server features a PCIe 4.0 backplane.
6. The Dell PowerEdge R740xd server features a PCIe 3.0 backplane.
7. 2.5-inch indicates the form factor of the SSD and not its physical size.
8. Read and write speed may vary depending on the host device, read and write conditions and file size.
Trademarks
Dell and PowerEdge are registered trademarks or trademarks of Dell Inc.
Intel and Xeon are registered trademarks of Intel Corporation or its subsidiaries in the U.S. and/or other countries NVMe is a registered or unregistered trademark of NVM Express, Inc. in the United States and other countries. PCIe is a registered trademark of PCI-SIG.
VMware, VMware ESXi, VMware vMotion, VMware vSAN, VMware vSAN Express Storage Architecture and VMware vCenter are registered trademarks or trademarks of VMware Inc. in the United States and/or various jurisdictions.
All other company names, product names and service names may be trademarks or registered trademarks of their respective companies.
Disclaimers
© 2023 Dell, Inc. All rights reserved. Information in this tech note, including product specifications, tested content, and assessments are current and believed to be accurate as of the date that the document was published and subject to change without prior notice. Technical and application information contained here is subject to the most recent applicable product specifications.


