


Accelerate Genomics Insights and Discovery with High-Performing, Scalable Architecture from Dell and Intel
Download PDFThu, 01 Feb 2024 18:47:58 -0000
|Read Time: 0 minutes
Related Documents
Powering TigerGraph with Intel® Xeon® Processors on PowerEdge Servers
Tue, 30 Jan 2024 23:56:48 -0000
|Read Time: 0 minutes
TigerGraph Overview
At the top of this webpage are 3 PDF files outlining test results and reference configurations for Dell PowerEdge servers using both the 3rd Generation Intel Xeon processors and 4th Generation Intel Xeon processors. All testing was conducted in Dell Labs by Intel and Dell Engineers in May and June of 2023.
- TigerGraph DfD ICX – highlights the recommended configurations for Dell PowerEdge servers using 3rd Generation Intel Xeon processors.
- TigerGraph DfD SPR – highlights the recommended configurations for Dell PowerEdge servers using 4th Generation Intel Xeon processors.
- DfD – PowerEdge TigerGraph Test Report – Highlights the results of performance testing on both configurations with comparisons that demonstrate the performance difference between the two platforms.
Solution Overview
TigerGraph was founded in 2012 by programmer Dr. Yu Xu under the name GraphSQL
According to Gartner, by 2025, graph technologies will be used in 80% of data and analytics innovations, up from 10% in 2021. This projection aligns with the explosive growth of TigerGraph’s global customer base, which has increased by more than 100% in the past twelve months as more organizations use graphs to drive better business outcomes.
A graph database is designed to facilitate analysis of relationships in data. A graph database stores data as entities and the relationships between those entities. It is composed of two things: vertices and edges. Vertices represent entities such as a person, product, location, payment, order and so on; edges represent the relationship between these entities, for example, this person initiated this payment to purchase this product with this order. Graph analytics explores these connections in data and reveals insights about the connected data. These capabilities enable applications such as customer 360, cyber threat mitigation, digital twins, entity resolution, fraud detection, supply chain optimization, and much more.
TigerGraph is the only scalable graph database for the enterprise. TigerGraph’s innovative architecture allows siloed data sets to be connected for deeper and wider analysis at scale. Additionally, TigerGraph supports real-time in-place updates for operational analytics use cases.
Below is an outline of the TigerGraph architecture.

As you should note, a TigerGraph instance is designed to process massive pools of data and utilizes a large number of processes to do so. Choosing the correct hardware is critical to a successful deployment.
Reference Deployments
- Four top-tier banks use TigerGraph to improve fraud detection rates by 20% or more.
- Over 300 million consumers receive personalized offers with recommendation engines powered by TigerGraph.
- More than 50 million patients receive care path recommendations to assist them on their wellness journey.
- One billion people depend on the energy infrastructure optimized by TigerGraph to reduce power outages.TigerGraph is a native parallel graph database purpose-built for analyzing massive amounts of data (terabytes).
TigerGraph helps make graph technology more accessible. TigerGraph DB is democratizing the adoption of advanced analytics with Intel’s 4th Generation Intel Xeon Scalable Processors by enabling non-technical users to accomplish as much with graphs as the experts do.
TigerGraph with Dell PowerEdge and Intel processor benefits
The introduction of new server technologies allows customers to deploy solutions using the newly introduced functionality, but it can also provide an opportunity for them to review their current infrastructure and determine if the new technology might increase performance and efficiency. Dell and Intel recently conducted TigerGraph performance testing on the new Dell PowerEdge R760 with 4th Generation Intel Xeon Scalable processors and compared the results to the same solution running on the previous generation R750 with 3rd generation Intel Xeon Scalable processors to determine if customers could benefit from a transition.
Dell PowerEdge R660 and R760 servers with 4th generation Intel Xeon Scalable processors deliver a fast, scalable, portable and cost-effective solution to implement and operationalize deep analysis of large pools of data.
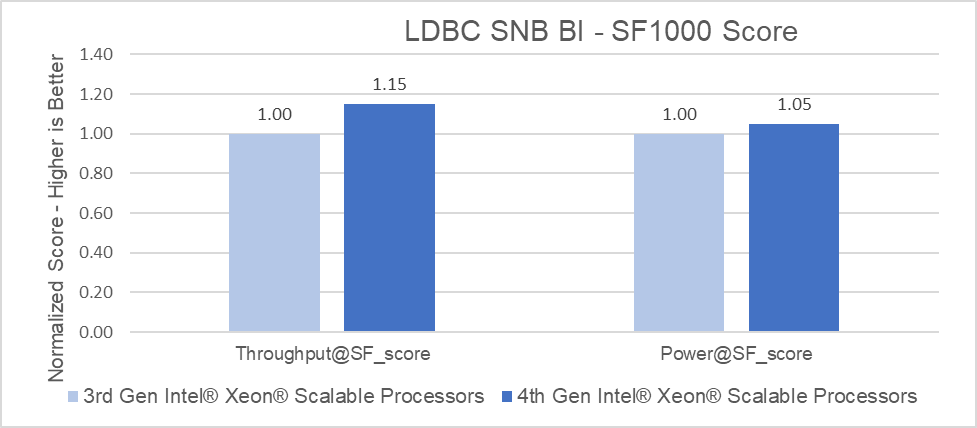
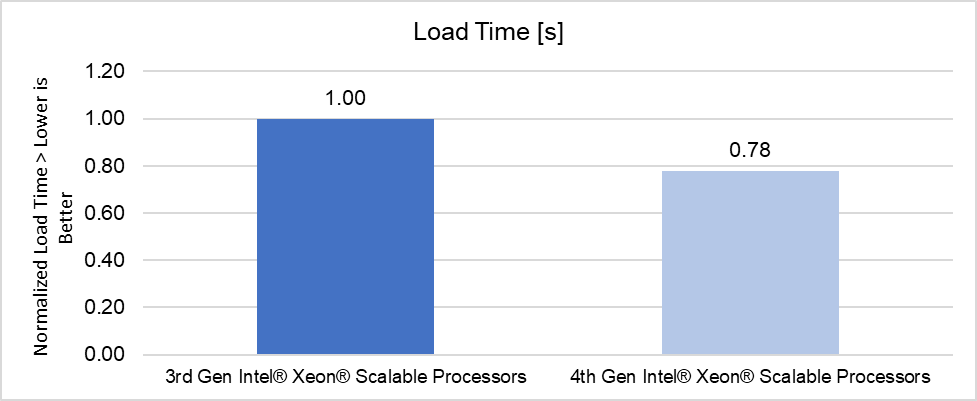
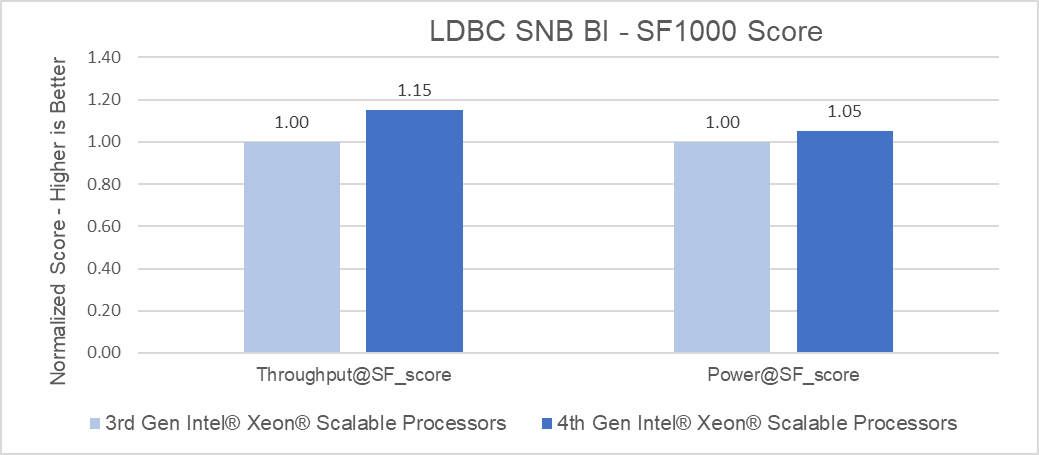
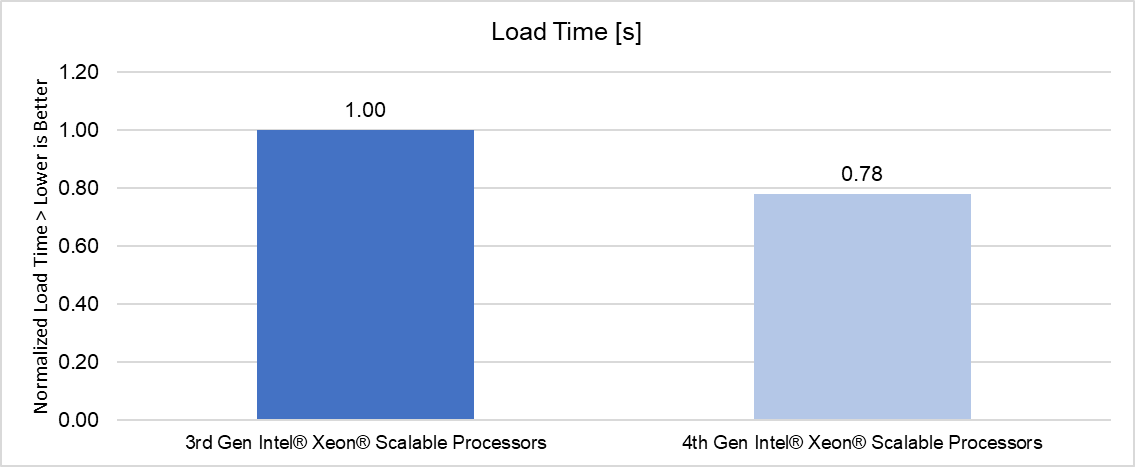
Raw performance: As noted in the report, PowerEdge servers with 4th Generation Intel Xeon Platinum processors delivered up to 1.15x better throughput than 3rd Generation Intel Xeon Platinum processors and were able to load the data set up to 1.27x faster (for TigerGraph in the LDBC SNB BI benchmark).
Benchmark score
Load time
Conclusion
Choosing the right combination of Server and Processor can increase performance and reduce latency. As this testing demonstrated, the Dell PowerEdge R760 with 4th Generation Intel Xeon Platinum 8468 CPUs delivered up to a 15% performance improvement for business intelligence queries than the Dell PowerEdge R750 with 3rd Generation Intel Xeon Platinum 8380 CPUs, and were able to load the data set up to 27% faster.

PowerEdge R760 with 4th Generation Intel® Xeon® Processors TigerGraph Test Report
Tue, 30 Jan 2024 23:55:41 -0000
|Read Time: 0 minutes
Summary
Introducing new server technologies allows customers to deploy solutions that use the newly introduced functionality. It can also provide an opportunity for them to review their current infrastructure and determine whether the new technology can increase performance and efficiency. With this in mind, Dell Technologies and Intel recently conducted testing with TigerGraph on the new Dell PowerEdge R760 with 4th Generation Intel Xeon Scalable processors. We compared the results to the same solution running on the previous generation R750 with 3rd Generation Intel Xeon Scalable processors to determine whether customers could benefit from a transition.
All testing was conducted in Dell Labs by Intel and Dell engineers in April 2023.
Solution overview
TigerGraph was founded in 2012, by programmer Dr. Yu Xu, under the name GraphSQL[i]
According to Gartner, by 2025, graph technologies will be used in 80% of data and analytics innovations, up from 10% in 2021. This projection aligns with the explosive growth of TigerGraph’s global customer base, which has increased by more than 100% in the past twelve months as more organizations use graphs to drive better business outcomes.[ii]
A graph database is designed to facilitate analysis of relationships in data. A graph database stores data as entities and the relationships between those entities. It is composed of two things: vertices and edges. Vertices represent entities such as a person, product, location, payment, order, and so on; edges represent the relationship between these entities, for example, this person initiated this payment to purchase this product with this order. Graph analytics explores these connections in data and reveals insights about the connected data. These capabilities enable applications such as customer 360, cyber threat mitigation, digital twins, entity resolution, fraud detection, supply chain optimization, and much more.
TigerGraph is the only scalable graph database for the enterprise. TigerGraph’s innovative architecture allows siloed data sets to be connected for deeper and wider analysis at scale. Additionally, TigerGraph supports real-time in-place updates for operational analytics use cases.[iii]
- Four top-tier banks use TigerGraph to improve fraud detection rates by 20% or more.
- Over 300 million consumers receive personalized offers with recommendation engines powered by TigerGraph.
- More than 50 million patients receive care path recommendations to assist them on their wellness journey.
- One billion people depend on the energy infrastructure optimized by TigerGraph to reduce power outages.TigerGraph is a native parallel graph database purpose-built for analyzing massive amounts of data (terabytes).[iv]
TigerGraph helps make graph technology more accessible. TigerGraph DB is democratizing the adoption of advanced analytics with Intel’s 4th Generation Intel Xeon Scalable Processors by enabling non-technical users to accomplish as much with graphs as the experts do.[v]
Here is an outline of the TigerGraph architecture:
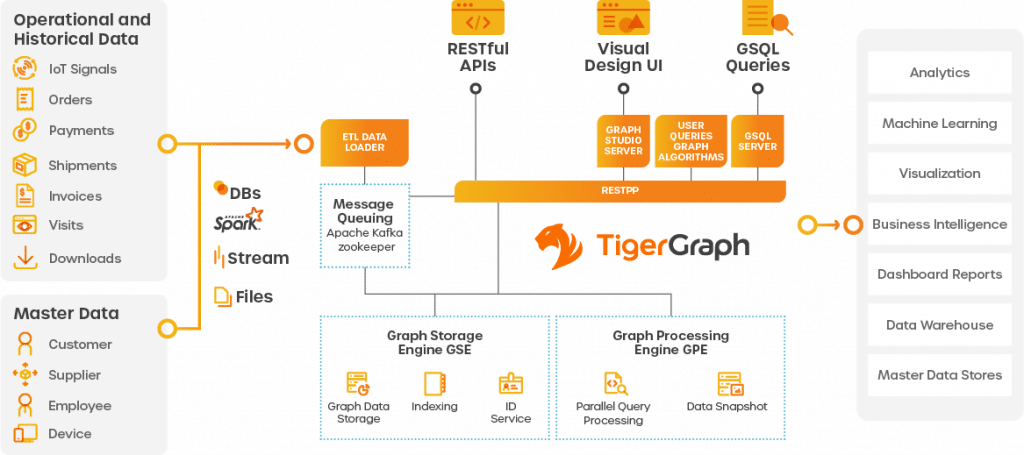
Because a TigerGraph instance is designed to process massive pools of data and uses a large number of processes to do so, choosing the correct hardware is critical to a successful deployment.
Dell PowerEdge R660 and R760 servers with 4th generation Intel Xeon Scalable processors deliver a fast, scalable, portable, and cost-effective solution to implement and operationalize deep analysis of large pools of data.
Workload description
To test the performance of TigerGraph, we chose the Linked Data Benchmark Council SNB BI benchmark.
The Linked Data Benchmark Council (LDBC) is a non-profit organization that helps to define standard graph benchmarks to foster a community around graph processing technologies. LDBC consists of members from both industry and academia, including organizations (such as Intel) and individuals.
The Social Network Benchmark (SNB) suite defines graph workloads that target database management systems. One of these is the Business Intelligence (BI) workload, which focuses on aggregation- and join-heavy complex queries that touch a large portion of the graph with microbatches of insert/delete operations. The SNB BI specification standardizes the dataset schema, data generation technique, size, and graph queries to be performed.
The SNB BI dataset represents a social network database (with Forums, Posts, Comments, and so on). In addition to analytics queries, it defines daily batches of updates to simulate changes in the social network over time (adding/removing posts, comments, users, and so on).
The reference implementation of the benchmark is responsible for loading the data into the database, scheduling the queries, collecting the metrics, and producing scoring results.
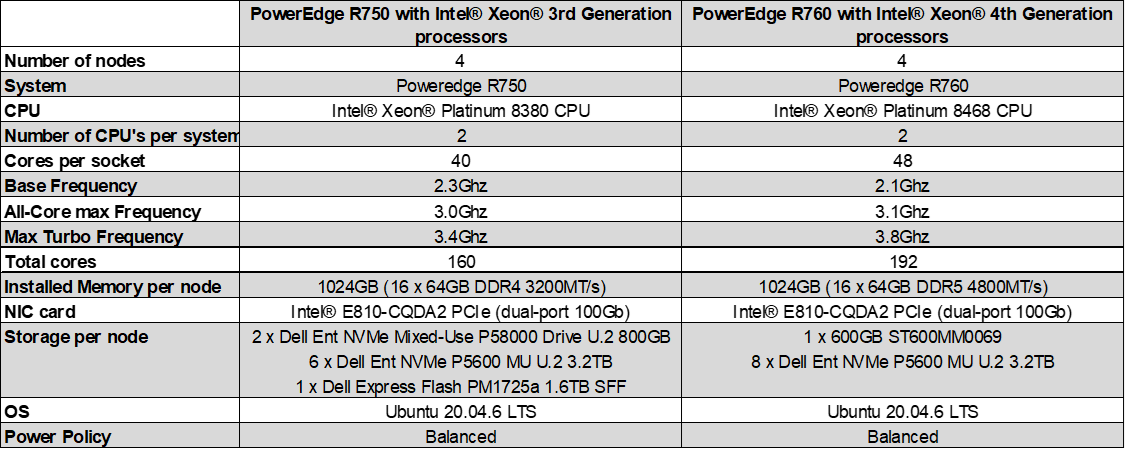
Configurations tested

Results
The following graphs highlight the relative performance differences between the two architectures.
Benchmark Score
Load Time
*Performance varies by use, configuration, and other factors. For the configuration details of this test, see the following section.
Test configuration details
- 3rd Gen Intel Xeon Scalable Processors (baseline): Test by Intel as of 04/28/23. 1-node, 2x Intel Xeon Platinum 8380 CPU @ 2.30GHz, 40 cores, HT On, Turbo On, Total Memory 1024GB (16x64GB DDR4 3200 MT/s [3200 MT/s]), BIOS 1.9.2, microcode 0xd000389, 2x NetXtreme BCM5720 2-port Gigabit Ethernet PCIe, 2x Ethernet Controller E810-C for QSFP, 2x 745.2G Dell Ent NVMe P5800x WI U.2 800GB, 6x 2.9T Dell Ent NVMe P5600 MU U.2 3.2TB, 1x 1.5T Dell Express Flash PM1725a 1.6TB SFF, Ubuntu 20.04.6 LTS, 5.15.0-71-generic, LDBC SNB BI v., TigerGraph 3.7
- 4th Gen Intel Xeon Scalable Processors: Test by Intel as of 04/28/23. 1-node, 2x Intel Xeon Platinum 8468, 48 cores, HT On, Turbo On, Total Memory 1024GB (16x64GB DDR5 4800 MT/s [4800 MT/s]), BIOS 1.0.1, microcode 0x2b000181, 2x NetXtreme BCM5720 2-port Gigabit Ethernet PCIe, 2x Ethernet Controller E810-C for QSFP, 1x 558.9G ST600MM0069, 8x 2.9T Dell Ent NVMe P5600 MU U.2 3.2TB, Ubuntu 20.04.6 LTS, 5.15.0-71-generic, LDBC SNB BI v., TigerGraph 3.7
Key takeaways
PowerEdge servers with 4th Generation Intel Xeon Platinum processors delivered up to 1.15x better throughput than 3rd Generation Intel Xeon Platinum processors and were able to load the data set up to 1.27x faster (for TigerGraph in the LDBC SNB BI benchmark).
Conclusion
Choosing the right combination of server and processor can increase performance and reduce latency. As this testing demonstrated, the Dell PowerEdge R760 with 4th Generation Intel Xeon Platinum 8468 CPUs delivered up to a 15% performance improvement for business intelligence queries than the Dell PowerEdge R750 with 3rd Generation Intel Xeon Platinum 8380 CPUs, and were able to load the data set up to 27% faster simply by upgrading the platform to Intel 4th Gen Xeon Gold Scalable processors.
[ii] https://www.tigergraph.com/press-article/tigergraph-recognized-for-the-first-time-in-the-2022-gartner-magic-quadrant-for-cloud-database-management-systems-2/