
Assets

HPC Application Performance on Dell PowerEdge C6620 with INTEL 8480+ SPR
Thu, 09 Nov 2023 15:46:41 -0000
|Read Time: 0 minutes
Overview
With a robust HPC and AI Innovation Lab at the helm, Dell continues to ensure that PowerEdge servers are cutting-edge pioneers in the ever-evolving world of HPC. The latest stride in this journey comes in the form of the Intel Sapphire Rapids processor, a powerhouse of computational prowess. When combined with the cutting-edge infrastructure of the Dell PowerEdge 16th generation servers, a new era of performance and efficiency dawns upon the HPC landscape. This blog post provides comprehensive benchmark assessments spanning various verticals within high-performance computing.
It is Dell Technologies’ goal to help accelerate time to value for customers, as well as leverage benchmark performance and scaling studies to help plan out their environments. By using Dell’s solutions, customers spend less time testing different combinations of CPU, memory, and interconnect, or choosing the CPU with the sweet spot for performance. Additionally, customers do not have to spend time deciding which BIOS features to tweak for best performance and scaling. Dell wants to accelerate the set-up, deployment, and tuning of HPC clusters to enable customers real value while running their applications and solving complex problems (such as weather modeling).
Testbed Configuration
This study conducted benchmarking on high-performance computing applications using Dell PowerEdge 16th generation servers featuring Intel Sapphire Rapids processors.
Benchmark Hardware and Software Configuration
Table 1. Test bed system configuration used for this benchmark study
Platform | Dell PowerEdge C6620 |
Processor | Intel Sapphire Rapids 8480+ |
Cores/Socket | 56 (112 total) |
Base Frequency | 2.0 GHz |
Max Turbo Frequency | 3.80 GHz |
TDP | 350 W |
L3 Cache | 105 MB |
Memory | 512 GB | DDR5 4800 MT/s |
Interconnect | NVIDIA Mellanox ConnectX-7 NDR 200 |
Operating System | Red Hat Enterprise Linux 8.6 |
Linux Kernel | 4.18.0-372.32.1 |
BIOS | 1.0.1 |
OFED | 5.6.2.0.9 |
System Profile | Performance Optimized |
Compiler | Intel OneAPI 2023.0.0 | Compiler 2023.0.0 |
MPI | Intel MPI 2021.8.0 |
Turbo Boost | ON |
Interconnect | Mellanox NDR 200 |
Application | Vertical Domain | Benchmark Datasets |
OpenFOAM | Manufacturing - Computational Fluid Dynamics (CFD) | Motorbike 50 M 34 M and 20 M cell mesh |
Weather Research and Forecasting (WRF) | Weather and Environment | |
Large-scale Atomic/Molecular Massively Parallel Simulator (LAMMPS) | Molecular Dynamics | Rhodo, EAM, Stilliger Weber, tersoff, HECBIOSIM, and Airebo |
GROMACS | Life Sciences – Molecular Dynamics | HECBioSim Benchmarks – 3M Atoms, Water, and Prace LignoCellulose |
CP2K | Life Sciences | H2O-DFT-LS-NREP- 4, 6 H2O-64-RI-MP 2 |
Performance Scalability for HPC Application Domain
Vertical – Manufacturing | Application - OPENFOAM
OpenFOAM is an open-source computational fluid dynamics (CFD) software package renowned for its versatility in simulating fluid flows, turbulence, and heat transfer. It offers a robust framework for engineers and scientists to model complex fluid dynamics problems and conduct simulations with customizable features. This study worked on OpenFOAM version 9, which have been compiled with Intel ONE API 2023.0.0 and Intel MPI 2021.8.0 compilers. For successful compilation and optimization with the Intel compilers, additional flags such as '-O3 -xSAPPHIRERAPIDS -m64 -fPIC' have been added.
The tutorial case under the simpleFoam solver category, motorbike, were used for evaluating the performance of the OpenFOAM package on intel 8480+ processors. Three different types of grids were generated such as 20 M, 34 M, and 50 M cells using the blockMesh and snappyHexMesh utilities of OpenFOAM. Each run was conducted with full cores (112 cores per node) and from a single node to sixteen nodes, while scalability tests were done for all three sets of grids. The steady state simpleFoam solver execution time was noted as performance numbers.
The figure below shows the application performance for all the datasets:
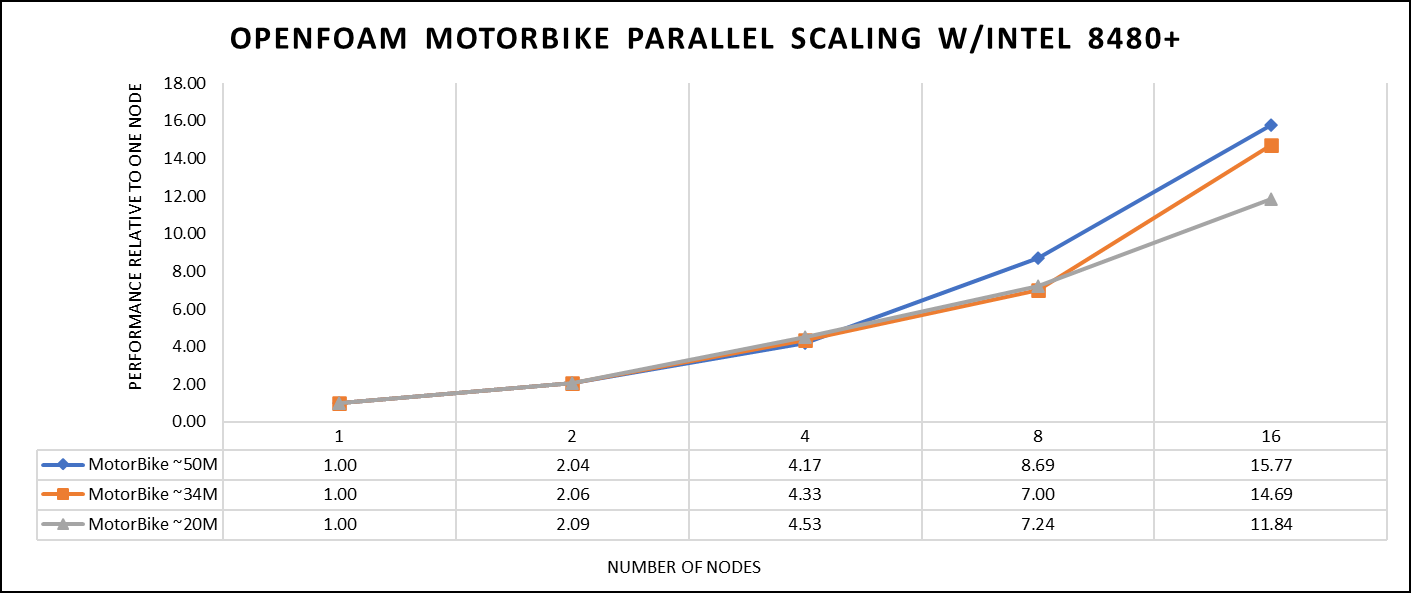
Figure 1. The scaling performance of the OpenFOAM Motorbike dataset using the Intel 8480+ processor, with a focus on performance compared to a single node.
The results are non-dimensionalized with single node result, with the scalability depicted in Figure 1. The Intel-compiled binaries of OpenFOAM shows linear scaling from a single node to sixteen nodes on 8480+ processors for higher dataset (50 M). For other datasets with 20 M and 34 M cells, the linear scaling was shown up to eight nodes and from eight nodes to sixteen nodes the scalability was reduced.
Achieving satisfactory results with smaller datasets can be accomplished using fewer processors and nodes. Nonetheless, augmenting the node count; therefore, the processor count, in relation to the solver's computation time, leads to increased inter-processor communication, later extending the overall runtime. Consequently, higher node counts prove more beneficial when handling larger datasets within OpenFOAM simulations.
Vertical – Weather and Environment | Application - WRF
The Weather Research and Forecasting model (WRF) is at the forefront of meteorological and atmospheric research, with its latest version being a testament to advancements in high-performance computing (HPC). WRF enables scientists and meteorologists to simulate and forecast complex weather patterns with unparalleled precision. This study involved working on WRF version 4.5, which have been compiled with Intel ONEAPI 2023.0.0 and Intel MPI 2021.8.0 compilers. For successful compilation and optimization with the Intel compilers, additional flags such as ' -O3 qopt-zmm-usage=high –xSAPPHIRERAPIDS -fpic’ were used.
The dataset used in this study is CONUS v4.4, meaning the model's grid, parameters, and input data are set up to focus on weather conditions within the continental United States. This configuration is particularly useful for researchers, meteorologists, and government agencies who need high-resolution weather forecasts and simulations tailored to this specific geographic area. The configuration details, such as grid resolution, atmospheric physics schemes, and input data sources, can vary depending on the specific version of WRF and the goals of the modeling project. This study predominantly adhered to the default input configuration, making minimal alterations or adjustments to the source code or input file. Each run was conducted with full cores (112 cores per node). The scalability tests were done from a single node to sixteen nodes, and the performance metric in “sec” was noted.
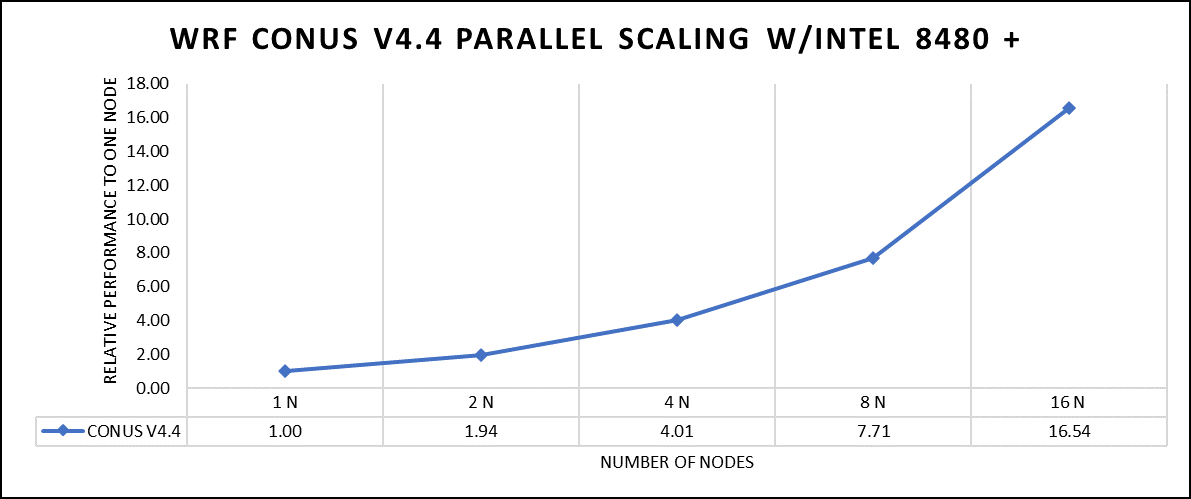
Figure 2. The scaling performance of the WRF CONUS dataset using the Intel 8480+ processor, with a focus on performance compared to a single node.
The INTEL compiled binaries of WRF show linear scaling from a single node to sixteen nodes on 8480+ processors for the new CONUS v4.4. For the best performance with WRF, the impact of the tile size, process, and threads per process should be carefully considered. Given that the memory and DRAM bandwidth constrain the application, the team opted for the latest DDR5 4800 MT/s DRAM for test evaluations. Additionally, it is crucial to consider the BIOS settings, particularly SubNUMA configurations, as these settings can significantly influence the performance of memory-bound applications, potentially leading to improvements ranging from one to five percent.
For more detailed BIOS tuning recommendations, see the previous blog post on optimizing BIOS settings for optimal performance.
Vertical – Molecular Dynamics | Application – LAMMPS
LAMMPS, which stands for Large-scale Atomic/Molecular Massively Parallel Simulator, is a powerful tool for HPC. It is specifically designed to harness the immense computational capabilities of HPC clusters and supercomputers. LAMMPS allows researchers and scientists to conduct large-scale molecular dynamics simulations with remarkable efficiency and scalability. This study worked on LAMMPS, the 15 June 2023 version, which have been compiled with Intel ONEAPI 2023.0.0 and Intel MPI 2021.8.0 compilers. For successful compilation and optimization with the Intel compilers, additional flags such as “ -O3 qopt-zmm-usage=high –xSAPPHIRERAPIDS -fpic,” were used.
The team opted for the default INTEL package, which offers optimized atom pair styles for vector instructions on Intel processors. The team also tried running some benchmarks which are not supported with the INTEL package to check the performance and scaling. The performance metric for this benchmark is nanoseconds per day where higher is considered better.
There are two factors that were considered when compiling data for comparison: the number of nodes and the core count. Below are the results of performance improvement observed on processor 8480+ with 112 cores:
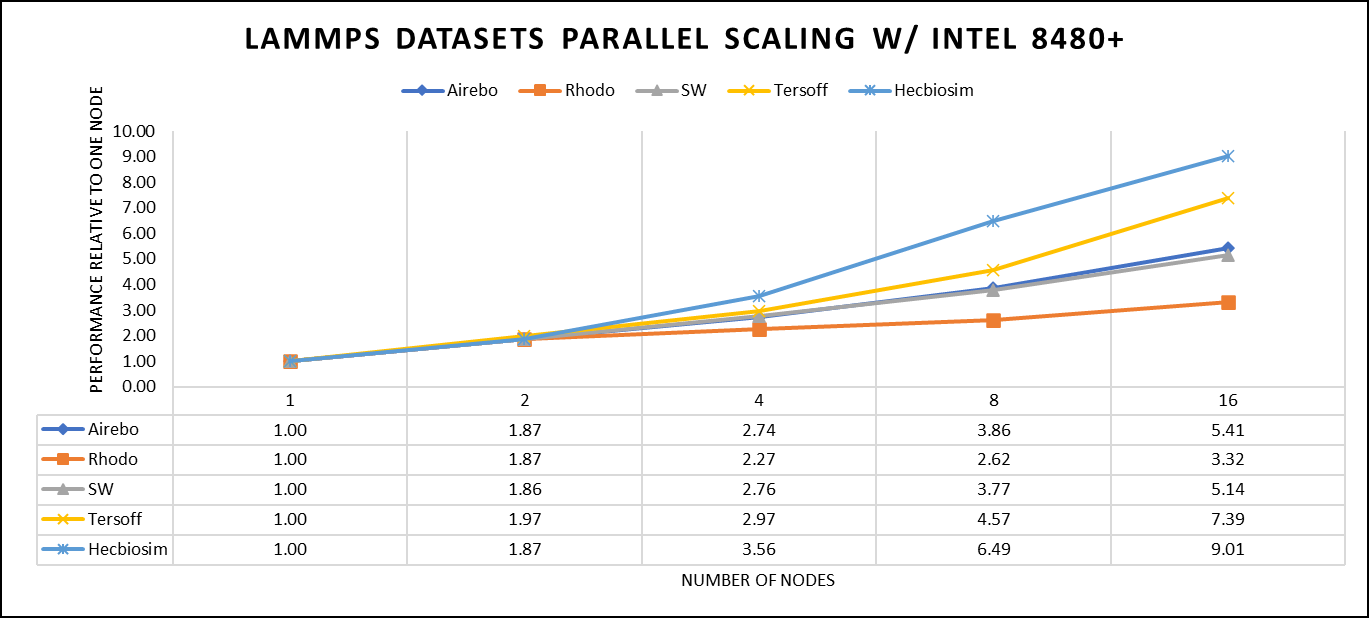
Figure 3. The scaling performance of the LAMMPS datasets using the Intel 8480+ processor, with a focus on performance compared to a single node.
Figure 3 shows the scaling of different LAMMPS datasets. Noticeable enhancement in scalability is evident with the increment in atom size and step size. The examination involved two datasets, EAM and Hecbiosim, each containing over 3 million atoms. The results indicated better scalability when compared to the other datasets analyzed.
Vertical – Molecular Dynamics | Application - GROMACS
GROMACS, a high-performance molecular dynamics software, is a vital tool for HPC environments. Tailored for HPC clusters and supercomputers, GROMACS specializes in simulating the intricate movements and interactions of atoms and molecules. Researchers in diverse fields, including biochemistry and biophysics, rely on its efficiency and scalability to explore complex molecular processes. GROMACS is used for its ability to harness the immense computational power of HPC, allowing scientists to conduct intricate simulations that reveal critical insights into atomicatomic-level behaviours, from biomolecules to chemical reactions and materials. This study worked on GROMACS 2023.1 version, which has been compiled with Intel ONEAPI 2023.0.0 and Intel MPI 2021.8.0 compilers. For successful compilation and optimization with the Intel compilers, additional flags such as “ -O3 qopt-zmm-usage=high –xSAPPHIRERAPIDS -fpic,” were used.
The team curated a range of datasets for the benchmarking assessments. First, the team included "water GMX_50 1536" and "water GMX_50 3072," which represent simulations involving water molecules. These simulations are pivotal for gaining insights into solvation, diffusion, and the water's behavior in diverse conditions. Next, the team incorporated "HECBIOSIM 14 K" and "HECBIOSIM 30 K" datasets, which were specifically chosen for their ability to investigate intricate systems and larger biomolecular structures. Lastly, the team included the "PRACE Lignocellulose" dataset, which aligns with the benchmarking objectives, particularly in the context of lignocellulose research. These datasets collectively offer a diverse array of scenarios for the benchmarking assessments.
The performance assessment was based on the measurement of nanoseconds per day (ns/day) for each dataset, providing valuable insights into the computational efficiency. Additionally, the team paid careful attention to optimizing the mdrun tuning parameters (i.e, ntomp, dlb tunepme nsteps, etc )in every test run to ensure accurate and reliable results. The team examined the scalability by conducting tests spanning from a single node to sixteen nodes.
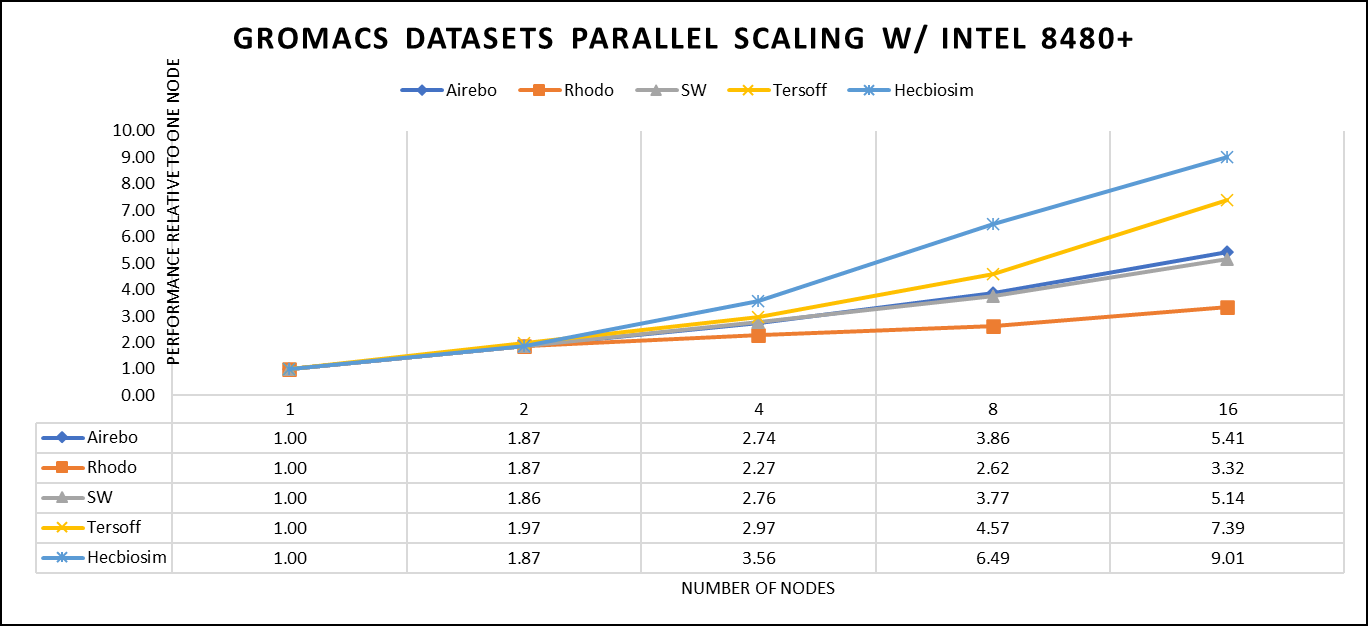
Figure 4. The scaling performance of the GROMACS datasets using the Intel 8480+ processor, with a focus on performance compared to a single node.
For ease of comparison across the various datasets, the relative performance has been included into a single graph. However, each dataset behaves individually when performance is considered, as each uses different molecular topology input files (tpr), and configuration files.
The team achieved the expected linear performance scalability for GROMACS of up to eight nodes All cores in each server were used while running these benchmarks. The performance increases are close to linear across all the dataset types; however, there is a drop in the larger number of nodes due to the smaller dataset size and the simulation iterations.
Vertical – Molecular Dynamics | Application – CP2K
CP2K is a versatile computational software package that covers a wide range of quantum chemistry and solid-state physics simulations, including molecular dynamics. It is not strictly limited to molecular dynamics but is instead a comprehensive tool for various computational chemistry and materials science tasks. While CP2K is widely used for molecular dynamics simulations, it can also perform tasks like electronic structure calculations, ab initio molecular dynamics, hybrid quantum mechanics/molecular mechanics (QM/MM) simulations, and more.
This study worked on the CP2K 2023.1 version, which has been compiled with Intel ONEAPI 2023.0.0 and Intel MPI 2021.8.0 compilers. For successful compilation and optimization with the Intel compilers, additional flags such as “ -O3 qopt-zmm-usage=high –xSAPPHIRERAPIDS -fpic,” were used.
Focusing on high-performance computing (HPC), the team used specific datasets optimized for computational efficiency. The first dataset, "H2O-DFT-LS-NREP-4,6," was configured for HPC simulations and calculations, emphasizing the modeling of water (H2O) using Density Functional Theory (DFT). The appended "NREP-4,6" parameter settings were fine-tuned to ensure efficient HPC performance. The second dataset, "H2O-64-RI-MP2," was exclusively crafted for HPC applications and revolved around the examination of a system consisting of 64 water molecules (H2O). By employing the Resolution of Identity (RI) method with the Møller–Plesset perturbation theory of second order (MP2), this dataset demonstrated the significant computational capabilities of HPC for conducting advanced electronic structure calculations within a high-molecule-count environment. The team examined the scalability by conducting tests spanning from a single node to sixteen nodes.
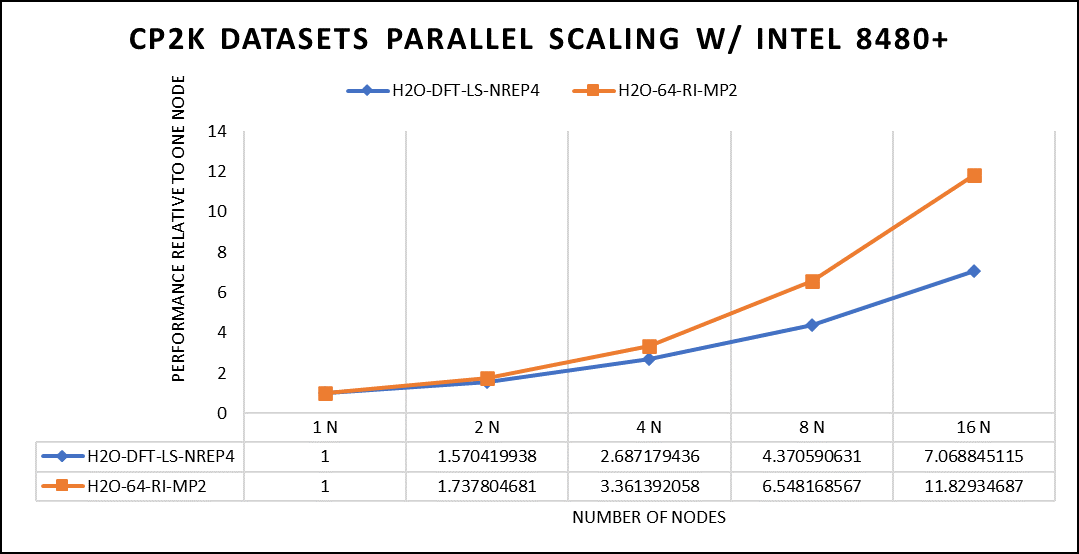
Figure 5. The scaling performance of the CP2K datasets using the Intel 8480+ processor, with a focus on performance compared to a single node.
The datasets represent a single-point energy calculation employing linear-scaling Density Functional Theory (DFT). The system consists of 6144 atoms confined within a 39 Å^3 simulation box, which translates to 2048 water molecules. To adjust the computational workload, you can modify the NREP parameter within the input file.
Performing with NREP6 necessitates more than 512 GB of memory on a single node. Failing to meet this requirement will result in a segmentation fault error. These benchmarking efforts encompass configurations involving up to 16 computational nodes. Optimal performance is achieved when using NREP4 and NREP6 in Hybrid mode, which combines Message Passing Interface (MPI) and Open Multi-Processing (OpenMP). This configuration exhibits the best scaling performance, particularly on four to eight nodes. However, it is worth noting that scaling beyond eight nodes does not exhibit a strictly linear performance improvement. Figure 5 depicts the outcomes when using Pure MPI, using 112 cores with a single thread per core.
Conclusion
With equivalent core counts, the prior generation of Intel Xeon processors can match the performance of the Sapphire Rapids counterpart. However, achieving this level of performance necessitates doubling the number of nodes. Therefore, a single 350W node equipped with the 8480+ processor can deliver comparable performance when compared to using two 500W nodes with the 8358 processor. In addition to optimizing the BIOS settings as outlined in our INTEL-focused blog, the team advises disabling Hyper-threading specifically for the benchmarks discussed in this article. However, for different types of workloads, the team recommends conducting thorough testing and enabling Hyper-threading if it proves beneficial. Furthermore, for this performance study, the team highly recommends using the Mellanox NDR 200 interconnect.

HPC Application Performance on Dell PowerEdge R6625 with AMD EPYC- GENOA
Wed, 08 Nov 2023 21:09:35 -0000
|Read Time: 0 minutes
The AMD EPYC 9354 Processor, when integrated into the Dell R6625 server, offers a formidable solution for high-performance computing (HPC) applications. Genoa, which is built on the Zen 4 architecture, delivers exceptional processing power and efficiency, making it a compelling choice for demanding HPC workloads. When paired with the PowerEdge R6625's robust infrastructure and scalability features, this CPU enhances server performance, enabling efficient and reliable execution of HPC applications. These features make it an ideal choice for HPC application studies and research.
At Dell Technologies, it’s our goal to help accelerate time to value for our customers. Dell wants to help customers leverage our benchmark performance and scaling studies to help plan out their environments. By utilizing our expertise, customers don’t have to spend time testing different combinations of CPU, memory and interconnect or choosing the CPU with the sweet spot for performance. This also saves time, as customers don’t have to spend time deciding which BIOS features to tweak for best performance and scaling. Dell wants to accelerate the set-up, deployment, and tuning of HPC clusters to enable customers to get the real value- running their applications and solving complex problems like manufacturing better products for their customers.
Testbed configuration
Benchmarking for high-performance computing applications was carried out using Dell PowerEdge 16G servers equipped with AMD EPYC 9354 32-Core Processor.
Table 1. Test bed system configuration used for this benchmark study
Platform | Dell PowerEdge R6625 |
Processor | AMD EPYC 9354 32-Core Processor |
Cores/Socket | 32 (64 total) |
Base Frequency | 3.25 GHz |
Max Turbo Frequency | 3.75 GHz |
TDP | 280 W |
L3 Cache | 256 MB |
Memory | 768 GB | DDR5 4800 MT/s |
Interconnect | NVIDIA Mellanox ConnectX-7 NDR 200 |
Operating System | RHEL 8.6 |
Linux Kernel | 4.18.0-372.32.1 |
BIOS | 1.0.1 |
OFED | 5.6.2.0.9 |
System Profile | Performance Optimized |
Compiler | AOCC 4.0.0 |
MPI | OpenMPI 4.1.4 |
Turbo Boost | ON |
Interconnect | Mellanox NDR 200 |
Application | Vertical Domain | Benchmark Datasets |
OpenFOAM | Manufacturing - Computational Fluid Dynamics (CFD) | Motorbike 50M 34M and 20M cell mesh |
Weather Research and Forecasting (WRF) | Weather and Environment |
|
Large-scale Atomic/Molecular Massively Parallel Simulator (LAMMPS) | Molecular Dynamics | Rhodo, EAM, Stilliger Weber, tersoff, HECBIOSIM, and Airebo |
GROMACS | Life Sciences – Molecular Dynamics | HECBioSim Benchmarks – 3M Atoms , Water and Prace LignoCellulose |
CP2K | Life Sciences | H2O-DFT-LS-NREP- 4,6 H2O-64-RI-MP 2 |
Performance Scalability for HPC Application Domain
Vertical – Manufacturing | Application - OPENFOAM
OpenFOAM is an open-source computational fluid dynamics (CFD) software package renowned for its versatility in simulating fluid flows, turbulence, and heat transfer. It offers a robust framework for engineers and scientists to model complex fluid dynamics problems and conduct simulations with customizable features. In this study, worked on OpenFOAM version 9, which have been compiled with gcc 11.2.0 with OPENMPI 4.1.5. For successful compilation and optimization on the AMD EPYC processors, additional flags such as ' -O3 -znver4' have been added.
The tutorial case under the simpleFoam solver category, motorBike, has been used to evaluate the performance of OpenFOAM package on AMD EPYC 9354 processors. Three different types of grids were generated such as 20M, 34M, and 50M cells using the blockMesh and snappyHexMesh utilities of OpenFOAM. Each run was conducted with full cores (64 cores per node) and from single node to sixteen nodes, The scalability tests were done for all the three sets of grids. The steady state simpleFoam solver execution time was noted down as performance numbers. The figure below shows the application performance for all the datasets.
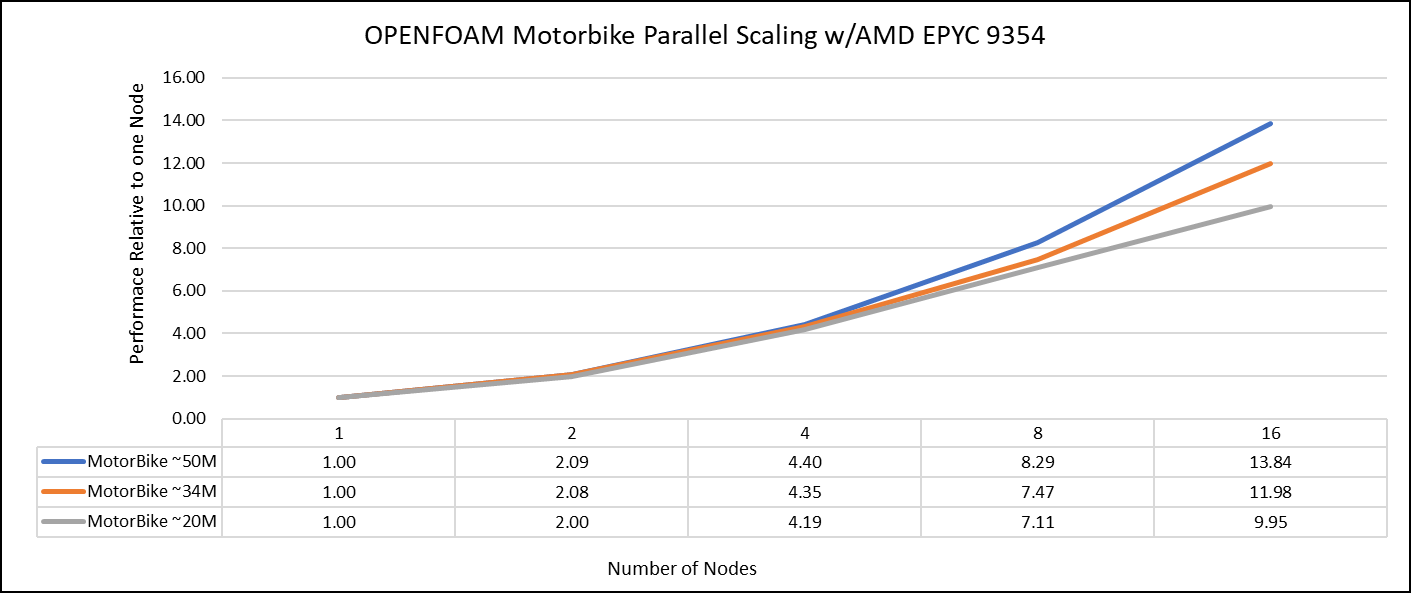
Figure 1: The scaling performance of the OpenFOAM Motorbike dataset using the AMD EPYC Processor, with a focus on performance compared to a single node.
The results are non-dimensionalized with single node result. The scalability is depicted in Figure 1. The OpenFOAM application shows linear scaling from a single node to eight nodes on 9354 processors for higher dataset (50M). For other smaller datasets with 20M and 34M cells, the linear scaling was shown up to four nodes and slightly scaling reduced on eight nodes. For all the datasets (20M, 34M and 50M) on sixteen nodes the scalability was reduced.
Achieving satisfactory results with smaller datasets can be accomplished using fewer processors and nodes, because smaller datasets do not require a higher number of processors. Nonetheless, augmenting the node count, and therefore, the processor count, in relation to the solver's computation time leads to increased interprocessor communication, subsequently extending the overall runtime. Consequently, higher node counts are more beneficial when handling larger datasets within OpenFOAM simulations.
Vertical – Weather and Environment | Application - WRF
The Weather Research and Forecasting model (WRF) is at the forefront of meteorological and atmospheric research, with its latest version being a testament to advancements in high-performance computing (HPC). WRF enables scientists and meteorologists to simulate and forecast complex weather patterns with unparalleled precision. In this study, we have worked on WRF version 4.5, which have been compiled with AOCC 4.0.0 with OPENMPI 4.1.4. For successful compilation and optimization with the AMD EPYC compilers, additional flags such as ' -O3 -znver4' have been added.
The dataset used in our study is CONUS v4.4. This means that the model's grid, parameters, and input data are set up to focus on weather conditions within the continental United States. This configuration is particularly useful for researchers, meteorologists, and government agencies who need high-resolution weather forecasts and simulations tailored to this specific geographic area. The configuration details, such as grid resolution, atmospheric physics schemes, and input data sources, can vary depending on the specific version of WRF and the goals of the modeling project. In this study, we have predominantly adhered to the default input configuration, making minimal alterations or adjustments to the source code or input file. Each run was conducted with full cores (64 cores per node) and from single node to sixteen nodes. The scalability tests were conducted and the performance metric in “sec” was noted.
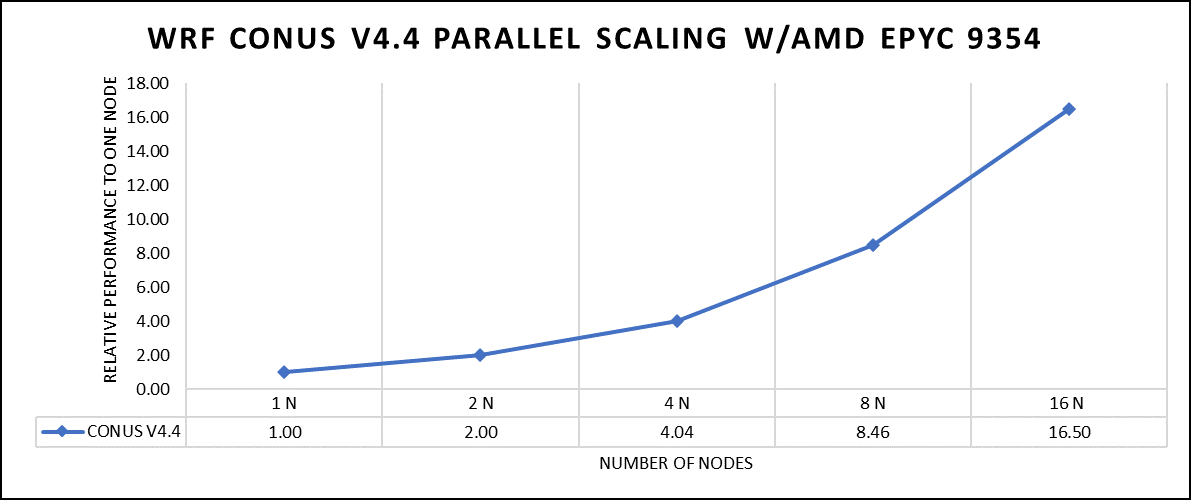
Figure 2: The scaling performance of the WRF CONUS dataset using the AMD EPYC 9354 processor, with a focus on performance compared to a single node.
The AOCC compiled binaries of WRF show linear scaling from a single node to sixteen nodes on 9354 processors for the new CONUS v4.4. For the best performance with WRF, the impact of the tile size, process, and threads per process should be carefully considered. Given that the application is constrained by memory and DRAM bandwidth, we have opted for the latest DDR5 4800 MT/s DRAM for our test evaluations. It is also crucial to consider the BIOS settings, particularly SubNUMA configurations, as these settings can significantly influence the performance of memory-bound applications, potentially leading to improvements ranging from one to five percent. For more detailed BIOS tuning recommendations, please see our previous blog post on optimizing BIOS settings for optimal performance.
Vertical – Molecular Dynamics | Application - LAMMPS
Large-scale Atomic/Molecular Massively Parallel Simulator (LAMMPS) is a powerful tool for HPC. It is specifically designed to harness the immense computational capabilities of HPC clusters and supercomputers. LAMMPS allows researchers and scientists to conduct large-scale molecular dynamics simulations with remarkable efficiency and scalability. In this study, we have worked on LAMMPS, 15 June 2023 version, which have been compiled with AOCC 4.0.0 with OPENMPI 4.1.4. For successful compilation and optimization with the AMD EPYC compilers, additional flags such as ' -O3 -znver4' have been added.
We opted for the non-default package, which offers optimized atom pair styles. We have also tried running some benchmarks which are not supported with default package to check the performance and scaling. Our performance metric for this benchmark is nanoseconds per day, where higher nanoseconds per day is considered a better result .
There are two factors that were considered when compiling data for comparison, the number of nodes and the core count. Figure 3 shows results of performance improvement observed on processor 9354 with 64 cores.
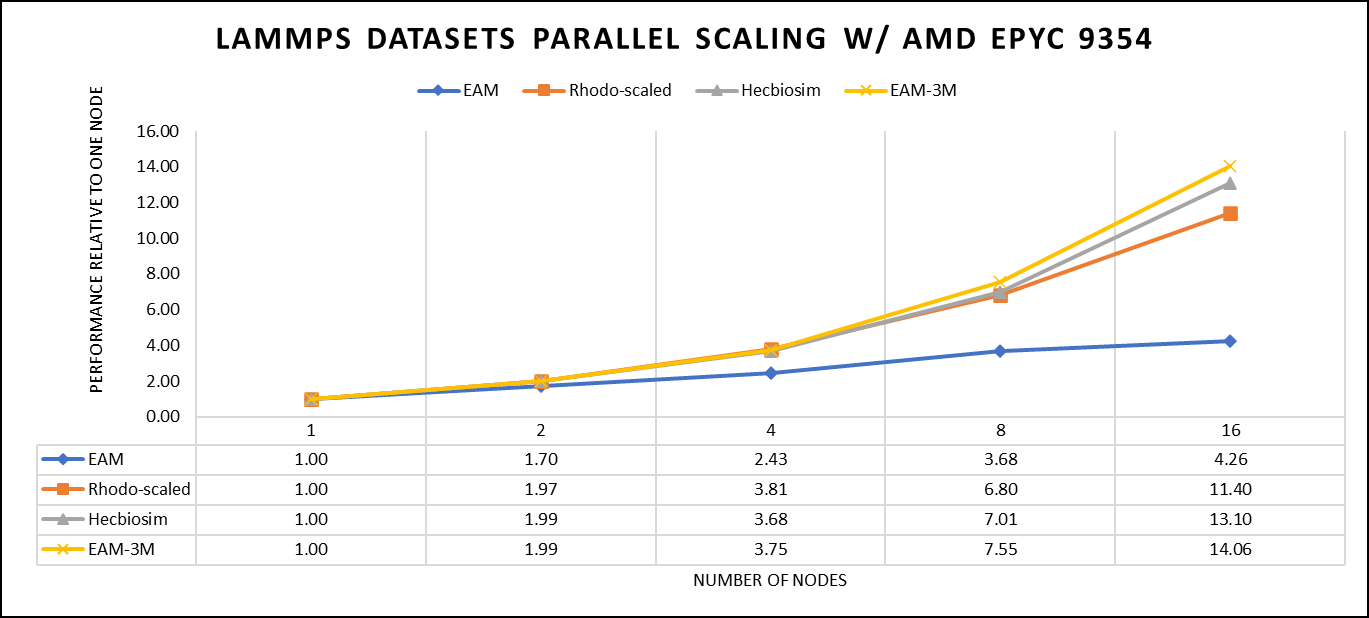
Figure 3: The scaling performance of the LAMMPS datasets using the AMD EPYC 9354 processor, with a focus on performance compared to a single node.
Figure 3 shows the scaling of different LAMMPS datasets. We see a significant improvement in scaling as we increased the atom size and step size. We have tested two datasets EAM and Hecbiosim with more than 3 million atoms and observed a better scalability as compared to other datasets.
Vertical – Molecular Dynamics | Application - GROMACS
GROMACS, a high-performance molecular dynamics software, is a vital tool for HPC environments. Tailored for HPC clusters and supercomputers, GROMACS specializes in simulating the intricate movements and interactions of atoms and molecules. Researchers in diverse fields, including biochemistry and biophysics, rely on its efficiency and scalability to explore complex molecular processes. GROMACS is used for its ability to harness the immense computational power of HPC, allowing scientists to conduct intricate simulations that unveil critical insights into atomic-level behaviors, from biomolecules to chemical reactions and materials. In this study, we have worked on GROMACS 2023.1 version, which have been compiled with AOCC 4.0.0 with OPENMPI 4.1.4. For successful compilation and optimization with the AMD EPYC compilers, additional flags such as ' -O3 -znver4' have been added.
We've curated a range of datasets for our benchmarking assessments. First, we included "water GMX_50 1536" and "water GMX_50 3072," which represent simulations involving water molecules. These simulations are pivotal for gaining insights into solvation, diffusion, and water's behaviour in diverse conditions. Next, we incorporated "HECBIOSIM 14K" and "HECBIOSIM 30K" datasets, which were specifically chosen for their ability to investigate intricate systems and larger biomolecular structures. Lastly, we included the "PRACE Lignocellulose" dataset, which aligns with our benchmarking objectives, particularly in the context of lignocellulose research. These datasets collectively offer a diverse array of scenarios for our benchmarking assessments.
Our performance assessment was based on the measurement of nanoseconds per day (ns/day) for each dataset, providing valuable insights into the computational efficiency. Additionally, we paid careful attention to optimizing the mdrun tuning parameters (i.e, ntomp, dlb tunepme nsteps etc )in every test run to ensure accurate and reliable results. We examined the scalability by conducting tests spanning from a single node to a total of sixteen nodes.
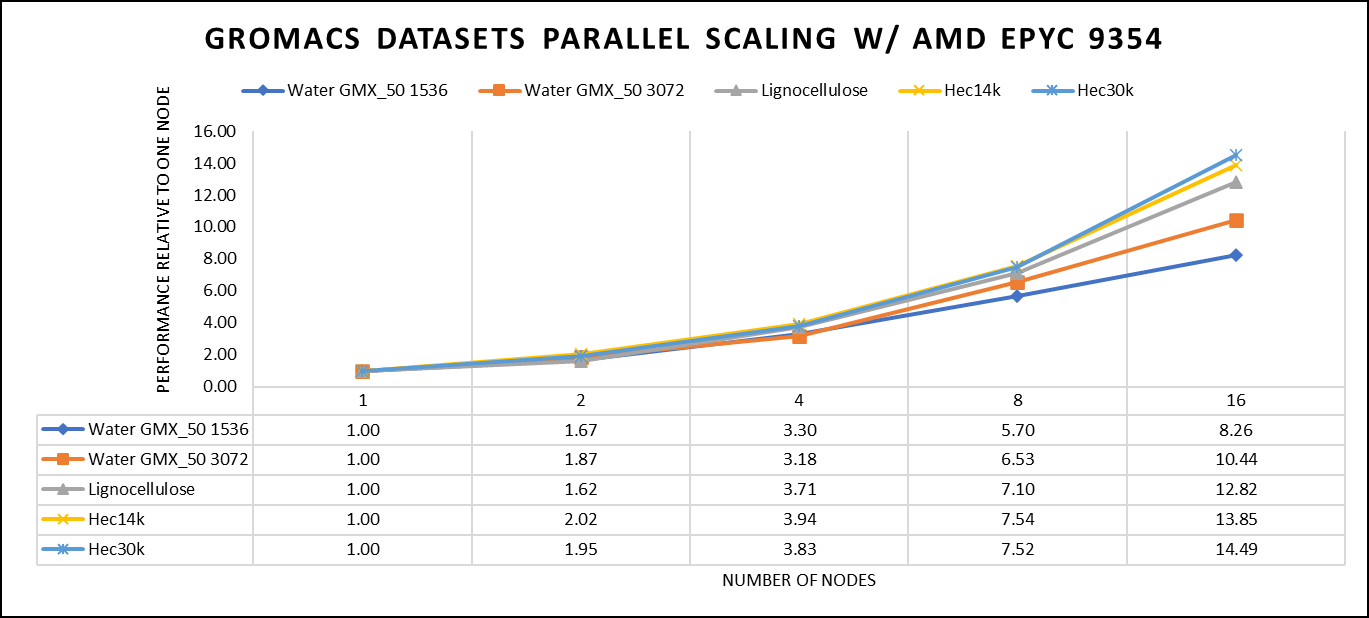
Figure 4: The scaling performance of the GROMACS datasets using the AMD EPYC 9354 processor, with a focus on performance compared to a single node.
For ease of comparison across the various datasets, the relative performance has been included into a single graph. However, it is worth noting that each dataset behaves individually when performance is considered, as each uses different molecular topology input files (tpr), and configuration files.
We were able to achieve the expected performance scalability for GROMACS of up to eight nodes for larger datasets. All cores in each server were used while running these benchmarks. The performance increases are close to linear across all the dataset types, however there is drop in larger number of nodes due to the smaller dataset size and the simulation iterations.
Vertical – Molecular Dynamics | Application – CP2K
CP2K is a versatile computational software package that covers a wide range of quantum chemistry and solid-state physics simulations, including molecular dynamics. It's not strictly limited to molecular dynamics but is instead a comprehensive tool for various computational chemistry and materials science tasks. While CP2K is widely used for molecular dynamics simulations, it can also perform tasks like electronic structure calculations, ab initio molecular dynamics, hybrid quantum mechanics/molecular mechanics (QM/MM) simulations, and more. In this study, we have worked on CP2K 2023.1 version, which have been compiled with AOCC 4.0.0 with OPENMPI 4.1.4. For successful compilation and optimization with the AMD EPYC compilers, additional flags such as ' -O3 -znver4' have been added.
In our study focusing on high-performance computing (HPC), we utilized specific datasets optimized for computational efficiency. The first dataset, "H2O-DFT-LS-NREP-4,6," was configured for HPC simulations and calculations, emphasizing the modeling of water (H2O) using Density Functional Theory (DFT). The appended "NREP-4,6" parameter settings were fine-tuned to ensure efficient HPC performance. The second dataset, "H2O-64-RI-MP2," was exclusively crafted for HPC applications and revolved around the examination of a system comprising 64 water molecules (H2O). By employing the Resolution of Identity (RI) method in conjunction with the Møller–Plesset perturbation theory of second order (MP2), this dataset demonstrated the significant computational capabilities of HPC for conducting advanced electronic structure calculations within a high-molecule-count environment. We examined the scalability by conducting tests spanning from a single node to a total of sixteen nodes.
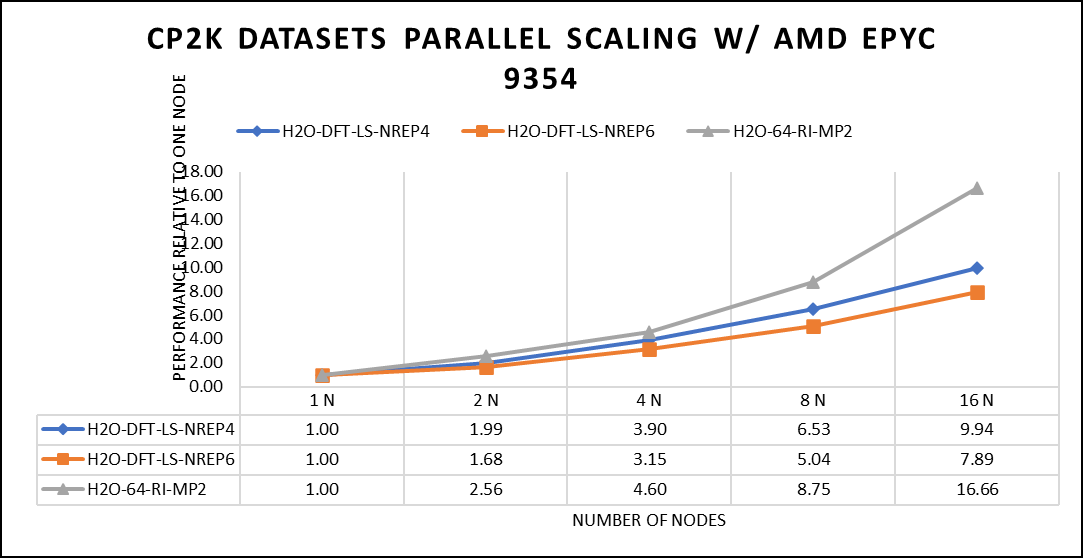
Figure 5: The scaling performance of the CP2K datasets using the AMD EPYC 9354 processor, with a focus on performance compared to a single node.
The datasets represent a single-point energy calculation employing linear-scaling Density Functional Theory (DFT). The system comprises 6144 atoms confined within a 39 Å^3 simulation box, which translates to a total of 2048 water molecules. To adjust the computational workload, you can modify the NREP parameter within the input file.
Our benchmarking efforts encompass configurations involving up to 16 computational nodes .Optimal performance is achieved when using NREP4 and NREP6 in Hybrid mode, which combines MPI (Message Passing Interface) and OpenMP (Open Multi-Processing). This configuration exhibits the best scaling performance, particularly on 4 to 8 nodes. However, it's worth noting that scaling beyond 8 nodes does not exhibit a strictly linear performance improvement. Above figure 5 depict outcomes when using Pure MPI, utilizing 64 cores with a single thread per core.
Conclusion
When considering CPUs with equivalent core counts, the earlier AMD EPYC processors can deliver performance levels like their Genoa counterparts. However, achieving this performance parity may require doubling the number of nodes. To further enhance performance using AMD EPYC processors, we suggest optimizing the BIOS settings as outlined in our previous blog post and specifically disabling Hyper-threading for the benchmarks discussed in this article. various workloads, we recommend conducting comprehensive testing and, if beneficial, enabling Hyper-threading. Additionally, for this performance study, we highly endorse the utilization of the Mellanox NDR 200 interconnect for optimal results.

16G PowerEdge Platform BIOS Characterization for HPC with Intel Sapphire Rapids
Fri, 30 Jun 2023 13:44:52 -0000
|Read Time: 0 minutes
Dell added over a dozen next-generation systems to the extensive portfolio of Dell PowerEdge 16G servers. These new systems are to accelerate performance and reliability for powerful computing across core data centers, large-scale public clouds, and edge locations.
The new PowerEdge servers feature rack, tower, and multi-node form factors, supporting the new 4th-gen Intel Xeon Scalable processors (formerly codenamed Sapphire Rapids). Sapphire Rapids still supports the AVX 512 SIMD instructions, which allow for 32 DP FLOP/cycle. The upgraded Ultra Path Interconnect (UPI) Link speed of 16 GT/s is expected to improve data movement between the sockets. In addition to core count and frequency, Sapphire Rapids-based Dell PowerEdge servers support DDR5 – 4800 MT/s RDIMMS with eight memory channels per processor, which is expected to improve the performance of memory bandwidth-bound applications.
This blog provides synthetic benchmark results and recommended BIOS settings for the Sapphire Rapids-based Dell PowerEdge Server processors. This document contains guidelines that allow the customer to optimize their application for best energy efficiency and provides memory configuration and BIOS setting recommendations for the best out-of-the-box performance and scalability on the 4th Generation of Intel® Xeon® Scalable processor families.
Test bed hardware and software details
Table 1 and Table 2 show the test bed hardware details and synthetic application details. There were 15 BIOS options explored through application performance testing. These options can be set and unset via the Remote Access Control Admin (RACADM) command in Linux or directly when the machines are in the BIOS mode.
Use the following command to set the “HPC Profile” to get the best synthetic benchmark results.
racadm set bios.sysprofilesettings.WorkloadProfile HpcProfile && sudo racadm jobqueue create BIOS.Setup.1-1 -r pwrcycle -s TIME_NOW -e TIME_NA
Once the system is up, use the below command to verify if the setting is enabled.
racadm bios.sysprofilesettings.WorkloadProfile
It should show workload profile set as HPCProfile. Please note that any changes made in BIOS settings on top of the “HPCProfile” will set this parameter to “Not Configured”, while keeping the other settings of “HPCProfile” intact.
Table 1. System details
Component | Dell PowerEdge R660 server (Air cooled) | Dell PowerEdge R760 server (Air cooled) | Dell PowerEdge C-Series (C6620) server (Direct Liquid Cooled) |
SKU | 8452Y | 6430 | 8480+ |
Cores/Socket | 36 | 32 | 56 |
Base Frequency | 2 | 1.9 | 2 |
TDP | 300 | 270 | 350 |
L3Cache | 69.12 MB | 61.44 MB | 10.75 MB |
Operating System | RHEL 8.6 | RHEL 8.6 | RHEL 8.6 |
Memory | 1024 - 64 x 16 | 1024 - 64 x 16 | 512 -32 x 16 |
BIOS | 1.0.1 | 1.0.1 | 1.0.1 |
CPLD | 1.0.1 | 1.0.1 | 1.0.1 |
Interconnect | NDR 400 | NDR 400 | NDR 400 |
Compiler | OneAPI 2023 | OneAPI 2023 | OneAPI 2023 |
Table 2. Synthetic benchmark applications details
Application Name | Version |
High-Performance Linpack (HPL) | Pre-built binary MP_LINPACK INTEL - 2.3 |
STREAM | |
High Performance Conjugate Gradient (HPCG) | Pre-built binary from INTEL oneAPI 2.3 |
Ohio State University (OSU) |
In the present study, synthetic applications such as HPL, STREAM, and HPCG are done on a single node; since the OSU benchmark is a benchmark study on MPI operations, it requires a minimum of two nodes.
Synthetic application performance details
As shown in Table 2, four synthetic applications are tested on the test bed hardware (Table 1). They are HPL, STREAM, HPCG, and OSU. The details of performance of each application are given below:
High Performance Linpack (HPL)
HPL helps measure the floating-point computation efficiency of a system [1]. The details of the synthetic benchmarks can be found in the previous blog on Intel Ice Lake processors.
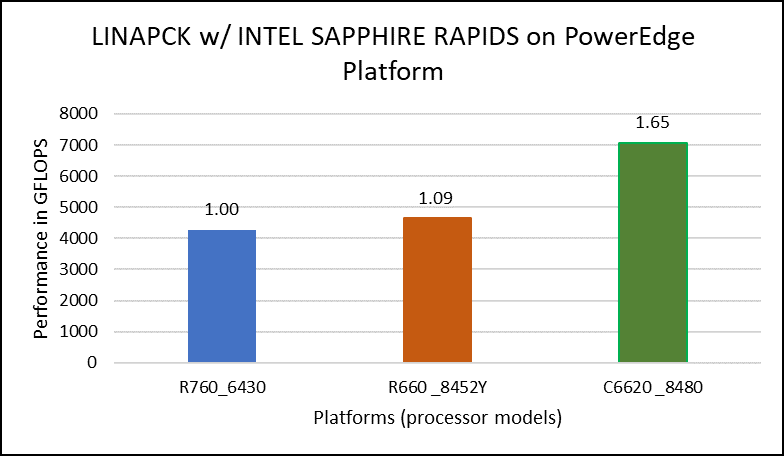
Figure 1. Performance values of HPL application for different processor models
The N and NB sizes used for the HPL benchmark are 348484 and 384, respectively, for the Intel Sapphire Rapids 6430, 8452Y processors, and 246144 and 384, respectively, for the 8480 processor. The difference in N sizes is due to the difference in available memory. Systems with Intel 6430 and 8452Y processors are equipped with 1024 GB of memory; the 8480 processor system has 512 GB. The performance numbers are captured with different BIOS settings, as discussed above, and the delta difference between each result is within 1-2%. The results with the HPC workload BIOS profile are shown in Figure 1. the 8452Y processor performs 1.09 times better than the Intel Sapphire Rapids 6430 processor and the 8480 processor performs 1.65 times better.
STREAM
The STREAM benchmark helps for measuring sustainable memory bandwidth of a processor. In general for STREAM benchmark, each array for STREAM must have at least four times the total size of all last-level caches utilized in the run or 1 million elements, whichever is larger. The STREAM array sizes used for the current study are 4×10⁷ and 12×107 with full core utilization. The STREAM benchmark was also tested with 15 BIOS combinations, and the results depicted in Figure 2 are for the HPC workload profile bios test case. The STREAM TRIAD results are captured here in GB/sec. Results show improvement in performance compared to the Intel 3rd Generation Xeon Scalable processors, such as the 8380 and 6338. Also, if comparing 6430, 8452Y and 8480 processors, the STREAM results with 8452Y and 8480 Intel 4th Generation Xeon Scalable processors are, respectively, 1.12 and 1.24 times better than the Intel 6430 processor.
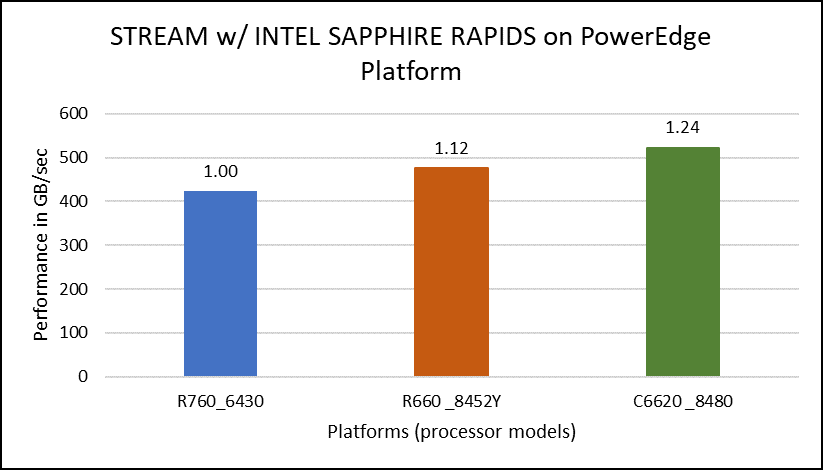
Figure 2. Performance values of STREAM application for different processor models
HPCG
The HPCG benchmark aims to simulate the data access patterns of applications such as sparse matrix calculations, assessing the impact of memory subsystem and internal connectivity constraints on the computing performance of High-Performance Computers, or supercomputers. The different problem sizes used in the study are 192, 256, 176, 168, and so on. Additionally, in this benchmark study, the variation in performance within different BIOS options was within 1–2 percent. Figure 3 shows the HPCG performance results for Intel Sapphire Rapids processors 6430, 8452Y and 8480. In comparison with the Intel 6430 processor, the 8452Y shows 1.02 times and the 8480 shows 1.12 times better performance.
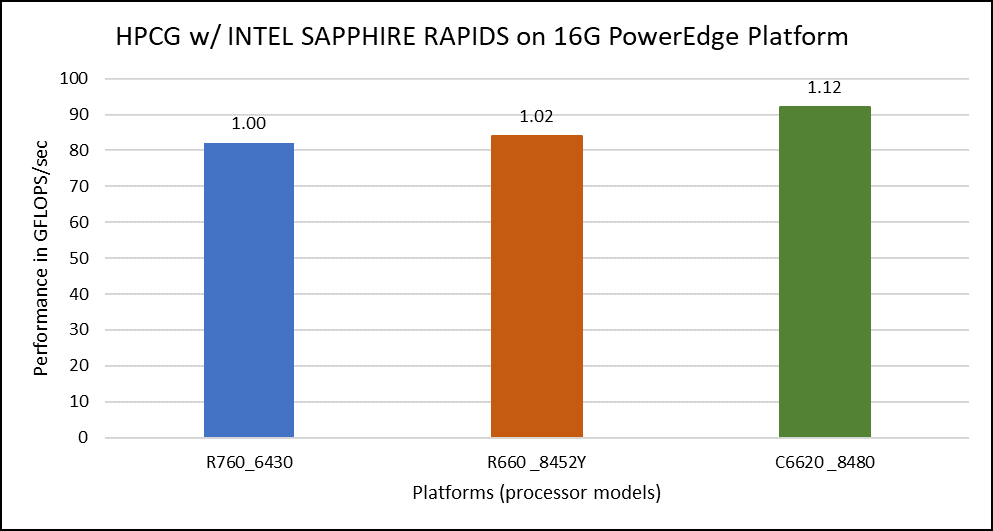
Figure 3. Performance values of HPCG application for different processor models
OSU Micro Benchmarks
OSU Micro Benchmarks are used for measuring the performance of MPI implementations, so we used two nodes connected to NDR200. OSU benchmark determines uni-directional and bi-directional bandwidth and message rate and latency between the nodes. The OSU benchmark was run on all three Intel processors (6430, 8452Y, and 8480) with single core per node; however, we have shown one of the system/processors (Intel 8480 processor) results in the blog starting from Figures 4-7.
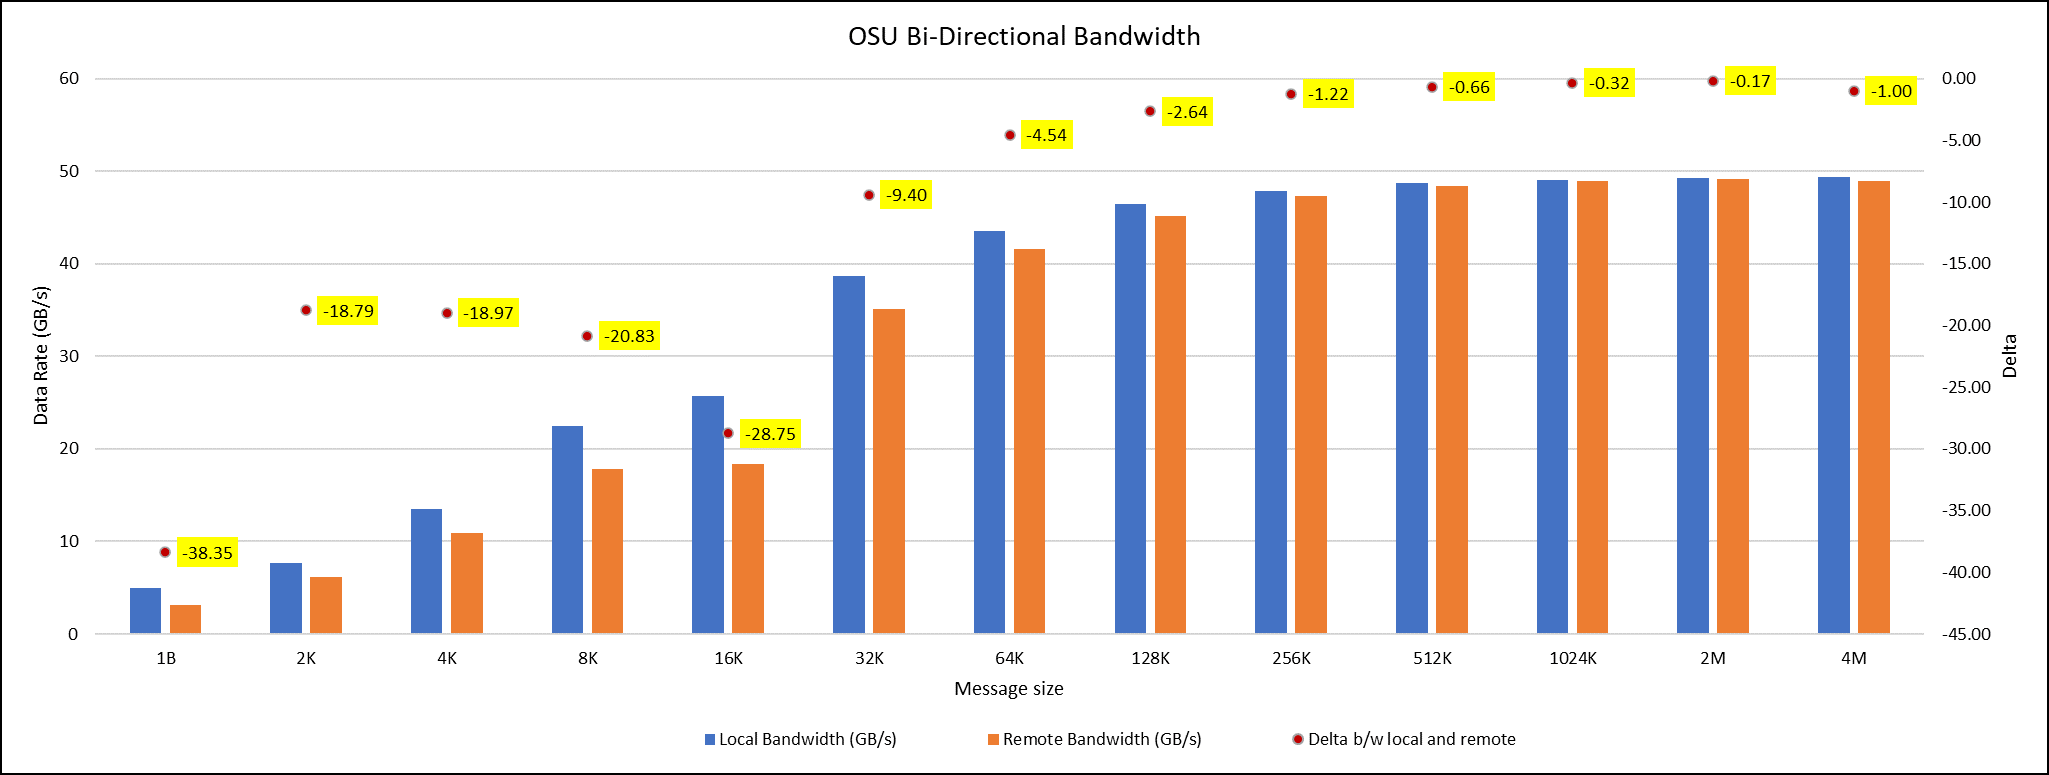
Figure 4. OSU Bi-Directional bandwidth chart for C6620_8480 intel processor
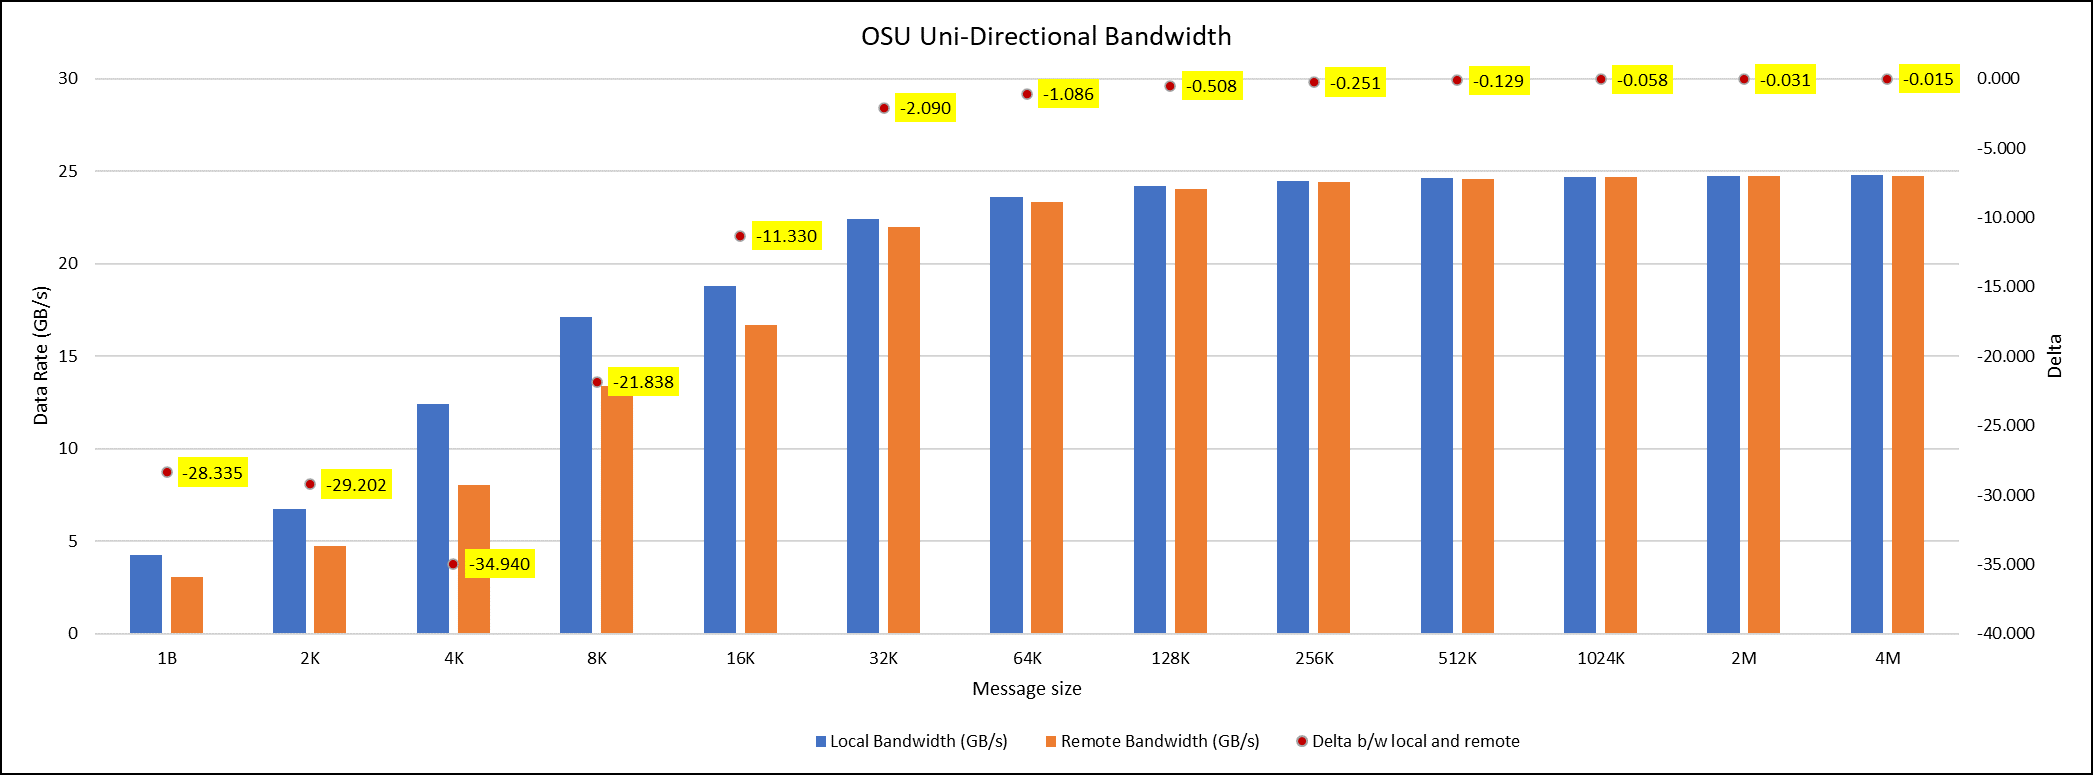
Figure 5. OSU Uni-Directional bandwidth chart for C6620_8480 intel processor
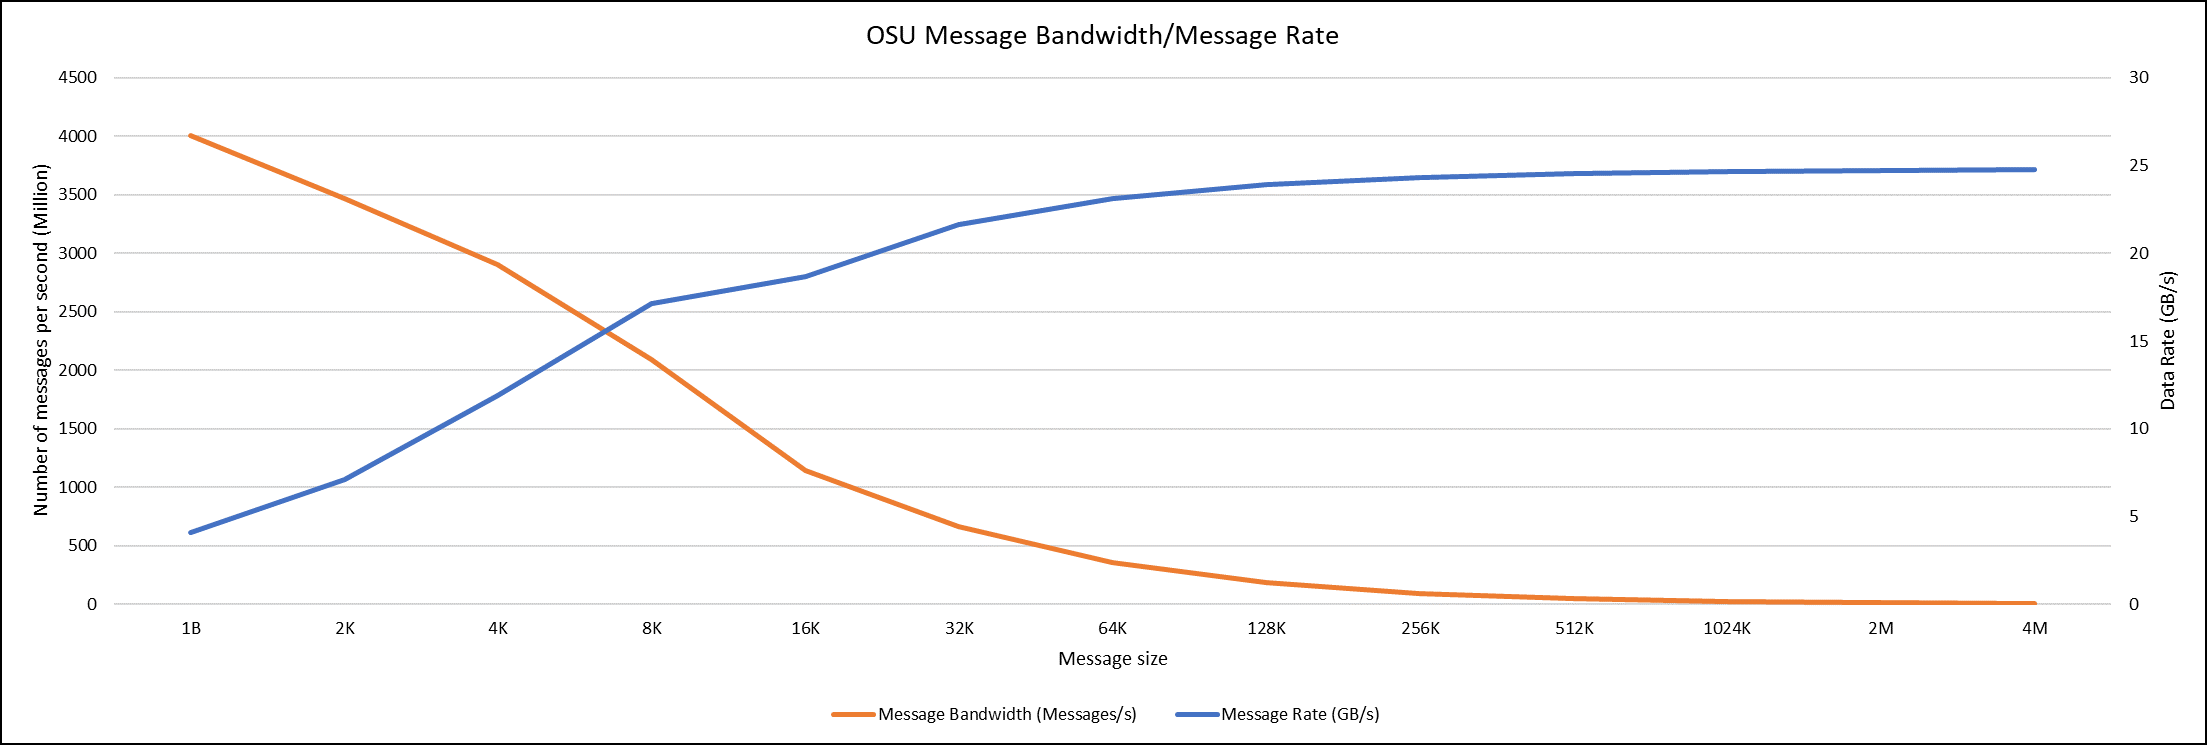
Figure 6. OSU Message bandwidth/Message rate chart for C6620_8480 intel processor
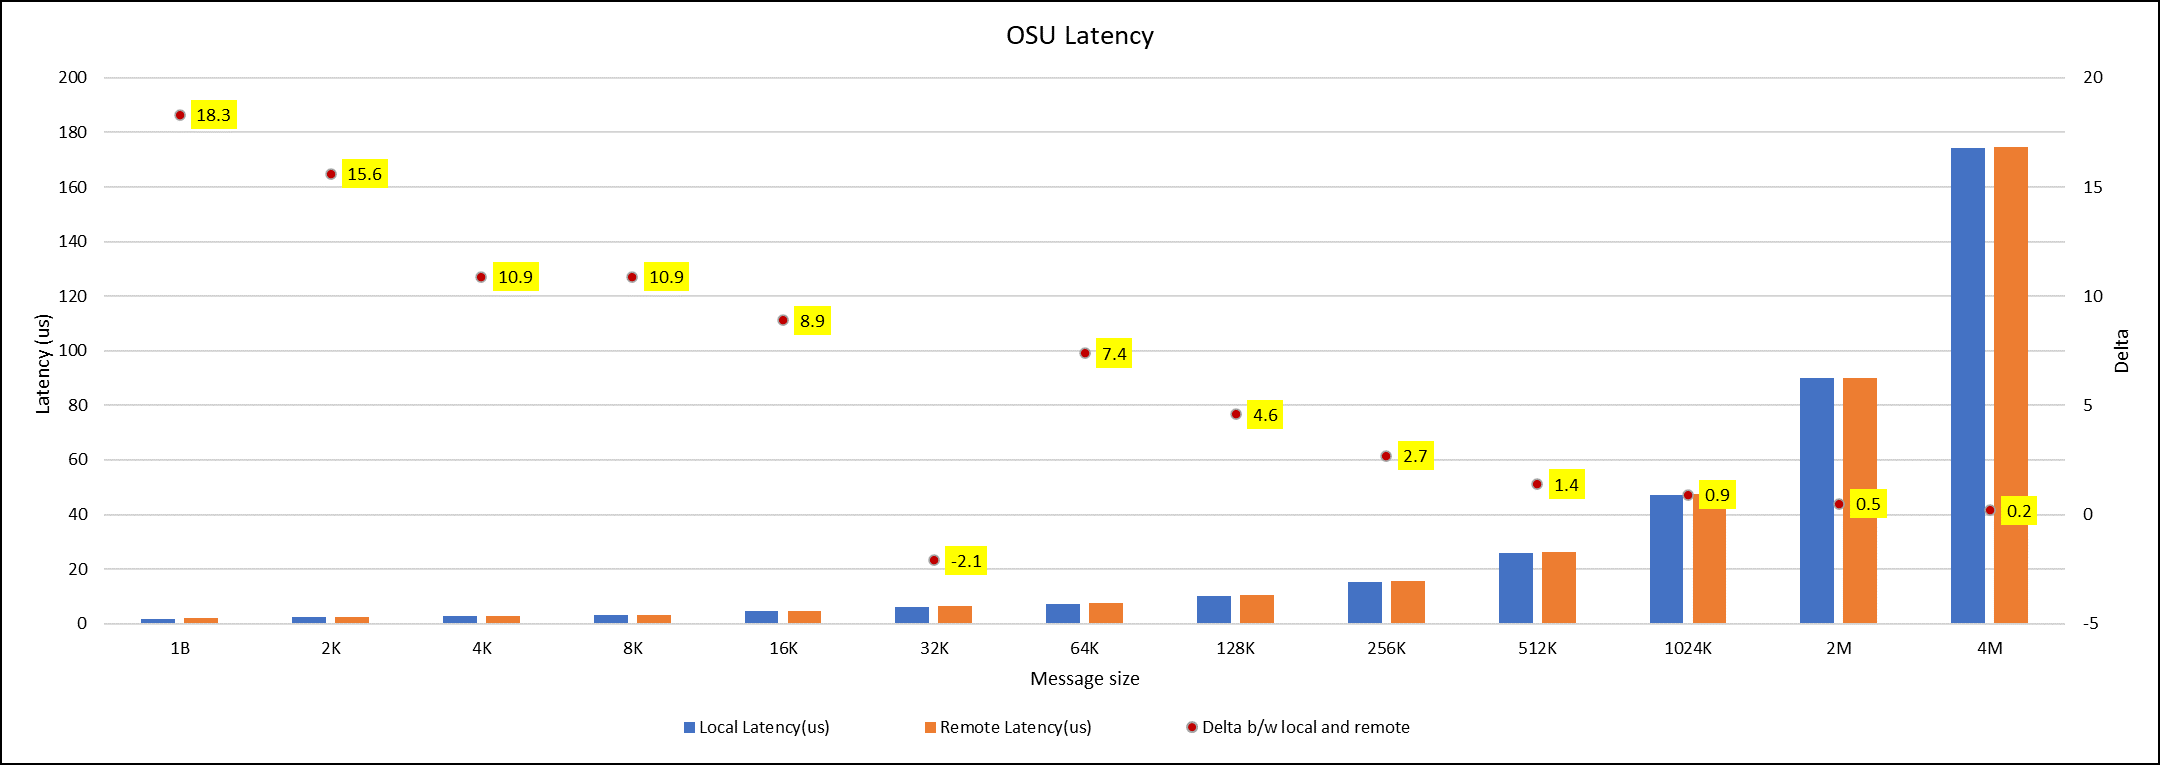
Figure 7. OSU Latency chart for C6620_8480 intel processor
All fifteen BIOS combinations were tested; the OSU benchmark also shows similar performance with a difference within a 1-2% delta.
Conclusion
The performance comparison between various Intel Sapphire Rapids processors (6430, 8452Y and 8480) is done with the help of synthetic benchmark applications such as HPL, STREAM, HPCG and OSU. Nearly 15 BIOS configurations are set on the system, and performance values with different benchmarks were captured to identify the best BIOS configuration to set. From the results, it was found that the difference in performance with any benchmarks for all the BIOS configurations applied is below 3 percent delta.
Therefore, the HPC workload profile provides better benchmark results with all the Intel Sapphire Rapids processors. Among the three Intel processors compared, the 8480 had the highest application performance value, while the 8452Y is in second place. The maximum difference in performance between processors was found for the HPL benchmark, and it was the 8480 Intel Sapphire Rapids processor, which offers 1.65 times better results than the Intel 6430 processor.
Watch out for future application benchmark results on this blog! Visit our page for previous blogs.

GROMACS — with Ice Lake on Dell EMC PowerEdge Servers
Fri, 02 Dec 2022 05:33:27 -0000
|Read Time: 0 minutes
3rd Generation Intel Xeon® Scalable processors (architecture code named Ice Lake) is Intel’s successor to Cascade Lake. New features include up to 40 cores per processor, eight memory channels with support for 3200 MT/s memory speed and PCIe Gen4.
The HPC and AI Innovation Lab at Dell EMC had access to a few systems and this blog presents the results of our initial benchmarking study on a popular open-source molecular dynamics application – GROningen MAchine for Chemical Simulations (GROMACS).
Molecular dynamics (MD) simulations are a popular technique for studying the atomistic behavior of any molecular system. It performs the analysis of the trajectories of atoms and molecules where the dynamics of the system progresses over time.
At HPC and AI Innovation Lab, we have conducted research on the SARS-COV-2 study where applications like GROMACS helped researchers identify molecules that bind to the spike protein of the virus and block it from infecting human cells. Other use cases of MD simulation in medicinal biology is iterative drug design through prediction of protein-ligand docking (in this case usually modelling a drug to target protein interaction).
Overview of GROMACS
GROMACS is a versatile package to perform MD simulations, such as simulate the Newtonian equations of motion for systems with hundreds to millions of particles. GROMACS can be run on CPUs and GPUs in single-node and multi-node (cluster) configurations. It is a free, open-source software released under the GNU General Public License (GPL). Check out this page for more details on GROMACS.
Hardware and software configurations
Table 1: Hardware and Software testbed details
Component | Dell EMC PowerEdge R750 server | Dell EMC PowerEdge R750 server | Dell EMC PowerEdge C6520 server | Dell EMC PowerEdge C6520 server | Dell EMC PowerEdge C6420 server | Dell EMC PowerEdge C6420 server |
SKU | Xeon 8380 | Xeon 8358 | Xeon 8352Y | Xeon 6330 | Xeon 8280 | Xeon 6252 |
Cores/Socket | 40 | 32 | 32 | 28 | 28 | 24 |
Base Frequency | 2.30 GHz | 2.60 GHz | 2.20 GHz | 2.00 GHz | 2.70 GHz | 2.10 – GHz |
TDP | 270 W | 250 W | 205 W | 205 W | 205 W | 150 W |
L3Cache | 60M | 48M | 48M | 42M | 38.5M | 37.75M |
Operating System | Red Hat Enterprise Linux 8.3 4.18.0-240.22.1.el8_3.x86_64 | |||||
Memory | 16 GB x 16 (2Rx8) 3200 MT/s | 16 GB x 12 (2Rx8) 2933 MT/s | ||||
BIOS/CPLD | 1.1.2/1.0.1 | |||||
Interconnect | NVIDIA Mellanox HDR | NVIDIA Mellanox HDR100 | ||||
Compiler | Intel parallel studio 2020 (update 4) | |||||
GROMACS | 2021.1 | |||||
Datasets used for performance analysis
Table 2: Description of datasets used for performance analysis
Datasets/Download Link | Description | Electrostatics | Atoms | System Size |
Movement of Water This example is to simulate- the motion process of many water molecules in each space and temperature.
| Particle Mesh Ewald (PME)
| 1536K | small | |
3072K | Large | |||
This example is to simulate- 1.4M atom system - A Pair of hEGFR Dimers of 1IVO and 1IVO 3M atom system – A Pair of hEGFR tetramers of 1IVO and 1IVO
| Particle Mesh Ewald (PME)
| 1.5M | Small | |
3M | Large | |||
Prace – Lignocellulose | This example is to simulate the lignocellulose – the tpr was obtained from PRACE website
| Reaction Field (rf)
| 3M | Large |
Compilation Details
We compiled GROMACS from source (version-2021.1) using the Intel 2020 Update 5 Compiler to take advantage of AVX2 and AVX512 optimizations, and the Intel MKL FFT library. The new version of GROMACS has a significant performance gain due to the improvements in its parallelization algorithms. The GROMACS build system and the gmx mdrun tool have built-in and configurable intelligence that detects your hardware and make effective use of it.
Objective of Benchmarking
Our objective is to quantify the performance of GROMACS using different test cases, like performance evaluation on different Ice Lake processors as listed in Table 1, then we compare the 2nd and 3rd Gen Xeon Scalable (Cascade Lake vs Ice Lake), and finally we compare multi-node scalability with hyper threading enabled and disabled.
To evaluate the datasets results with an appropriate metric, we added associated high-level compiler flags, electrostatic field load balancing (like PME, etc), tested with multiple ranks, separate PME ranks, varying different nstlist values, and created a paradigm for our application (GROMACS).
The typical time scales of the simulated system are in the order of micro-seconds (µs) or nanoseconds (ns). We measure the performance for the dataset’s simulation as nanoseconds per day (ns/day).
Performance Analyses on Single Node
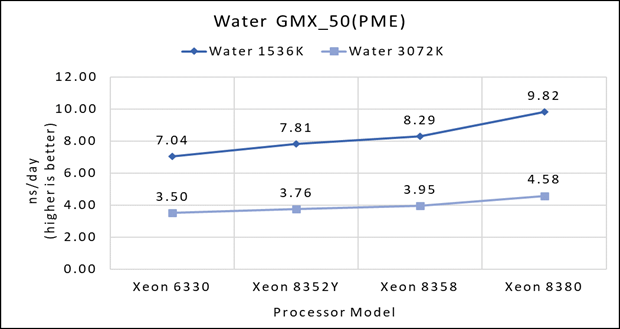
Figure 1(a): Single node performance of Water 1536K and Water 3072K on Ice Lake processor model
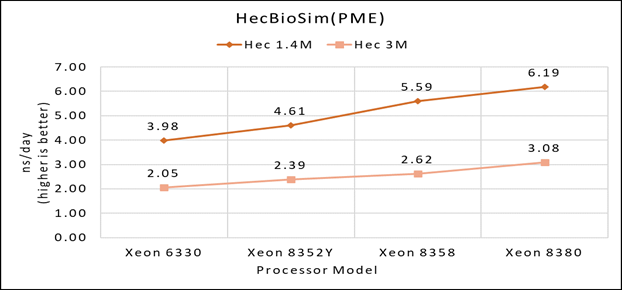 Figure 1(b): Single node performance of Lignocellulose 3M on Ice Lake processor model
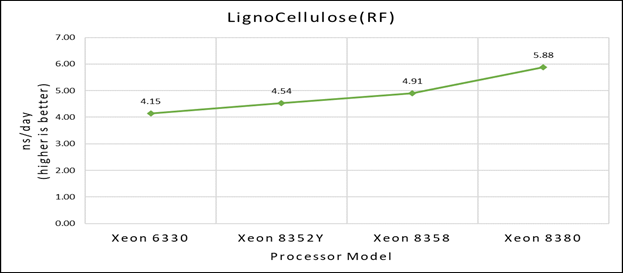 Figure 1(c): Single node performance of HecBioSim 1.4M and HecBioSim 3M on Ice Lake processor model
Figure 1 (a), (b) and (c) shows are the single node performance analyses for three datasets mentioned in Table 2 with the four processor models available for evaluation of GROMACS.
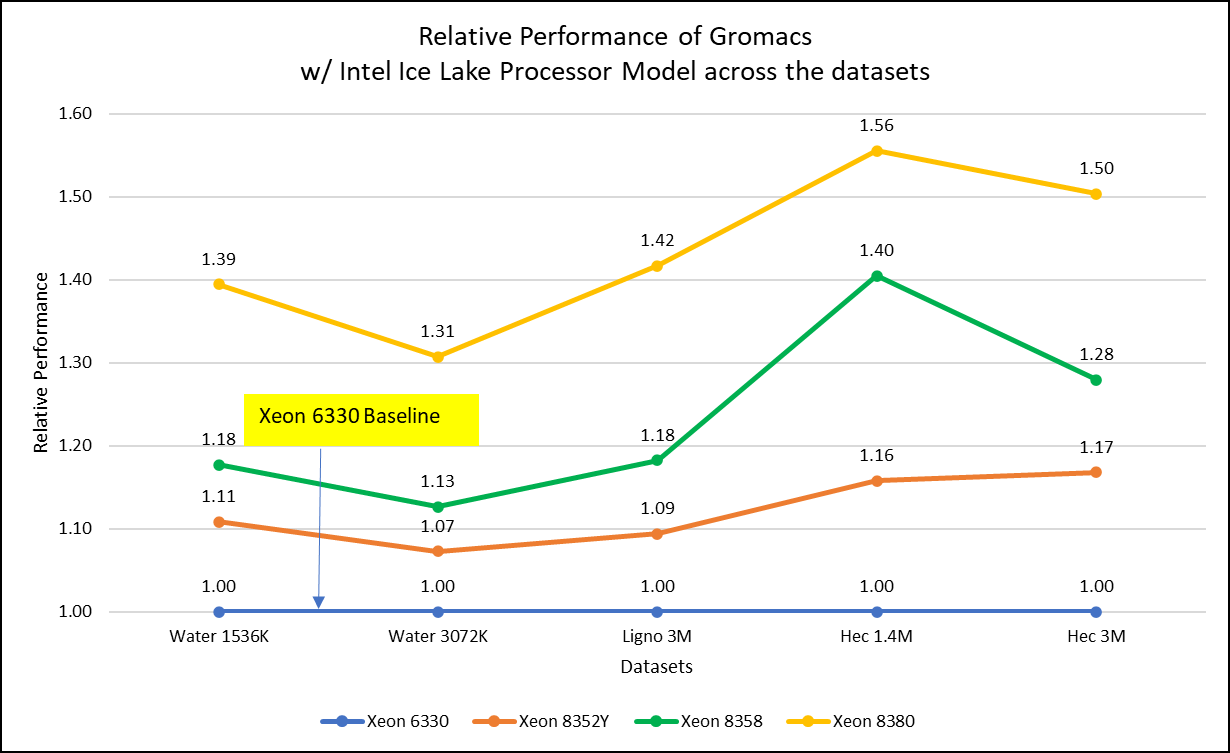
Figure 2: Relative Performance of GROMACS across the datasets with Intel Ice Lake Processor Model
For ease of comparison across the various datasets, the relative performance of the processor model has been included into a single graph. However, it is worth noting that each dataset behaves individually when performance is considered, as each uses different molecular topology input files (tpr), and configuration files.
Individual dataset performance is mentioned in Figures 1(a), 1(b), and 1(c) respectively.
Figure 2 shows increase in the core count in the processor model increases the performance, based on the dataset used. In here, we observe that smaller (water 1536K and HecBioSim 1400K) has more advantage 5 to 6 percent performance gain in counterpart to the larger datasets (water 3072, HecBioSim 3M, and Ligno 3M).
Next, by comparing the relative numbers to the baseline processor Xeon 6330(28C) with Xeon 8380(40C), we found a 30 to 50 percent performance gain according to the datasets with increases in cores, from 28 to 40. A fraction of gain is by frequency of the processor model.
Performance Analyses on Cascade Lake vs Ice Lake
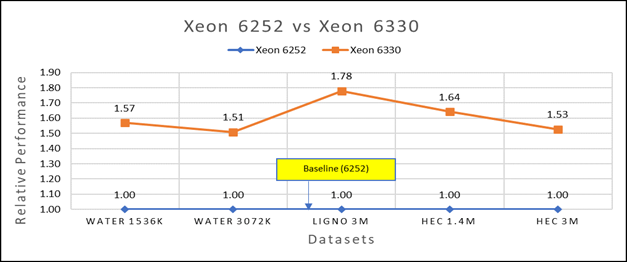
Figure 3(a): Performance of GROMACS on Cascade Lake (Xeon 6252) vs Ice Lake (Xeon 6330)
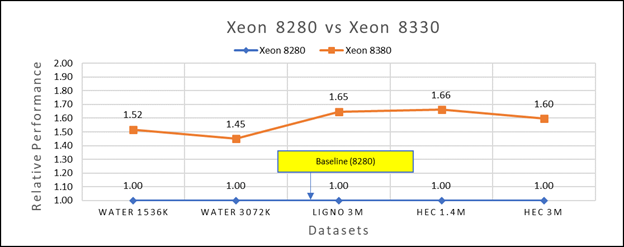
Figure 3(b): Performance of GROMACS on Cascade Lake (Xeon 8280) vs Ice Lake (Xeon 8380)
We accounted for the fact that the memory is rightly fit according to the datasets. To begin, we compared each processor with previous generation processors. For performance benchmark comparisons, we selected Cascade Lake closest to their Ice Lake counterparts in terms of hardware features such as cache size, TDP values, and Processor Base/Turbo Frequency, and marked the maximum value attained for Ns/day by each of the datasets mentioned in Table 2.
Figure 3a shows Ice Lake 6330 is up to 50 to 75 percent faster than the 6252. The Xeon 6330 has 16 percent more cores and 9 percent faster memory bandwidth. Figure 3b shows that Ice Lake 8380 is up to 50-65 percent faster than the Xeon 8280 on single node tests, this is in line with the 42 percent more cores and 9 percent faster memory bandwidth.
This result is due to a higher processor speed, wherein more data can be accessed by each core. Also, datasets are more memory intensive and some percentage is added on due frequency improvement Overall, the Ice Lake processor results demonstrated a substantial performance improvement for GROMACS over Cascade Lake processors.
Performance Analysis on Multi-Node
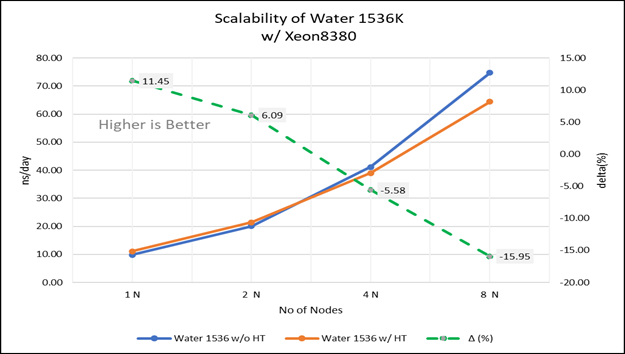 Figure 4(a): Scalability of water 1536K with hyper threading disabled(80C) vs hyperthreading enabled (160C) w/ Xeon 8380; the dotted line represent the delta between hyperthreading enabled vs hyperthreading disabled
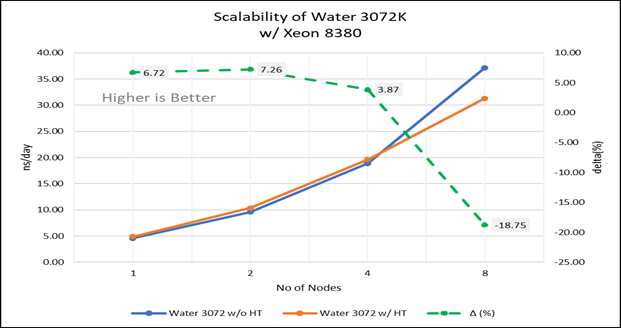 Figure 4(b): Scalability of water 3072K with hyper threading disabled(80C) vs hyperthreading enabled (160C) w/INTEL 8380; the dotted line represent the delta between hyperthreading enabled vs hyperthreading disabled
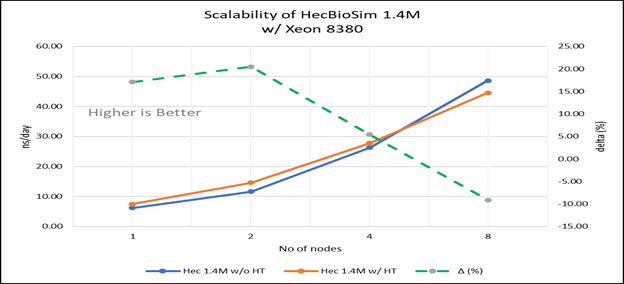 Figure 4(c): Scalability of HecBioSim 1.4M with hyper threading disabled(80C) vs hyperthreading enabled (160C) w/ Xeon 8380; the dotted line represent the delta between hyperthreading enabled vs hyperthreading disabled
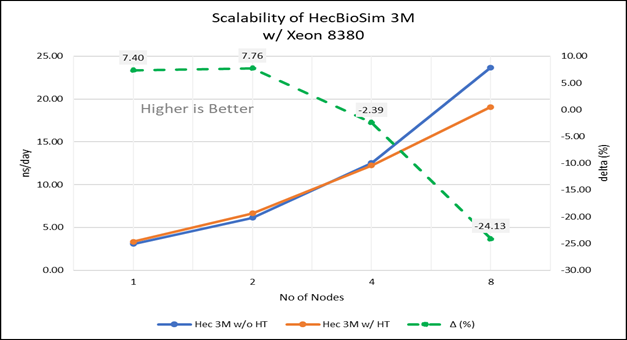 Figure 4(d): Scalability of HecBioSim 3M with hyper threading disabled(80C) vs hyperthreading enabled (160C) w/ Xeon 8380; the dotted line represent the delta between hyperthreading enabled vs hyperthreading disabled
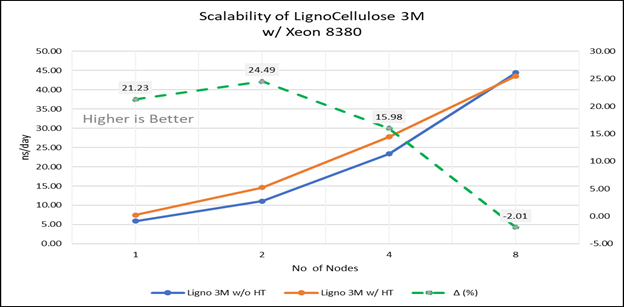 Figure 4(e): Scalability of Lignocellulose 3M with hyper threading disabled(80C) vs hyperthreading enabled (160C) w/INTEL 8380 ; the dotted line represent the delta between hyperthreading enabled vs hyperthreading disabled
For multi-node tests, the test bed was configured with an NVIDIA Mellanox HDR interconnect running at 200 Gbps and each server having the Ice Lake processor. We were able to achieve the expected linear performance scalability for GROMACS of up to eight nodes with hyper threading disabled and approximately 7.25X with hyper threading enabled for eight nodes, across the datasets. All cores in each server were used while running these benchmarks. The performance increases are close to linear across all the dataset types as the core count increases.
Conclusion
The Ice Lake processor-based Dell EMC Power Edge servers, with notable hardware feature upgrades over Cascade Lake, show up to 50 to 60 percent performance gain for all the datasets used for benchmarking GROMACS. Hyper threading should be disabled for the benchmarks addressed in this blog for getting better scalability above eight nodes. For small datasets mentioned in this blog benefits 5 to 6 percent in comparison to the larger ones with increase in the core count.
Watch our blog site for updates!

HPC Application Performance on Dell PowerEdge R7525 Servers with the AMD Instinct™ MI210 GPU
Mon, 12 Sep 2022 12:11:52 -0000
|Read Time: 0 minutes
PowerEdge support and performance
The PowerEdge R7525 server can support three AMD Instinct™ MI210 GPUs; it is ideal for HPC Workloads. Furthermore, using the PowerEdge R7525 server to power AMD Instinct MI210 GPUs (built with the 2nd Gen AMD CDNA™ architecture) offers improvements on FP64 operations along with the robust capabilities of the AMD ROCm™ 5 open software ecosystem. Overall, the PowerEdge R7525 server with the AMD Instinct MI210 GPU delivers expectational double precision performance and leading total cost of ownership.
Figure 1: Front view of the PowerEdge R7525 server
We performed and observed multiple benchmarks with AMD Instinct MI210 GPUs populated in a PowerEdge R7525 server. This blog shows the performance of LINPACK and the OpenMM customizable molecular simulation libraries with the AMD Instinct MI210 GPU and compares the performance characteristics to the previous generation AMD Instinct MI100 GPU.
The following table provides the configuration details of the PowerEdge R7525 system under test (SUT):
Table 1. SUT hardware and software configurations
Component | Description |
Processor | AMD EPYC 7713 64-Core Processor |
Memory | 512 GB |
Local disk | 1.8T SSD |
Operating system | Ubuntu 20.04.3 LTS |
GPU | 3xMI210/MI100 |
Driver version | 5.13.20.22.10 |
ROCm version | ROCm-5.1.3 |
Processor Settings > Logical Processors | Disabled |
System profiles | Performance |
NUMA node per socket | 4 |
HPL | rochpl_rocm-5.1-60_ubuntu-20.04 |
OpenMM | 7.7.0_49 |
The following table contains the specifications of AMD Instinct MI210 and MI100 GPUs:
Table 2: AMD Instinct MI100 and MI210 PCIe GPU specifications
GPU architecture | AMD Instinct MI210 | AMD Instinct MI100 |
Peak Engine Clock (MHz) | 1700 | 1502 |
Stream processors | 6656 | 7680 |
Peak FP64 (TFlops) | 22.63 | 11.5 |
Peak FP64 Tensor DGEMM (TFlops) | 45.25 | 11.5 |
Peak FP32 (TFlops) | 22.63 | 23.1 |
Peak FP32 Tensor SGEMM (TFlops) | 45.25 | 46.1 |
Memory size (GB) | 64 | 32 |
Memory Type | HBM2e | HBM2 |
Peak Memory Bandwidth (GB/s) | 1638 | 1228 |
Memory ECC support | Yes | Yes |
TDP (Watt) | 300 | 300 |
High-Performance LINPACK (HPL)
HPL measures the floating-point computing power of a system by solving a uniformly random system of linear equations in double precision (FP64) arithmetic, as shown in the following figure. The HPL binary used to collect results was compiled with ROCm 5.1.3.
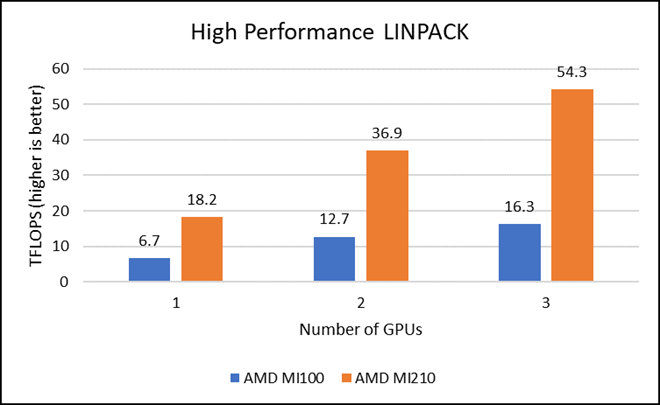
Figure 2: LINPACK performance with AMD Instinct MI100 and MI210 GPUs
The following figure shows the power consumption during a single HPL run:
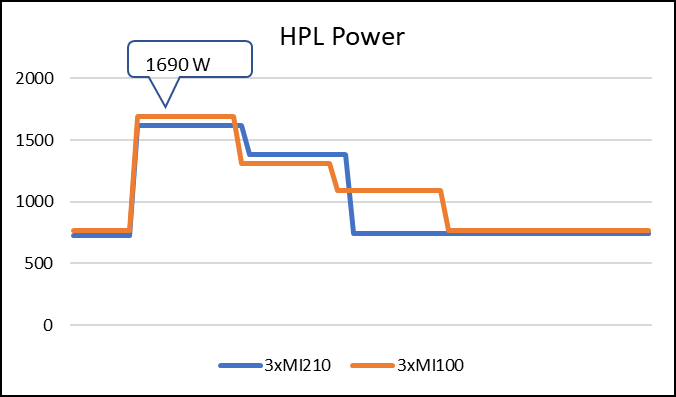
Figure 3: LINPACK power consumption with AMD Instinct MI100 and MI210 GPUs
We observed a significant improvement in the AMD Instinct MI210 HPL performance over the AMD Instinct MI100 GPU. The numbers on a single GPU test of MI210 are 18.2 TFLOPS which is approximately 2.7 times higher than MI100 number (6.75 TFLOPS). This improvement is due to the AMD CDNA2 architecture on the AMD Instinct MI210 GPU, which has been optimized for FP64 matrix and vector workloads. Also, the MI210 GPU has larger memory, so the problem size (N) used here is large in comparison to the AMD Instinct MI100 GPU.
As shown in Figure 2, the AMD Instinct MI210 has shown almost linear scalability in the HPL values on single node multi-GPU runs. The AMD Instinct MI210 GPU reports better scalability compared to its last generation AMD Instinct MI100 GPUs. Both GPUs have the same TDP, with the AMD Instinct MI210 GPU delivering three times better performance. The performance per watt value of a PowerEdge R7525 system is three times more. Figure 3 shows the power consumption characteristics in one HPL run cycle.
OpenMM
OpenMM is a high-performance toolkit for molecular simulation. It can be used as a library or as an application. It includes extensive language bindings for Python, C, C++, and even Fortran. The code is open source and actively maintained on GitHub and licensed under MIT and LGPL.
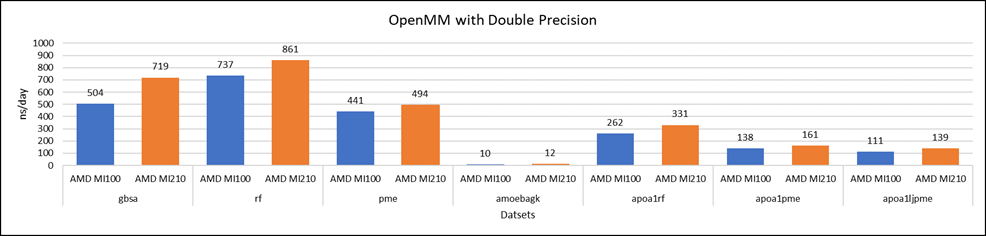
Figure 4: OpenMM double-precision performance with AMD Instinct MI100 and MI210 GPUs
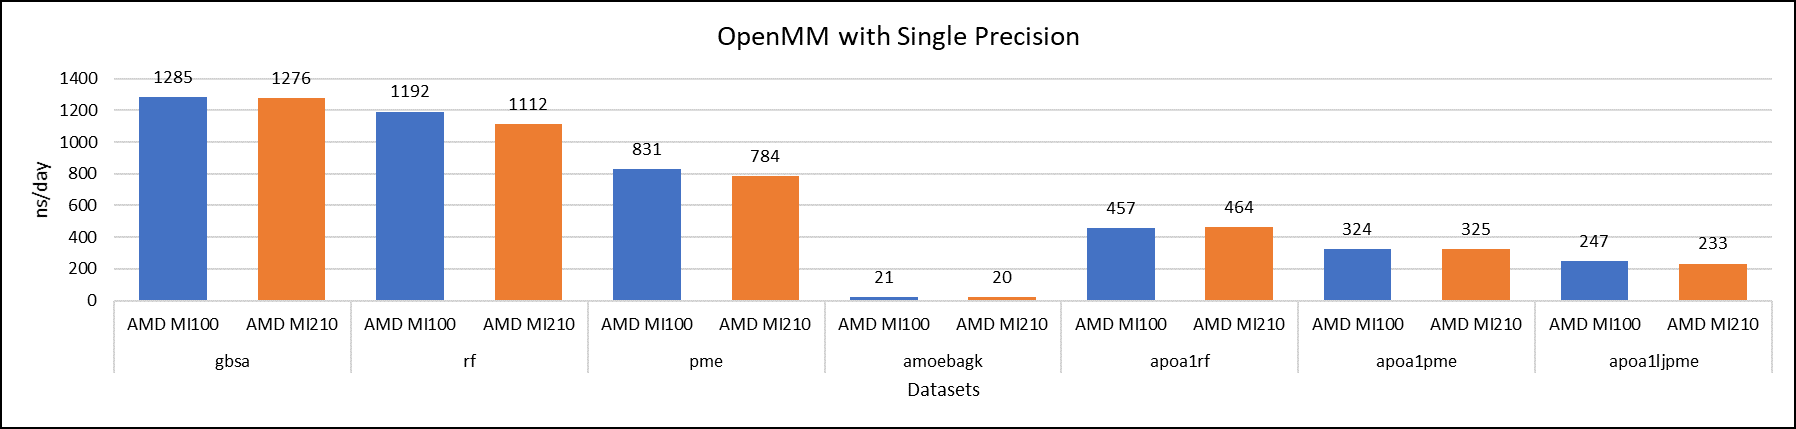
Figure 5: OpenMM single-precision performance with AMD Instinct MI100 and MI210 GPUs

Figure 6: OpenMM mixed-precision performance with AMD Instinct MI100 and MI210 GPUs
We tested OpenMM with seven datasets to validate double, single, and mixed precision. We observed exceptional double precision performance with OpenMM on the AMD Instinct MI210 GPU compared to the AMD Instinct MI100 GPU. This improvement is due to the AMD CDNA2 architecture on the AMD Instinct MI210 GPU, which has been optimized for FP64 matrix and vector workloads.
Conclusion
The AMD Instinct MI210 GPU shows an impressive performance improvement in FP64 workloads. These workloads benefit as AMD has doubled the width of their ALUs to a full 64-bits wide. This change allows the FP64 operations to now run at full speed in the new 2nd Gen AMD CDNA architecture. The applications and workloads that are designed to run on FP64 operations are expected to take full advantage of the hardware.

LAMMPS — with Ice Lake on Dell EMC PowerEdge Servers
Mon, 30 Aug 2021 21:09:22 -0000
|Read Time: 0 minutes
3rd Generation Intel Xeon® Scalable processors (architecture code named Ice Lake) is Intel’s successor to Cascade Lake. New features include up to 40 cores per processor, eight memory channels with support for 3200 MT/s memory speed and PCIe Gen4. The HPC and AI Innovation Lab at Dell EMC had access to a few systems and this blog presents the results of our initial benchmarking study.
LAMMPS Overview
Large-scale Atomic/Molecular Massively Parallel Simulator (LAMMPS) is an open source, well parallelized collection of packages for molecular dynamics (MD) research. LAMMPS has a nice collection of “atom styles”, force fields, and many contributed packages. LAMMPS can run on a single processor or on the largest parallel super-computers. It also has packages that provide force calculations accelerated on GPU’s. It can do simulations with billions of atoms!
LAMMPS can be run on a single processor or in parallel using some form of message passing, such as Message Passing Interface (MPI). The most current source code for LAMMPS is written in C++. For more information about LAMMPS, see the following link: https://www.lammps.org/.
Objective
In this study we measure the performance of LAMMPS on different Ice Lake processor models as listed in Table 1 with a comparison to the previous generation Cascade Lake systems. Single node as well as the multi-node scalability tests were conducted.
Compilation Details
The LAMMPS version used for testing release was lammps-2July-2021, using the Intel 2020 update 5 compiler to take advantage of AVX2 and AVX512 optimizations, and the Intel MKL FFT library. We used the default INTEL package, which comes along the LAMMPS package providing some well optimized atom pair styles in LAMMPS for the vector instructions on Intel processors. The datasets used for our study are described in Table 2, along with detailed configuration of atom sizes and run steps. The unit of performance is timesteps per second, and higher is better.
Hardware and software configurations
Table 1: Hardware and Software test bed details
Component | Dell EMC PowerEdge R750 server | Dell EMC PowerEdge R750 server | Dell EMC PowerEdge C6520 server | Dell EMC PowerEdge C6520 server | Dell EMC PowerEdge C6420 server | Dell EMC PowerEdge C6420 server |
CPU model | Xeon 8380 | Xeon 8358 | Xeon 8352Y | Xeon 6330 | Xeon 8280 | Xeon 6248R |
Cores/Socket | 40 | 32 | 32 | 28 | 28 | 24 |
Base Frequency | 2.30 GHz | 2.60 GHz | 2.20 GHz | 2.00 GHz | 2.70 GHz | 3.00 GHz |
TDP | 270 W | 250 W | 205 W | 205 W | 205 W | 205 W |
Operating System | Red Hat Enterprise Linux 8.3 4.18.0-240.22.1.el8_3.x86_64 | |||||
Memory |
16 GB x 16 (2Rx8) 3200 MT/s
| 16 GB x 12 (2Rx8) 2933 MT/s | ||||
BIOS/CPLD | 1.1.2/1.0.1 | |||||
Interconnect | NVIDIA Mellanox HDR
| NVIDIA Mellanox HDR100 | ||||
Compiler | Intel parallel studio 2020 (update 4) | |||||
LAMMPS | 2july2021 | |||||
Datasets used for performance analysis
Table 2: Description of datasets used for performance analysis
Datasets | Description | Units | Atomic Style | Atom Size | Step Size |
Lennard Jones | Atomic fluid (LJ Benchmark) | lj | atomic | 512000 | 7900 |
Rhodo | Protein (Rhodopsin Benchmark) | real | full | 512000 | 520 |
Liquid crystal | Liquid Crystal w/ Gay-Berne potential | lj | ellipsoid | 524288 | 840 |
Eam | Copper benchmark with Embedded Atom Method | metal | atomic | 512000 | 3100 |
Stilliger Weber | Silicon benchmark with Stillinger-Weber | metal | atomic | 512000 | 6200 |
Tersoff | Silicon benchmark with Tersoff | metal | atomic | 512000 | 2420 |
Water | Coarse-grain water benchmark using Stillinger-Weber | real | atomic | 512000 | 2600 |
Polyethylene | Polyethylene benchmark with AIREBO | metal | atomic | 522240 | 550 |
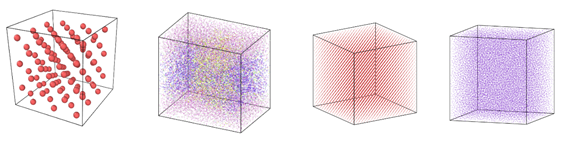
Figure 1: Image view of datasets from OVITO (scientific data visualization and analysis software for molecular and other particle-based simulation model). Images are listed in order 1a-1h, subfigure 1a- 1h represents a small portion of simulation domain for Atomic Fluid (Lennard Jones), rhodo(protein), liquid crystal(lc), copper(eam), stilliger webner(sw), Terasoff, water, polyethylene datasets respectively.
Table 1 and Figure 1 shows the image view of datasets used for the single and multi-node analysis. For visualization of all datasets was done using OVITO, scientific data visualization and analysis software for molecular and other particle-based simulation model. For single node performance study, all the datasets shown in Table 2 were used, and for multi-node study Atomic fluid was considered for benchmarking.
Performance Analyses on Single Node
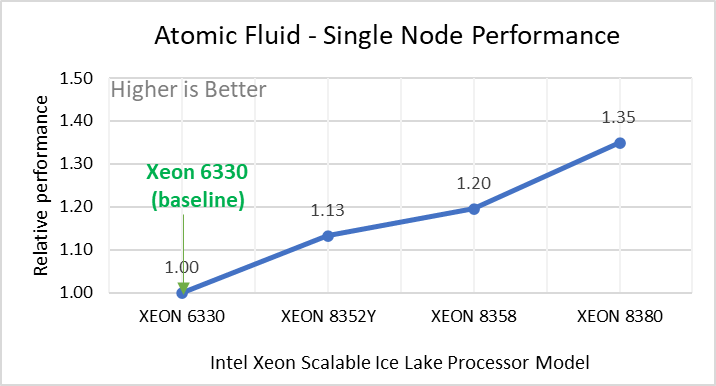
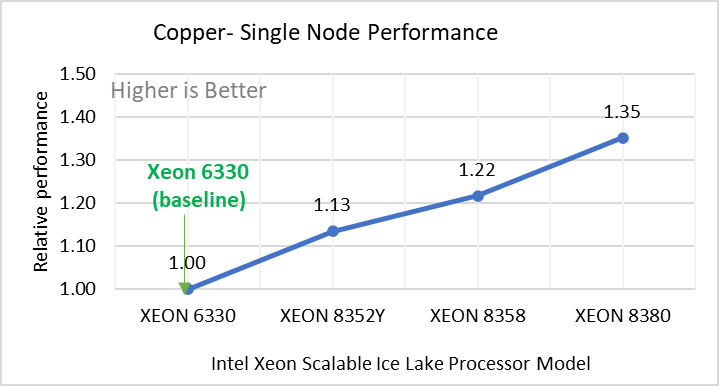
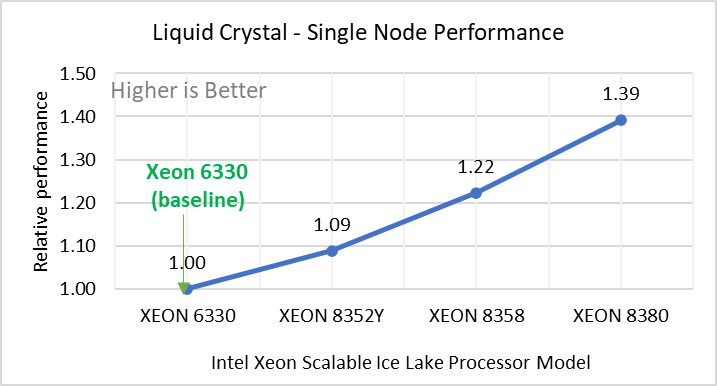
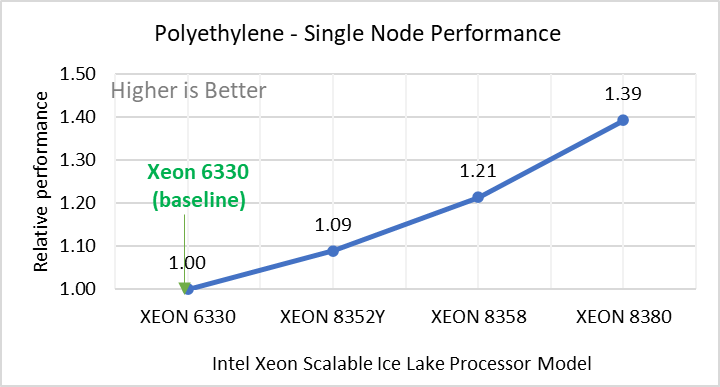
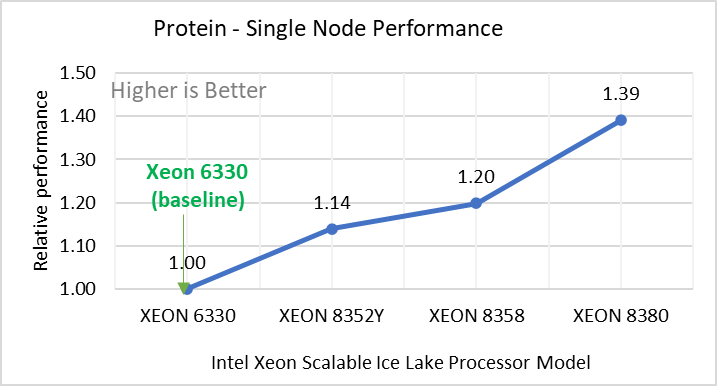
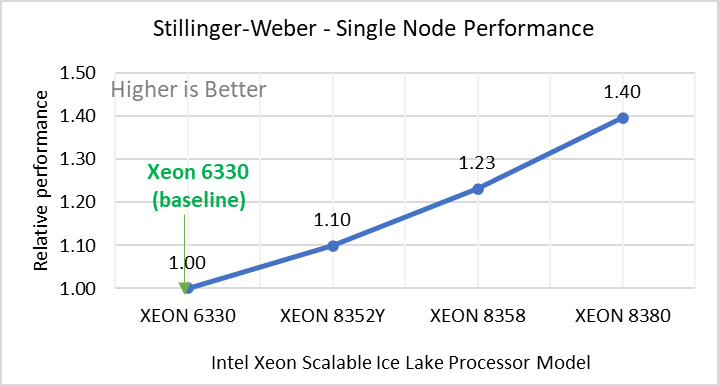
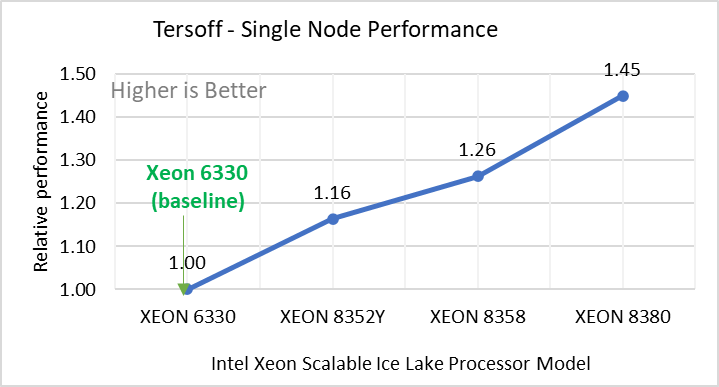
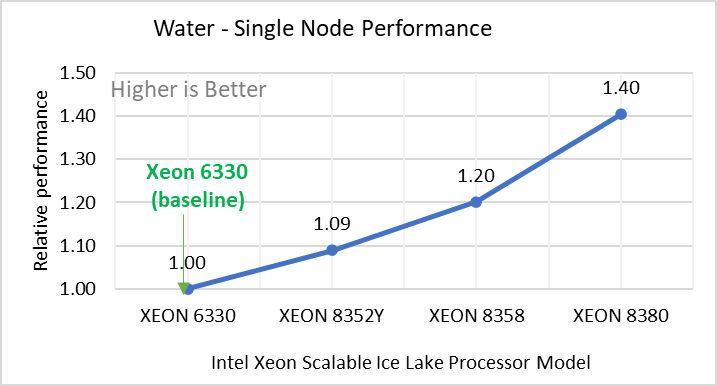
Figure 2: Single Node Performance of LAMMPS across the datasets with Intel Ice Lake processor model. Each graph in Figure 2 is an individual subfigure, labeled (a-h) in the order shown. Each subfigure (2a- 2h) represents single node performance comparison across the Xeon processors with Xeon 6330 as baseline for Atomic Fluid (Lennard Jones), rhodo(protein), liquid crystal(lc), copper(eam), stilliger webner(sw), Terasoff, water, polyethylene datasets respectively.
Figure 2 shows the single node performance for the eight datasets (sub figure 2a-h) listed in Table 2 with the four Ice Lake processor model available for evaluation of LAMMPS.
For ease of comparison across the processor model, the relative performance of the datasets has been included into a different graph. However, it is worth noting that each dataset behaves individually when performance is considered, as each uses different molecular potentials and have different number of atoms. Figure 2 shows that increases in the core count in the processor model increases the performance, across the dataset used. Next, by comparing the relative numbers to the baseline processor Xeon 6330(28C) with Xeon 8380(40C), we measured a 30 to 45 percent performance gain with these datasets. A fraction of these boosts was due to frequency of the processor model.
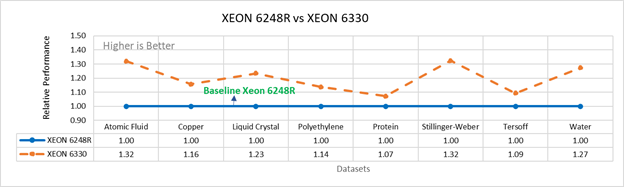
Figure 3a: Performance of LAMMPS on Cascade Lake (Xeon 6248R) in comparison to Ice Lake (Xeon 6330)
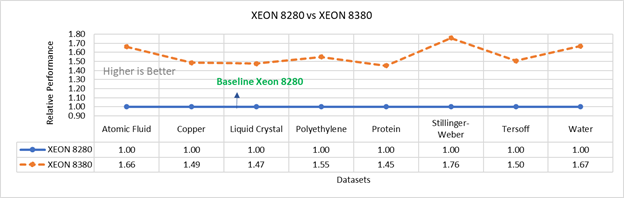
Figure 3b: Performance of LAMMPS on Cascade Lake (Xeon 8280) in comparison to Ice Lake (Xeon 8380)
Figure 3 compares the performance of the mid-bin Cascade Lake 6248R (24core) to the Ice Lake 6330 (28 core), and the top end Cascade Lake 8280 (28 core) to the Ice Lake 8380 (40 core) From the figure 3a, Ice Lake 6330 is up to 30 percent faster than the 6248R. The Xeon 6330 has 16 percent more cores, and 9 percent faster memory bandwidth. Figure 3b shows Ice Lake 8380 is up to 75 percent faster than the Xeon 8280 on single node tests, this is in line with the 42 percent additional cores and 9 percent faster memory bandwidth. These results are due to a higher processor speed wherein more data can be accessed by each core.
Performance Analysis on Multi-Node
To analyze the scalability test with strong and weak scaling, we used the Atom Fluid (LJ) dataset from the Intel package. The job run time was 7900 steps with 512000 atoms in the simulation system.
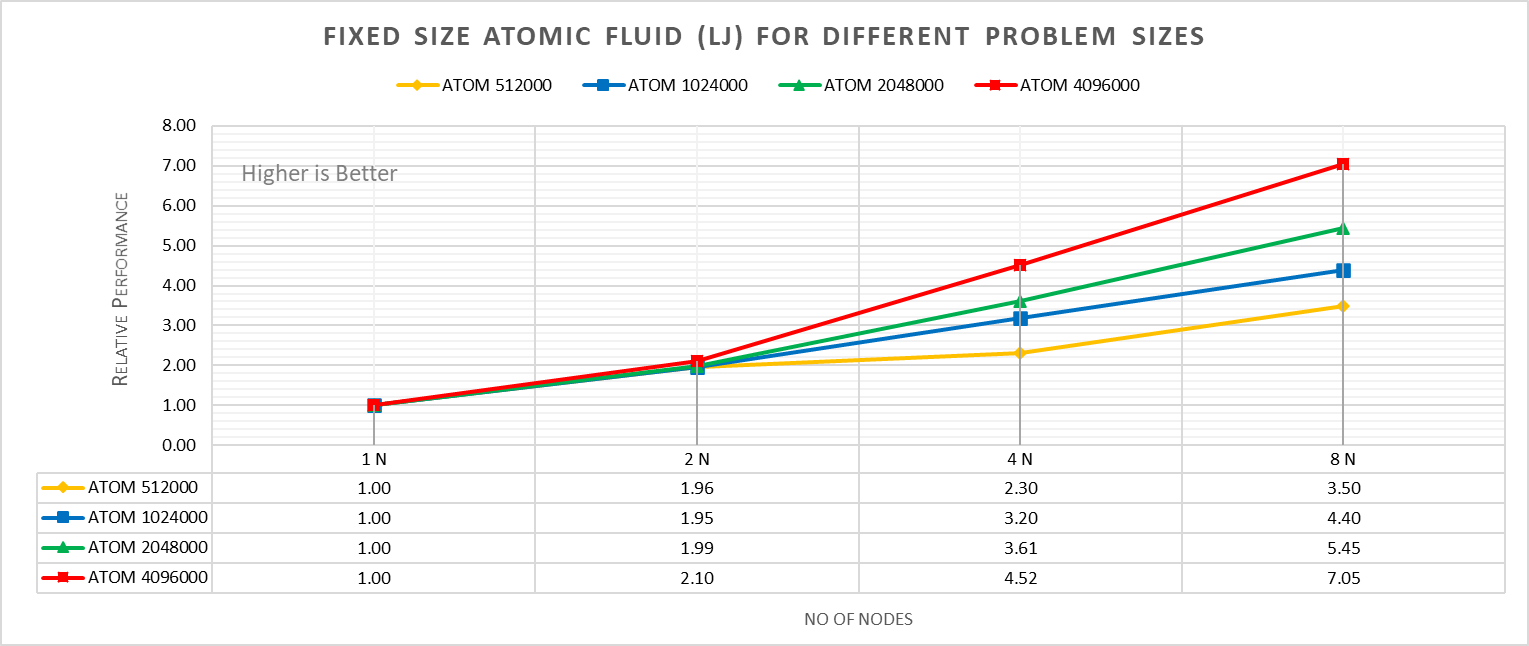
Figure 4a: Fixed size Atomic fluid (LJ) for different problem size (strong scaling) w/ Xeon 8380
With strong scaling, we referred to the fixed problem size and increasing the parallel processes (Amdahl’s law). Whereas in weak scaling, we varied the atom size from 512000 atoms to 4096000 atoms in the simulation environment with an increase in the parallel processes (Gustafson-Barsis law). The test bed included DellEMC Poweredge R750 servers each with dual Ice Lake Xeon 8380 processors an NVIDIA Networking HDR interconnect running at 200 Gbps.Figure 4a plots the fixed-size relative performance for four different problem sizes, viz, 512000,1024000,2048000, and 4096000 atoms, on different number of nodes.
The relative performance is normalized by single node performance. Hence, the single node performance for each curve is 1.00 (unity). Relative Performance for fixed size Atomic fluid was calculated by the following equation:
Relative Performance = loop time of ‘N’ node / loop time for single node
Loop time is the total wall-clock time for the simulation to run. It can be observed that relative performance increases with increase in problem size. This is because for smaller problems system spend more time in inter-nodal communications. Time spent in communication at 8 nodes is 61.91%, 59.74%,48.42%,45.04% for 512000,1024000,2048000,4096000 atom size respectively.
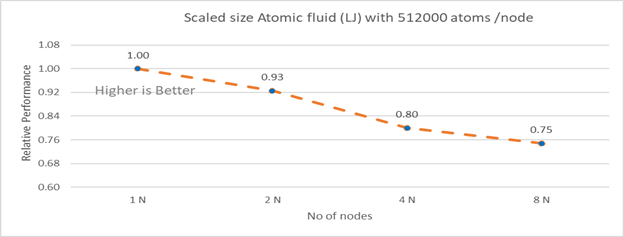
Figure 4b: Scaled size Atomic fluid (LJ) with 512000 atoms per node (weak scaling) w/ Xeon 8380
Figure 4b plots the scaled-size efficiency for runs with 512000 atoms per node. Thus, a scaled-size 2 node run is for 1024000 atoms; 8 node runs is for 4096000 atoms. Relative Performance for Scaled size Atomic fluid was calculated by the following equation:
Relative Performance= loop time for ‘n’ node/ (loop time for single node * number of nodes)
Weak scaling efficiency decreases with increase in no of nodes in the investigated range. This is due to the fact for larger number of nodes the time spend in MPI communication is larger. Time spent in communication with scaled size atom for 1N, 2N, 4N and 8 N are 27.17%, 32.42 %, 40.87%, 45.04 % respectively.
Figure 5: Multi-node efficiency for Atomic Fluid (LJ) w/ I 8380
Figure 5 plots the multi-node efficiency for Atomic Fluid with Xeon 8380. The relative performance is normalized by single node with 512000 atoms performance. Hence, the single node performance for 512000 atoms is 1.00 (unity). This point is taken as baseline for other comparison.
Performance Rating = (loop time * number of atoms)/ (loop time for 512000 atoms on 1 node * number of nodes * 512000)
We observed that for smaller systems, such as those with fewer atoms, the efficiency of strong scaling decreases as the system spends more time in MPI communication; whereas in larger systems with many atoms, the efficiency of strong scaling increases as the time spent in pair-wise force calculation becomes dominant. For weak scaling, as the no of nodes increases the efficiency of weak scaling decreases.
Conclusion
The Ice Lake processor-based Dell EMC Power Edge servers, with its hardware feature upgrades over Cascade Lake, demonstrate up to 50 to70 percent performance gain for all the datasets used for benchmarking LAMMPS. Watch our blog site for updates!

MD Simulation of GROMACS with AMD EPYC 7003 Series Processors on Dell EMC PowerEdge Servers
Thu, 19 Aug 2021 20:06:53 -0000
|Read Time: 0 minutes
AMD has recently announced and launched its third generation 7003 series EPYC processors family (code named Milan). These processors build upon the proceeding generation 7002 series (Rome) processors and improve L3 cache architecture along with an increased memory bandwidth for workloads such as High Performance Computing (HPC).
The Dell EMC HPC and AI Innovation Lab has been evaluating these new processors with Dell EMC’s latest 15G PowerEdge servers and will report our initial findings for the molecular dynamics (MD) application GROMACs in this blog.
Given the enormous health impact of the ongoing COVID-19 pandemic, researchers and scientists are working closely with the HPC and AI Innovation Lab to obtain the appropriate computing resources to improve the performance of molecular dynamics simulations. Of these resources, GROMACS is an extensively used application for MD simulations. It has been evaluated with the standard datasets by combining the latest AMD EPYC Milan processor (based on Zen 3 cores) with Dell EMC PowerEdge servers to get most out of the MD simulations.
In a previous blog, Molecular Dynamic Simulation with GROMACS on AMD EPYC- ROME, we published benchmark data for a GROMACS application study on a single node and multinode with AMD EPYC ROME based Dell EMC servers.
The results featured in this blog come from the test bed described in the following table. We performed a single-node and multi-node application study on Milan processors, using the latest AMD stack shown in Table 1, with GROMACS 2020.4 to understand the performance improvement over the older generation processor (Rome).
Table 1: Testbed hardware and software details
Server | Dell EMC PowerEdge 2-socket servers (with AMD Milan processors) | Dell EMC PowerEdge 2-socket servers (with AMD Rome processors) |
Processor Cores/socket Frequency (Base-Boost ) Default TDP Processor bus speed | 7763 (Milan) 64 2.45 GHz – 3.5 GHz 280 W 256 MB 16 GT/s | 7H12 (Rome) 64 2.6 GHz – 3.3 GHz 280 W 256 MB 16 GT/s |
Processor Cores/socket Frequency Default TDP Processor bus speed | 7713 (Milan) 64 2.0 GHz – 3.675 GHz 225 W 256 MB 16 GT/s | 7702 (Rome) 64 2.0 GHz – 3.35 GHz 200 W 256 MB 16 GT/s |
Processor Cores/socket Frequency Default TDP Processor bus speed | 7543 (Milan) 32 2.8 GHz – 3.7 GHz 225 W 256 MB 16 GT/s | 7542 (Rome) 32 2.9 GHz – 3.4 GHz 225 W 128 MB 16 GT/s |
Operating system | Red Hat Enterprise Linux 8.3 (4.18.0-240.el8.x86_64) | Red Hat Enterprise Linux 7.8 |
Memory | DDR4 256 G (16 GB x 16) 3200 MT/s | |
BIOS/CPLD | 2.0.2 / 1.1.12 |
|
Interconnect | NVIDIA Mellanox HDR | NVIDIA Mellanox HDR 100 |
Table 2: Benchmark datasets used for GROMACS performance evaluation
Datasets | Details |
1536 K and 3072 K | |
1400 K and 3000 K | |
Prace – Lignocellulose | 3M |
The following information describes the performance evaluation for the processor stack listed in the Table 1.
Rome processors compared to Milan processors (GROMACS)
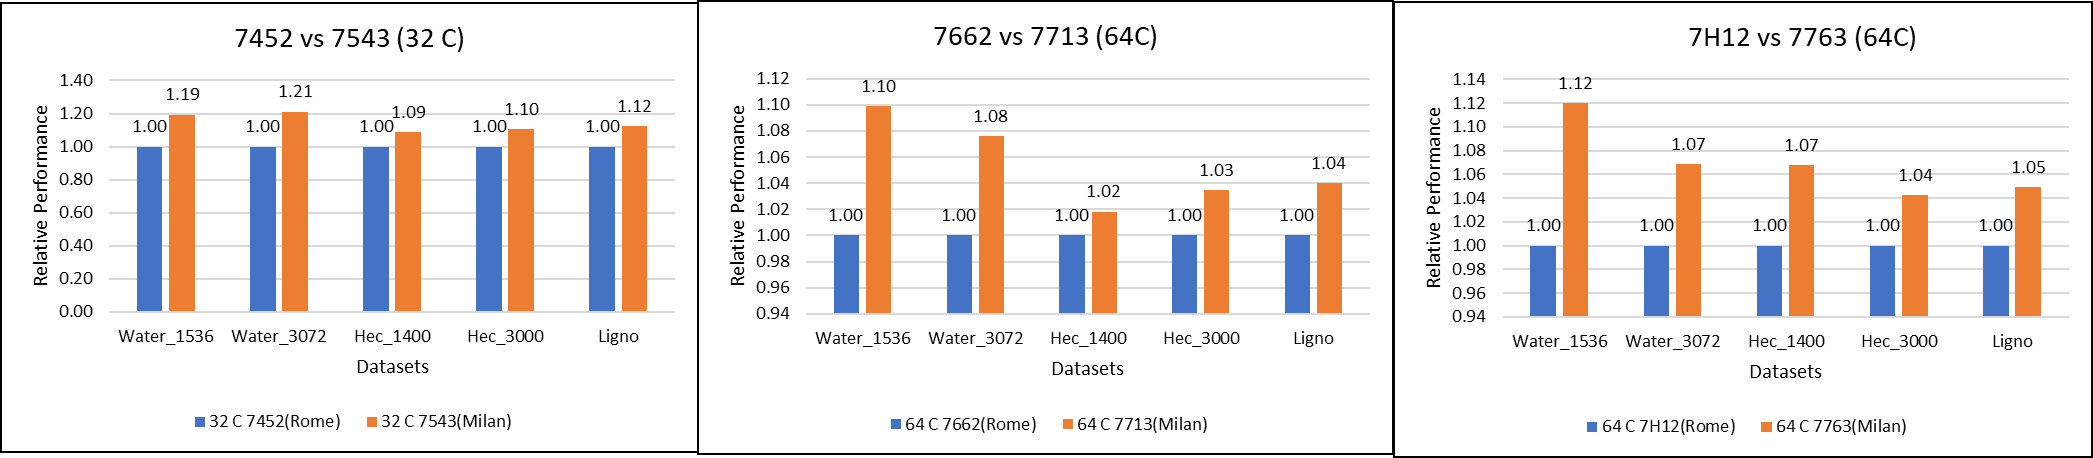 Figure 1: GROMACS performance comparison with AMD Rome processors
For performance benchmark comparisons, we selected Rome processors that are closest to their Milan counterparts in terms of hardware features such as cache size, TDP values, and Processor Base/Turbo Frequency, and marked the maximum value attained for Ns/day by each of the datasets mentioned in Table 2.
Figure 1 shows a 32C Milan processor has higher performance improvements (19 percent for water 1536, 21 percent for water 3072, and 10 to approximately 12 percent with HECBIO sim and lingo cellulose datasets) compared to a 32C Rome processor. This result is due to a higher processor speed and improved L3 cache, wherein more data can be accessed by each core.
Next, with the higher end processor we see only 10 percent gain with respect to the water dataset, as they are more memory intensive. Some percentage is added on due to improvement of frequency for the remaining datasets. Overall, the Milan processor results demonstrated a substantial performance improvement for GROMACS over Rome processors.
Milan processors comparison (32C processors compared to 64C processors)
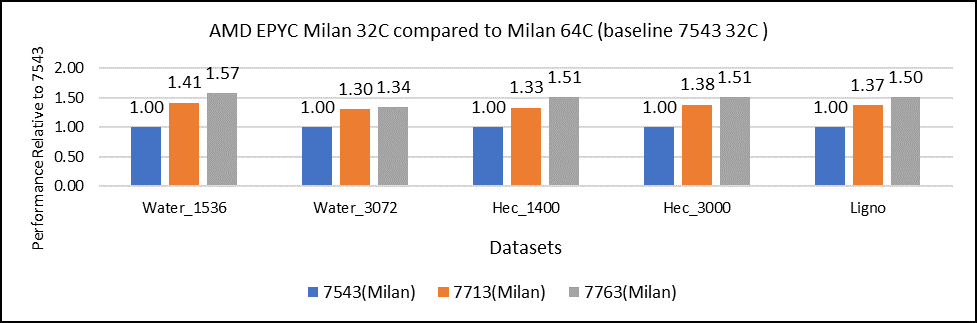
Figure 2: GROMACS performance with Milan processors
Figure 2 shows performance relative to the performance obtained on the 7543 processor. For instance, the performance of water 1536 is improved from the 32C processor to the 64 core (64C) processor from 41 percent (7713 processor) to 57 percent (7763 processor). The performance improvement is due to the increasing core counts and higher CPU core frequency performance improvement. We observed that GROMACS is frequency sensitive, but not to a great extent. Greater gains may be seen when running GROMACS across multiple ensembles runs or running dataset with higher number of atoms.
We recommend that you compare the price-to-performance ratio before choosing the processor based on the datasets with higher CPU core frequency, as the processors with a higher number of lower-frequency cores may provide better total performance.
Multi-node study with 7713 64C processors
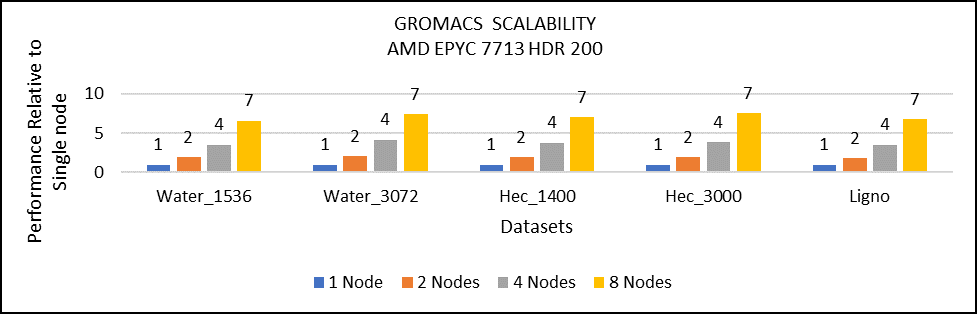
Figure 3: Multi-node study with 7713 64c SKUs
For multi-node tests, the test bed was configured with an NVIDIA Mellanox HDR interconnect running at 200 Gbps and each server included an AMD EPYC 7713 processor. We achieved the expected linear performance scalability for GROMACS of up to four nodes and across each of the datasets. All cores in each server were used while running the benchmarks. The performance increases are close to linear across all the dataset types as core count increases.
Conclusion
For the various datasets we evaluated, GROMACS exhibited strong scaling and was compute intensive. We recommend a processor with high core count for smaller datasets (water 1536, hec 1400); larger datasets (water 3072, ligno,HEC 3000) would benefit from memory per core. Configuring the best BIOS options is important to get the best performance out of the system.
For more information and updates, follow this blog site.

New Frontiers—Dell EMC PowerEdge R750xa Server with NVIDIA A100 GPUs
Tue, 01 Jun 2021 20:18:04 -0000
|Read Time: 0 minutes
Dell Technologies has released the new PowerEdge R750xa server, a GPU workload-based platform that is designed to support artificial intelligence, machine learning, and high-performance computing solutions. The dual socket/2U platform supports 3rd Gen Intel Xeon processors (code named Ice Lake). It supports up to 40 cores per processor, has eight memory channels per CPU, and up to 32 DDR4 DIMMs at 3200 MT/s DIMM speed. This server can accommodate up to four double-width PCIe GPUs that are located in the front left and the front right of the server.
Compared with the previous generation PowerEdge C4140 and PowerEdge R740 GPU platform options, the new PowerEdge R750xa server supports larger storage capacity, provides more flexible GPU offerings, and improves the thermal requirement
Figure 1 PowerEdge R750xa server
The NVIDIA A100 GPUs are built on the NVIDIA Ampere architecture to enable double precision workloads. This blog evaluates the new PowerEdge R750xa server and compares its performance with the previous generation PowerEdge C4140 server.
The following table shows the specifications for the NVIDIA GPU that is discussed in this blog and compares the performance improvement from the previous generation.
Table 1 NVIDIA GPU specifications
PCIe | Improvement | ||
GPU name | A100 | V100 |
|
GPU architecture | Ampere | Volta | - |
GPU memory | 40 GB | 32 GB | 60% |
GPU memory bandwidth | 1555 GB/s | 900 GB/s | 73% |
Peak FP64 | 9.7 TFLOPS | 7 TFLOPS | 39% |
Peak FP64 Tensor Core | 19.5 TFLOPS | N/A | - |
Peak FP32 | 19.5 TFLOPS | 14 TFLOPS | 39% |
Peak FP32 Tensor Core | 156 TFLOPS 312 TFLOPS* | N/A | - |
Peak Mixed Precision FP16 ops/ FP32 Accumulate | 312 TFLOPS 624 TFLOPS* | 125 TFLOPS | 5x |
GPU base clock | 765 MHz | 1230 MHz | - |
Peak INT8 | 624 TOPS 1,248 TOPS* | N/A | - |
GPU Boost clock | 1410 MHz | 1380 MHz | 2.1% |
NVLink speed | 600 GB/s | N/A | - |
Maximum power consumption | 250 W | 250 W | No change |
Test bed and applications
This blog quantifies the performance improvement of the GPUs with the new PowerEdge GPU platform.
Using a single node PowerEdge R750xa server in the Dell HPC & AI Innovation Lab, we derived all results presented in this blog from this test bed. This section describes the test bed and the applications that were evaluated as part of the study. The following table provides test environment details:
Table 2 Server configuration
Component | Test Bed 1 | Test Bed 2 |
Server | Dell PowerEdge R750xa
| Dell PowerEdge C4140 configuration M |
Processor | Intel Xeon 8380 | Intel Xeon 6248 |
Memory | 32 x 16 GB @ 3200MT/s | 16 x 16 GB @ 2933MT/s |
Operating system | Red Hat Enterprise Linux 8.3 | Red Hat Enterprise Linux 8.3 |
GPU | 4 x NVIDIA A100-PCIe-40 GB GPU | 4 x NVIDIA V100-PCIe-32 GB GPU |
The following table provides information about the applications and benchmarks used:
Table 3 Benchmark and application details
Application | Domain | Version | Benchmark dataset |
High-Performance Linpack | Floating point compute-intensive system benchmark | xhpl_cuda-11.0-dyn_mkl-static_ompi-4.0.4_gcc4.8.5_7-23-20 | Problem size is more than 95% of GPU memory |
HPCG | Sparse matrix calculations | xhpcg-3.1_cuda_11_ompi-3.1 | 512 * 512 * 288
|
GROMACS | Molecular dynamics application | 2020 | Ligno Cellulose Water 1536 Water 3072 |
LAMMPS | Molecular dynamics application | 29 October 2020 release | Lennard Jones |
LAMMPS
Large-Scale Atomic/Molecular Massively Parallel simulator (LAMMPS) is distributed by Sandia National Labs and the US Department of Energy. LAMMPS is open-source code that has different accelerated models for performance on CPUs and GPUs. For our test, we compiled the binary using the KOKKOS package, which runs efficiently on GPUs.
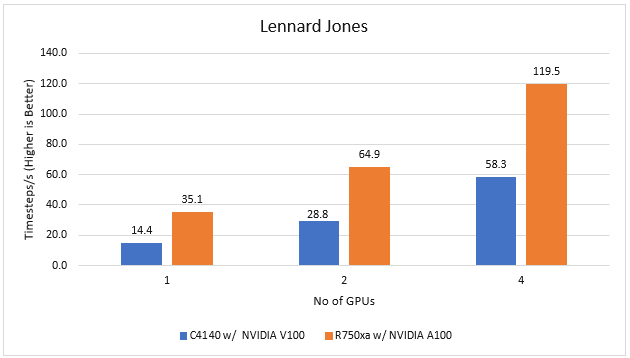
Figure 2 LAMMPS Performance on PowerEdge R750xa and PowerEdge C4140 servers
With the newer generation GPUs, this application improves 2.4 times compared to single GPU performance. The overall performance from a single server improved twice with the PowerEdge R750xa server and NVIDIA A100 GPUs.
GROMACS
GROMACS is a free and open-source parallel molecular dynamics package designed for simulations of biochemical molecules such as proteins, lipids, and nucleic acids. It is used by a wide variety of researchers, particularly for biomolecular and chemistry simulations. GROMACS supports all the usual algorithms expected from modern molecular dynamics implementation. It is open-source software with the latest versions available under the GNU Lesser General Public License (LGPL).
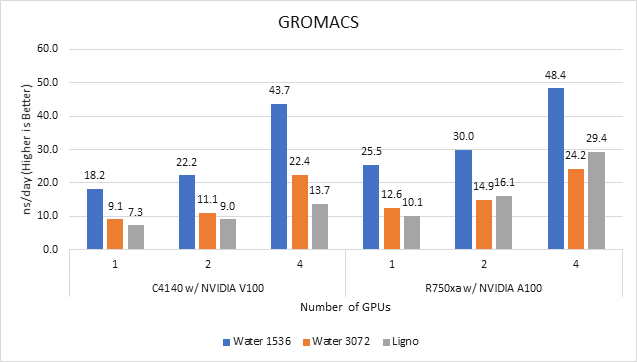
Figure 3 GROMACS performance on PowerEdge C4140 and r750xa servers
With the newer generation GPUs, this application improved approximately 1.5 times across the dataset compared to single GPU performance. The overall performance from a single server improved 1.5 times with a PowerEdge R750xa server and NVIDIA A100 GPUs.
High-Performance Linpack
High-Performance Linpack (HPL) needs no introduction in the HPC arena. It is a widely used standard benchmark tests in the industry.
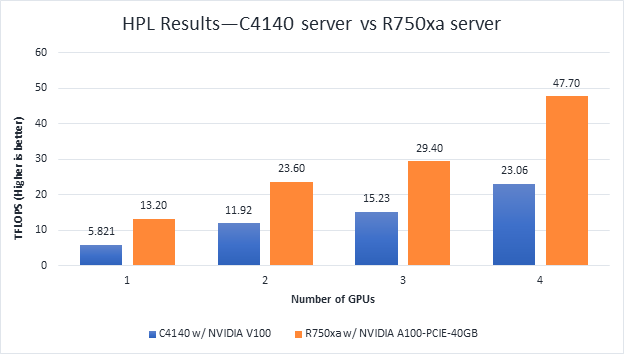
Figure 4 HPL Performance on the PowerEdge R750xa server with A100 GPU and PowerEdge C4140 server with V100 GPU
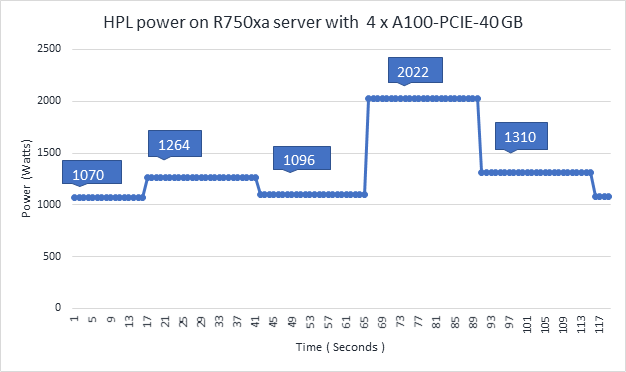
Figure 5 Power use of the HPL running on NVIDIA GPUs
From Figure 4 and Figure 5, the following results were observed:
- Performance—For GPU count, the NVIDIA A100 GPU demonstrates twice the performance of the NVIDIA V100 GPU. Higher memory size, double precision FLOPS, and a newer architecture contribute to the improvement for the NVIDIA A100 GPU.
- Scalability—The PowerEdge R750xa server with four NVIDIA A100-PCIe-40 GB GPUs delivers 3.6 times higher HPL performance compared to one NVIDIA A100-PCIE-40 GB GPU. The NVIDIA A100 GPUs scale well inside the PowerEdge R750xa server for the HPL benchmark.
- Higher Rpeak—The HPL code on NVIDIA A100 GPUs uses the new double-precision Tensor cores. The theoretical peak for each GPU is 19.5 TFlops, as opposed to 9.7 TFlops.
- Power—Figure 5 shows power consumption of a complete HPL run with the PowerEdge R750xa server using four A100-PCIe GPUs. This result was measured with iDRAC commands, and the peak power consumption was observed as 2022 Watts. Based on our previous observations, we know that the PowerEdge C4140 server consumes approximately 1800 W of power.
HPCG
Figure 6 Scaling GPU performance data for HPCG Benchmark
As discussed in other blogs, high performance conjugate gradient (HPCG) is another standard benchmark to test data access patterns of sparse matrix calculations. From the graph, we see that the HPCG benchmark scales well with this benchmark resulting in 1.6 times performance improvement over the previous generation PowerEdge C4140 server with an NVIDIA V100 GPU.
The 72 percent improvement in memory bandwidth of the NVIDIA A100 GPU over the NVIDIA V100 GPU contributes to the performance improvement.
Conclusion
In this blog, we introduced the latest generation PowerEdge R750xa platform and discussed the performance improvement over the previous generation PowerEdge C4140 server. The PowerEdge R750xa server is a good option for customers looking for an Intel Xeon scalable CPU-based platform powered with NVIDIA GPUs.
With the newer generation PowerEdge R750xa server and NVIDIA A100 GPUs, the applications discussed in this blog show significant performance improvement.
Next steps
In future blogs, we plan to evaluate NVLINK bridge support, which is another important feature of the PowerEdge R750xa server and NVIDIA A100 GPUs.

Intel Ice Lake - BIOS Characterization for HPC
Tue, 25 May 2021 13:10:03 -0000
|Read Time: 0 minutes
Intel recently announced the 3rd Generation Intel Xeon Scalable processors (code-named “Ice Lake”), which are based on a new 10 nm manufacturing process. This blog provides the new Ice Lake processor synthetic benchmark results and the recommended BIOS settings on Dell EMC PowerEdge servers.
Ice Lake processors offer a higher core count of up to 40 cores with a single Ice Lake 8380 processor. The Ice Lake processors have larger L3, L2, and L1 data cache than Intel’s second-generation Cascade Lake processors. These features are expected to improve performance of CPU-bound software applications. Table 1 shows the L1, L2, and L3 cache size on the 8380 processor model.
Ice Lake still supports the AVX 512 SIMD instructions, which allow for 32 DP FLOP/cycle. The upgraded Ultra Path Interconnect (UPI) Link speed of 11.2GT/s is expected to improve data movement between the sockets. In addition to core count and frequency, Ice Lake-based Dell EMC PowerEdge servers support DDR4 - 3200 MT/s DIMMS with eight memory channels per processor, which is expected to improve the performance of memory bandwidth-bound applications. Ice Lake processors now support DIMMs with 6 TB per socket.
Instructions such as Vector CLMUL, VPMADD52, Vector AES, and GFNI Extensions have been optimized to improve use of vector registers. The performance of software applications in the cryptography domain is also expected to benefit. The Ice Lake processor also includes improvements to Intel Speed Select Technology (Intel SST). With Intel SST, a few cores from the total available cores can be operated at a higher base frequency, turbo frequency, or power. This blog does not address this feature.
Table 1: hwloc-ls and numactl -H command output on an Intel 8380 processor model-based server with Round Robin core enumeration (MadtCoreEnumeration) and SubNumaCuster(Sub-NUMA Cluster) set to 2-Way
hwloc-ls | numactl -H |
Machine (247GB total) Package L#0 + L3 L#0 (60MB) Group0 L#0 NUMANode L#0 (P#0 61GB) L2 L#0 (1280KB) + L1d L#0 (48KB) + L1i L#0 (32KB) + Core L#0 + PU L#0 (P#0) L2 L#1 (1280KB) + L1d L#1 (48KB) + L1i L#1 (32KB) + Core L#1 + PU L#1 (P#4) L2 L#2 (1280KB) + L1d L#2 (48KB) + L1i L#2 (32KB) + Core L#2 + PU L#2 (P#8) L2 L#3 (1280KB) + L1d L#3 (48KB) + L1i L#3 (32KB) + Core L#3 + PU L#3 (P#12) L2 L#4 (1280KB) + L1d L#4 (48KB) + L1i L#4 (32KB) + Core L#4 + PU L#4 (P#16) L2 L#5 (1280KB) + L1d L#5 (48KB) + L1i L#5 (32KB) + Core L#5 + PU L#5 (P#20) L2 L#6 (1280KB) + L1d L#6 (48KB) + L1i L#6 (32KB) + Core L#6 + PU L#6 (P#24) L2 L#7 (1280KB) + L1d L#7 (48KB) + L1i L#7 (32KB) + Core L#7 + PU L#7 (P#28) L2 L#8 (1280KB) + L1d L#8 (48KB) + L1i L#8 (32KB) + Core L#8 + PU L#8 (P#32) L2 L#9 (1280KB) + L1d L#9 (48KB) + L1i L#9 (32KB) + Core L#9 + PU L#9 (P#36) L2 L#10 (1280KB) + L1d L#10 (48KB) + L1i L#10 (32KB) + Core L#10 + PU L#10 (P#40) L2 L#11 (1280KB) + L1d L#11 (48KB) + L1i L#11 (32KB) + Core L#11 + PU L#11 (P#44) L2 L#12 (1280KB) + L1d L#12 (48KB) + L1i L#12 (32KB) + Core L#12 + PU L#12 (P#48) L2 L#13 (1280KB) + L1d L#13 (48KB) + L1i L#13 (32KB) + Core L#13 + PU L#13 (P#52) L2 L#14 (1280KB) + L1d L#14 (48KB) + L1i L#14 (32KB) + Core L#14 + PU L#14 (P#56) L2 L#15 (1280KB) + L1d L#15 (48KB) + L1i L#15 (32KB) + Core L#15 + PU L#15 (P#60) L2 L#16 (1280KB) + L1d L#16 (48KB) + L1i L#16 (32KB) + Core L#16 + PU L#16 (P#64) L2 L#17 (1280KB) + L1d L#17 (48KB) + L1i L#17 (32KB) + Core L#17 + PU L#17 (P#68) L2 L#18 (1280KB) + L1d L#18 (48KB) + L1i L#18 (32KB) + Core L#18 + PU L#18 (P#72) L2 L#19 (1280KB) + L1d L#19 (48KB) + L1i L#19 (32KB) + Core L#19 + PU L#19 (P#76) HostBridge. <snip> . .
| |
BIOS options tested on Ice Lake processors
Table 2 provides the server details used for the performance tests. The following BIOS options were explored in the performance testing:
- BIOS.ProcSettings.SubNumaCluster—Breaks up the LLC into disjoint clusters based on address range, with each cluster bound to a subset of the memory controllers in the system. It improves average latency to the LLC. Sub-NUMA Cluster (SNC) is disabled if NVDIMM-N is installed in the system.
- BIOS.ProcSettings.DeadLineLlcAlloc—If enabled, fills in dead lines in LLC opportunistically.
- BIOS.ProcSettings.LlcPrefetch—Enables and disables LLC Prefetch on all threads.
- BIOS.ProcSettings.XptPrefetch—If enabled, enables the MS2IDI to take a read request that is being sent to the LLC and speculatively issue a copy of that read request to the memory controller.
- BIOS.ProcSettings.UpiPrefetch—Starts the memory read early on the DDR bus. The UPI Rx path spawns a MemSpecRd to iMC directly.
- BIOS.ProcSettings.DcuIpPrefetcher (Data Cache Unit IP Prefetcher)—Affects performance, depending on the application running on the server. This setting is recommended for High Performance Computing applications.
- BIOS.ProcSettings.DcuStreamerPrefetcher (Data Cache Unit Streamer Prefetcher)—Affects performance, depending on the application running on the server. This setting is recommended for High Performance Computing applications.
- BIOS.ProcSettings.ProcAdjCacheLine—When set to Enabled, optimizes the system for applications that require high utilization of sequential memory access. Disable this option for applications that require high utilization of random memory access.
- BIOS.SysProfileSettings.SysProfile—Sets the System Profile to Performance Per Watt (DAPC), Performance Per Watt (OS), Performance, Workstation Performance, or Custom mode. When set to a mode other than Custom, the BIOS sets each option accordingly. When set to Custom, you can change setting of each option.
- BIOS.ProcSettings.LogicalProc—Reports the logical processors. Each processor core supports up to two logical processors. When set to Enabled, the BIOS reports all logical processors. When set to Disabled, the BIOS only reports one logical processor per core. Generally, a higher processor count results in increased performance for most multithreaded workloads. The recommendation is to keep this option enabled. However, there are some floating point and scientific workloads, including HPC workloads, where disabling this feature might result in higher performance.
You can set the DeadLineLlcAlloc, LlcPrefetch, XptPrefetch, UpiPrefetch, DcuIpPrefetcher, DcuStreamerPrefetcher, ProcAdjCacheLine, and LogicalProc BIOS options to either Enabled or Disabled. You can set the SubNumaCluster to 2-Way and Disabled. The SysProfile setting can have five possible values: PerformanceOptimized, PerfPerWattOptimizedDapc, PerfPerWattOptimizedOs, PerfWorkStationOptimized and Custom.
Table 2: Test bed hardware and software details
Component | Dell EMC PowerEdge R750 server | Dell EMC PowerEdge C6520 server | Dell EMC PowerEdge C6420 server | Dell EMC PowerEdge C6420 server |
OPN | 8380 | 6338 | 8280 | 6252 |
Cores/Socket | 40 | 32 | 28 | 24 |
Frequency (Base-Boost) | 2.30 – 3.40 GHz | 2.0 – 3.20 GHz | 2.70 – 4.0 GHz | 2.10 – 3.70 GHz |
TDP | 270 W | 205 W | 205 W | 150 W |
L3Cache | 60M | 48M | 38.5M | 37.75M |
Operating System | Red Hat Enterprise Linux 8.3 4.18.0-240.22.1.el8_3.x86_64 | Red Hat Enterprise Linux 8.3 4.18.0-240.22.1.el8_3.x86_64 | Red Hat Enterprise Linux 8.3 4.18.0-240.el8.x86_64 | Red Hat Enterprise Linux 8.3 4.18.0-240.el8.x86_64 |
Memory | 16 GB x 16 (2Rx8) 3200 MT/s | 16 GB x 16 (2Rx8) 3200 MT/s | 16 GB x 12 (2Rx8) 2933 MT/s | 16 GB x 12 (2Rx8) 2933 MT/s |
BIOS/CPLD | 1.1.2/1.0.1 | |||
Interconnect | NVIDIA Mellanox HDR | NVIDIA Mellanox HDR | NVIDIA Mellanox HDR100 | NVIDIA Mellanox HDR100 |
Compiler | Intel parallel studio 2020 (update 4) | |||
Benchmark software |
| |||
The system profile BIOS meta option helps to set a group of BIOS options (such as C1E, C States, and so on), each of which control performance and power management settings to a particular value. It is also possible to set these groups of BIOS options individually to a different value using the Custom system profile.
Application performance results
Table 2 lists details about the software used for benchmarking the server. We used the precompiled HPL and HPCG binary files, which are part of Intel Parallel Studio 2020 update 4 software bundle, for our tests. We compiled the WRF application with AVX2 support. WRF and HPCG issue many nonfloating point packed micro-operations (approximately 73 percent to 90 percent of the total packed micro-operations). They are memory-bound (and DRAM-bandwidth bound) workloads. HPL issues packed double precision micro-operations and is a compute-bound workload.
After setting Sub-NUMA Cluster (BIOS.ProcSettings.SubNumaCluster) to 2-Way, Logical Processors (BIOS.ProcSettings.LogicalProc) to Disabled, and other settings (DeadLineLlcAlloc, LlcPrefetch, XptPrefetch, UpiPrefetch, DcuIpPrefetcher, DcuStreamerPrefetcher, ProcAdjCacheLine) to Enabled, we measured the impact of System Profile (BIOS.SysProfileSettings.SysProfile) BIOS parameters on application performance.
Figure 1 through Figure 4 show application performance. In each figure, the numbers over the bars represent the relative change in the application performance with respect to the application performance obtained on the Intel 6338 Ice Lake processor with the System Profile set to Performance Optimized (PO).
Note: In the figures, PO=PerformanceOptimized, PPWOD=PerfPerWattOptimizedDapc, PPWOO=PerfPerWattOptimizedOs, and PWSO=PerfWorkStationOptimized.
HPL Benchmark
Figure 1: Relative difference in the performance of HPL by processor and Sysprofile setting
HPCG Benchmark
Figure 2: Relative difference in the performance of HPCG by processor and Sysprofile setting
STREAM Benchmark
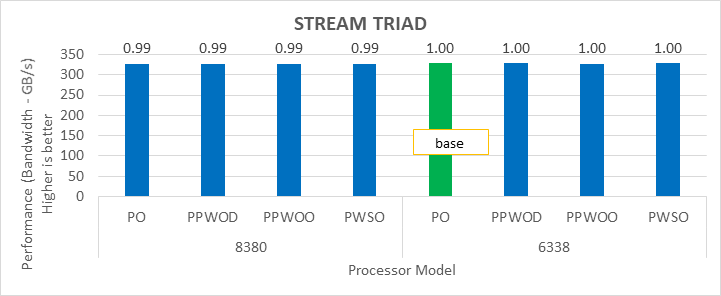
Figure 3: Relative difference in the performance of STREAM by processor and Sysprofile setting
WRF Benchmark
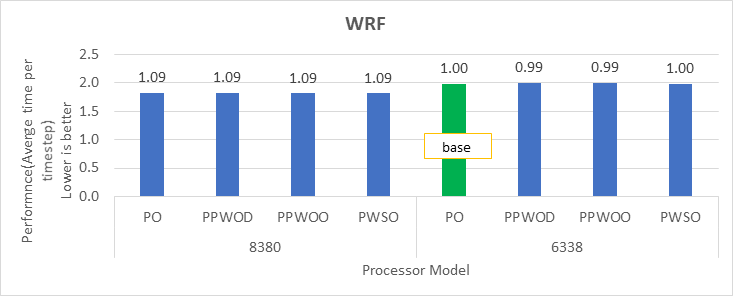
Figure 4: Relative difference in the performance of WRF by processor and Sysprofile setting
We obtained the performance for the applications in Figure 2 through Figure 4 by fully subscribing to all available cores. Depending on the processor model, we achieved 78 percent to 80 percent efficiency with HPL and STREAM benchmarks using the Performance Optimized profile.
Intel has extended the TDP of the Ice Lake processors with the top-end Intel 8380 processor at 270 W TDP. The following figure shows the power use on the systems with the applications listed in Table 2.Note: In this figure, PO=PerformanceOptimized, PPWOD=PerfPerWattOptimizedDapc, PPWOO=PerfPerWattOptimizedOs and PWSO=PerfWorkStationOptimized
Figure 5: Power use by platform and processor type. Average Idle power usage on the PowerEdge C6520 server (Intel 6338 processor) with approximately 335 W and the PowerEdge R750 server (intel 8380 processor) with approximately 470 W using the Performance Optimized System Profile.
When SNC is set to 2-Way, the system exposes four NUMA nodes. We tested the NUMA bandwidth, remote socket bandwidth, and local socket bandwidth using the STREAM TRIAD benchmark. In Figure 6, the CPU NUMA node is represented as c and the memory node is represented as m. As an example for NUMA bandwidth, the c0m0 (blue bars) test type represents the STREAM TRIAD test carried out between NUMA node 0 and memory node 0. Figure 6 shows the best bandwidth numbers obtained on varying the number of threads per test type.
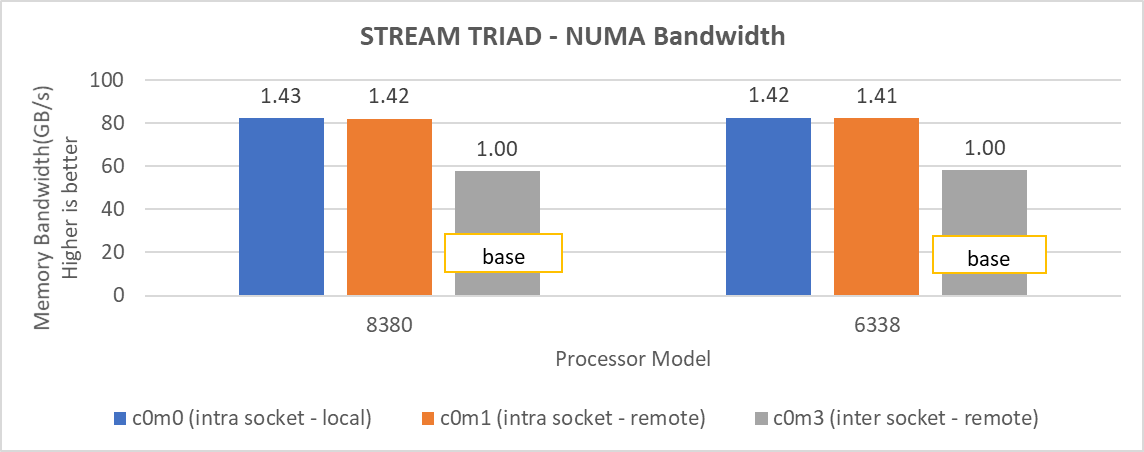
Figure 6: Local and remote NUMA memory bandwidth.
Remote socket bandwidth numbers were measured between CPU node 0, 1 and memory node 2, 3. Local bandwidths were measured between CPU node 0, 1, and 0, 1. The following figure shows the performance numbers.
Figure 7: Local and remote processor bandwidth.
Impact of BIOS options on application performance
We tested the impact of the DeadLineLlcAlloc, LlcPrefetch, XptPrefetch, UpiPrefetch, DcuIpPrefetcher, DcuStreamerPrefetcher and ProcAdjCacheLine with the Performance Optimized (PO) system profile. These BIOS options do not have significant impact on the performance of applications addressed in this blog, therefore we recommend that these options be set as Enabled.
Figure 8 and Figure 9 show the impact of the Sub-NUMA Cluster (SNC) BIOS option on the application performance. In each figure, the numbers over the bars represent the relative change in the application performance with respect to the application performance obtained on the Intel 6338 Ice Lake processor with SNC feature set to Disabled.
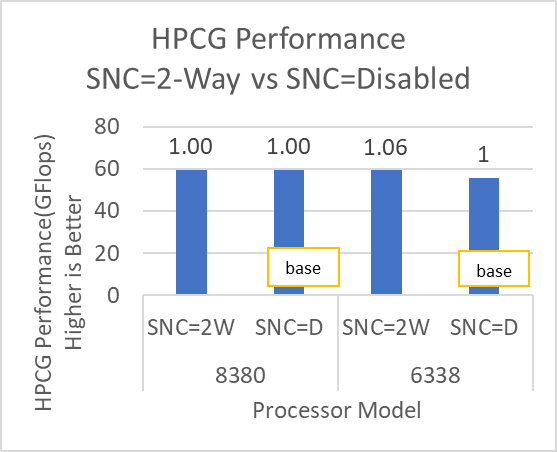
Figure 8: HPL and HPCG performance variation by processor model with Sub-NUMA Cluster set to Disabled (SNC=D) and 2-Way (SNC=2W)
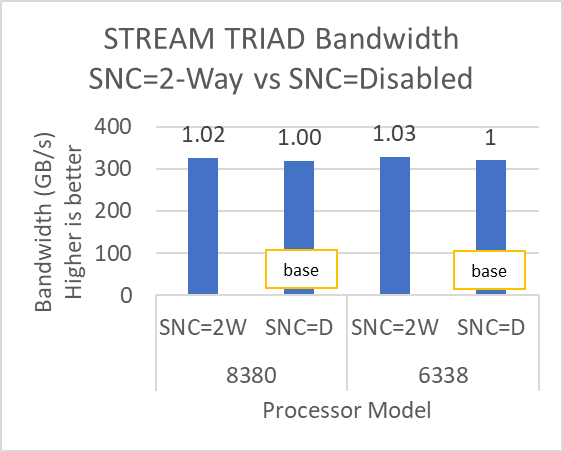
Figure 9: STREAM and WRF performance variation by processor model with Sub-NUMA Cluster set to Disabled (SNC=D) and 2-Way (SNC=2W)
The SubNumaCluster option can impact the applications that are Memory Bandwidth-bound (for example, STREAM, HPCG, and WRF). The SubNumaCluster option is recommended to be set to 2-Way as it can optimize the workloads addressed in this blog by a range of one percent to six percent, depending on the processor model and application.
InfiniBand bandwidth and message rate
The Ice Lake-based processors now support PCIe Gen 4, which allows the NVIDIA MELLANOX HDR adapter cards to be used with Dell EMC PowerEdge servers. Figure 10, Figure 11, and Figure 12 show the Message Rate, Unidirectional, and Bi-directional InfiniBand bandwidth test results of the OSU Benchmarks suite. The network adapter card was connected to the second socket (NUMA node 2), therefore, the local bandwidth tests were carried out with processes bound to NUMA node 2. The remote bandwidth tests were carried out with processes bound to NUMA node 0. In Figure 10 and Figure 11, the numbers in red over the orange bars represent the percentage difference between local and remote bandwidth performance numbers.
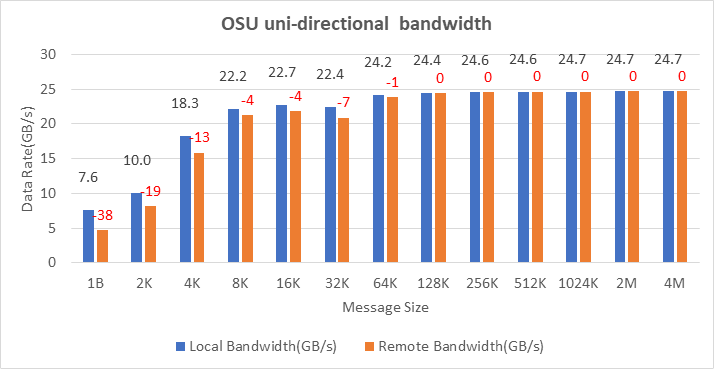 Figure 10: OSU Benchmark unidirectional bandwidth test on two servers with Intel 8380 processors and NVIDIA Mellanox HDR InfiniBand
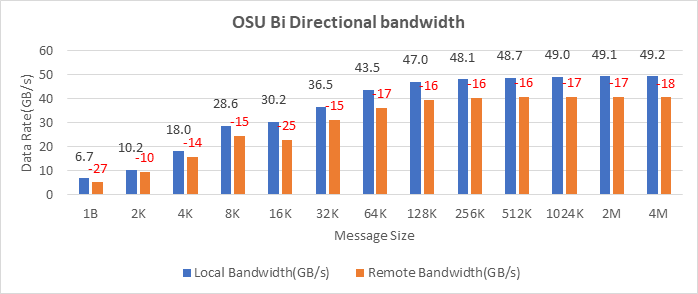 Figure 11: OSU Benchmark bi-directional bandwidth test on two servers with Intel 8380 processors and NVIDIA Mellanox HDR InfiniBand
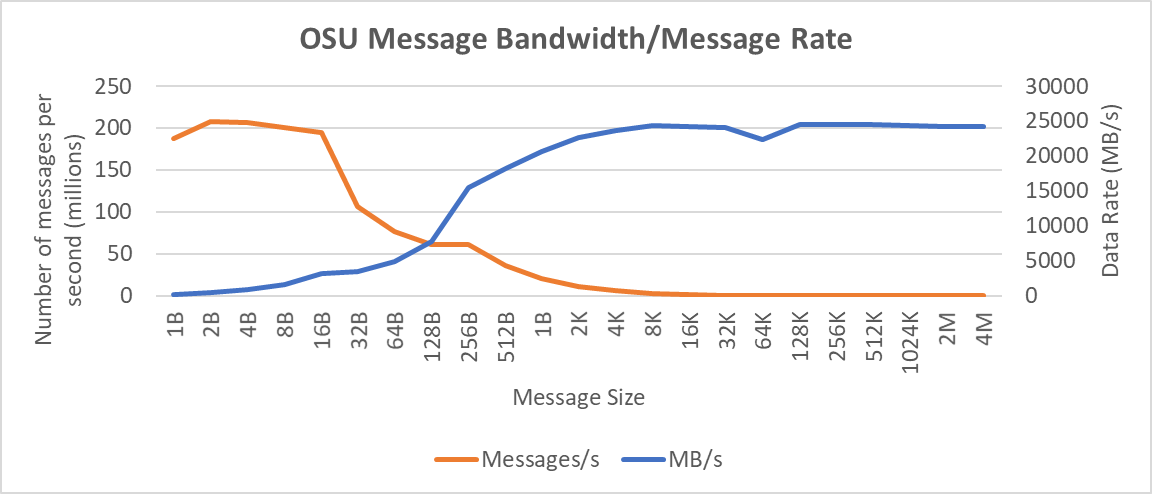
Figure 12: Interconnect bandwidth and message rate performance obtained between two servers having Intel 8380 processors with OSU Benchmark
On two nodes connected using the NVIDIA Mellanox ConnectX-6 HDR InfiniBand adapter cards, we achieved approximately 25 GB/s unidirectional bandwidth and a message rate of approximately 200 million messages/second—almost double the performance numbers obtained on the NVIDIA Mellanox HDR100 card.
Comparison with Cascade Lake processors
Based on the compute resources availability in our Dell EMC HPC & AI Innovation Lab, we selected the Cascade Lake processor-based servers and benchmarked them with software listed in Table 1. Figure 13 through Figure 16 show performance results from the Intel Ice Lake and Cascade Lake processors. The numbers over the bars represent the relative change in the application performance with respect to the application performance obtained on the Intel 6252 Cascade Lake processor.
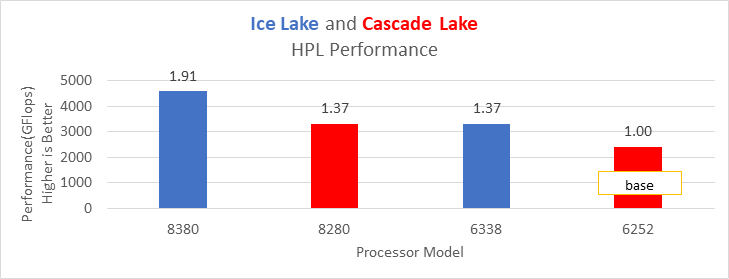 Figure 13: HPL performance on processors listed in Table 2
 Figure 14: HPCG performance on processors listed in Table 2
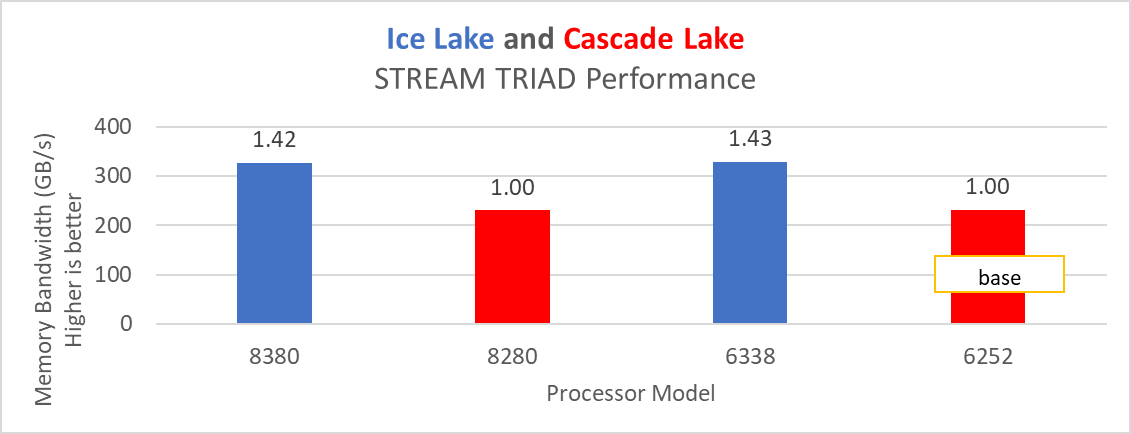 Figure 15: STREAM TRIAD test performance on Processors listed in Table 2
 Figure 16: WRF performance on Processors listed in Table 2
Ice Lake delivers approximately 38 percent better performance than Cascade Lake with HPL on the top-end processor model. The memory bandwidth-bound benchmarks such as STREAM and HPCG (see Figure 13 and Figure 14) delivered 42 percent to 43 percent performance improvement over the top-end Cascade Lake processors addressed in this blog.
The average real-time power usage of the Dell EMC PowerEdge platforms (listed in Table 1) was measured with the synthetic benchmarks listed in this blog. Figure 17 compares the power usage data from the Cascade Lake and Ice Lake platforms. The number over the bar represents the relative change of power with respect to the base (Intel 6252 processor in the idle state) power measured.
Figure 17: Average power usage during benchmark runs on Dell EMC PowerEdge servers (see details in Table 1)
Considering the data with the Performance Optimized profile with the respective power measurement, the applications (depending on the processor model) were unable to deliver better performance per watt on the Ice Lake platform when compared to the Cascade Lake platform.
Summary and future work
The Ice Lake processor-based Dell EMC Power Edge servers, with notable hardware feature upgrades over Cascade Lake, show up to 47 percent performance gain for all the HPC benchmarks addressed in this blog. Hyper-threading should be Disabled for the benchmarks addressed in this blog; for other workloads the option should be tested and enabled as appropriate. Watch this space for subsequent blogs that describe application performance studies on our new Ice Lake processor-based cluster.

Accelerating HPC Workloads with NVIDIA A100 NVLink on Dell PowerEdge XE8545
Tue, 13 Apr 2021 14:25:31 -0000
|Read Time: 0 minutes
NVIDIA A100 GPU
Three years after launching the Tesla V100 GPU, NVIDIA recently announced its latest data center GPU A100, built on the Ampere architecture. The A100 is available in two form factors, PCIe and SXM4, allowing GPU-to-GPU communication over PCIe or NVLink. The NVLink version is also known as the A100 SXM4 GPU and is available on the HGX A100 server board.
As you’d expect, the Innovation Lab tested the performance of the A100 GPU in a new platform. The new PowerEdge XE8545 4U server from Dell Technologies supports these GPUs with the NVLink SXM4 form factor and dual-socket AMD 3rd generation EPYC CPUs (codename Milan). This platform supports PCIe Gen 4 speed, up to 10 local drives, and up to 16 DIMM slots running at 3200 MT/s. Milan CPUs are available with up to 64 physical cores per CPU.
The PCIe version of the A100 can be housed in the PowerEdge R7525, which also supports AMD EPYC CPUs, up to 24 drives, and up to 16 DIMM slots running at 3200MT/s. This blog compares the performance of the A100-PCIe system to the A100-SXM4 system.
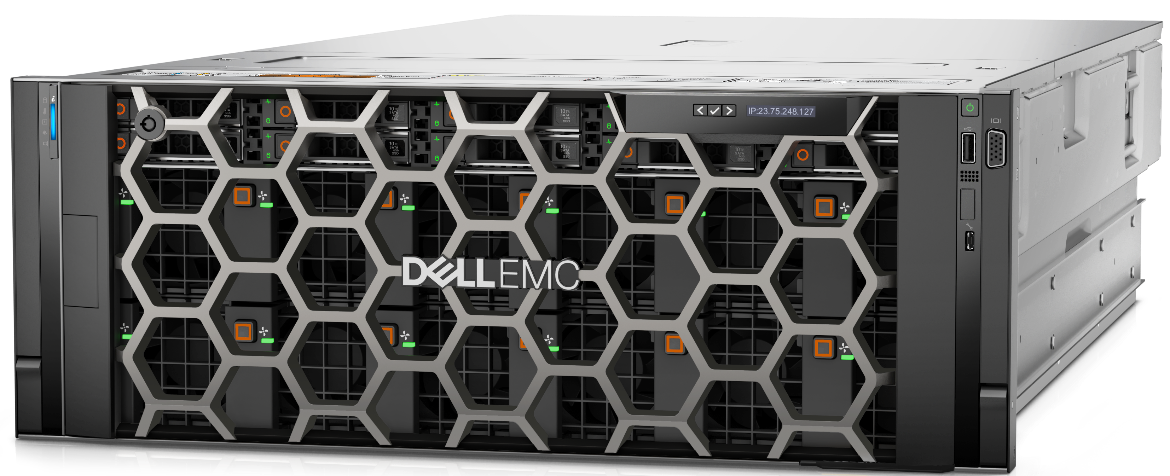
Figure 1: PowerEdge XE8545 Server
A previous blog discussed the performance of the NVIDIA A100-PCIe GPU compared to its predecessor NVIDIA Tesla V100-PCIe GPU in the PowerEdge R7525 platform.
The following table shows the specifications of the NVIDIA A100 and V100 GPUs.
Table 1: NVIDIA A100 and V100 GPUs with PCIe and SXM4 form factors
Form factor | PCIe | SXM (NVIDIA NVLink) | ||
Type of NVIDIA | A100 | V100 | A100 | V100 |
GPU architecture | Ampere | Volta | Ampere | Volta |
GPU memory | 40 GB | 32 GB | 40 GB | 32 GB |
GPU memory bandwidth | 1555 GB/s | 900 GB/s | 1555 GB/s | 900 GB/s |
Peak FP64 | 9.7 TFLOPS | 7 TFLOPS | 9.7 TFLOPS | 7.8 TFLOPS |
Peak FP64 Tensor Core | 19.5 TFLOPS | N/A | 19.5 TFLOPS | N/A |
GPU base clock | 765 MHz | 1230 MHz | 1095 MHz | 1290 MHz |
GPU boost clock | 1410 MHz | 1380 MHz | 1410 MHz | 1530 MHz |
NVLink speed | 600 GB/s | N/A | 600 GB/s | 300 GB/s |
Max power consumption | 250 W | 250 W | 400 W | 300 W |
From Table 1, we see that the A100 offers 42 percent improved memory bandwidth and 20 to 30 percent higher double precision FLOPS when compared to the Tesla V100 GPU. While the A100-PCIe GPU consumes the same amount of power as the V100-PCIe GPU, the NVLink version of the A100 GPU consumes 25 percent more power than the V100 GPU.
How are the GPUs connected in the PowerEdge servers?
An understanding of the server architecture is helpful in determining the behavior of any application. The PowerEdge XE8545 server is an accelerator optimized server with four A100-SMX4 GPUs connected with third generation NVLink, as shown in the following figure.
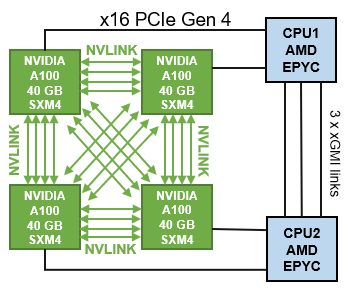
Figure 2: PowerEdge XE8545 CPU-GPU connectivity
In the A100 GPU, each NVLink lane supports a data rate of 50x 4 Gbit/s in each direction. The total number of NVLink lanes increases from six lanes in the V100 GPU to 12 lanes in the A100 GPU, now yielding 600 GB/s total. Workloads that can take advantage of the higher GPU-to-GPU communication bandwidth can be benefit from the NVLink links in PowerEdge XE8545 Server.
As shown in the following figure, the PowerEdge R7525 server can accommodate up to three PCIe-based GPUs; however the configuration chosen for this evaluation used two A100-PCIe GPUs. With this option, the GPU-to-GPU communication must flow through the AMD Infinity Fabric inter-CPU links.
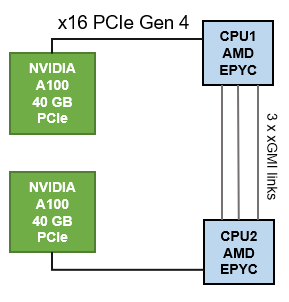
Figure 3: PowerEdge R7525 CPU-GPU connectivity
Testbed details
The following table shows the tested configuration details:
Table 2: Test bed configuration details
Server | PowerEdge XE8545 | PowerEdge R7525 |
Processor | Dual AMD EPYC 7713, 64C, 2.8 GHz | |
Memory | 512 GB (16 x 32 GB @ 3200 MT/s) | 1024 GB (16 x 64 GB @ 3200 MT/s) |
Height of system | 4U | 2U |
GPUs | 4 x NVIDIA A100 SXM4 40 GB | 2 x NVIDIA A100 PCIe 40 GB |
Operating system Kernel | Red Hat Enterprise Linux release 8.3 (Ootpa) 4.18.0-240.el8.x86_64 | |
BIOS settings | Sysprofile=PerfOptimized LogicalProcessor=Disabled NumaNodesPerSocket=4 | |
CUDA Driver CUDA Toolkit | 450.51.05 11.1 | |
GCC | 9.2.0 | |
MPI | OpenMPI - 4.0 | |
The following table lists the version of HPC application that was used for the benchmark evaluation:
Table 3: HPC Applications used for the evaluation
Benchmark | Details |
HPL | xhpl_cuda-11.0-dyn_mkl-static_ompi-4.0.4_gcc4.8.5_7-23-20 |
HPCG | xhpcg-3.1_cuda_11_ompi-3.1 |
GROMACS | v2021 |
NAMD | Git-2021-03-02_Source |
LAMMPS | 29Oct2020 release |
Benchmark evaluation
High Performance Linpack
High Performance Linpack (HPL) is a standard HPC system benchmark that is used to measure the computing power of a server or cluster. It is also used as a reference benchmark by the TOP500 org to rank supercomputers worldwide. HPL for GPU uses double precision floating point operations. There are a few parameters that are significant for the HPL benchmark, as listed below:
- N is the problem size provided as input to the benchmark and determines the size of linear matrix that is solved by HPL. For a GPU system, the highest HPL performance is obtained when the problem size utilizes as much as possible of the GPU memory without exceeding it. For this study, we used HPL compiled with NVIDIA libraries as listed in Table 3.
- NB is the block size which is used for data distribution. For this test configuration, we used an NB of 288.
- PxQ is the matrix size and is equal to the total number of GPUs in the system.
- Rpeak is the theoretical peak of the system.
- Rmax is the maximum measured performance achieved on the system.
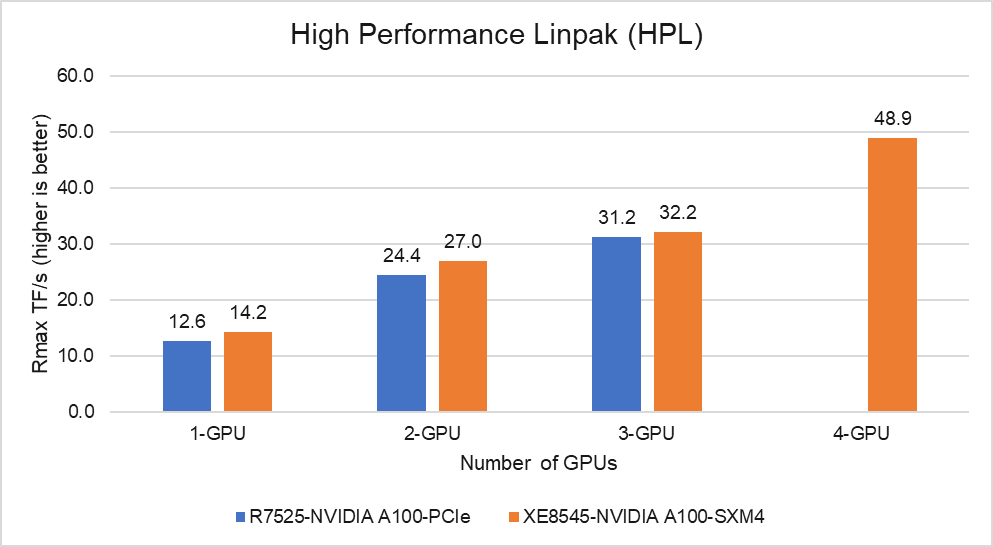
Figure 4: HPL Performance on the PowerEdge R7525 and XE8545 with NVIDIA A100-40 GB
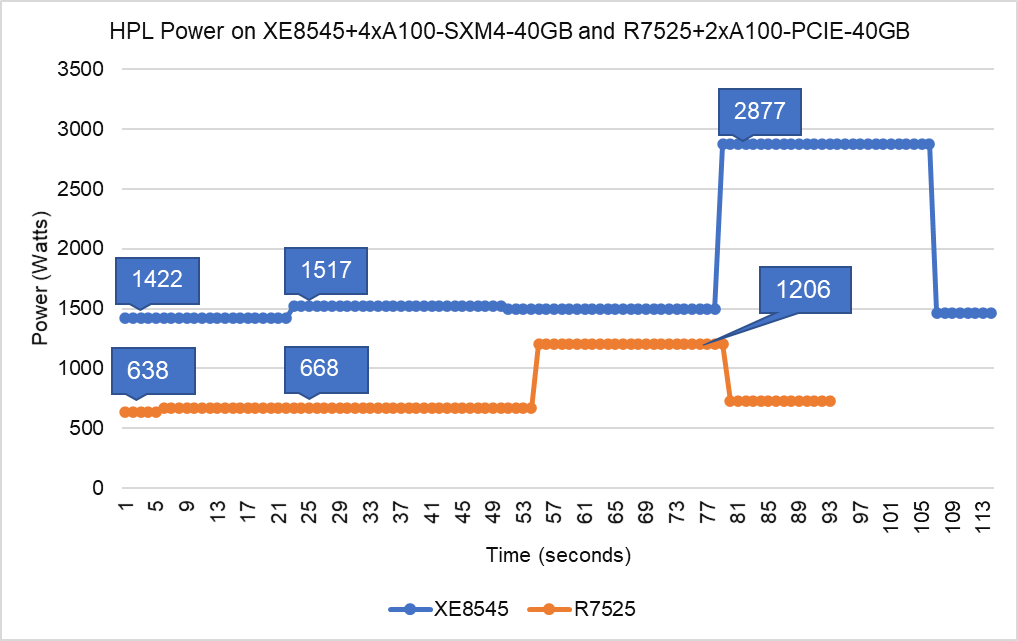
Figure 5: HPL Power Utilization on the PowerEdge XE8545 with four NVIDIA A100 GPUs and R7525 with two NVIDIA A100 GPUs
From Figure 4 and Figure 5, we can make the following observations:
- SXM4 vs PCIe: At 1-GPU, the NVIDIA A100-SXM4 GPU outperforms the A100-PCIe by 11 percent. The higher SMX4 GPU base clock frequency is the predominant factor contributing to the additional performance over the PCIe GPU.
- Scalability: The PowerEdge XE8545 server with four NVIDIA A100-SXM4-40GB GPUs delivers 3.5 times higher HPL performance compared to one NVIDIA A100-SXM4-40GB GPU. On the other hand, two A100-PCIe GPUs is 1.94 times faster than one on the R7525 platform. The A100 GPUs scale well on both platforms for HPL benchmark.
- Higher Rpeak: HPL code on A100 GPUs use the new double-precision Tensor cores. So, the theoretical peak for each card would be 19.5 TFlops, as opposed to 9.7 TFlops.
- Power: Figure 5 shows power consumption of a complete HPL run with PowerEdge XE8545 using 4 x A100-SXM4 GPUs and PowerEdge R7525 using 2 x A100-PCIe GPUs. This was measured with iDRAC commands, and the peak power consumption for XE8545 is 2877 Watts, while peak power consumption for R7525 is 1206 Watts.
High Performance Conjugate Gradient
The TOP500 list has incorporated the High Performance Conjugate Gradient (HPCG) results as an alternate metric to assess system performance.
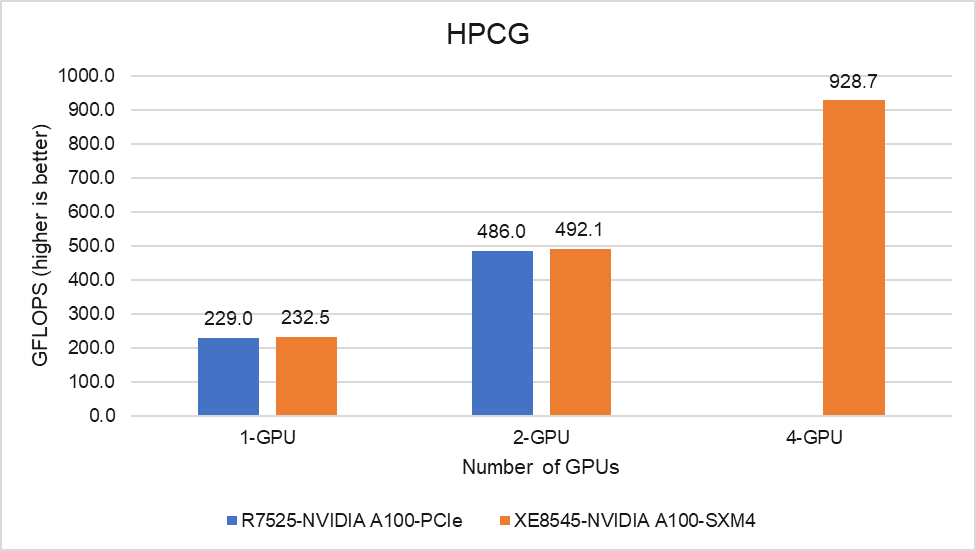
Figure 6: HPCG Performance on the PowerEdge R7525 and PowerEdge XE8545 Servers
Unlike HPL, HPCG performance depends heavily on the memory system and network performance when we go beyond one server. Because both the PCIe and SXM4 form factors of the A100 GPUs have the same memory bandwidth, there is no variation in the performance at a single node and HPCG performance scales well on both servers.
GROMACS
The following figure shows the performance results for GROMACS, a molecular dynamics application, on the PowerEdge R7525 and XE8545 servers. GROMACS 2021.0 was compiled with CUDA compilers and Open-MPI, as shown in Table 3.
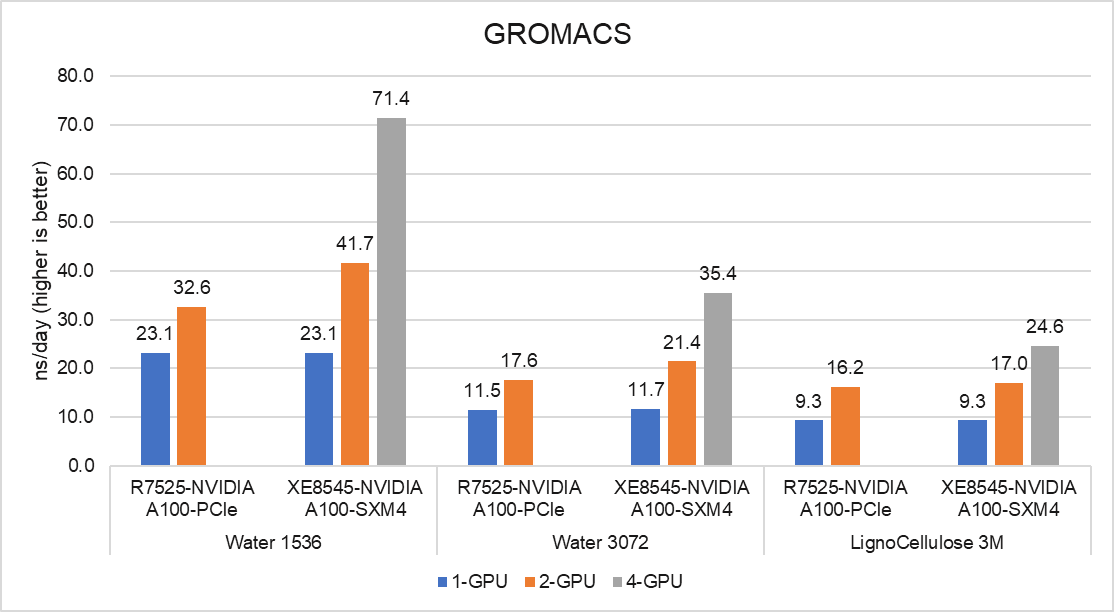
Figure 7: GROMACS performance on the PowerEdge R7545 and PowerEdge XE8545 Server
The GROMACS build included thread MPI (built in with the GROMACS package). Performance results are presented using the ns/day metric. For each test, the performance was optimized by varying the number of MPI ranks and threads, number of PME ranks, and different nstlist values to obtain the best performance result.
With one GPU in test, the performance of the SMX4 XE8545 server is similar to the PCIe R7525. With two GPUs in test, the SMX4 XE8545 performance is up to 28 percent better than the PCIe R7525. As the performance was based on a comparative analysis between NVIDIA PCIe and SXM4 form factors along the server platforms, datasets like Water 1536 and Water 3072 demand more GPU-GPU communication, and SXM4 performs around 28 percent better. On the other hand, for datasets like LignoCellulose 3M, the two GPU R7525 achieves the same per-GPU performance as the XE8545, but with the lower 250 W GPU making it the more efficient solution.
LAMMPS
The following figure shows the performance results for LAMMPS, a molecular dynamics application, on the PowerEdge R7525 and XE8545 servers. The code was compiled with the KOKKOS package to run efficiently on NVIDIA GPUs, and Lennard Jones is the dataset that was tested with Timesteps/s as the metric for comparison.
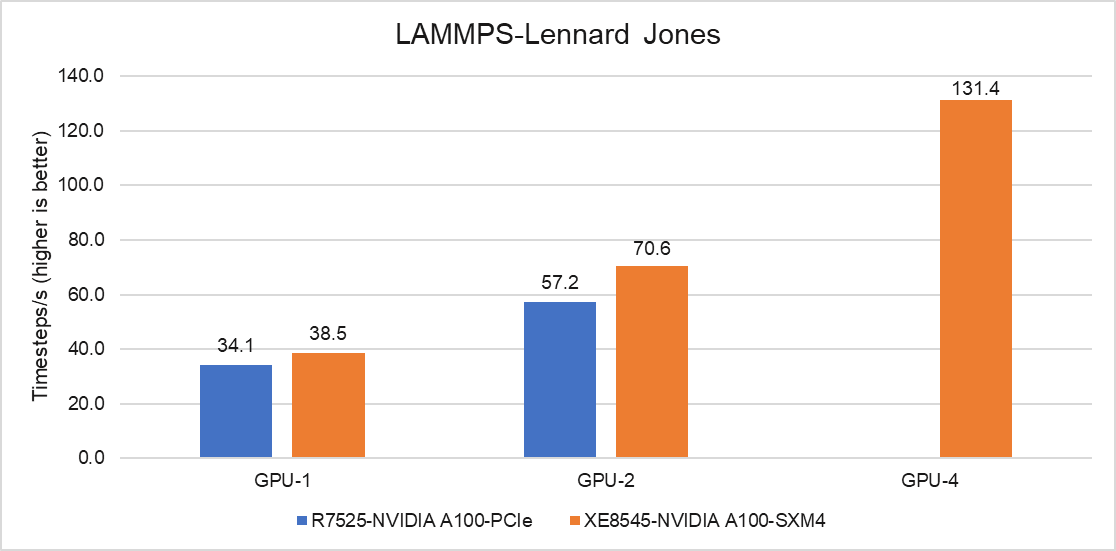
Figure 8: LAMMPS performance on the PowerEdge R7545 and PowerEdge XE8545 Servers
With one GPU in test, the performance of the SMX4 XE8545 server is 13 percent higher than the PCIe R7525, and with two GPUs in test, a 23 percent performance improvement was measured. The PowerEdge XE8545 is at an advantage because the GPUs can communicate with each other over NVLink without the intervention of a CPU. The R7525 server with two GPUs is limited by the GPU-to-GPU communication pattern. Additionally, the other factor contributing for better performance is the higher clock rate of the SXM4 A100 GPU.
Conclusion
In this blog, we discussed the performance of NVIDIA A100 GPUs on the PowerEdge R7525 Server and the PowerEdge XE8545 Server, which is the new addition from Dell Technologies. The A100 GPU has 42 percent more memory bandwidth and higher double precision FLOPs compared to its predecessor, the V100 series GPU. For workloads which demand more GPU-to-GPU communication, the PowerEdge XE8545 server is an ideal choice. For data centers where space and power are limited, the PowerEdge R7525 server may be the right fit. The overall performance of PowerEdge XE8545 Server with four A100-SXM4 GPUs is 1.5 to 2.3 times faster than the PowerEdge R7525 server with two A100-PCIe GPUs.
In the future, we intend to evaluate the A100-80GB GPUs and NVIDIA A40 GPUs that will be available this year. We also plan to focus on a multi-node performance study with these GPUs.
Please contact your Dell sales specialist about the HPC and AI Innovation Lab if you would like to evaluate these GPU servers.

AMD Milan - BIOS Characterization for HPC
Tue, 30 Mar 2021 18:23:11 -0000
|Read Time: 0 minutes
With the release of the AMD EPYC 7003 Series Processors (architecture codenamed "Milan"), Dell EMC PowerEdge servers have now been upgraded to support the new features. This blog outlines the Milan Processor architecture and the recommended BIOS settings to deliver optimal HPC Synthetic benchmark performance. Upcoming blogs will focus on the application performance and characterization of the software applications from various scientific domains such as Weather Science, Molecular Dynamics, and Computational Fluid Dynamics.
AMD Milan with Zen3 cores is the successor of AMD's high-performance second generation server microprocessor (architecture codenamed "Rome"). It supports up to 64 cores at 280w TDP and 8 DDR4 memory channels at speeds up to 3200MT/s.
Architecture
As with AMD Rome, AMD Milan’s 64 core Processor model has 1 I/O die and 8 compute dies (also called CCD or Core Complex Die) – OPN 32 core models may have 4 or 8 compute dies. Milan Processors have upgrades to the Cache (including new prefetchers at both L1 and L2 caches) and Memory Bandwidth which is expected to improve performance of applications requiring higher memory bandwidth.
Unlike Naples and Rome, Milan's arrangement of its CCDs has changed. Each CCD now features up to 8 cores with a unified 32MB L3 cache which could reduce the cache access latency within compute chiplets. Milan Processors can expose each CCD as a NUMA node node by setting the “L3 cache as NUMA Domain” ( from the iDRAC GUI ) or BIOS.ProcSettings.CcxAsNumaDomain (using racadm CLI) option to “Enabled”. Therefore, Milan’s 64 core dual-socket Processors with 8 CCDs per Processor will expose 16 NUMA domains per system in this setting. Here is the logical representation of Core arrangement with NUMA Nodes per socket = 4 and CCD as NUMA = Disabled.
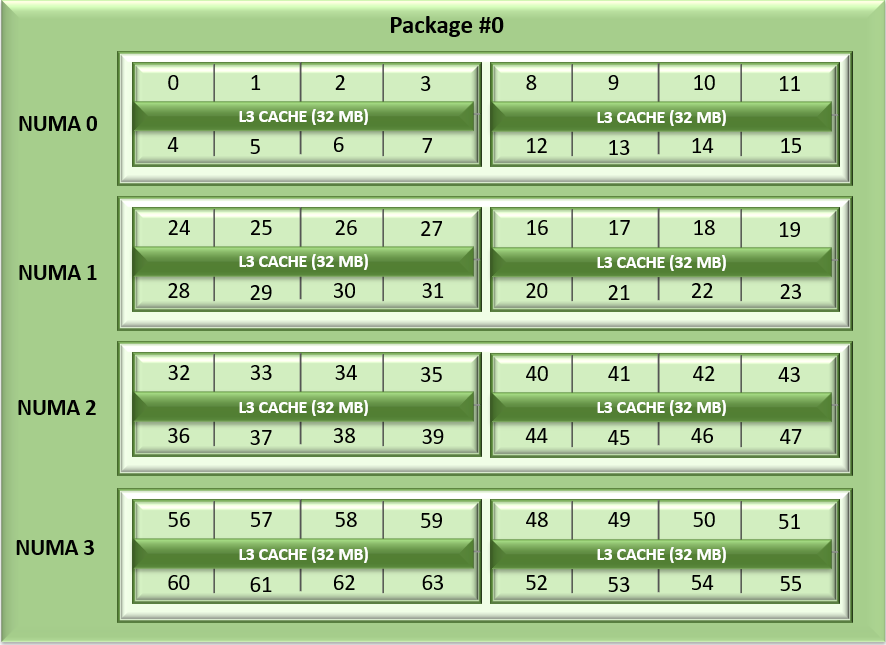
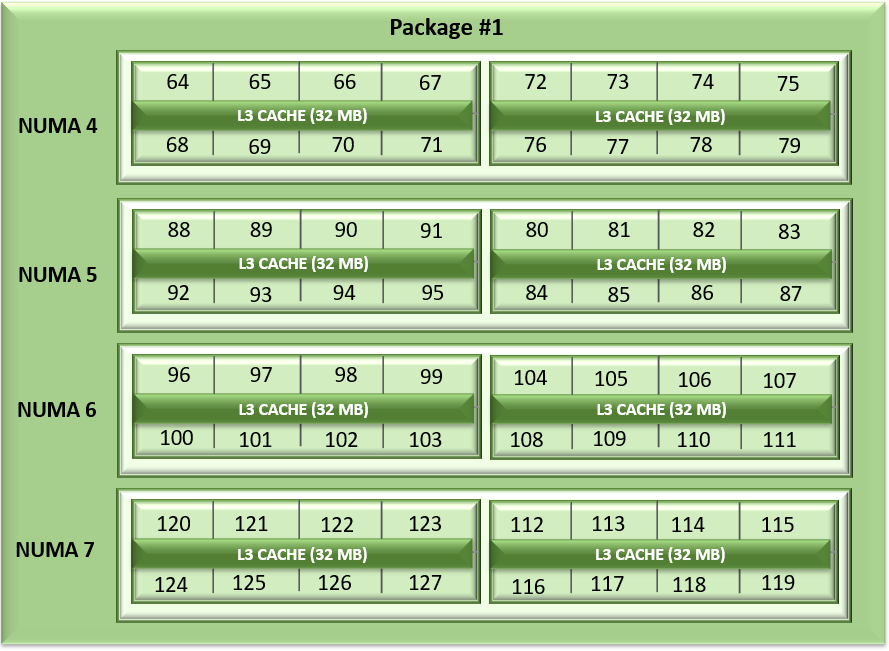
Figure1: Linear core enumeration on a dual-socket system, 64c per socket, NPS4 configuration on an 8 CCD Processor model
As with AMD Rome, AMD Milan Processors support the AVX256 instruction set allowing 16 DP FLOP/cycle.
BIOS Options Available on AMD Milan and Tuning
Processors from both Milan and Rome generations are socket compatible, so the BIOS Options are similar across these Processor generations. Server details are mentioned in Table 1 below.
Table 1: Testbed hardware and software details
Server | Dell EMC PowerEdge 2 socket servers (with AMD Milan Processors) | Dell EMC PowerEdge 2 socket servers (with AMD Rome Processors) |
OPN Cores/Socket Frequency (Base-Boost) TDP | 7763 (Milan) 64 2.45GHz – 3.5GHz 280W 256 MB | 7H12 (Rome) 64 2.6GHz – 3.3 GHz 280W 256 MB |
OPN Cores/Socket Frequency TDP | 7713 (Milan) 64 2.0GHz – 3.7GHz 225W 256 MB | 7702 (Rome) 64 2.0 GHz – 3.35 GHz 200W 256 MB |
OPN Cores/Socket Frequency TDP | 7543 (Milan) 32 2.8GHz – 3.7 GHz 225W 256 MB | 7542 (Rome) 32 2.9GHz – 3.4 GHz 225W 128 MB |
Operating System | RHEL 8.3 (4.18.0-240.el8.x86_64) | RHEL 8.2 (4.18.0-193.el8.x86_64) |
Memory | DDR4 256G (16Gb x 16) 3200 MT/s | |
BIOS / CPLD | 2.0.3 / 1.1.12 | 1.1.7 |
Interconnect | Mellanox HDR 200 (4X HDR) | Mellanox HDR 100 |
The following BIOS options were explored –
- BIOS.SysProfileSettings.SysProfile: This field sets the System Profile to Performance Per Watt (OS), Performance, or Custom mode. When set to a mode other than Custom, BIOS will set each option accordingly. When set to Custom, you can change setting of each option. Under Custom mode when C state is enabled, Monitor/Mwait should also be enabled.
- BIOS.ProcSettings.L1StridePrefetcher: When set to Enabled, the Processor provides additional fetch to the data access for an individual instruction for performance tuning by controlling the L1 stride prefetcher setting.
- BIOS.ProcSettings.L2StreamHwPrefetcher: When set to Enabled, the Processor provides advanced performance tuning by controlling the L2 stream HW prefetcher setting.
- BIOS.ProcSettings.L2UpDownPrefetcher: When set to Enabled, the Processor uses memory access to determine whether to fetch next or previous for all memory accesses for advanced performance tuning by controlling the L2 up/down prefetcher setting.
- BIOS.ProcSettings.CcxAsNumaDomain: This field specifies that each CCD within the Processor will be declared as a NUMA Domain.
- BIOS.MemSettings.MemoryInterleaving: When set to Auto, memory interleaving is supported if a symmetric memory configuration is installed. When set to Disabled, the system supports Non-Uniform Memory Access (NUMA) (asymmetric) memory configurations. Operating Systems that are NUMA-aware understand the distribution of memory in a particular system and can intelligently allocate memory in an optimal manner. Operating Systems that are not NUMA-aware could allocate memory to a Processor that is not local, resulting in a loss of performance. Die and Socket Interleaving should only be enabled for Operating Systems that are not NUMA-aware.
After setting System Profile (BIOS.SysProfileSettings.SysProfile) to PerformanceOptimized, NUMA Nodes Per Socket (NPS) to 4, and Prefetchers (L1Region,L1Stream,L1Stride,L2Stream, L2UpDown) to “Enabled” we measured the impact of CcxAsNumaDomain and MemoryInterleaving BIOS parameters on application performance. We tested the performance of the applications listed in Table 1 with following settings.
Table 2: Combinations of CCX as NUMA domain and Memory Interleaving
CCX as NUMA Domain | Memory Interleaving | |
Setting01 | Disabled | Disabled |
Setting02 | Disabled | Auto |
Setting03 | Enabled | Auto |
Setting04 | Enabled | Disabled |
With Setting01 and Setting02 (CCX as NUMA Domain = Disabled), the system will expose 8 NUMA nodes. With Setting03 and Setting04, there will be 16 NUMA nodes on a dual socket server with 64 core based Milan Processors.
Table 3: hwloc-ls and numactl -H command output on 64c server with setting01/setting02 and (listed in Table 2)
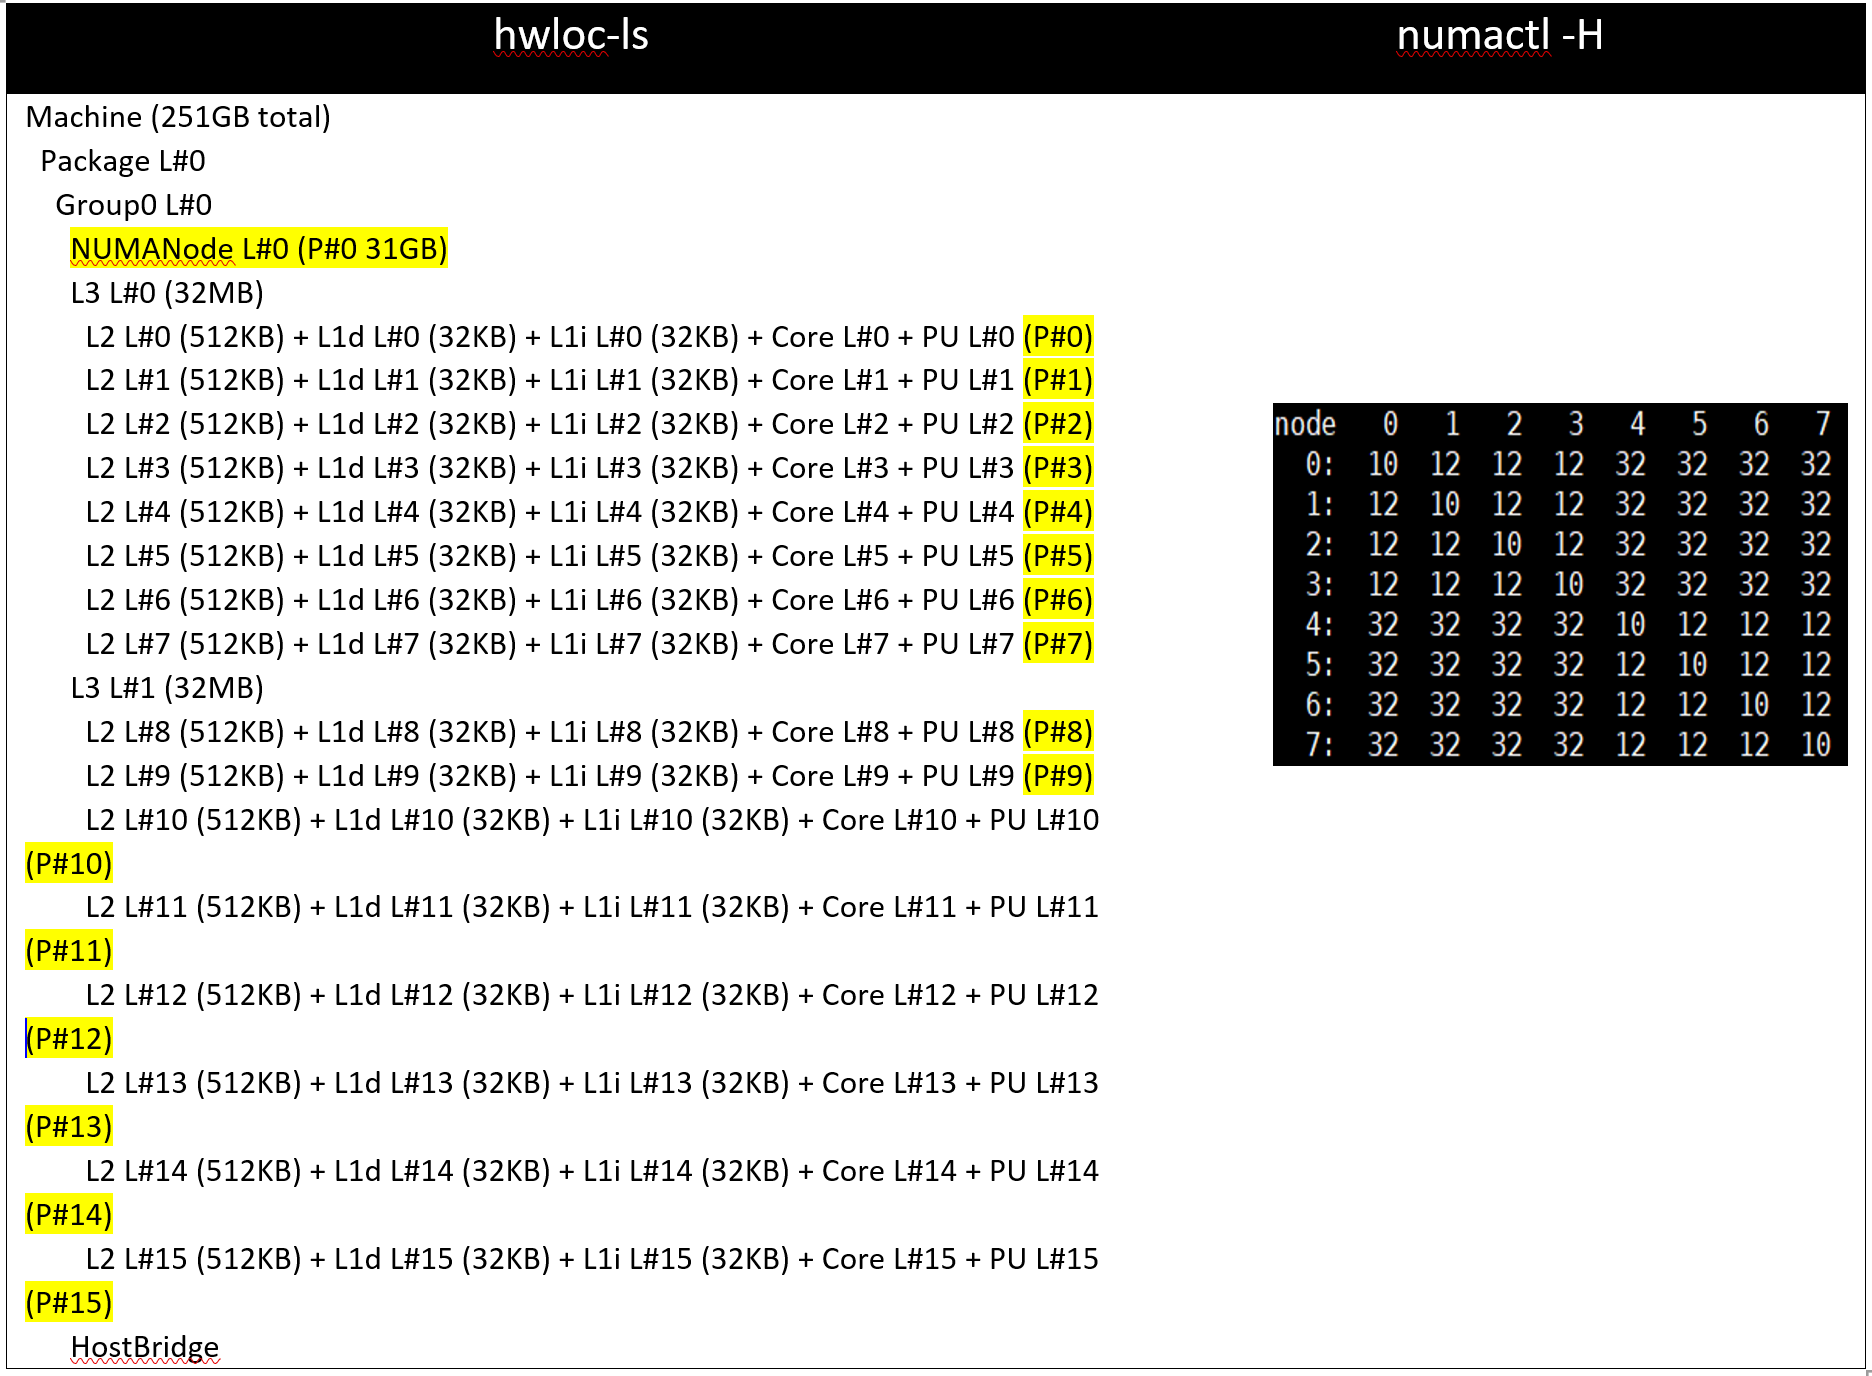
Table 4: hwloc-ls and numactl -H command output on 128 core (2x 64c) server with setting03/setting04 and (listed in Table 2)
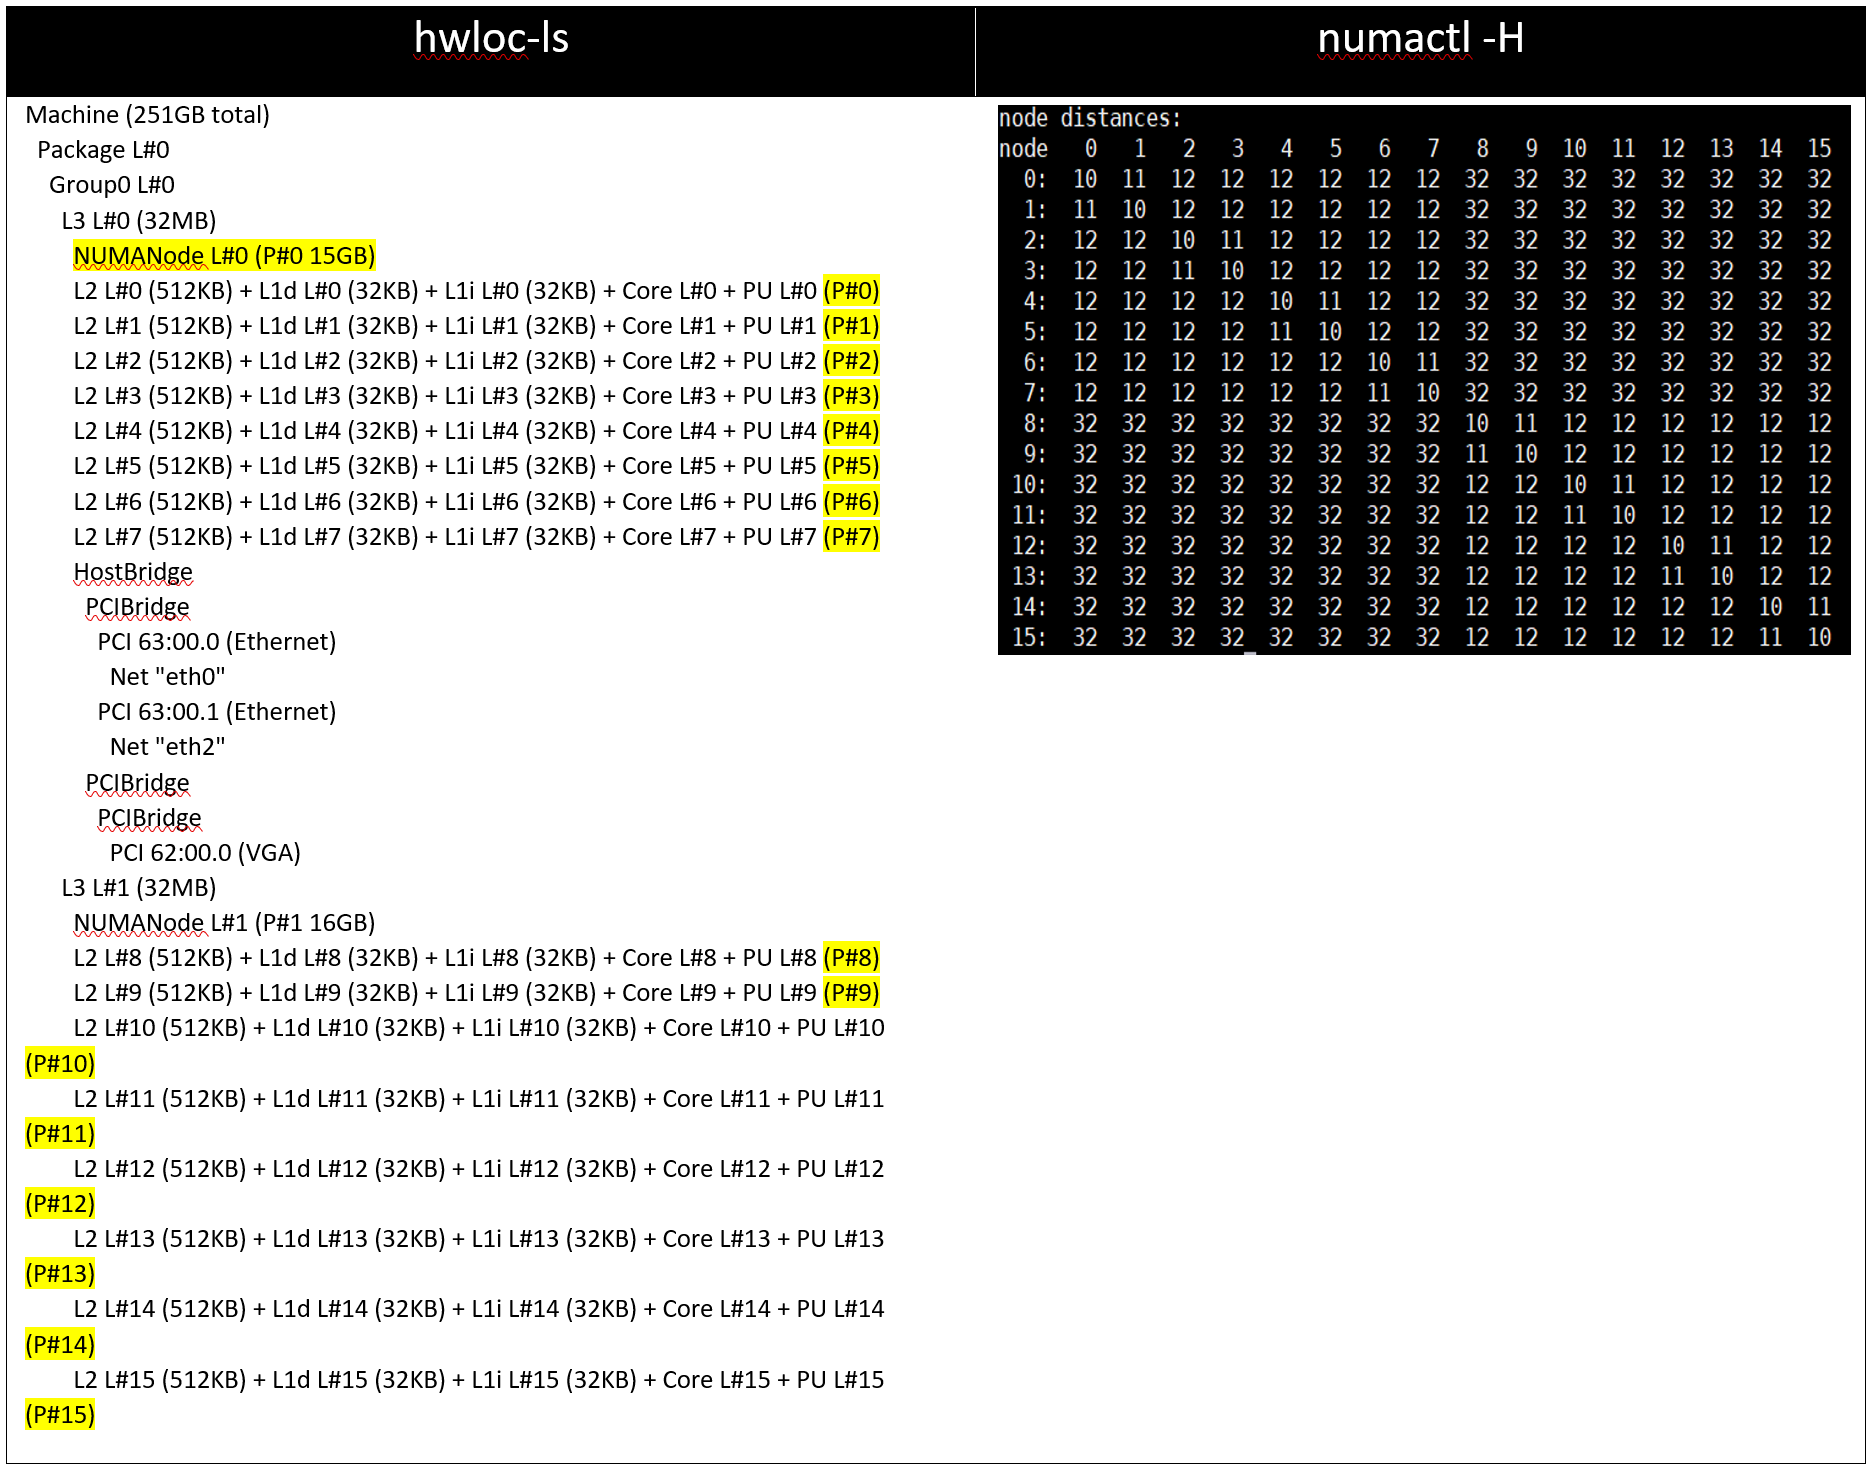
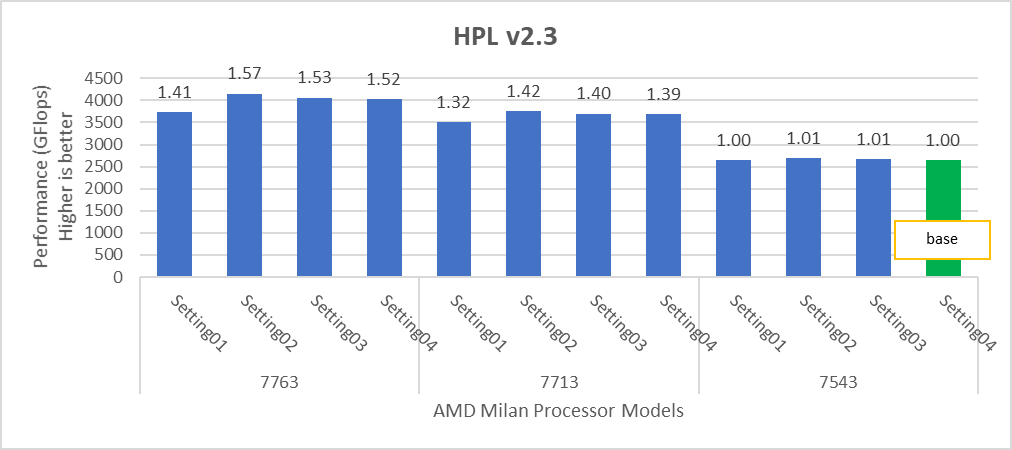
Figure 2: Relative difference in the performance of HPL by processor and BIOS settings mentioned in Table 1 and Table 2.
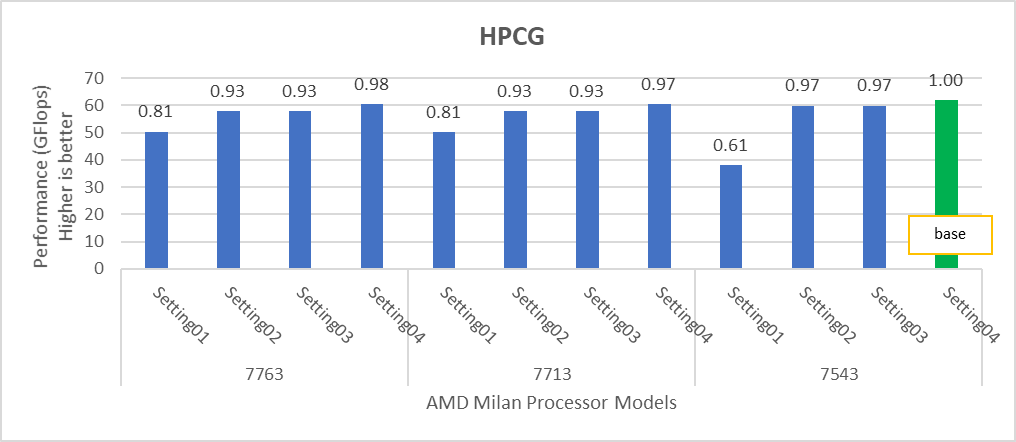
Figure 3: Relative difference in the performance of HPCG by processor and BIOS settings mentioned in Table 1 and Table 2.
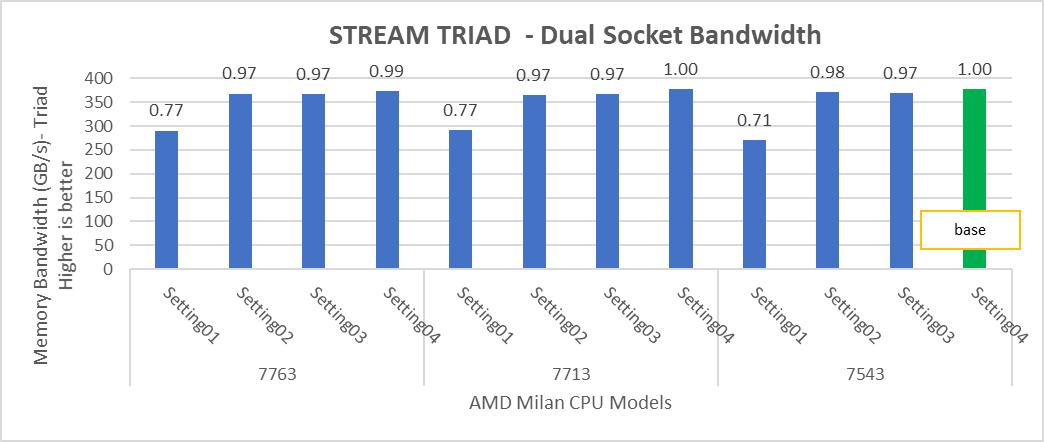
Figure 4: Relative difference in the performance of STREAM by processor and BIOS settings mentioned in Table 1 and Table 2.
HPL delivers the best performance numbers on setting02 with 82-93% efficiency depending on Processor Model, whereas STREAM and HPCG deliver better performance with setting04.
STREAM TRIAD tests generate best performance numbers at ~378 GB/s memory bandwidth across all of the 64 and 32 core Processor Models mentioned in Table 1 with efficiency up to 90%.
In Figure 4, the STREAM TRIAD performance numbers were measured by undersubscribing the server by utilizing only 16 cores on the servers. The comparison of the performance numbers by utilizing all the available cores and 16 cores per system has been shown in Figure 5. The numbers on top of the orange bars shows the relative difference.
Figure 5: Relative difference in the memory bandwidth.
From Figure 5, we observed that by using 16 cores, the STREAM TRIAD test’s performance numbers were ~3-4% higher than the performance numbers measured by subscribing all available cores.
We carried out NUMA bandwidth tests using setting02 and setting04 mentioned in Table01. With setting02, system exposes a total of 8 NUMA nodes while with setting04, system exposes a total of 16 NUMA nodes with 8 cores per NUMA node In Figure 6 and 7, NUMA node presented as “c” and memory node as “m”. As an example, c0m0 represents NUMA node 0 and memory node 0. The best bandwidth numbers obtained on varying the number of threads
Figure 6: Local and remote NUMA memory bandwidth with CCXasNUMADomain=Disabled
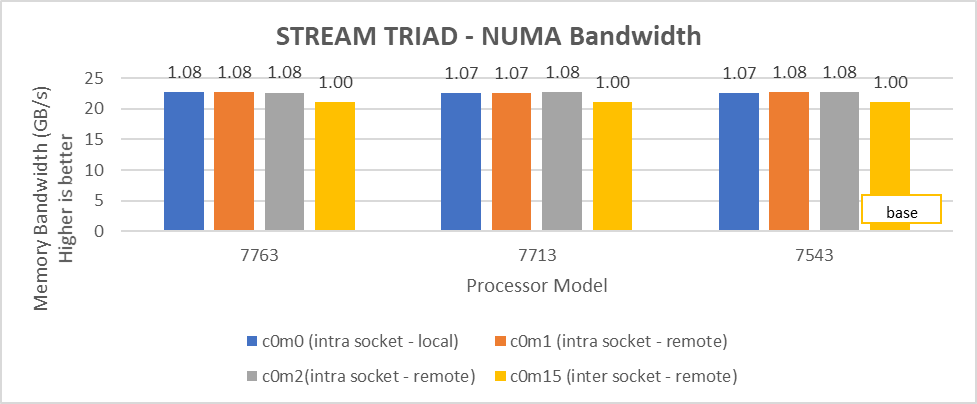
Figure 7: Local and remote NUMA memory bandwidth with CCXasNUMADomain=ENabled
We observed that the optimal intra socket local memory bandwidth numbers were obtained with 2 threads per NUMA node with setting2 on both 64 core and 32 core processor models. In Figure 6 with setting02 (Table 2) the intra socket local memory bandwidth, at 2 threads per NUMA node, can be up to 79% more than inter remote memory bandwidth. With setting02 (Figure 6) we get at least 96% higher intra socket local memory bandwidth per NUMA domain than setting04 (Figure 7).
Impact of new Prefetch options
Milan introduces two new prefetchers for L1 cache and one for L2 Cache with a total of five prefetcher options which can be configured using BIOS. We tested combinations listed in Table 5 by keeping L1 Stream and L2 Stream prefetcher as Enabled.
Table 5: Cache Prefetchers
L1StridePrefetcher | L1RegionPrefetcher | L2UpDownPrefetcher | |
setting01 | Disabled | Enabled | Enabled |
setting02 | Enabled | Disabled | Enabled |
setting03 | Enabled | Enabled | Disabled |
setting04 | Disabled | Disabled | Disabled |
We found that these new prefetchers do not have significant impact on the performance of the synthetic benchmarks covered in this blog.
InfiniBand bandwidth, message rate and scalability
For Multinode tests, the testbed was configured with Mellanox HDR interconnect running at 200 Gbps with each server having the AMD 7713 Processor Model and Preferred IO setting set to Enabled from BIOS.Along with the setting02 (Table 2) and Prefetchers (L1Region,L1Stream,L1Stride,L2Stream, L2UpDown) set to “Enabled” we were able to achieve the expected linear performance scalability for HPL and HPCG Benchmarks.
Figure 8: Multinode scalability of HPL and HPCG with setting02 (Table 2) with 7713 Processor model, HDR200 Infiniband
We tested the Message Rate, Unidirectional, and Bidirectional InfiniBand bandwidth using OSU Benchmarks and results are in Figure 9, Figure 10 and Figure 11. Except the Numa Nodes per socket setting, all other BIOS settings for these tests were same as mentioned above. The OSU Bidirectional bandwidth and OSU Unidirectional tests were carried out with Numa Nodes per socket set to 2 and the and Message rate test was carried out with Numa Nodes per socket set to 4. In Figure 9 and Figure10, the numbers on top of the orange bars represent the percentage difference between Local and Remote bandwidth performance numbers.
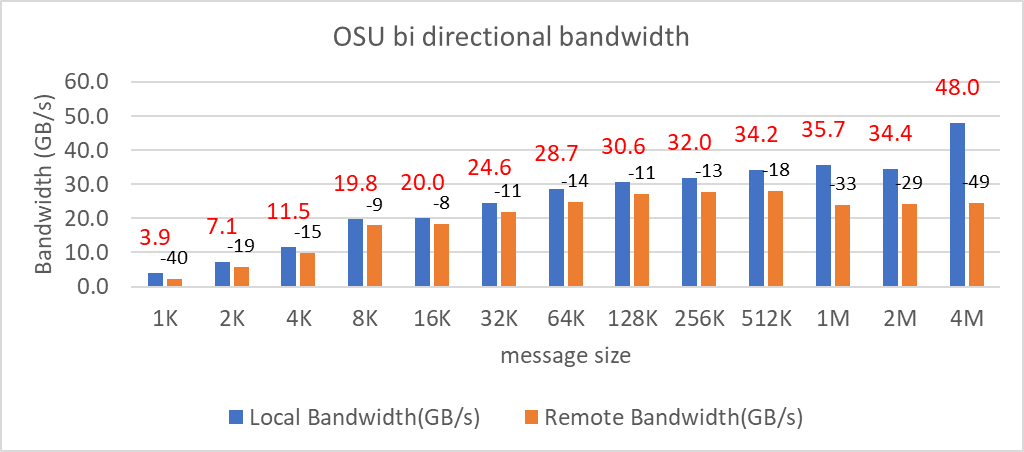
Figure 9: OSU bi-directional bandwidth test on AMD 7713, HDR 200 InfiniBand
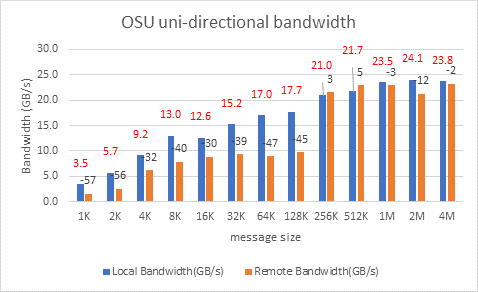 Figure 10: OSU uni-directional bandwidth test on AMD 7713, HDR 200 Infiniband
For Local Latency and Bandwidth performance numbers, the MPI process was pinned to the NUMA node 1 (closest to the HCA). For Remote Latency and Bandwidth tests, processes were pinned to NUMA node 6.
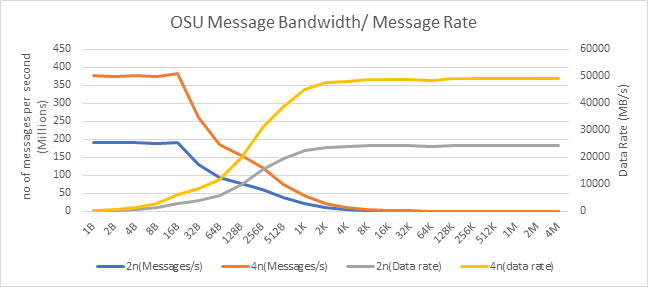
Figure 11: OSU Message rate and bandwidth performance on 2 and 4 nodes of 7713 Processor model
On 2 nodes using HDR200, we are able to achieve ~24 GB/s unidirectional bandwidth and message rate of 192 Million messages/second – almost double the performance numbers obtained on HDR100.
Comparison with Rome SKUs
In order to draw out performance improvement comparisons, we have selected Rome SKUs closest to their Milan counterparts in terms of hardware features such as Cache Size, TDP values, and Processor Base/Turbo Frequency.
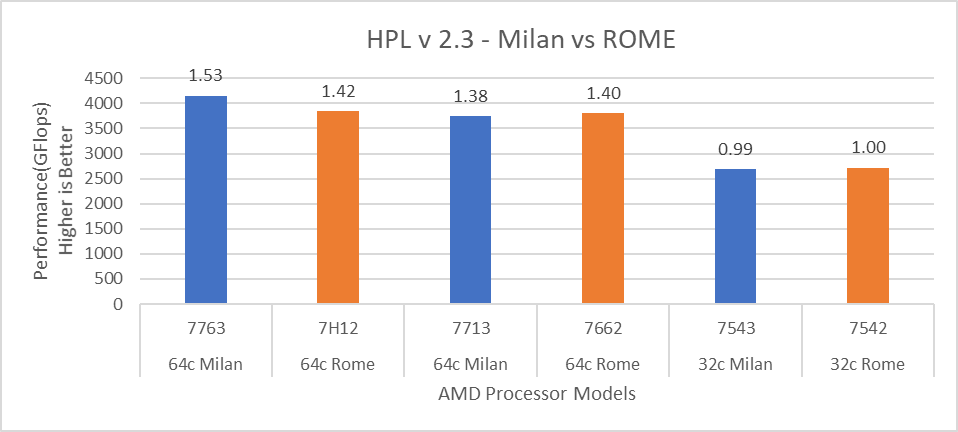
Figure 12: HPL performance comparison with Rome Processor Models
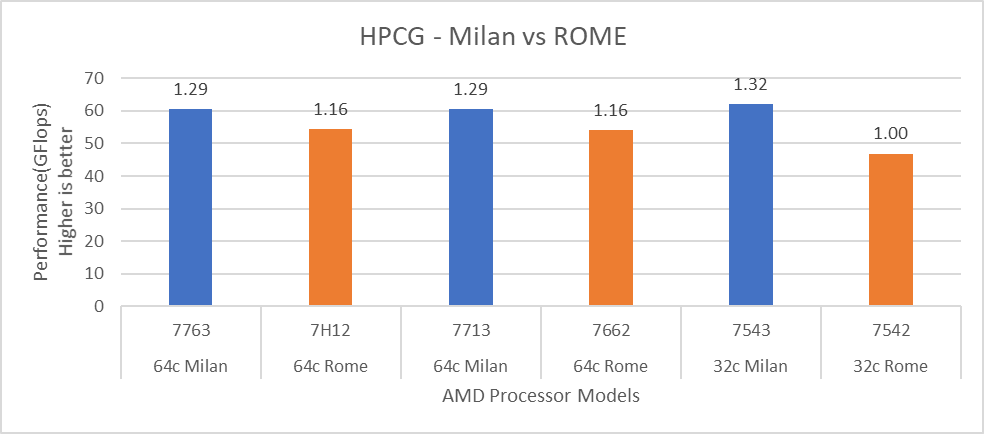
Figure 13: HPCG performance comparison with Rome Processor Models
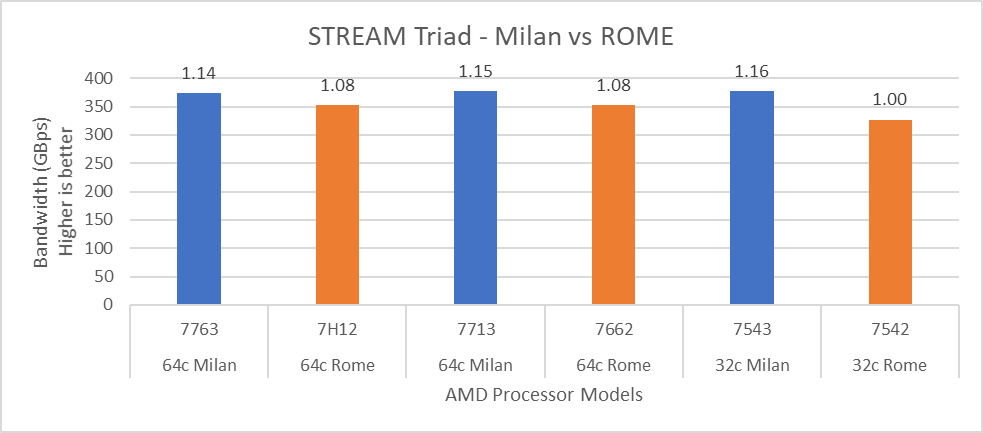
Figure 14: STREAM performance comparison with Rome Processor Models
For HPL (Figure 12) we observed that, on higher end Processor Models, Milan delivers 10% better performance than Rome. As expected, on the Milan platform, memory bandwidth bound applications like STREAM and HPCG (Figure 13 and Figure 14) gain 6-16 % and 13-32% in the performance over Rome Processor Models covered in this blog.
Summary and Future Work
Milan-based servers show expected performance upgrades, especially for the memory bandwidth bound synthetic HPC benchmarks covered in this blog. Configuring the BIOS options is important in order to get the best performance out of the system. The Hyper-Threading should be Disabled for general-purpose HPC systems, and benefits of this feature should be tested and enabled as appropriate for the synthetic benchmarks not covered in this blog.
Check back soon for subsequent blogs that describe application performance studies on our Milan Processor based cluster.

HPC Application Performance on Dell PowerEdge R7525 Servers with NVIDIA A100 GPGPUs
Tue, 24 Nov 2020 17:49:03 -0000
|Read Time: 0 minutes
Overview
The Dell PowerEdge R7525 server powered with 2nd Gen AMD EPYC processors was released as part of the Dell server portfolio. It is a 2U form factor rack-mountable server that is designed for HPC workloads. Dell Technologies recently added support for NVIDIA A100 GPGPUs to the PowerEdge R7525 server, which supports up to three PCIe-based dual-width NVIDIA GPGPUs. This blog describes the single-node performance of selected HPC applications with both one- and two-NVIDIA A100 PCIe GPGPUs.
The NVIDIA Ampere A100 accelerator is one of the most advanced accelerators available in the market, supporting two form factors:
- PCIe version
- Mezzanine SXM4 version
The PowerEdge R7525 server supports only the PCIe version of the NVIDIA A100 accelerator.
The following table compares the NVIDIA A100 GPGPU with the NVIDIA V100S GPGPU:
NVIDIA A100 GPGPU | NVIDIA V100S GPGPU | |||
Form factor | SXM4 | PCIe Gen4 | SXM2 | PCIe Gen3 |
GPU architecture | Ampere | Volta | ||
Memory size | 40 GB | 40 GB | 32 GB | 32 GB |
CUDA cores | 6912 | 5120 | ||
Base clock | 1095 MHz | 765 MHz | 1290 MHz | 1245 MHz |
Boost clock | 1410 MHz | 1530 MHz | 1597 MHz | |
Memory clock | 1215 MHz | 877 MHz | 1107 MHz | |
MIG support | Yes | No | ||
Peak memory bandwidth | Up to 1555 GB/s | Up to 900 GB/s | Up to 1134 GB/s | |
Total board power | 400 W | 250 W | 300 W | 250 W |
The NVIDIA A100 GPGPU brings innovations and features for HPC applications such as the following:
- Multi-Instance GPU (MIG)—The NVIDIA A100 GPGPU can be converted into as many as seven GPU instances, which are fully isolated at the hardware level, each using their own high-bandwidth memory and cores.
- HBM2—The NVIDIA A100 GPGPU comes with 40 GB of high-bandwidth memory (HBM2) and delivers bandwidth up to 1555 GB/s. Memory bandwidth with the NVIDIA A100 GPGPU is 1.7 times higher than with the previous generation of GPUs.
Server configuration
The following table shows the PowerEdge R7525 server configuration that we used for this blog:
Server | PowerEdge R7525 |
Processor | 2nd Gen AMD EPYC 7502, 32C, 2.5Ghz |
Memory | 512 GB (16 x 32 GB @3200MT/s) |
GPGPUs | Either of the following: 2 x NVIDIA A100 PCIe 40 GB 2 x NVIDIA V100S PCIe 32 GB |
Logical processors | Disabled |
Operating system | CentOS Linux release 8.1 (4.18.0-147.el8.x86_64) |
CUDA | 11.0 (Driver version - 450.51.05) |
gcc | 9.2.0 |
MPI | OpenMPI-3.0 |
HPL | hpl_cuda_11.0_ompi-4.0_ampere_volta_8-7-20 |
HPCG | xhpcg-3.1_cuda_11_ompi-3.1 |
GROMACS | v2020.4 |
Benchmark results
The following sections provide our benchmarks results with observations.
High-Performance Linpack benchmark
High Performance Linpack (HPL) is a standard HPC system benchmark. This benchmark measures the compute power of the entire cluster or server. For this study, we used HPL compiled with NVIDIA libraries.
The following figure shows the HPL performance comparison for the PowerEdge R7525 server with either NVIDIA A100 or NVIDIA V100S GPGPUs:
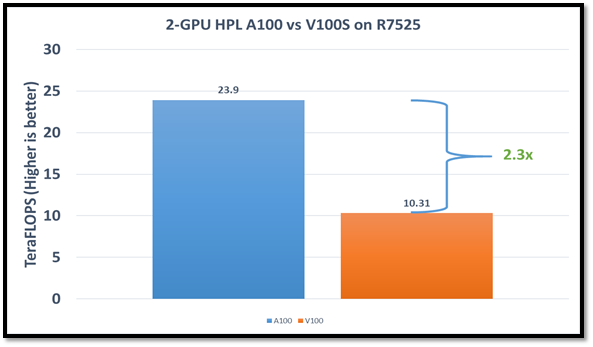
Figure1: HPL performance on the PowerEdge R7525 server with the NVIDIA A100 GPGPU compared to the NVIDIA V100SGPGPU
The problem size (N) is larger for the NVIDIA A100 GPGPU due to the larger capacity of GPU memory. We adjusted the block size (NB) used with the:
- NVIDIA A100 GPGPU to 288
- NVIDIA V100S GPGPU to 384
The AMD EPYC processors provide options for multiple NUMA combinations. We found that the best value of 4 NUMA per socket (NPS=4), with NUMA per socket 1 and 2 lower the performance by 10 percent and 5 percent respectively. In a single PowerEdge R7525 node, the NVIDIA A100 GPGPU delivers 12 TF per card using this configuration without an NVLINK bridge. The PowerEdge R7525 server with two NVIDIA A100 GPGPUs delivers 2.3 times higher HPL performance compared to the NVIDIA V100S GPGPU configuration. This performance improvement is credited to the new double-precision Tensor Cores that accelerate FP64 math.
The following figure shows power consumption of the server while running HPL on the NVIDIA A100 GPGPU in a time series. Power consumption was measured with an iDRAC. The server reached 1038 Watts at peak due to a higher GFLOPS number.
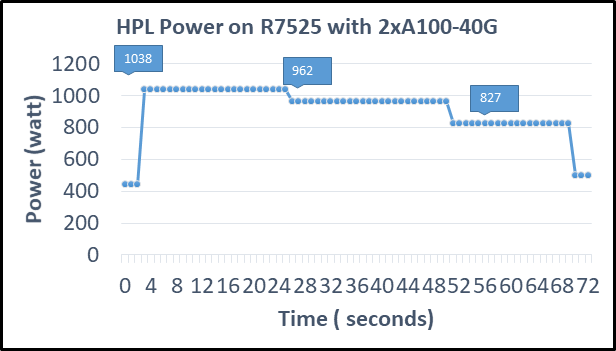
Figure2: Power consumption while running HPL
High Performance Conjugate Gradient benchmark
The High Performance Conjugate Gradient (HPCG) benchmark is based on a conjugate gradient solver, in which the preconditioner is a three-level hierarchical multigrid method using the Gauss-Seidel method.
As shown in the following figure, HPCG performs at a rate 70 percent higher with the NVIDIA A100 GPGPU due to higher memory bandwidth:
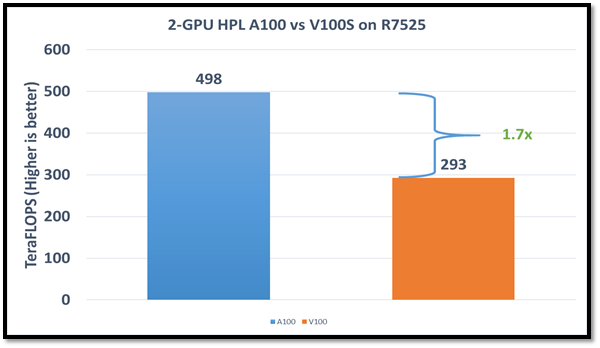
Figure 3: HPCG performance comparison
Due to different memory size, the problem size used to obtain the best performance on the NVIDIA A100 GPGPU was 512 x 512 x 288 and on the NVIDIA V100S GPGPU was 256 x 256 x 256. For this blog, we used NUMA per socket (NPS)=4 and we obtained results without an NVLINK bridge. These results show that applications such as HPCG, which fits into GPU memory, can take full advantage of GPU memory and benefit from the higher memory bandwidth of the NVIDIA A100 GPGPU.
GROMACS
In addition to these two basic HPC benchmarks (HPL and HPCG), we also tested GROMACS, an HPC application. We compiled GROMACS 2020.4 with the CUDA compilers and OPENMPI, as shown in the following table:
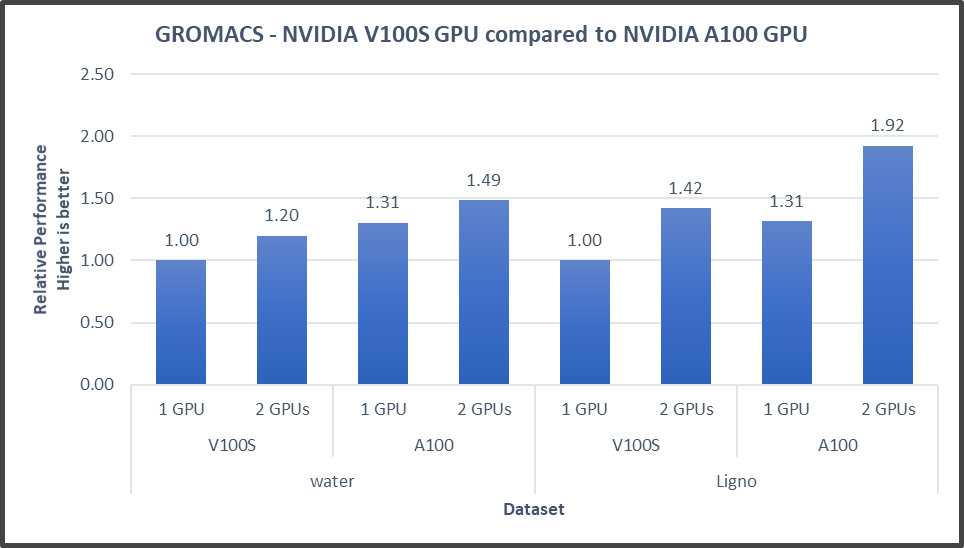
Figure4: GROMACS performance with NVIDIA GPGPUs on the PowerEdge R7525 server
The GROMACS build included thread MPI (built in with the GROMACS package). All performance numbers were captured from the output “ns/day.” We evaluated multiple MPI ranks, separate PME ranks, and different nstlist values to achieve the best performance. In addition, we used settings with the best environment variables for GROMACS at runtime. Choosing the right combination of variables avoided expensive data transfer and led to significantly better performance for these datasets.
GROMACS performance was based on a comparative analysis between NVIDIA V100S and NVIDIA A100 GPGPUs. Excerpts from our single-node multi-GPU analysis for two datasets showed a performance improvement of approximately 30 percent with the NVIDIA A100 GPGPU. This result is due to improved memory bandwidth of the NVIDIA A100 GPGPU. (For information about how the GROMACS code design enables lower memory transfer overhead, see Developer Blog: Creating Faster Molecular Dynamics Simulations with GROMACS 2020.)
Conclusion
The Dell PowerEdge R7525 server equipped with NVIDIA A100 GPGPUs shows exceptional performance improvements over servers equipped with previous versions of NVIDIA GPGPUs for applications such as HPL, HPCG, and GROMACS. These performance improvements for memory-bound applications such as HPCG and GROMACS can take advantage of higher memory bandwidth available with NVIDIA A100 GPGPUs.