


16G PowerEdge Platform BIOS Characterization for HPC with Intel Sapphire Rapids
Dell added over a dozen next-generation systems to the extensive portfolio of Dell PowerEdge 16G servers. These new systems are to accelerate performance and reliability for powerful computing across core data centers, large-scale public clouds, and edge locations.
The new PowerEdge servers feature rack, tower, and multi-node form factors, supporting the new 4th-gen Intel Xeon Scalable processors (formerly codenamed Sapphire Rapids). Sapphire Rapids still supports the AVX 512 SIMD instructions, which allow for 32 DP FLOP/cycle. The upgraded Ultra Path Interconnect (UPI) Link speed of 16 GT/s is expected to improve data movement between the sockets. In addition to core count and frequency, Sapphire Rapids-based Dell PowerEdge servers support DDR5 – 4800 MT/s RDIMMS with eight memory channels per processor, which is expected to improve the performance of memory bandwidth-bound applications.
This blog provides synthetic benchmark results and recommended BIOS settings for the Sapphire Rapids-based Dell PowerEdge Server processors. This document contains guidelines that allow the customer to optimize their application for best energy efficiency and provides memory configuration and BIOS setting recommendations for the best out-of-the-box performance and scalability on the 4th Generation of Intel® Xeon® Scalable processor families.
Test bed hardware and software details
Table 1 and Table 2 show the test bed hardware details and synthetic application details. There were 15 BIOS options explored through application performance testing. These options can be set and unset via the Remote Access Control Admin (RACADM) command in Linux or directly when the machines are in the BIOS mode.
Use the following command to set the “HPC Profile” to get the best synthetic benchmark results.
racadm set bios.sysprofilesettings.WorkloadProfile HpcProfile && sudo racadm jobqueue create BIOS.Setup.1-1 -r pwrcycle -s TIME_NOW -e TIME_NA
Once the system is up, use the below command to verify if the setting is enabled.
racadm bios.sysprofilesettings.WorkloadProfile
It should show workload profile set as HPCProfile. Please note that any changes made in BIOS settings on top of the “HPCProfile” will set this parameter to “Not Configured”, while keeping the other settings of “HPCProfile” intact.
Table 1. System details
Component | Dell PowerEdge R660 server (Air cooled) | Dell PowerEdge R760 server (Air cooled) | Dell PowerEdge C-Series (C6620) server (Direct Liquid Cooled) |
SKU | 8452Y | 6430 | 8480+ |
Cores/Socket | 36 | 32 | 56 |
Base Frequency | 2 | 1.9 | 2 |
TDP | 300 | 270 | 350 |
L3Cache | 69.12 MB | 61.44 MB | 10.75 MB |
Operating System | RHEL 8.6 | RHEL 8.6 | RHEL 8.6 |
Memory | 1024 - 64 x 16 | 1024 - 64 x 16 | 512 -32 x 16 |
BIOS | 1.0.1 | 1.0.1 | 1.0.1 |
CPLD | 1.0.1 | 1.0.1 | 1.0.1 |
Interconnect | NDR 400 | NDR 400 | NDR 400 |
Compiler | OneAPI 2023 | OneAPI 2023 | OneAPI 2023 |
Table 2. Synthetic benchmark applications details
Application Name | Version |
High-Performance Linpack (HPL) | Pre-built binary MP_LINPACK INTEL - 2.3 |
STREAM | |
High Performance Conjugate Gradient (HPCG) | Pre-built binary from INTEL oneAPI 2.3 |
Ohio State University (OSU) |
In the present study, synthetic applications such as HPL, STREAM, and HPCG are done on a single node; since the OSU benchmark is a benchmark study on MPI operations, it requires a minimum of two nodes.
Synthetic application performance details
As shown in Table 2, four synthetic applications are tested on the test bed hardware (Table 1). They are HPL, STREAM, HPCG, and OSU. The details of performance of each application are given below:
High Performance Linpack (HPL)
HPL helps measure the floating-point computation efficiency of a system [1]. The details of the synthetic benchmarks can be found in the previous blog on Intel Ice Lake processors.
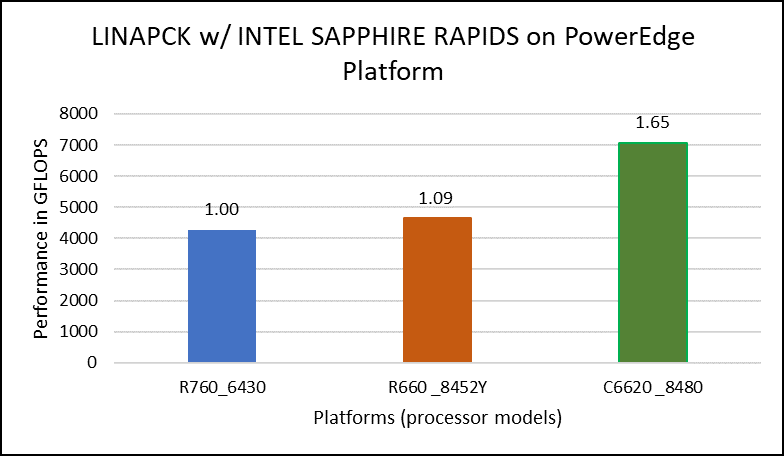
Figure 1. Performance values of HPL application for different processor models
The N and NB sizes used for the HPL benchmark are 348484 and 384, respectively, for the Intel Sapphire Rapids 6430, 8452Y processors, and 246144 and 384, respectively, for the 8480 processor. The difference in N sizes is due to the difference in available memory. Systems with Intel 6430 and 8452Y processors are equipped with 1024 GB of memory; the 8480 processor system has 512 GB. The performance numbers are captured with different BIOS settings, as discussed above, and the delta difference between each result is within 1-2%. The results with the HPC workload BIOS profile are shown in Figure 1. the 8452Y processor performs 1.09 times better than the Intel Sapphire Rapids 6430 processor and the 8480 processor performs 1.65 times better.
STREAM
The STREAM benchmark helps for measuring sustainable memory bandwidth of a processor. In general for STREAM benchmark, each array for STREAM must have at least four times the total size of all last-level caches utilized in the run or 1 million elements, whichever is larger. The STREAM array sizes used for the current study are 4×10⁷ and 12×107 with full core utilization. The STREAM benchmark was also tested with 15 BIOS combinations, and the results depicted in Figure 2 are for the HPC workload profile bios test case. The STREAM TRIAD results are captured here in GB/sec. Results show improvement in performance compared to the Intel 3rd Generation Xeon Scalable processors, such as the 8380 and 6338. Also, if comparing 6430, 8452Y and 8480 processors, the STREAM results with 8452Y and 8480 Intel 4th Generation Xeon Scalable processors are, respectively, 1.12 and 1.24 times better than the Intel 6430 processor.
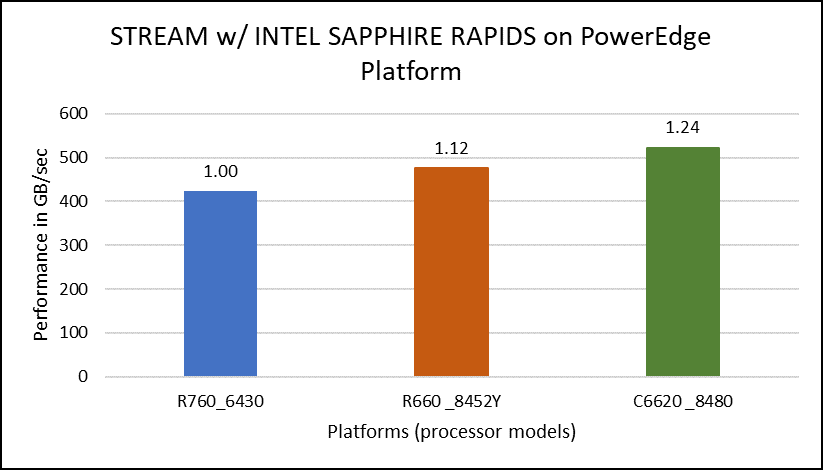
Figure 2. Performance values of STREAM application for different processor models
HPCG
The HPCG benchmark aims to simulate the data access patterns of applications such as sparse matrix calculations, assessing the impact of memory subsystem and internal connectivity constraints on the computing performance of High-Performance Computers, or supercomputers. The different problem sizes used in the study are 192, 256, 176, 168, and so on. Additionally, in this benchmark study, the variation in performance within different BIOS options was within 1–2 percent. Figure 3 shows the HPCG performance results for Intel Sapphire Rapids processors 6430, 8452Y and 8480. In comparison with the Intel 6430 processor, the 8452Y shows 1.02 times and the 8480 shows 1.12 times better performance.
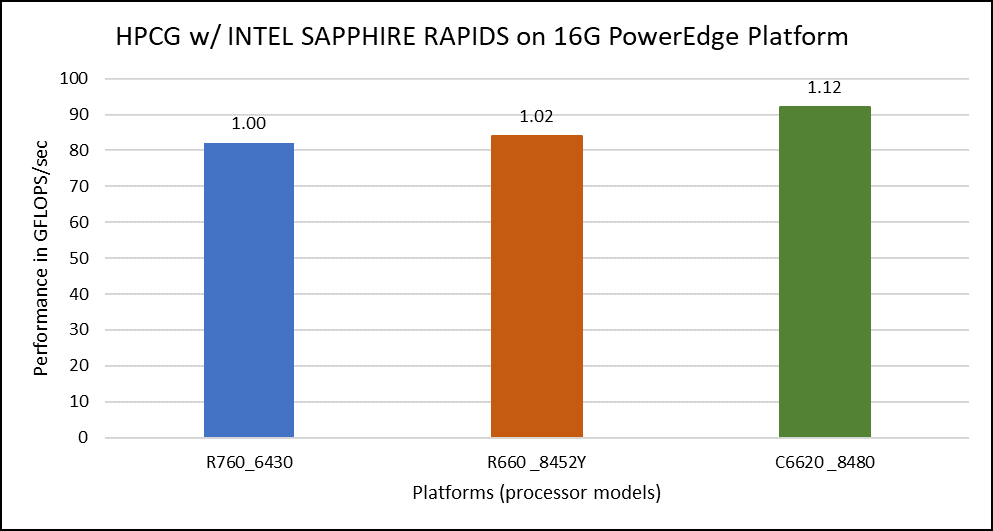
Figure 3. Performance values of HPCG application for different processor models
OSU Micro Benchmarks
OSU Micro Benchmarks are used for measuring the performance of MPI implementations, so we used two nodes connected to NDR200. OSU benchmark determines uni-directional and bi-directional bandwidth and message rate and latency between the nodes. The OSU benchmark was run on all three Intel processors (6430, 8452Y, and 8480) with single core per node; however, we have shown one of the system/processors (Intel 8480 processor) results in the blog starting from Figures 4-7.
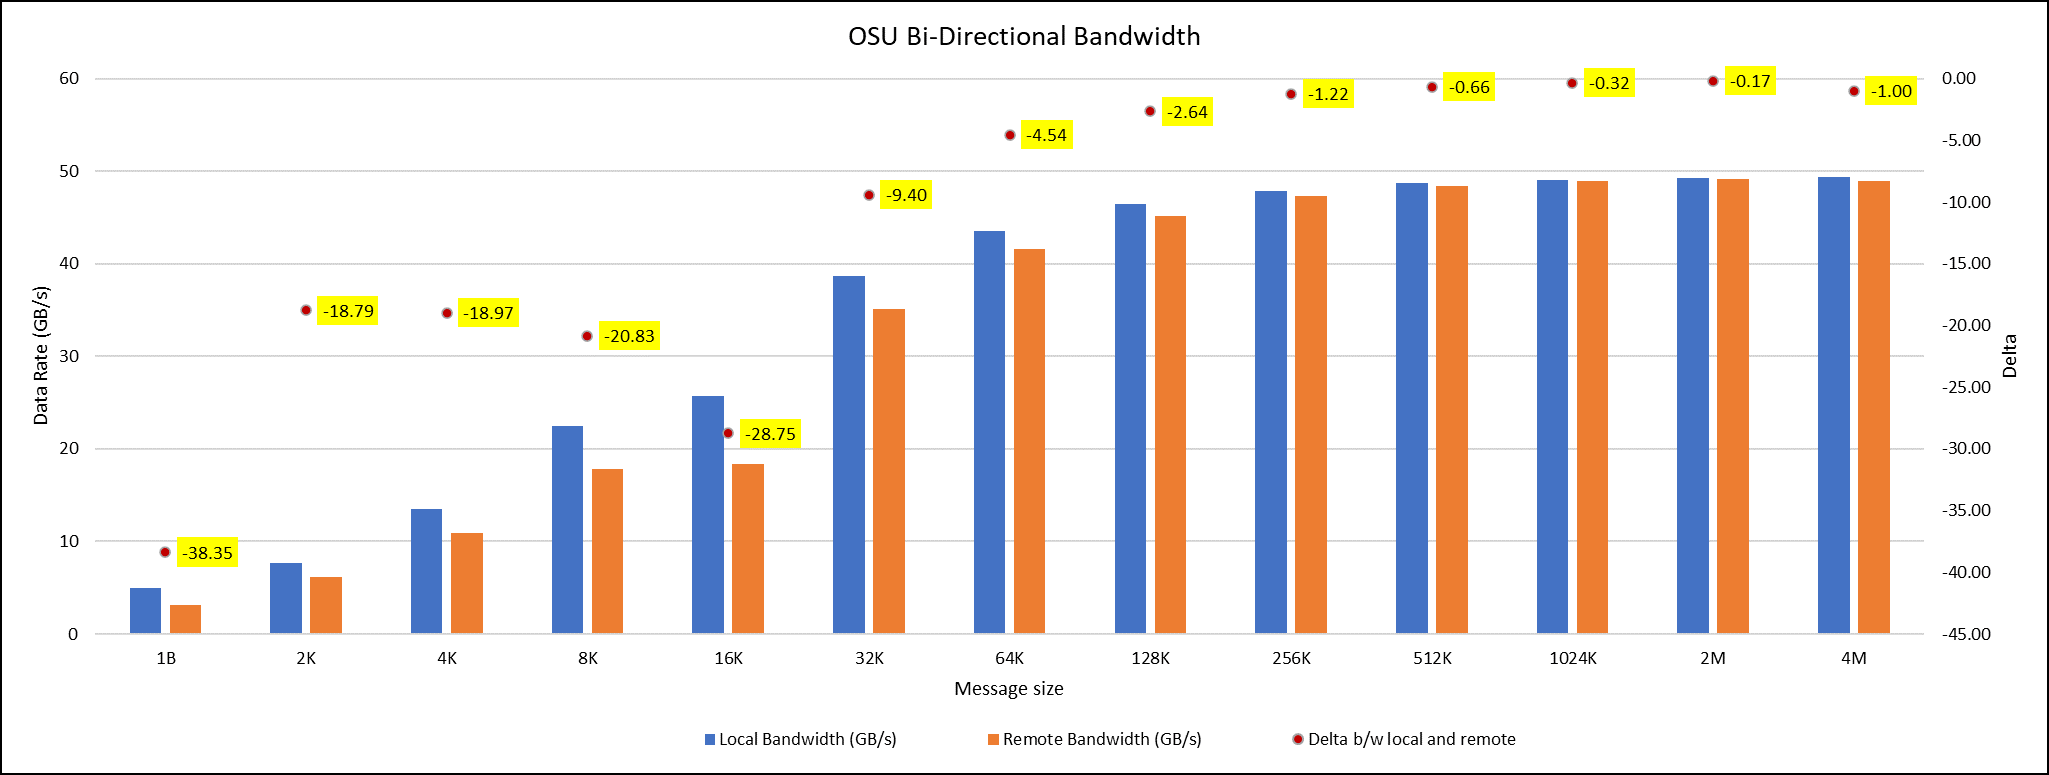
Figure 4. OSU Bi-Directional bandwidth chart for C6620_8480 intel processor
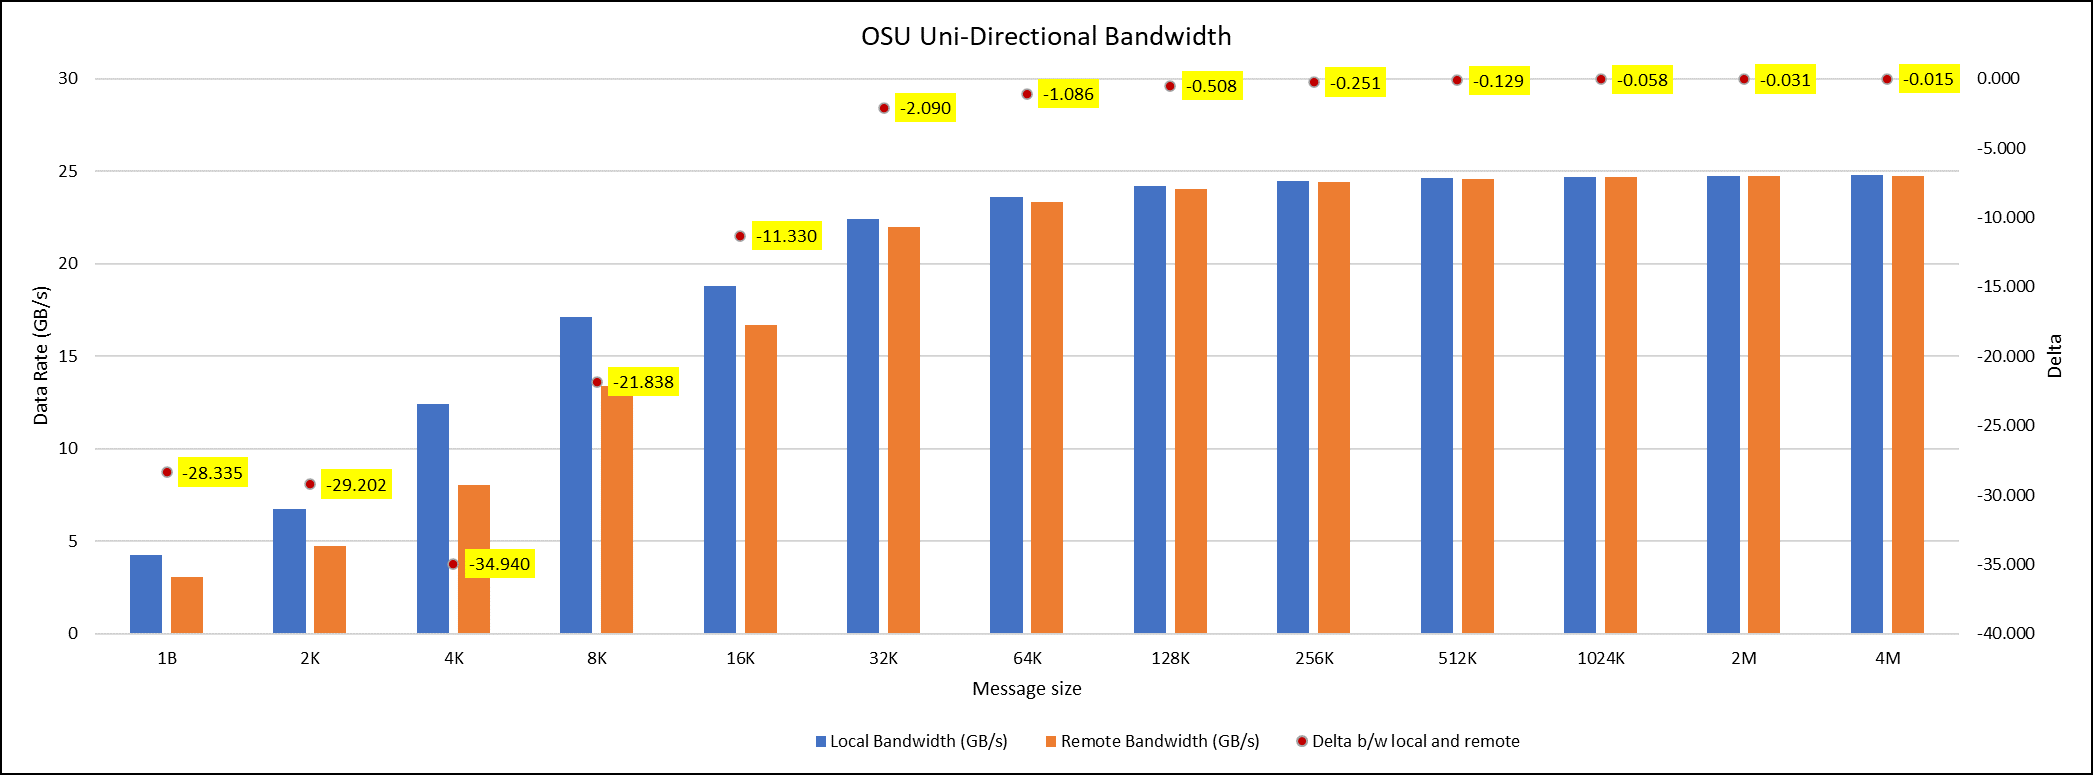
Figure 5. OSU Uni-Directional bandwidth chart for C6620_8480 intel processor
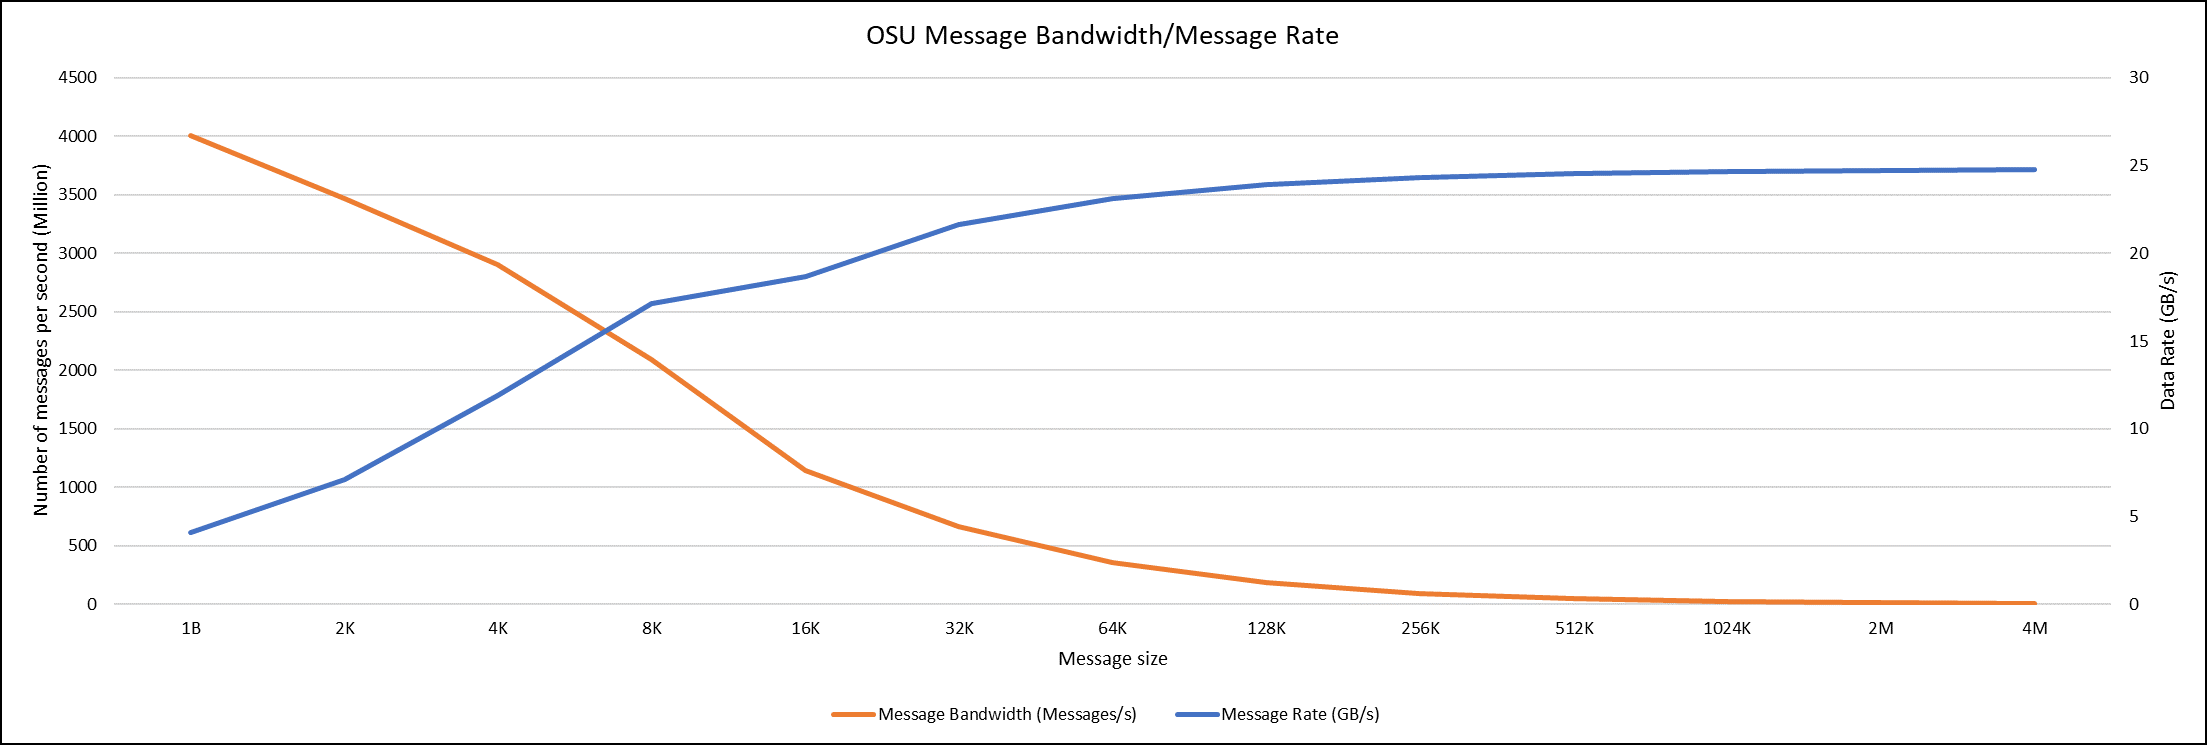
Figure 6. OSU Message bandwidth/Message rate chart for C6620_8480 intel processor
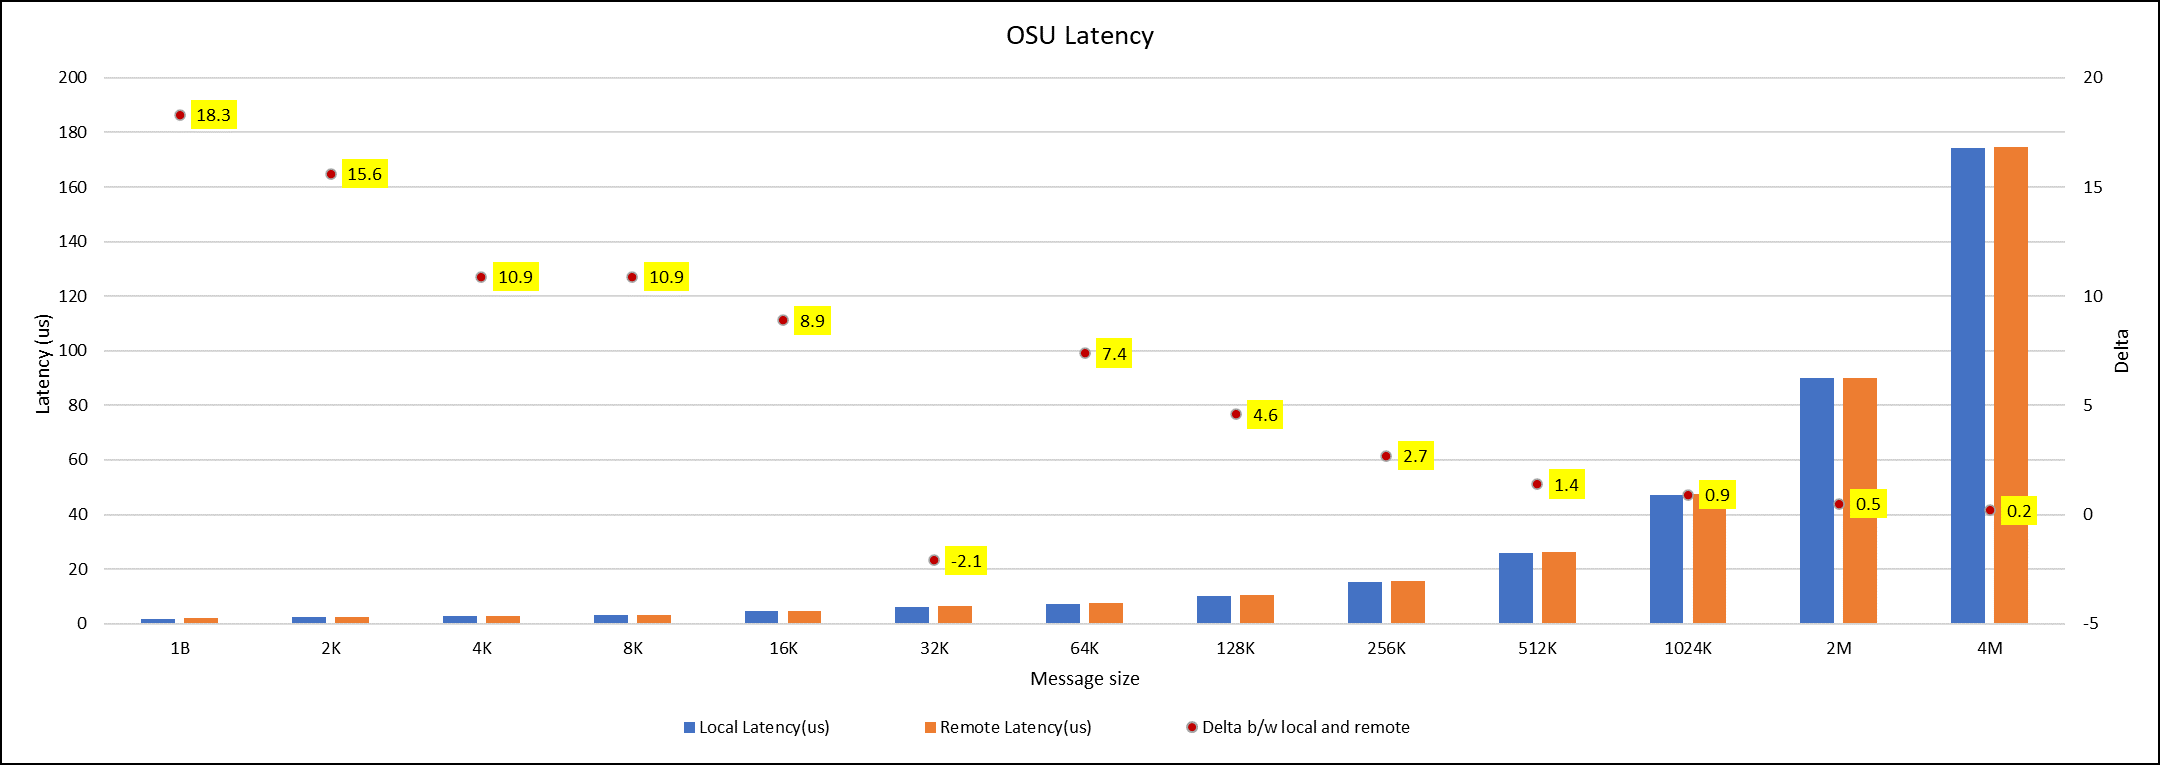
Figure 7. OSU Latency chart for C6620_8480 intel processor
All fifteen BIOS combinations were tested; the OSU benchmark also shows similar performance with a difference within a 1-2% delta.
Conclusion
The performance comparison between various Intel Sapphire Rapids processors (6430, 8452Y and 8480) is done with the help of synthetic benchmark applications such as HPL, STREAM, HPCG and OSU. Nearly 15 BIOS configurations are set on the system, and performance values with different benchmarks were captured to identify the best BIOS configuration to set. From the results, it was found that the difference in performance with any benchmarks for all the BIOS configurations applied is below 3 percent delta.
Therefore, the HPC workload profile provides better benchmark results with all the Intel Sapphire Rapids processors. Among the three Intel processors compared, the 8480 had the highest application performance value, while the 8452Y is in second place. The maximum difference in performance between processors was found for the HPL benchmark, and it was the 8480 Intel Sapphire Rapids processor, which offers 1.65 times better results than the Intel 6430 processor.
Watch out for future application benchmark results on this blog! Visit our page for previous blogs.