


New Frontiers—Dell EMC PowerEdge R750xa Server with NVIDIA A100 GPUs
Dell Technologies has released the new PowerEdge R750xa server, a GPU workload-based platform that is designed to support artificial intelligence, machine learning, and high-performance computing solutions. The dual socket/2U platform supports 3rd Gen Intel Xeon processors (code named Ice Lake). It supports up to 40 cores per processor, has eight memory channels per CPU, and up to 32 DDR4 DIMMs at 3200 MT/s DIMM speed. This server can accommodate up to four double-width PCIe GPUs that are located in the front left and the front right of the server.
Compared with the previous generation PowerEdge C4140 and PowerEdge R740 GPU platform options, the new PowerEdge R750xa server supports larger storage capacity, provides more flexible GPU offerings, and improves the thermal requirement
Figure 1 PowerEdge R750xa server
The NVIDIA A100 GPUs are built on the NVIDIA Ampere architecture to enable double precision workloads. This blog evaluates the new PowerEdge R750xa server and compares its performance with the previous generation PowerEdge C4140 server.
The following table shows the specifications for the NVIDIA GPU that is discussed in this blog and compares the performance improvement from the previous generation.
Table 1 NVIDIA GPU specifications
PCIe | Improvement | ||
GPU name | A100 | V100 |
|
GPU architecture | Ampere | Volta | - |
GPU memory | 40 GB | 32 GB | 60% |
GPU memory bandwidth | 1555 GB/s | 900 GB/s | 73% |
Peak FP64 | 9.7 TFLOPS | 7 TFLOPS | 39% |
Peak FP64 Tensor Core | 19.5 TFLOPS | N/A | - |
Peak FP32 | 19.5 TFLOPS | 14 TFLOPS | 39% |
Peak FP32 Tensor Core | 156 TFLOPS 312 TFLOPS* | N/A | - |
Peak Mixed Precision FP16 ops/ FP32 Accumulate | 312 TFLOPS 624 TFLOPS* | 125 TFLOPS | 5x |
GPU base clock | 765 MHz | 1230 MHz | - |
Peak INT8 | 624 TOPS 1,248 TOPS* | N/A | - |
GPU Boost clock | 1410 MHz | 1380 MHz | 2.1% |
NVLink speed | 600 GB/s | N/A | - |
Maximum power consumption | 250 W | 250 W | No change |
Test bed and applications
This blog quantifies the performance improvement of the GPUs with the new PowerEdge GPU platform.
Using a single node PowerEdge R750xa server in the Dell HPC & AI Innovation Lab, we derived all results presented in this blog from this test bed. This section describes the test bed and the applications that were evaluated as part of the study. The following table provides test environment details:
Table 2 Server configuration
Component | Test Bed 1 | Test Bed 2 |
Server | Dell PowerEdge R750xa
| Dell PowerEdge C4140 configuration M |
Processor | Intel Xeon 8380 | Intel Xeon 6248 |
Memory | 32 x 16 GB @ 3200MT/s | 16 x 16 GB @ 2933MT/s |
Operating system | Red Hat Enterprise Linux 8.3 | Red Hat Enterprise Linux 8.3 |
GPU | 4 x NVIDIA A100-PCIe-40 GB GPU | 4 x NVIDIA V100-PCIe-32 GB GPU |
The following table provides information about the applications and benchmarks used:
Table 3 Benchmark and application details
Application | Domain | Version | Benchmark dataset |
High-Performance Linpack | Floating point compute-intensive system benchmark | xhpl_cuda-11.0-dyn_mkl-static_ompi-4.0.4_gcc4.8.5_7-23-20 | Problem size is more than 95% of GPU memory |
HPCG | Sparse matrix calculations | xhpcg-3.1_cuda_11_ompi-3.1 | 512 * 512 * 288
|
GROMACS | Molecular dynamics application | 2020 | Ligno Cellulose Water 1536 Water 3072 |
LAMMPS | Molecular dynamics application | 29 October 2020 release | Lennard Jones |
LAMMPS
Large-Scale Atomic/Molecular Massively Parallel simulator (LAMMPS) is distributed by Sandia National Labs and the US Department of Energy. LAMMPS is open-source code that has different accelerated models for performance on CPUs and GPUs. For our test, we compiled the binary using the KOKKOS package, which runs efficiently on GPUs.
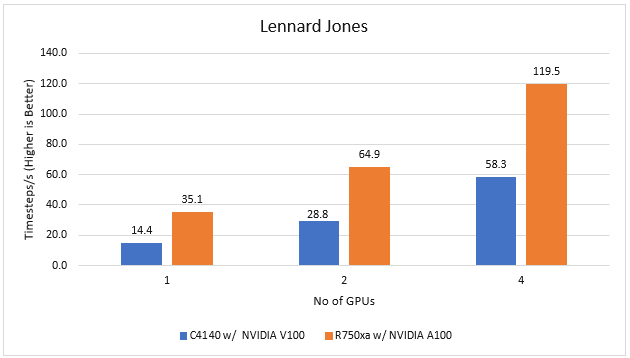
Figure 2 LAMMPS Performance on PowerEdge R750xa and PowerEdge C4140 servers
With the newer generation GPUs, this application improves 2.4 times compared to single GPU performance. The overall performance from a single server improved twice with the PowerEdge R750xa server and NVIDIA A100 GPUs.
GROMACS
GROMACS is a free and open-source parallel molecular dynamics package designed for simulations of biochemical molecules such as proteins, lipids, and nucleic acids. It is used by a wide variety of researchers, particularly for biomolecular and chemistry simulations. GROMACS supports all the usual algorithms expected from modern molecular dynamics implementation. It is open-source software with the latest versions available under the GNU Lesser General Public License (LGPL).
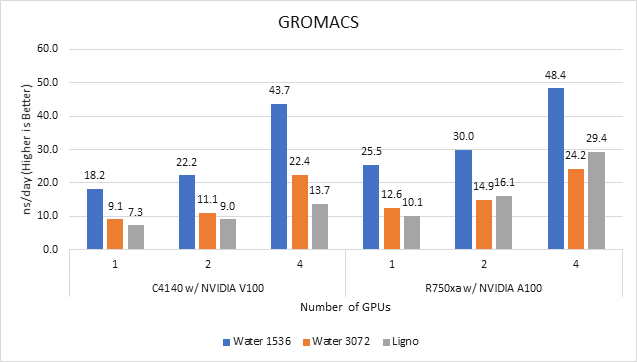
Figure 3 GROMACS performance on PowerEdge C4140 and r750xa servers
With the newer generation GPUs, this application improved approximately 1.5 times across the dataset compared to single GPU performance. The overall performance from a single server improved 1.5 times with a PowerEdge R750xa server and NVIDIA A100 GPUs.
High-Performance Linpack
High-Performance Linpack (HPL) needs no introduction in the HPC arena. It is a widely used standard benchmark tests in the industry.
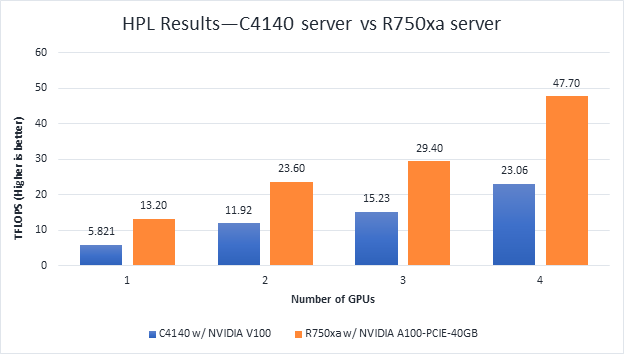
Figure 4 HPL Performance on the PowerEdge R750xa server with A100 GPU and PowerEdge C4140 server with V100 GPU
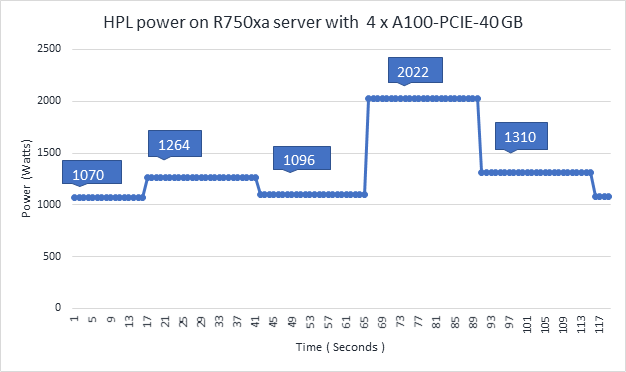
Figure 5 Power use of the HPL running on NVIDIA GPUs
From Figure 4 and Figure 5, the following results were observed:
- Performance—For GPU count, the NVIDIA A100 GPU demonstrates twice the performance of the NVIDIA V100 GPU. Higher memory size, double precision FLOPS, and a newer architecture contribute to the improvement for the NVIDIA A100 GPU.
- Scalability—The PowerEdge R750xa server with four NVIDIA A100-PCIe-40 GB GPUs delivers 3.6 times higher HPL performance compared to one NVIDIA A100-PCIE-40 GB GPU. The NVIDIA A100 GPUs scale well inside the PowerEdge R750xa server for the HPL benchmark.
- Higher Rpeak—The HPL code on NVIDIA A100 GPUs uses the new double-precision Tensor cores. The theoretical peak for each GPU is 19.5 TFlops, as opposed to 9.7 TFlops.
- Power—Figure 5 shows power consumption of a complete HPL run with the PowerEdge R750xa server using four A100-PCIe GPUs. This result was measured with iDRAC commands, and the peak power consumption was observed as 2022 Watts. Based on our previous observations, we know that the PowerEdge C4140 server consumes approximately 1800 W of power.
HPCG
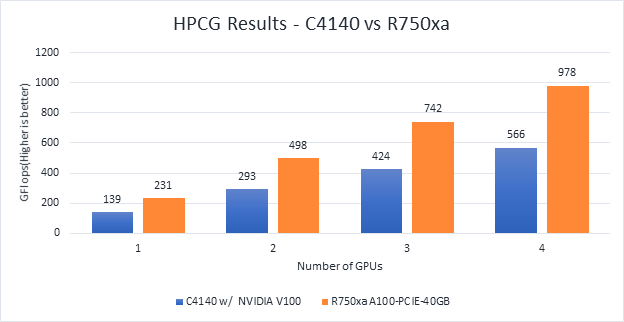
Figure 6 Scaling GPU performance data for HPCG Benchmark
As discussed in other blogs, high performance conjugate gradient (HPCG) is another standard benchmark to test data access patterns of sparse matrix calculations. From the graph, we see that the HPCG benchmark scales well with this benchmark resulting in 1.6 times performance improvement over the previous generation PowerEdge C4140 server with an NVIDIA V100 GPU.
The 72 percent improvement in memory bandwidth of the NVIDIA A100 GPU over the NVIDIA V100 GPU contributes to the performance improvement.
Conclusion
In this blog, we introduced the latest generation PowerEdge R750xa platform and discussed the performance improvement over the previous generation PowerEdge C4140 server. The PowerEdge R750xa server is a good option for customers looking for an Intel Xeon scalable CPU-based platform powered with NVIDIA GPUs.
With the newer generation PowerEdge R750xa server and NVIDIA A100 GPUs, the applications discussed in this blog show significant performance improvement.
Next steps
In future blogs, we plan to evaluate NVLINK bridge support, which is another important feature of the PowerEdge R750xa server and NVIDIA A100 GPUs.
Related Blog Posts

Overview of MLPerf™ Inference v2.0 Results on Dell Servers
Fri, 09 Sep 2022 15:15:36 -0000
|Read Time: 0 minutes
Dell Technologies has been an active participant in the MLCommons™ Inference benchmark submission since day one. We have completed five rounds of inference submission.
This blog provides an overview of the latest results of MLPerf Inference v2.0 closed data center, closed data center power, closed edge, and closed edge power categories on Dell servers from our HPC & AI Innovation Lab. It shows optimal inference and power (performance per watt) performance for Dell GPU-based servers (DSS 8440, PowerEdge R750xa, PowerEdge XE2420, PowerEdge XE8545, and PowerEdge XR12). The previous blog about MLPerf Inference v1.1 performance results can be found here.
What is new?
- There were 3,800 performance results for this round compared to 1,800 performance results for v1.1. Additionally, 885 systems in v2.0 compared to 424 systems in v1.1 shows that there were more than twice the systems submitted for this round.
- For the 3D U-Net benchmark, the dataset now used is the KiTs 2019 Kidney Tumor Segmentation set.
- Early stopping was introduced in this round to replace a deterministic minimum query count with a function that dynamically determines when further runs are not required to identify additional performance gain.
Results at a glance
Dell Technologies submitted 167 results to the various categories. The Dell team made 86 submissions to the closed data center category, 28 submissions to the closed data center power category, and 53 submissions to the closed edge category. For the closed data center category, the Dell team submitted the second most results. In fact, Dell Technologies submitted results from 17 different system configurations with the NVIDIA TensorRT and NVIDIA Triton inference engines. Among these 17 configurations, the PowerEdge XE2420 server with T4 and A30 GPUs and the PowerEdge XR12 server with the A2 GPU were two new systems that have not been submitted before. Additionally, Dell Technologies submitted to the reintroduced Multiterm scenario. Only Dell Technologies submitted results for different host operating systems.
Noteworthy results
Noteworthy results include:
- The PowerEdge XE8545 and R750xa servers yield Number One results for performance per accelerator with NVIDIA A100 GPUs. The use cases for this top classification include Image Classification, Object Detection, Speech-to-text, Medical Imaging, Natural Language Processing, and Recommendation.
- The DSS 8440 server yields Number Two results for system performance for multiple benchmarks including Speech-to-text, Object Detection, Natural Language Processing, and Medical Image Segmentati on uses cases among all submissions.
- The PowerEdge R750xa server yields Number One results for the highest system performance for multiple benchmarks including Image Classification, Object Detection, Speech-to-text, Natural Language Processing, and Recommendation use cases among all the PCIe-based GPU servers.
- The PowerEdge XE8545 server yields Number One results for the lowest multistrand latency with NVIDIA Multi-Instance GPU (MIG) in the edge category for the Image Classification and Object Detection use cases.
- The PowerEdge XE2420 server yields Number One results for the highest T4 GPU inference results for the Image Classification, Speech-to-text, and Recommendation use cases.
- The PowerEdge XR12 server yields Number One results for the highest performance per watt with NVIDIA A2 GPU results in power for the Image Classification, Object Detection, Speech-to-text, Natural Language Processing, and Recommendation use cases.
MLPerf Inference v2.0 benchmark results
The following graphs highlight the performance metrics for the Server and Offline scenarios across the various benchmarks from MLCommons. Dell Technologies presents results as an method for our customers to identify options to suit their deep learning application demands. Additionally, this performance data serves as a reference point to enable sizing of deep learning clusters. Dell Technologies strives to submit as many results as possible to offer answers to ensure that customer questions are resolved.
For the Server scenario, the performance metric is queries per second (QPS). For the Offline scenario, the performance metric is Offline samples per second. In general, the metrics represent throughput, and a higher throughput indicates a better result. In the following graphs, the Y axis is an exponentially scaled axis representing throughput and the X axis represents the systems under test (SUTs) and their corresponding models. The SUTs are described in the appendix.
Figure 1 through Figure 6 show the per card performance of the various SUTs on the ResNet 50, BERT, SSD, 3dUnet, RNNT, and DLRM modes respectively in the Server and Offline scenarios:
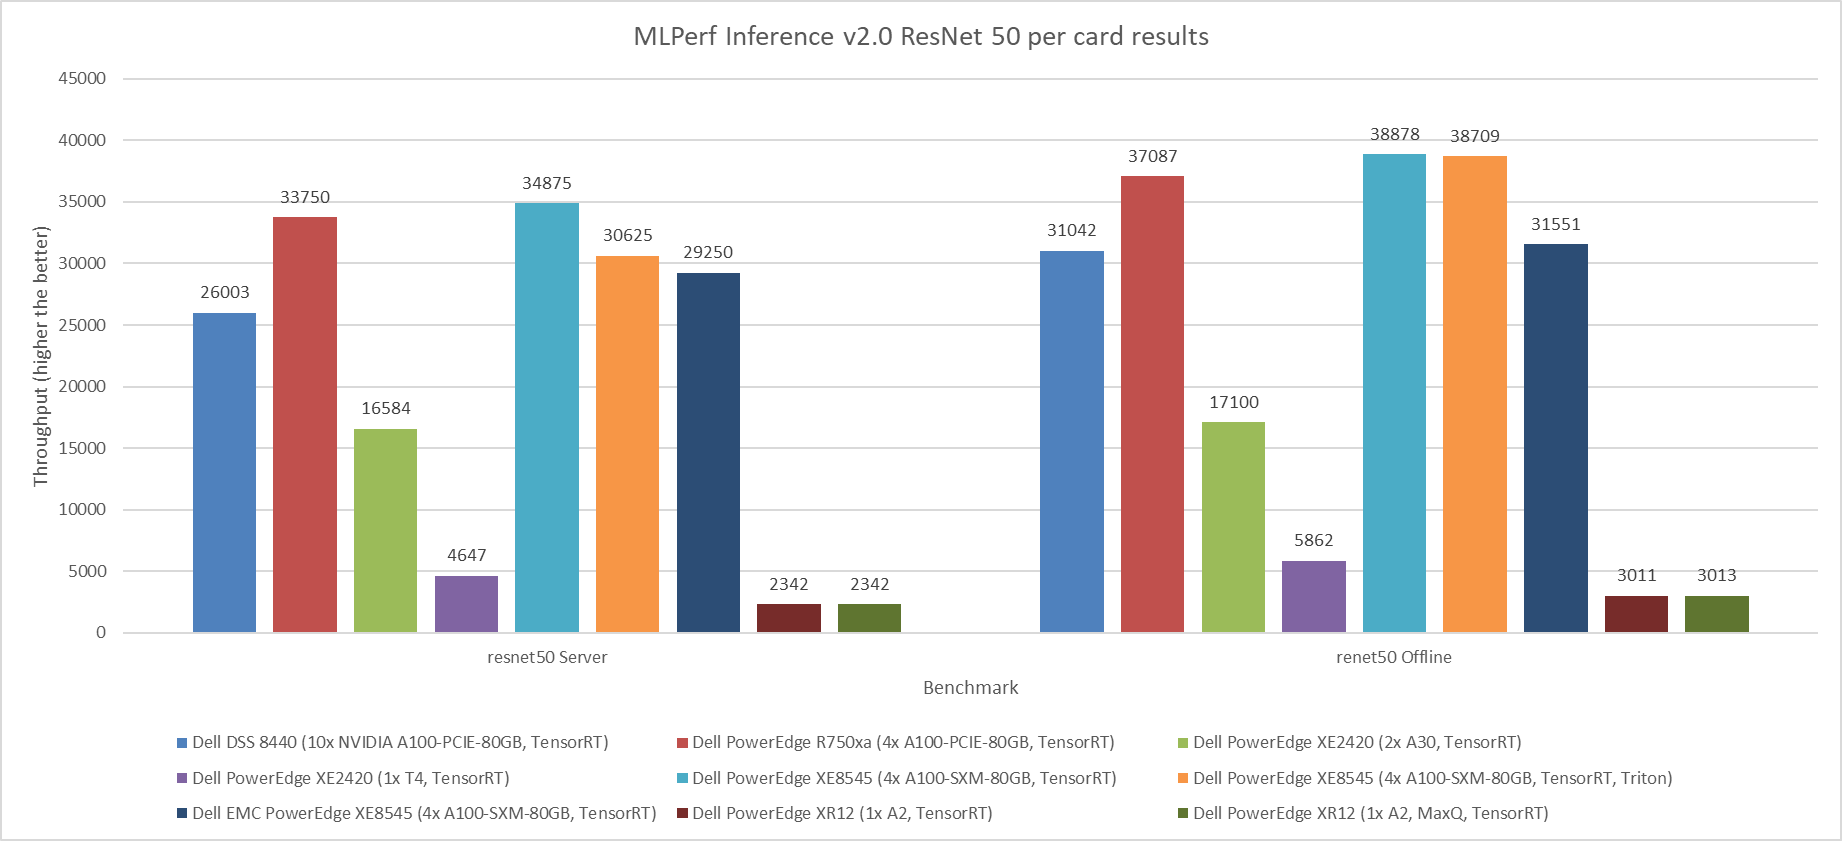
Figure 1: MLPerf Inference v2.0 ResNet 50 per card results
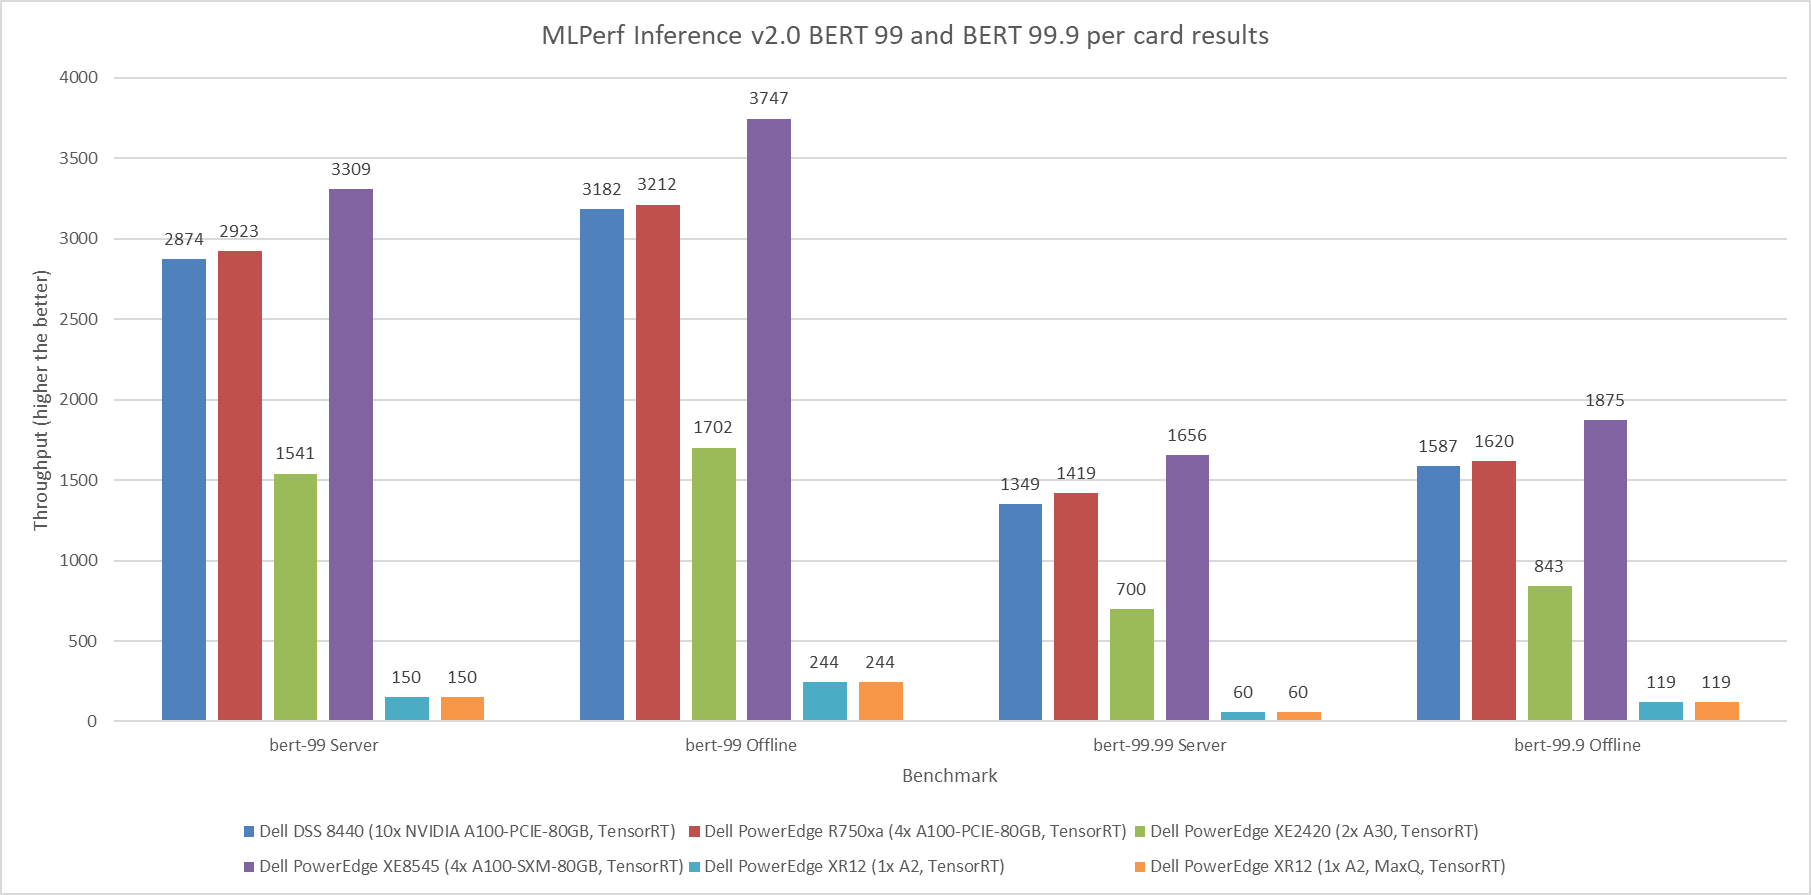
Figure 2: MLPerf Inference v2.0 BERT default and high accuracy per card results
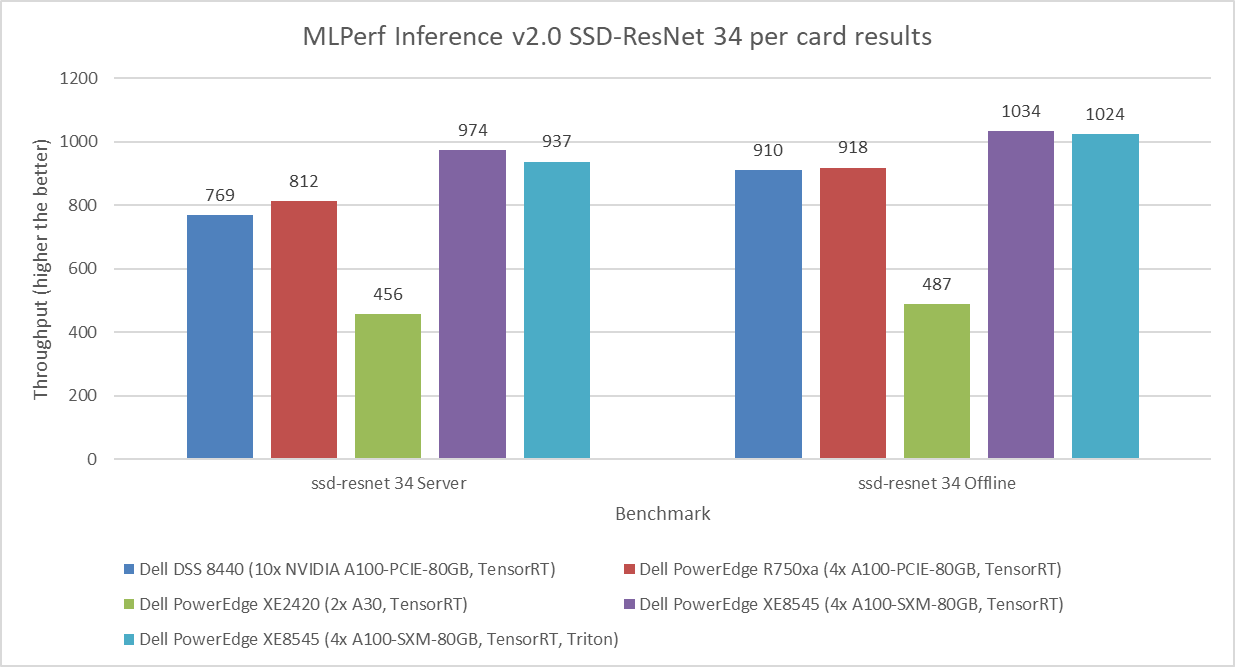
Figure 3: MLPerf Inference v2.0 SSD-ResNet 34 per card results
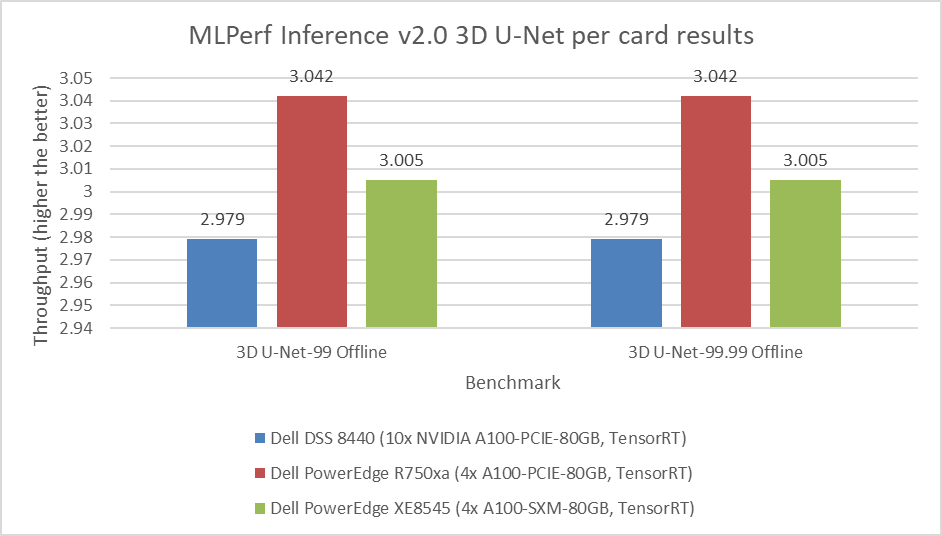
Figure 4: MLPerf Inference v2.0 3D U-Net per card results
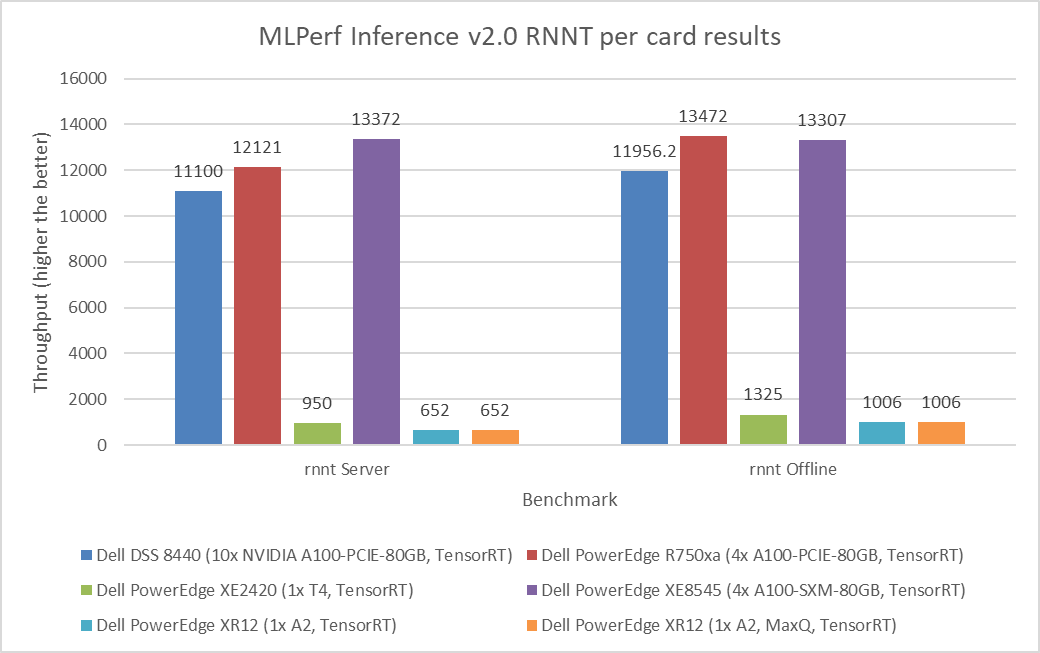
Figure 5: MLPerf Inference v2.0 RNNT per card results
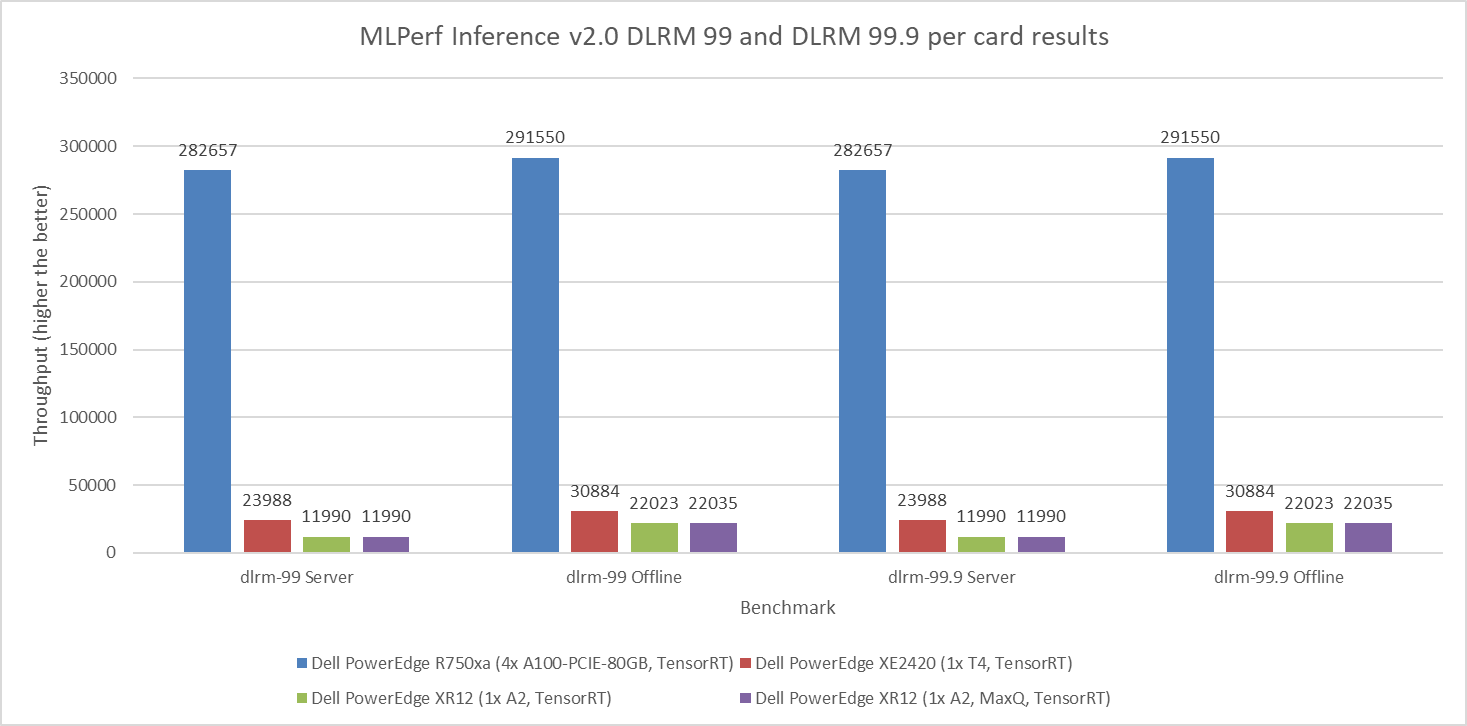
Figure 6: MLPerf Inference v2.0 DLRM default and high accuracy per card results
Observations
The results in this blog have been officially submitted to and accepted by the MLCommons organization. These results have passed compliance tests, been peer reviewed, and adhered to the constraints enforced by MLCommons. Customers and partners can reproduce our results by following steps to run MLPerf Inference v2.0 in its GitHub repository.
Submissions from Dell Technologies included approximately 140 performance results and 28 performance and power results. Across the various workload tasks including Image Classification, Object Detection, Medical Image Segmentation, Speech-to-text, Language Processing, and Recommendation, server performance from Dell Technologies was promising.
Dell servers performed with optimal performance and power results. They were configured with different GPUs such as:
- NVIDIA A30 Tensor Core GPU
- NVIDIA A100 (PCIe and SXM)
- NVIDIA T4 Tensor Core GPU
- NVIDIA A2 Tensor Core GPU, which is newly released
More information about performance for specific configurations that are not discussed in this blog can be found in the v1.1 or v1.0 results.
The submission included results from different inference backends such as NVIDIA TensorRT and NVIDIA Triton. The appendix provides a summary of the full hardware and software stacks.
Conclusion
This blog quantifies the performance of Dell servers in the MLPerf Inference v2.0 round of submission. Readers can use these results to make informed planning and purchasing decisions for their AI workload needs.
Appendix
Software stack
The NVIDIA Triton Inference Server is an open-source inferencing software tool that aids in the deployment and execution of AI models at scale in production. Triton not only works with all major frameworks but also with customizable backends, further enabling developers to focus on their AI development. It is a versatile tool because it supports any inference type and can be deployed on any platform including CPU, GPU, data center, cloud, or edge. Additionally, Triton supports the rapid and reliable deployment of AI models at scale by integrating well with Kubernetes, Kubeflow, Prometheus, and Grafana. Triton supports the HTTP/REST and GRPC protocols that allow remote clients to request inferencing for any model that the server manages.
The NVIDIA TensorRT SDK delivers high-performance deep learning inference that includes an inference optimizer and runtime. It is powered by CUDA and offers a unified solution to deploy on various platforms including edge or data center. TensorRT supports the major frameworks including PyTorch, TensorFlow, ONNX, and MATLAB. It can import models trained in these frameworks by using integrated parsers. For inference, TensorRT performs orders of magnitude faster than its CPU-only counterparts.
NVIDIA MIG can partition GPUs into several instances that extend compute resources among users. MIG enables predictable performance and maximum GPU use by running jobs simultaneously on the different instances with dedicated resources for compute, memory, and memory bandwidth.
SUT configuration
The following table describes the SUT from this round of data center inference submission:
Table 1: MLPerf Inference v2.0 system configurations for DSS 8440 and PowerEdge R750xa servers
Platform | DSS 8440 10xA100 TensorRT | R750xa 4xA100 TensorRT |
MLPerf system ID | DSS8440_A100_PCIE_80GBx10_TRT | R750xa_A100_PCIE_80GBx4_TRT |
Operating system | CentOS 8.2 | |
CPU | Intel Xeon Gold 6248R CPU @ 3.00 GHz | Intel Xeon Gold 6338 CPU @ 2.00 GHz |
Memory | 768 GB | 1 TB |
GPU | NVIDIA A100 | |
GPU form factor | PCIe | |
GPU count | 10 | 4 |
Software stack | TensorRT 8.4.0 CUDA 11.6 cuDNN 8.3.2 Driver 510.39.01 DALI 0.31.0 | |
Table 2: MLPerf Inference v2.0 system configurations for PowerEdge XE2420 servers
Platform | PowerEdge XE2420 1xA30 TensorRT | PowerEdge XE2420 2xA30 TensorRT | PowerEdge XE2420 1xA30 TensorRT MaxQ | PowerEdge XE2420 1xAT4 TensorRT |
MLPerf system ID | XE2420_A30x1_TRT | XE2420_A30x2_TRT | XE2420_A30x1_TRT_MaxQ | XE2420_T4x1_TRT |
Operating system | Ubuntu 20.04.4 | CentOS 8.2.2004 | ||
CPU | Intel Xeon Gold 6252 CPU @ 2.10 GHz | Intel Xeon Gold 6252N CPU @ 2.30 GHz | Intel Xeon Silver 4216 CPU @ 2.10 GHz | Intel Xeon Gold 6238 CPU @ 2.10 GHz |
Memory | 1 TB | 64 GB | 256 GB | |
GPU | NVIDIA A30 | NVIDIA T4 | ||
GPU form factor | PCIe | |||
GPU count | 1 | 2 | 1 | 1 |
Software stack | TensorRT 8.4.0 CUDA 11.6 cuDNN 8.3.2 Driver 510.39.01 DALI 0.31.0 | |||
Table 3: MLPerf Inference v2.0 system configurations for PowerEdge XE8545 servers
Platform | PowerEdge XE8545 4xA100 TensorRT | PowerEdge XE8545 4xA100 TensorRT, Triton | PowerEdge XE8545 1xA100 MIG 1x1g.10g TensorRT
|
MLPerf system ID | XE8545_A100_SXM_80GBx4_TRT | XE8545_A100_SXM_80GBx4_TRT_Triton | XE8545_A100_SXM_80GB_1xMIG_TRT |
Operating system | Ubuntu 20.04.3 | ||
CPU | AMD EPYC 7763 | ||
Memory | 1 TB | ||
GPU | NVIDIA A100-SXM-80 GB | NVIDIA A100-SXM-80 GB (1x1g.10gb MIG) | |
GPU form factor | SXM | ||
GPU count | 4 | 1 | |
Software stack | TensorRT 8.4.0 CUDA 11.6 CuDNN 8.3.2 Driver 510.47.03 DALI 0.31.0 | ||
| Triton 22.01 |
| |
Table 4: MLPerf Inference v2.0 system configurations for PowerEdge XR12 servers
Platform | PowerEdge XR12 1xA2 TensorRT | PowerEdge XR12 1xA2 TensorRT MaxQ |
MLPerf system ID | XR12_A2x1_TRT | XR12_A2x1_TRT_MaxQ |
Operating system | CentOS 8.2 | |
CPU | Intel Xeon Gold 6312U CPU @ 2.40 GHz | |
Memory | 256 GB | |
GPU | NVIDIA A2 | |
GPU form factor | PCIe | |
GPU count | 1 | |
Software stack | TensorRT 8.4.0 CUDA 11.6 cuDNN 8.3.2 Driver 510.39.01 DALI 0.31.0 | |

HPC Application Performance on Dell PowerEdge R7525 Servers with NVIDIA A100 GPGPUs
Tue, 24 Nov 2020 17:49:03 -0000
|Read Time: 0 minutes
Overview
The Dell PowerEdge R7525 server powered with 2nd Gen AMD EPYC processors was released as part of the Dell server portfolio. It is a 2U form factor rack-mountable server that is designed for HPC workloads. Dell Technologies recently added support for NVIDIA A100 GPGPUs to the PowerEdge R7525 server, which supports up to three PCIe-based dual-width NVIDIA GPGPUs. This blog describes the single-node performance of selected HPC applications with both one- and two-NVIDIA A100 PCIe GPGPUs.
The NVIDIA Ampere A100 accelerator is one of the most advanced accelerators available in the market, supporting two form factors:
- PCIe version
- Mezzanine SXM4 version
The PowerEdge R7525 server supports only the PCIe version of the NVIDIA A100 accelerator.
The following table compares the NVIDIA A100 GPGPU with the NVIDIA V100S GPGPU:
NVIDIA A100 GPGPU | NVIDIA V100S GPGPU | |||
Form factor | SXM4 | PCIe Gen4 | SXM2 | PCIe Gen3 |
GPU architecture | Ampere | Volta | ||
Memory size | 40 GB | 40 GB | 32 GB | 32 GB |
CUDA cores | 6912 | 5120 | ||
Base clock | 1095 MHz | 765 MHz | 1290 MHz | 1245 MHz |
Boost clock | 1410 MHz | 1530 MHz | 1597 MHz | |
Memory clock | 1215 MHz | 877 MHz | 1107 MHz | |
MIG support | Yes | No | ||
Peak memory bandwidth | Up to 1555 GB/s | Up to 900 GB/s | Up to 1134 GB/s | |
Total board power | 400 W | 250 W | 300 W | 250 W |
The NVIDIA A100 GPGPU brings innovations and features for HPC applications such as the following:
- Multi-Instance GPU (MIG)—The NVIDIA A100 GPGPU can be converted into as many as seven GPU instances, which are fully isolated at the hardware level, each using their own high-bandwidth memory and cores.
- HBM2—The NVIDIA A100 GPGPU comes with 40 GB of high-bandwidth memory (HBM2) and delivers bandwidth up to 1555 GB/s. Memory bandwidth with the NVIDIA A100 GPGPU is 1.7 times higher than with the previous generation of GPUs.
Server configuration
The following table shows the PowerEdge R7525 server configuration that we used for this blog:
Server | PowerEdge R7525 |
Processor | 2nd Gen AMD EPYC 7502, 32C, 2.5Ghz |
Memory | 512 GB (16 x 32 GB @3200MT/s) |
GPGPUs | Either of the following: 2 x NVIDIA A100 PCIe 40 GB 2 x NVIDIA V100S PCIe 32 GB |
Logical processors | Disabled |
Operating system | CentOS Linux release 8.1 (4.18.0-147.el8.x86_64) |
CUDA | 11.0 (Driver version - 450.51.05) |
gcc | 9.2.0 |
MPI | OpenMPI-3.0 |
HPL | hpl_cuda_11.0_ompi-4.0_ampere_volta_8-7-20 |
HPCG | xhpcg-3.1_cuda_11_ompi-3.1 |
GROMACS | v2020.4 |
Benchmark results
The following sections provide our benchmarks results with observations.
High-Performance Linpack benchmark
High Performance Linpack (HPL) is a standard HPC system benchmark. This benchmark measures the compute power of the entire cluster or server. For this study, we used HPL compiled with NVIDIA libraries.
The following figure shows the HPL performance comparison for the PowerEdge R7525 server with either NVIDIA A100 or NVIDIA V100S GPGPUs:
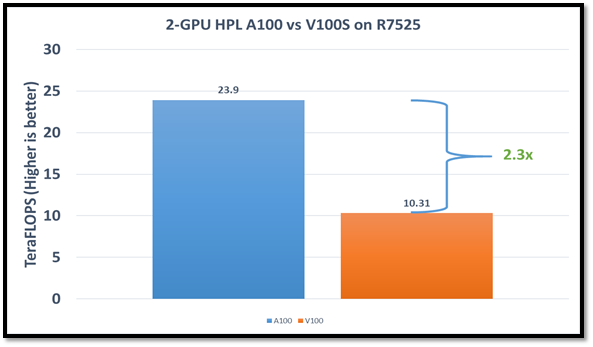
Figure1: HPL performance on the PowerEdge R7525 server with the NVIDIA A100 GPGPU compared to the NVIDIA V100SGPGPU
The problem size (N) is larger for the NVIDIA A100 GPGPU due to the larger capacity of GPU memory. We adjusted the block size (NB) used with the:
- NVIDIA A100 GPGPU to 288
- NVIDIA V100S GPGPU to 384
The AMD EPYC processors provide options for multiple NUMA combinations. We found that the best value of 4 NUMA per socket (NPS=4), with NUMA per socket 1 and 2 lower the performance by 10 percent and 5 percent respectively. In a single PowerEdge R7525 node, the NVIDIA A100 GPGPU delivers 12 TF per card using this configuration without an NVLINK bridge. The PowerEdge R7525 server with two NVIDIA A100 GPGPUs delivers 2.3 times higher HPL performance compared to the NVIDIA V100S GPGPU configuration. This performance improvement is credited to the new double-precision Tensor Cores that accelerate FP64 math.
The following figure shows power consumption of the server while running HPL on the NVIDIA A100 GPGPU in a time series. Power consumption was measured with an iDRAC. The server reached 1038 Watts at peak due to a higher GFLOPS number.
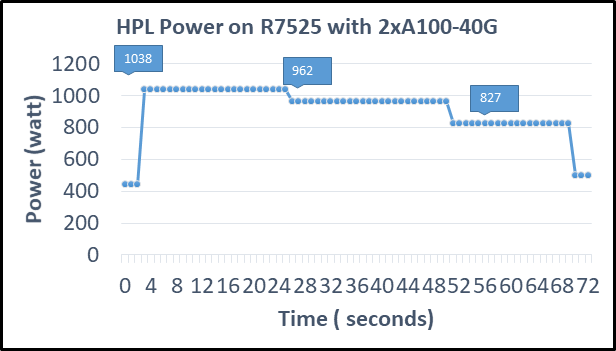
Figure2: Power consumption while running HPL
High Performance Conjugate Gradient benchmark
The High Performance Conjugate Gradient (HPCG) benchmark is based on a conjugate gradient solver, in which the preconditioner is a three-level hierarchical multigrid method using the Gauss-Seidel method.
As shown in the following figure, HPCG performs at a rate 70 percent higher with the NVIDIA A100 GPGPU due to higher memory bandwidth:
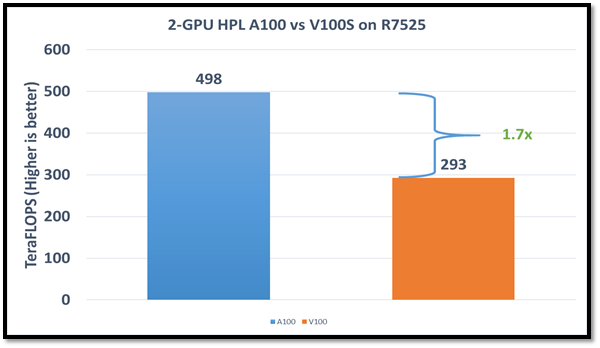
Figure 3: HPCG performance comparison
Due to different memory size, the problem size used to obtain the best performance on the NVIDIA A100 GPGPU was 512 x 512 x 288 and on the NVIDIA V100S GPGPU was 256 x 256 x 256. For this blog, we used NUMA per socket (NPS)=4 and we obtained results without an NVLINK bridge. These results show that applications such as HPCG, which fits into GPU memory, can take full advantage of GPU memory and benefit from the higher memory bandwidth of the NVIDIA A100 GPGPU.
GROMACS
In addition to these two basic HPC benchmarks (HPL and HPCG), we also tested GROMACS, an HPC application. We compiled GROMACS 2020.4 with the CUDA compilers and OPENMPI, as shown in the following table:
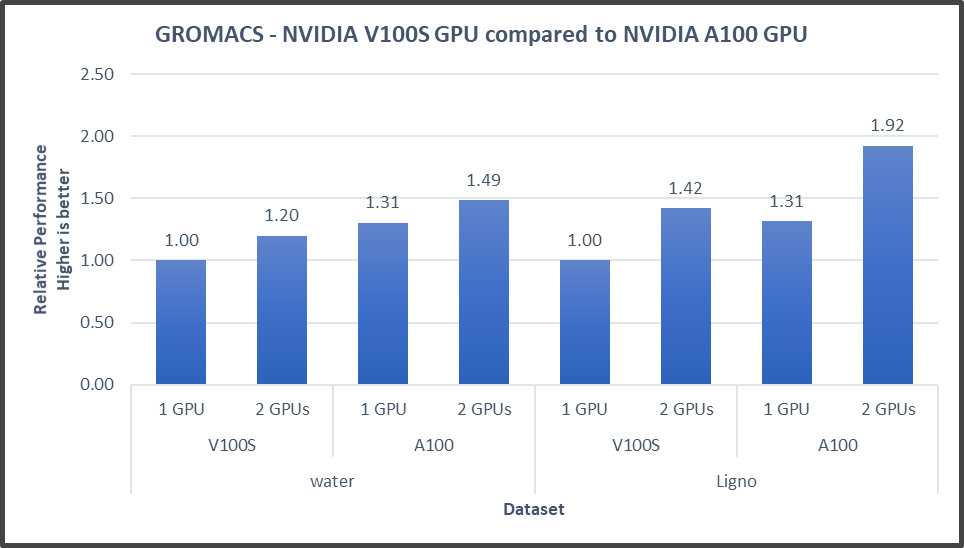
Figure4: GROMACS performance with NVIDIA GPGPUs on the PowerEdge R7525 server
The GROMACS build included thread MPI (built in with the GROMACS package). All performance numbers were captured from the output “ns/day.” We evaluated multiple MPI ranks, separate PME ranks, and different nstlist values to achieve the best performance. In addition, we used settings with the best environment variables for GROMACS at runtime. Choosing the right combination of variables avoided expensive data transfer and led to significantly better performance for these datasets.
GROMACS performance was based on a comparative analysis between NVIDIA V100S and NVIDIA A100 GPGPUs. Excerpts from our single-node multi-GPU analysis for two datasets showed a performance improvement of approximately 30 percent with the NVIDIA A100 GPGPU. This result is due to improved memory bandwidth of the NVIDIA A100 GPGPU. (For information about how the GROMACS code design enables lower memory transfer overhead, see Developer Blog: Creating Faster Molecular Dynamics Simulations with GROMACS 2020.)
Conclusion
The Dell PowerEdge R7525 server equipped with NVIDIA A100 GPGPUs shows exceptional performance improvements over servers equipped with previous versions of NVIDIA GPGPUs for applications such as HPL, HPCG, and GROMACS. These performance improvements for memory-bound applications such as HPCG and GROMACS can take advantage of higher memory bandwidth available with NVIDIA A100 GPGPUs.