


AMD Milan - BIOS Characterization for HPC
With the release of the AMD EPYC 7003 Series Processors (architecture codenamed "Milan"), Dell EMC PowerEdge servers have now been upgraded to support the new features. This blog outlines the Milan Processor architecture and the recommended BIOS settings to deliver optimal HPC Synthetic benchmark performance. Upcoming blogs will focus on the application performance and characterization of the software applications from various scientific domains such as Weather Science, Molecular Dynamics, and Computational Fluid Dynamics.
AMD Milan with Zen3 cores is the successor of AMD's high-performance second generation server microprocessor (architecture codenamed "Rome"). It supports up to 64 cores at 280w TDP and 8 DDR4 memory channels at speeds up to 3200MT/s.
Architecture
As with AMD Rome, AMD Milan’s 64 core Processor model has 1 I/O die and 8 compute dies (also called CCD or Core Complex Die) – OPN 32 core models may have 4 or 8 compute dies. Milan Processors have upgrades to the Cache (including new prefetchers at both L1 and L2 caches) and Memory Bandwidth which is expected to improve performance of applications requiring higher memory bandwidth.
Unlike Naples and Rome, Milan's arrangement of its CCDs has changed. Each CCD now features up to 8 cores with a unified 32MB L3 cache which could reduce the cache access latency within compute chiplets. Milan Processors can expose each CCD as a NUMA node node by setting the “L3 cache as NUMA Domain” ( from the iDRAC GUI ) or BIOS.ProcSettings.CcxAsNumaDomain (using racadm CLI) option to “Enabled”. Therefore, Milan’s 64 core dual-socket Processors with 8 CCDs per Processor will expose 16 NUMA domains per system in this setting. Here is the logical representation of Core arrangement with NUMA Nodes per socket = 4 and CCD as NUMA = Disabled.
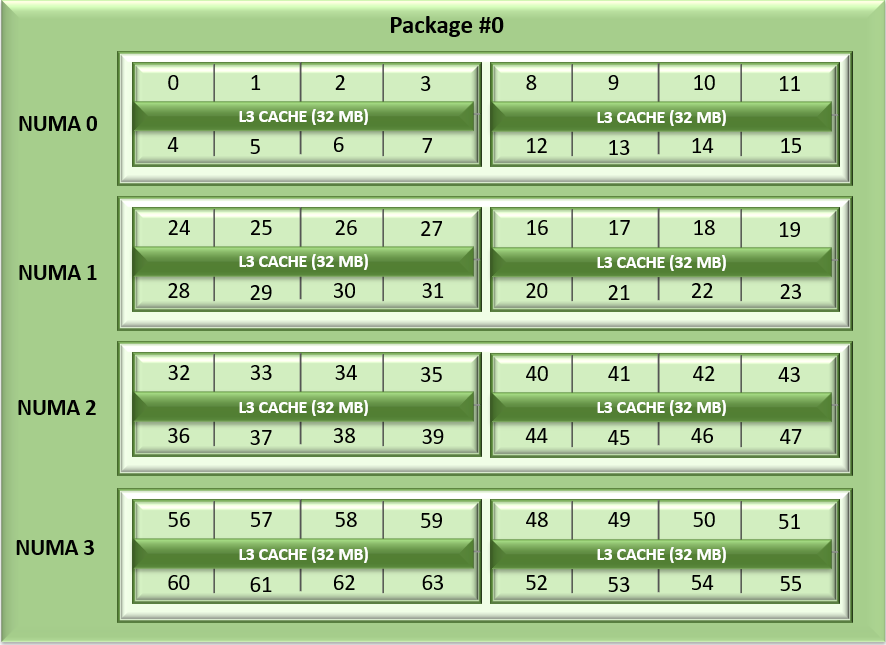
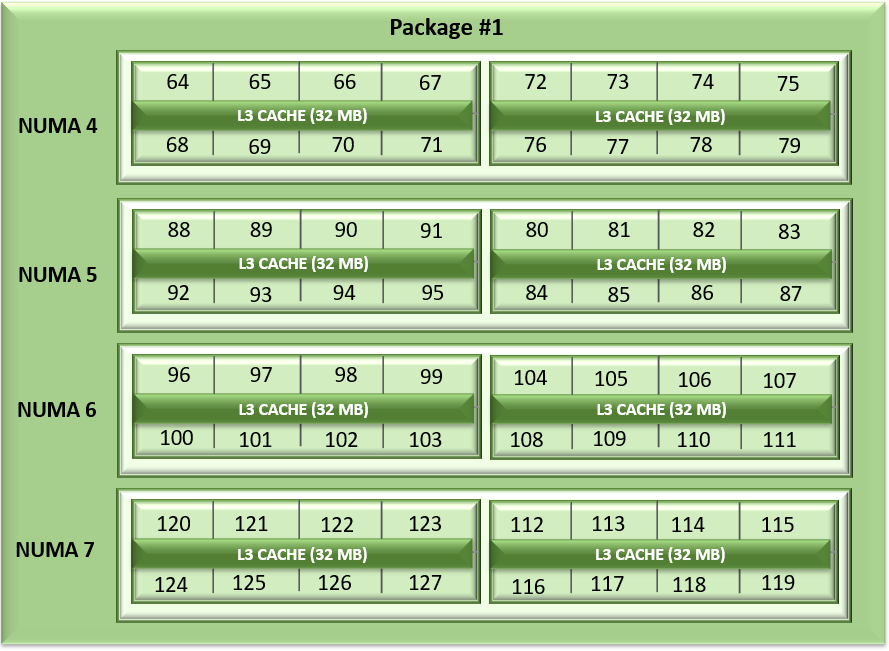
Figure1: Linear core enumeration on a dual-socket system, 64c per socket, NPS4 configuration on an 8 CCD Processor model
As with AMD Rome, AMD Milan Processors support the AVX256 instruction set allowing 16 DP FLOP/cycle.
BIOS Options Available on AMD Milan and Tuning
Processors from both Milan and Rome generations are socket compatible, so the BIOS Options are similar across these Processor generations. Server details are mentioned in Table 1 below.
Table 1: Testbed hardware and software details
Server | Dell EMC PowerEdge 2 socket servers (with AMD Milan Processors) | Dell EMC PowerEdge 2 socket servers (with AMD Rome Processors) |
OPN Cores/Socket Frequency (Base-Boost) TDP | 7763 (Milan) 64 2.45GHz – 3.5GHz 280W 256 MB | 7H12 (Rome) 64 2.6GHz – 3.3 GHz 280W 256 MB |
OPN Cores/Socket Frequency TDP | 7713 (Milan) 64 2.0GHz – 3.7GHz 225W 256 MB | 7702 (Rome) 64 2.0 GHz – 3.35 GHz 200W 256 MB |
OPN Cores/Socket Frequency TDP | 7543 (Milan) 32 2.8GHz – 3.7 GHz 225W 256 MB | 7542 (Rome) 32 2.9GHz – 3.4 GHz 225W 128 MB |
Operating System | RHEL 8.3 (4.18.0-240.el8.x86_64) | RHEL 8.2 (4.18.0-193.el8.x86_64) |
Memory | DDR4 256G (16Gb x 16) 3200 MT/s | |
BIOS / CPLD | 2.0.3 / 1.1.12 | 1.1.7 |
Interconnect | Mellanox HDR 200 (4X HDR) | Mellanox HDR 100 |
The following BIOS options were explored –
- BIOS.SysProfileSettings.SysProfile: This field sets the System Profile to Performance Per Watt (OS), Performance, or Custom mode. When set to a mode other than Custom, BIOS will set each option accordingly. When set to Custom, you can change setting of each option. Under Custom mode when C state is enabled, Monitor/Mwait should also be enabled.
- BIOS.ProcSettings.L1StridePrefetcher: When set to Enabled, the Processor provides additional fetch to the data access for an individual instruction for performance tuning by controlling the L1 stride prefetcher setting.
- BIOS.ProcSettings.L2StreamHwPrefetcher: When set to Enabled, the Processor provides advanced performance tuning by controlling the L2 stream HW prefetcher setting.
- BIOS.ProcSettings.L2UpDownPrefetcher: When set to Enabled, the Processor uses memory access to determine whether to fetch next or previous for all memory accesses for advanced performance tuning by controlling the L2 up/down prefetcher setting.
- BIOS.ProcSettings.CcxAsNumaDomain: This field specifies that each CCD within the Processor will be declared as a NUMA Domain.
- BIOS.MemSettings.MemoryInterleaving: When set to Auto, memory interleaving is supported if a symmetric memory configuration is installed. When set to Disabled, the system supports Non-Uniform Memory Access (NUMA) (asymmetric) memory configurations. Operating Systems that are NUMA-aware understand the distribution of memory in a particular system and can intelligently allocate memory in an optimal manner. Operating Systems that are not NUMA-aware could allocate memory to a Processor that is not local, resulting in a loss of performance. Die and Socket Interleaving should only be enabled for Operating Systems that are not NUMA-aware.
After setting System Profile (BIOS.SysProfileSettings.SysProfile) to PerformanceOptimized, NUMA Nodes Per Socket (NPS) to 4, and Prefetchers (L1Region,L1Stream,L1Stride,L2Stream, L2UpDown) to “Enabled” we measured the impact of CcxAsNumaDomain and MemoryInterleaving BIOS parameters on application performance. We tested the performance of the applications listed in Table 1 with following settings.
Table 2: Combinations of CCX as NUMA domain and Memory Interleaving
CCX as NUMA Domain | Memory Interleaving | |
Setting01 | Disabled | Disabled |
Setting02 | Disabled | Auto |
Setting03 | Enabled | Auto |
Setting04 | Enabled | Disabled |
With Setting01 and Setting02 (CCX as NUMA Domain = Disabled), the system will expose 8 NUMA nodes. With Setting03 and Setting04, there will be 16 NUMA nodes on a dual socket server with 64 core based Milan Processors.
Table 3: hwloc-ls and numactl -H command output on 64c server with setting01/setting02 and (listed in Table 2)
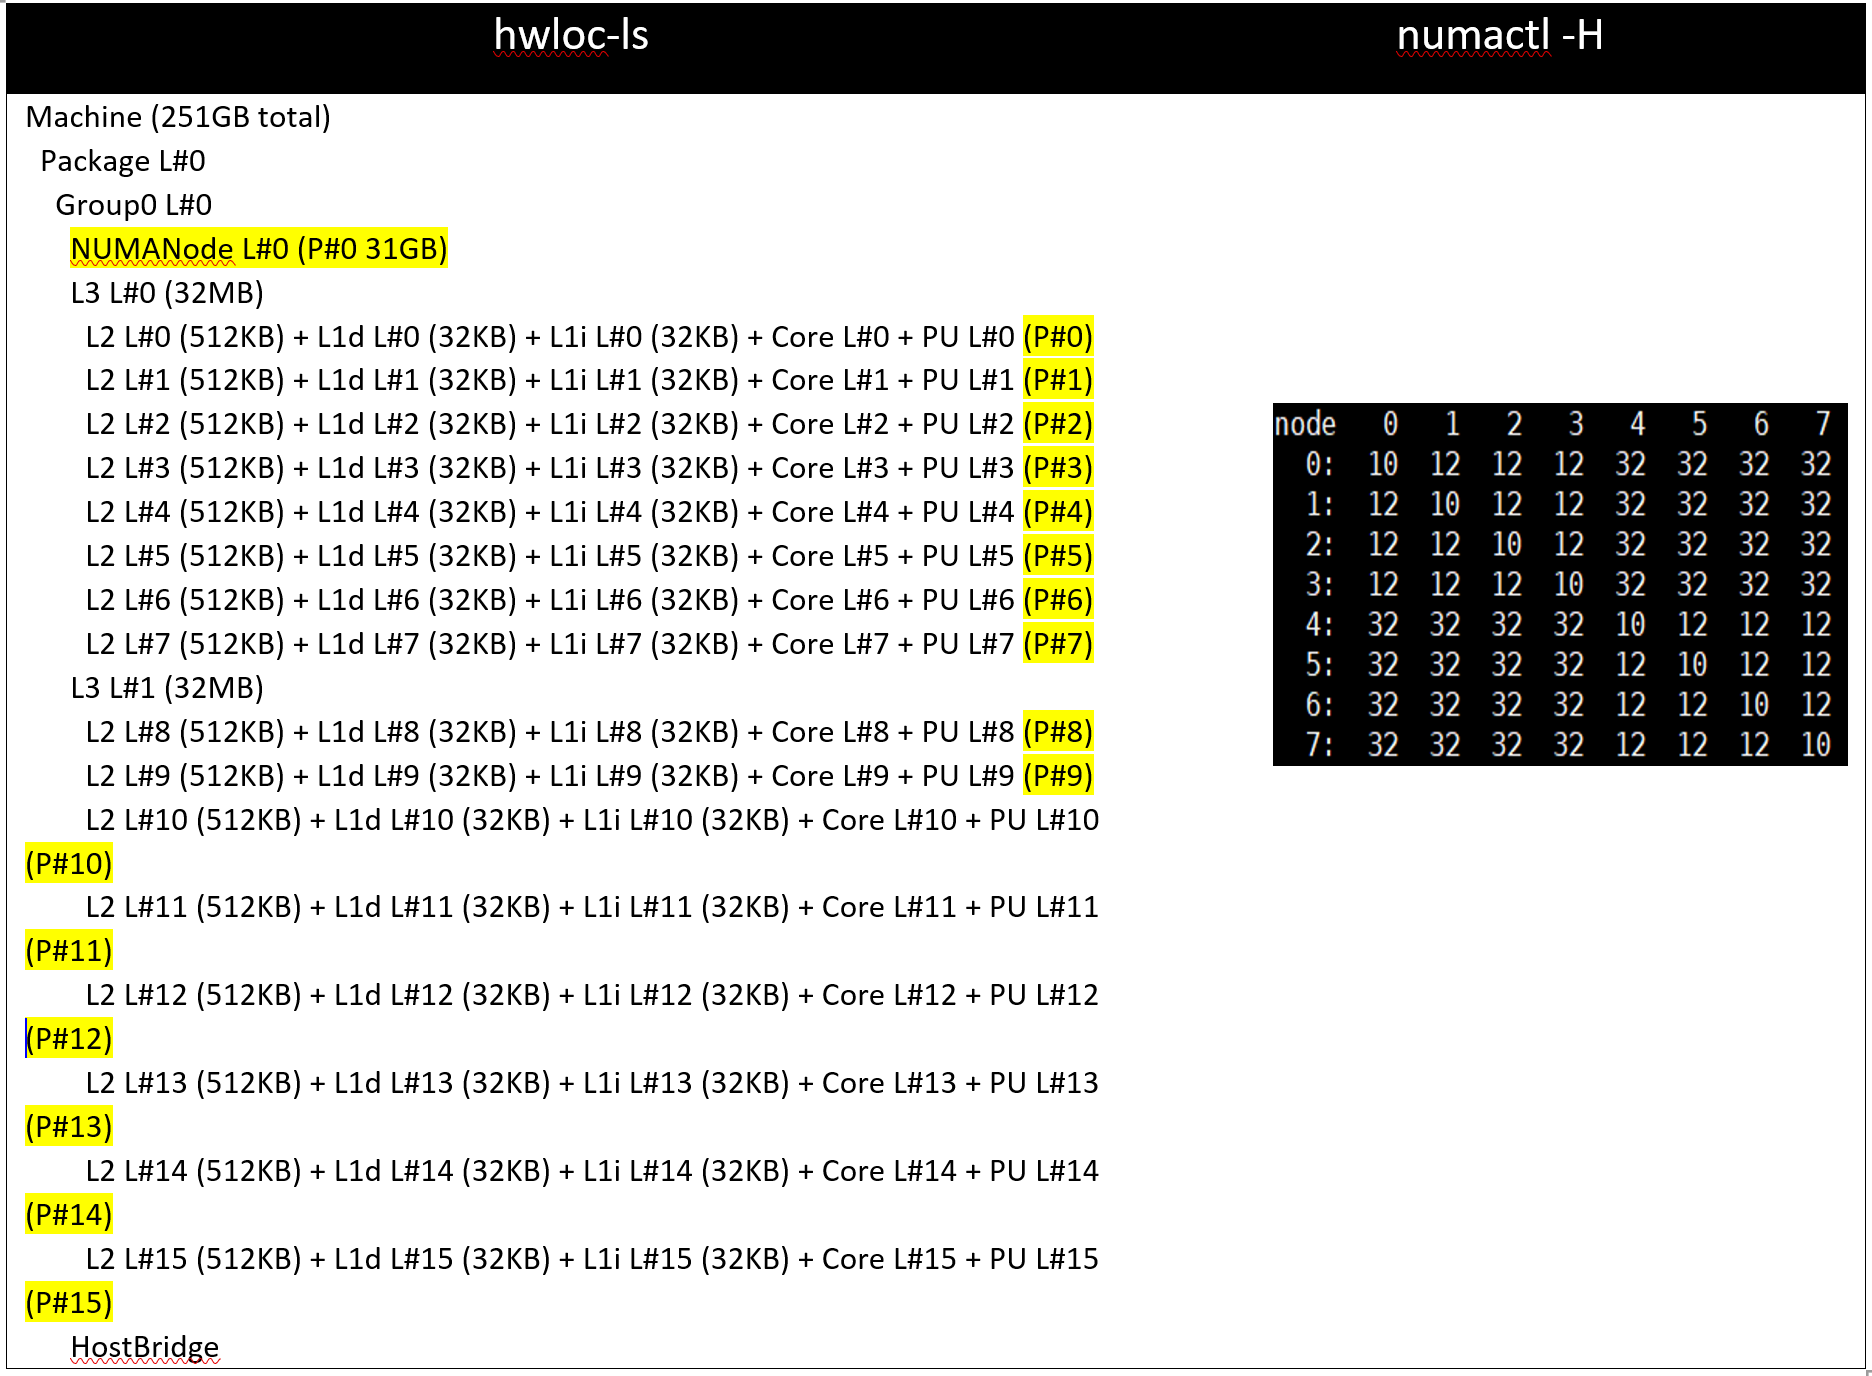
Table 4: hwloc-ls and numactl -H command output on 128 core (2x 64c) server with setting03/setting04 and (listed in Table 2)
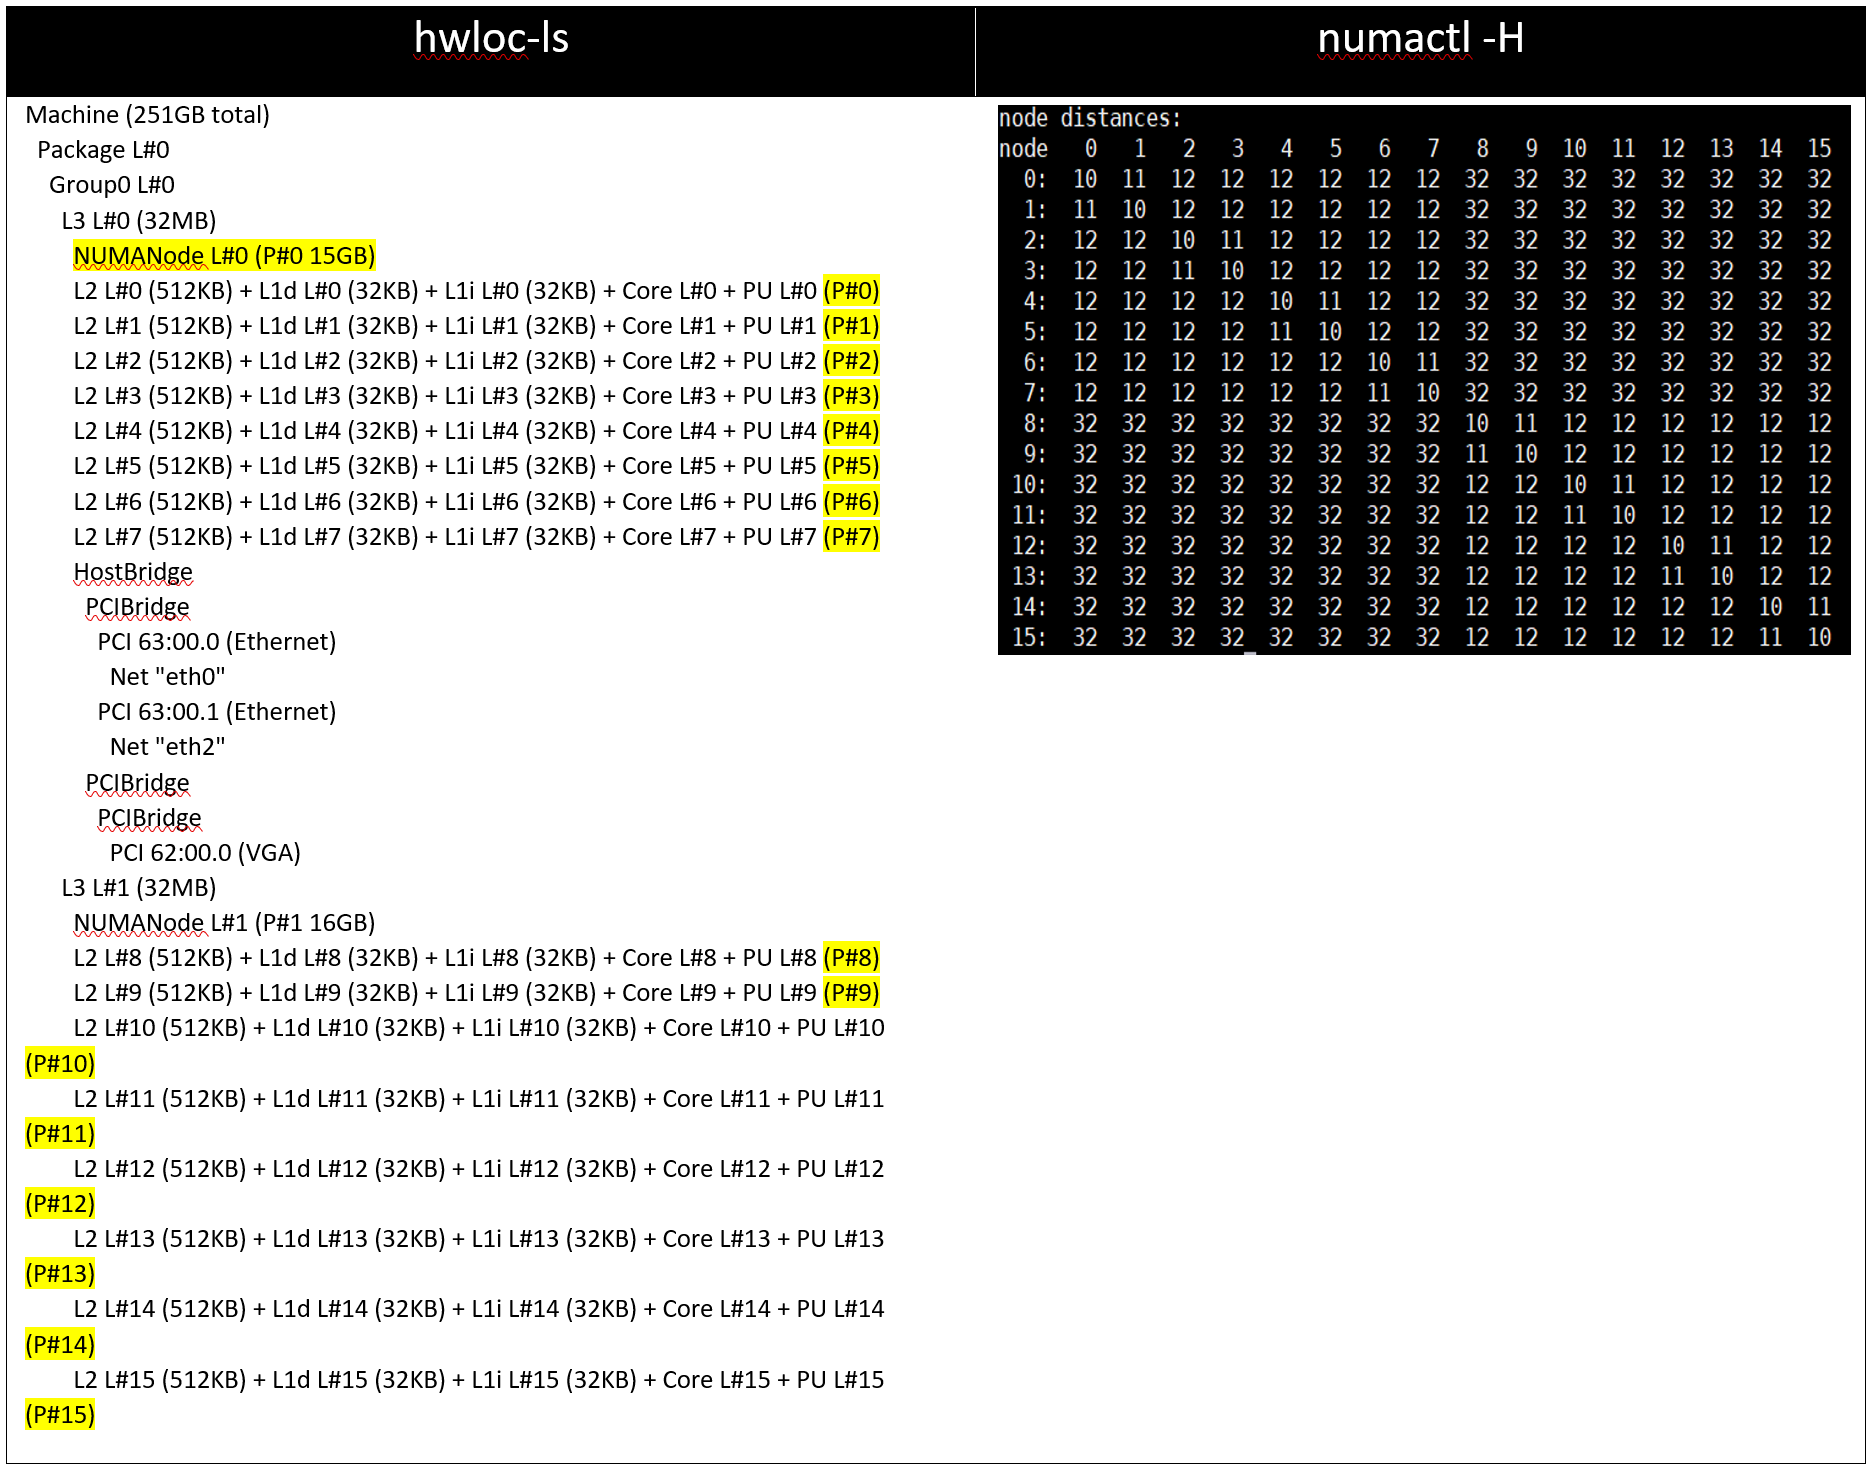
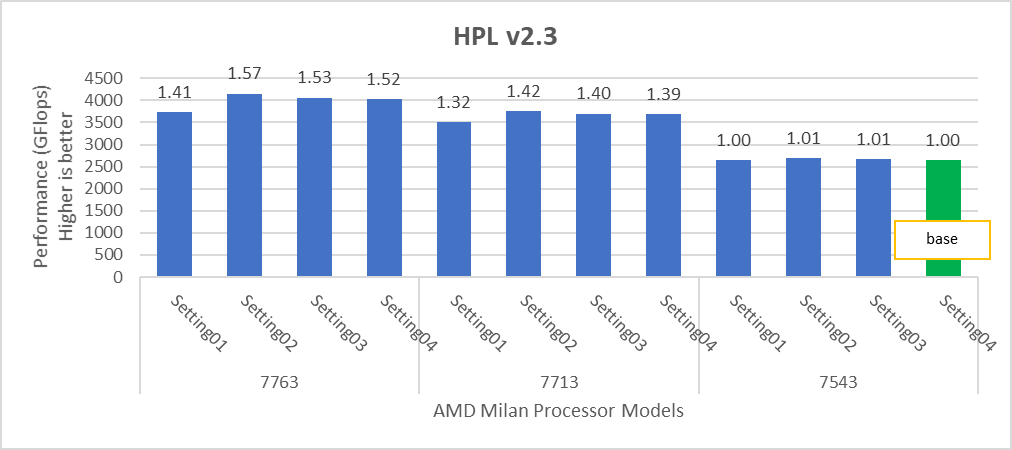
Figure 2: Relative difference in the performance of HPL by processor and BIOS settings mentioned in Table 1 and Table 2.
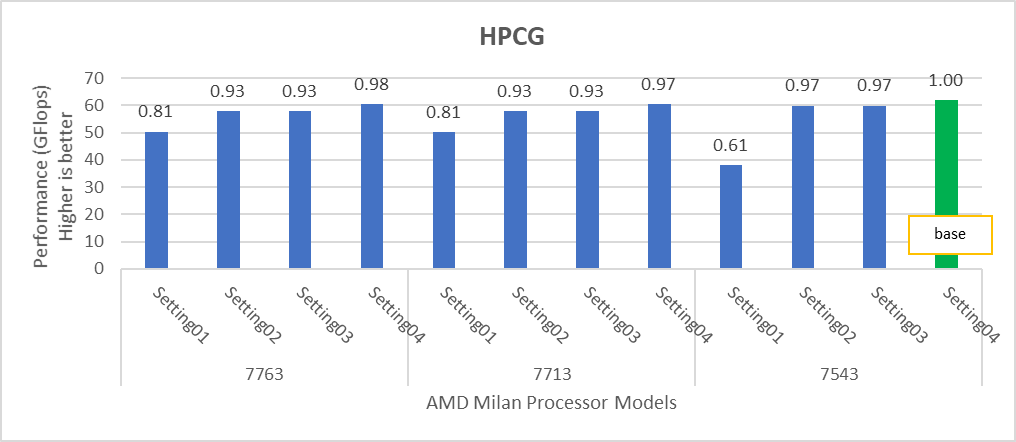
Figure 3: Relative difference in the performance of HPCG by processor and BIOS settings mentioned in Table 1 and Table 2.
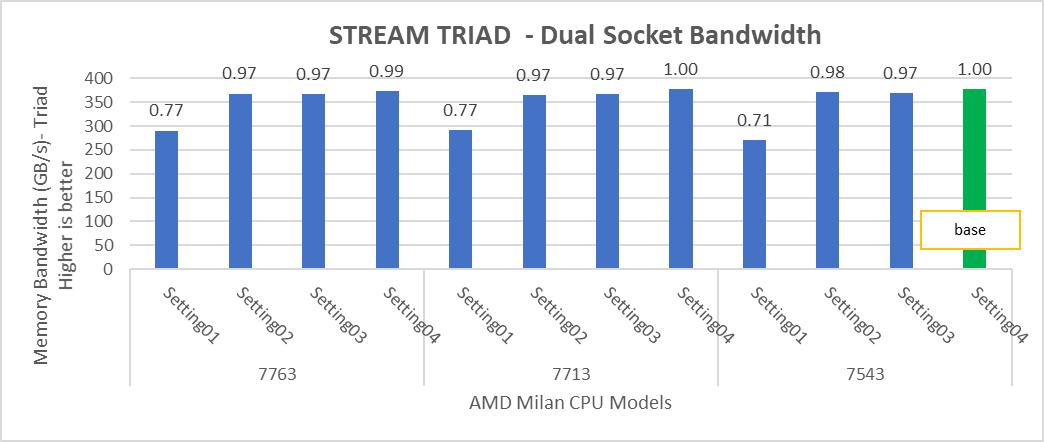
Figure 4: Relative difference in the performance of STREAM by processor and BIOS settings mentioned in Table 1 and Table 2.
HPL delivers the best performance numbers on setting02 with 82-93% efficiency depending on Processor Model, whereas STREAM and HPCG deliver better performance with setting04.
STREAM TRIAD tests generate best performance numbers at ~378 GB/s memory bandwidth across all of the 64 and 32 core Processor Models mentioned in Table 1 with efficiency up to 90%.
In Figure 4, the STREAM TRIAD performance numbers were measured by undersubscribing the server by utilizing only 16 cores on the servers. The comparison of the performance numbers by utilizing all the available cores and 16 cores per system has been shown in Figure 5. The numbers on top of the orange bars shows the relative difference.
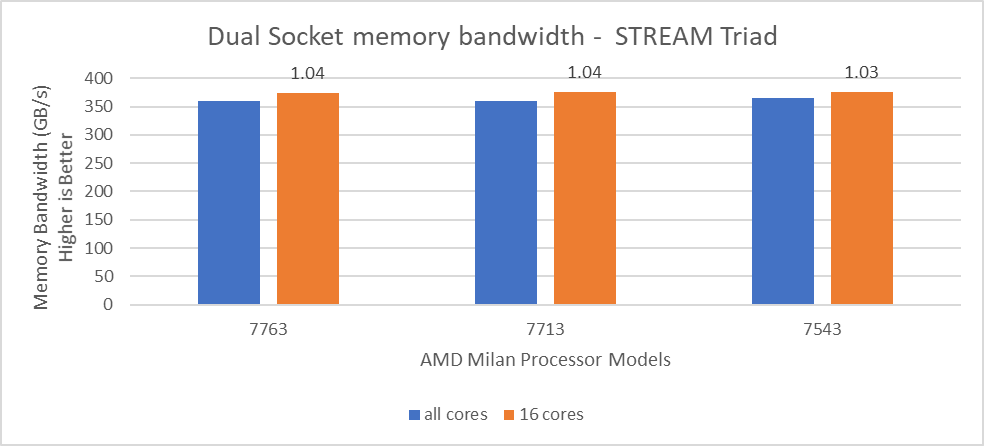
Figure 5: Relative difference in the memory bandwidth.
From Figure 5, we observed that by using 16 cores, the STREAM TRIAD test’s performance numbers were ~3-4% higher than the performance numbers measured by subscribing all available cores.
We carried out NUMA bandwidth tests using setting02 and setting04 mentioned in Table01. With setting02, system exposes a total of 8 NUMA nodes while with setting04, system exposes a total of 16 NUMA nodes with 8 cores per NUMA node In Figure 6 and 7, NUMA node presented as “c” and memory node as “m”. As an example, c0m0 represents NUMA node 0 and memory node 0. The best bandwidth numbers obtained on varying the number of threads
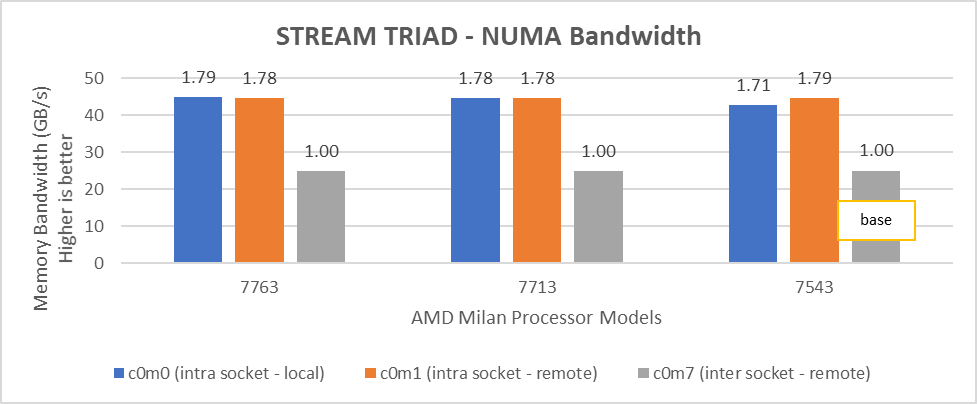
Figure 6: Local and remote NUMA memory bandwidth with CCXasNUMADomain=Disabled
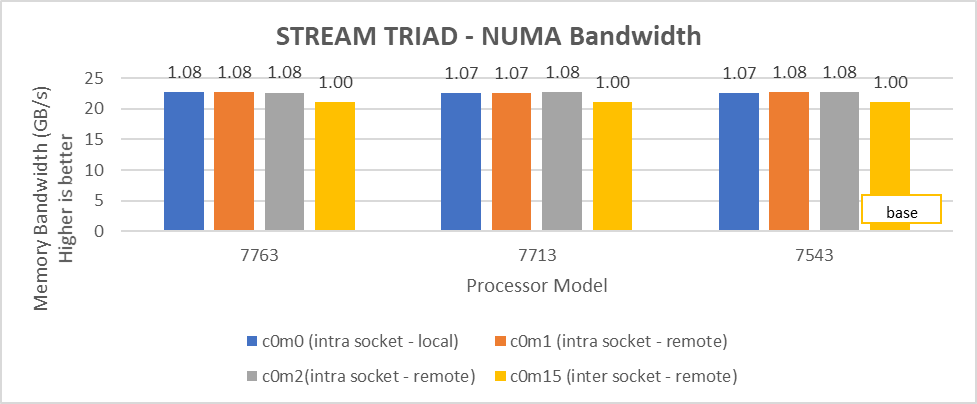
Figure 7: Local and remote NUMA memory bandwidth with CCXasNUMADomain=ENabled
We observed that the optimal intra socket local memory bandwidth numbers were obtained with 2 threads per NUMA node with setting2 on both 64 core and 32 core processor models. In Figure 6 with setting02 (Table 2) the intra socket local memory bandwidth, at 2 threads per NUMA node, can be up to 79% more than inter remote memory bandwidth. With setting02 (Figure 6) we get at least 96% higher intra socket local memory bandwidth per NUMA domain than setting04 (Figure 7).
Impact of new Prefetch options
Milan introduces two new prefetchers for L1 cache and one for L2 Cache with a total of five prefetcher options which can be configured using BIOS. We tested combinations listed in Table 5 by keeping L1 Stream and L2 Stream prefetcher as Enabled.
Table 5: Cache Prefetchers
L1StridePrefetcher | L1RegionPrefetcher | L2UpDownPrefetcher | |
setting01 | Disabled | Enabled | Enabled |
setting02 | Enabled | Disabled | Enabled |
setting03 | Enabled | Enabled | Disabled |
setting04 | Disabled | Disabled | Disabled |
We found that these new prefetchers do not have significant impact on the performance of the synthetic benchmarks covered in this blog.
InfiniBand bandwidth, message rate and scalability
For Multinode tests, the testbed was configured with Mellanox HDR interconnect running at 200 Gbps with each server having the AMD 7713 Processor Model and Preferred IO setting set to Enabled from BIOS.Along with the setting02 (Table 2) and Prefetchers (L1Region,L1Stream,L1Stride,L2Stream, L2UpDown) set to “Enabled” we were able to achieve the expected linear performance scalability for HPL and HPCG Benchmarks.
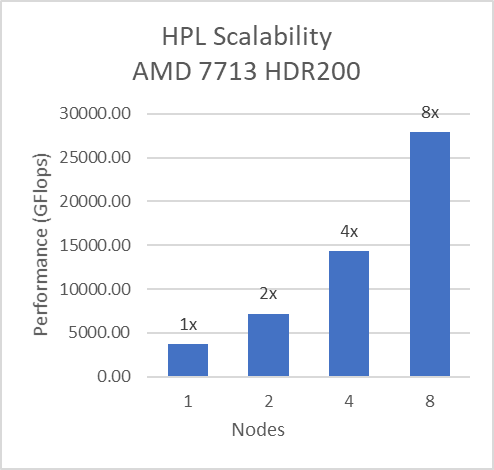
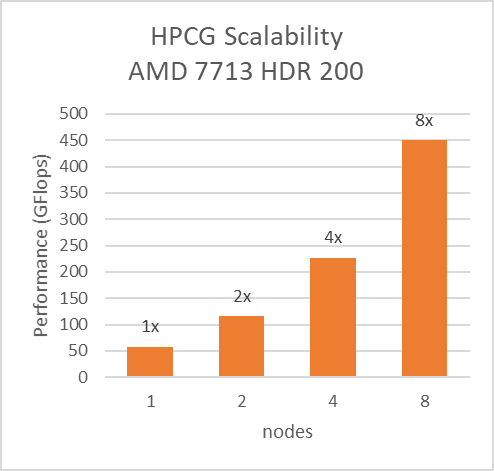
Figure 8: Multinode scalability of HPL and HPCG with setting02 (Table 2) with 7713 Processor model, HDR200 Infiniband
We tested the Message Rate, Unidirectional, and Bidirectional InfiniBand bandwidth using OSU Benchmarks and results are in Figure 9, Figure 10 and Figure 11. Except the Numa Nodes per socket setting, all other BIOS settings for these tests were same as mentioned above. The OSU Bidirectional bandwidth and OSU Unidirectional tests were carried out with Numa Nodes per socket set to 2 and the and Message rate test was carried out with Numa Nodes per socket set to 4. In Figure 9 and Figure10, the numbers on top of the orange bars represent the percentage difference between Local and Remote bandwidth performance numbers.
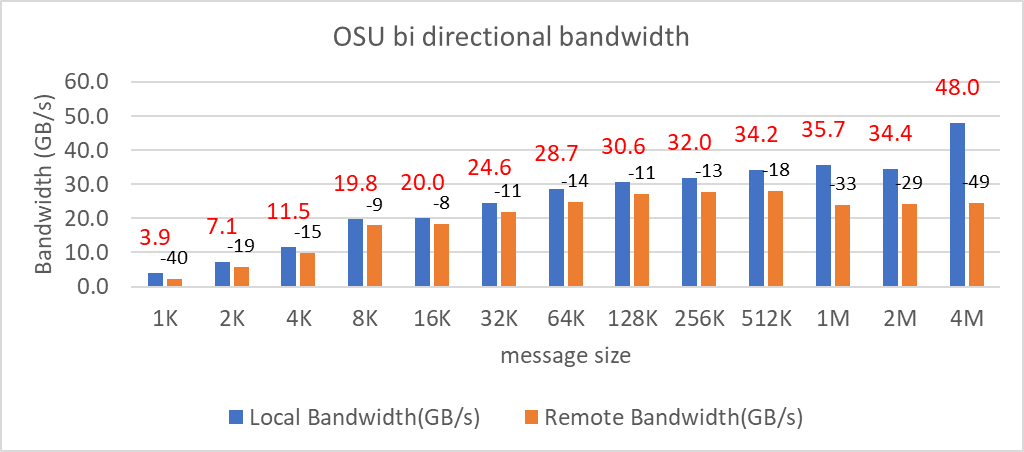
Figure 9: OSU bi-directional bandwidth test on AMD 7713, HDR 200 InfiniBand
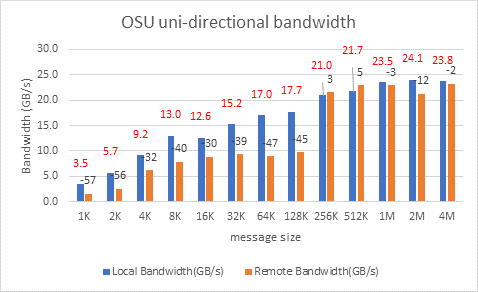 Figure 10: OSU uni-directional bandwidth test on AMD 7713, HDR 200 Infiniband
For Local Latency and Bandwidth performance numbers, the MPI process was pinned to the NUMA node 1 (closest to the HCA). For Remote Latency and Bandwidth tests, processes were pinned to NUMA node 6.
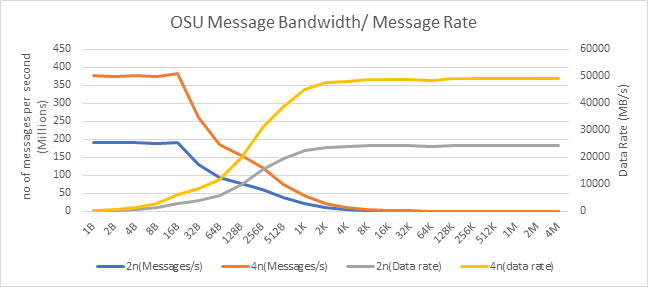
Figure 11: OSU Message rate and bandwidth performance on 2 and 4 nodes of 7713 Processor model
On 2 nodes using HDR200, we are able to achieve ~24 GB/s unidirectional bandwidth and message rate of 192 Million messages/second – almost double the performance numbers obtained on HDR100.
Comparison with Rome SKUs
In order to draw out performance improvement comparisons, we have selected Rome SKUs closest to their Milan counterparts in terms of hardware features such as Cache Size, TDP values, and Processor Base/Turbo Frequency.
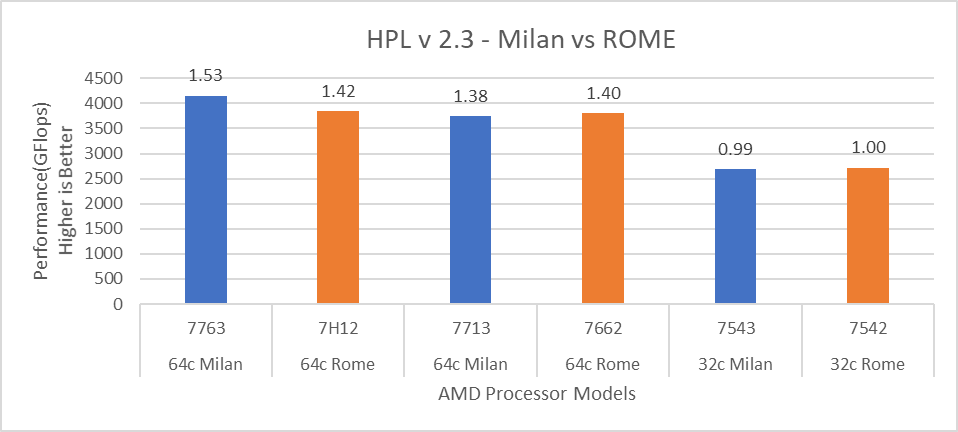
Figure 12: HPL performance comparison with Rome Processor Models
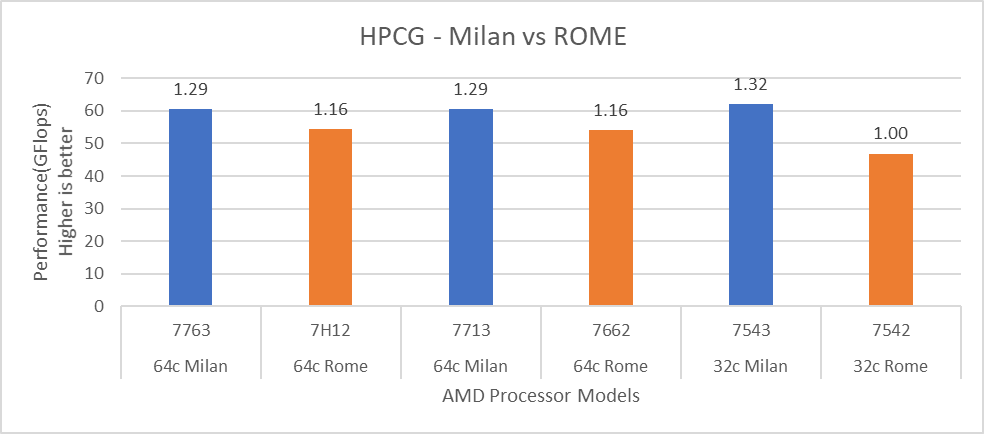
Figure 13: HPCG performance comparison with Rome Processor Models
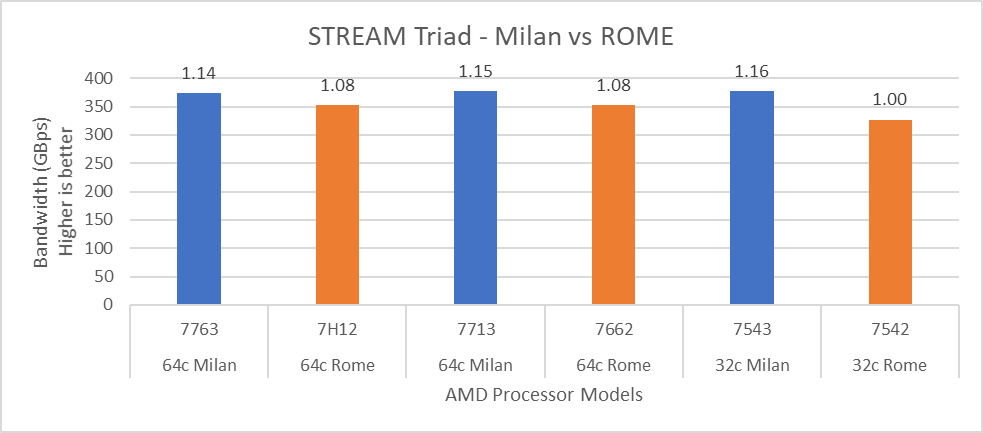
Figure 14: STREAM performance comparison with Rome Processor Models
For HPL (Figure 12) we observed that, on higher end Processor Models, Milan delivers 10% better performance than Rome. As expected, on the Milan platform, memory bandwidth bound applications like STREAM and HPCG (Figure 13 and Figure 14) gain 6-16 % and 13-32% in the performance over Rome Processor Models covered in this blog.
Summary and Future Work
Milan-based servers show expected performance upgrades, especially for the memory bandwidth bound synthetic HPC benchmarks covered in this blog. Configuring the BIOS options is important in order to get the best performance out of the system. The Hyper-Threading should be Disabled for general-purpose HPC systems, and benefits of this feature should be tested and enabled as appropriate for the synthetic benchmarks not covered in this blog.
Check back soon for subsequent blogs that describe application performance studies on our Milan Processor based cluster.
Related Blog Posts

HPC Application Performance on Dell PowerEdge R7525 Servers with NVIDIA A100 GPGPUs
Tue, 24 Nov 2020 17:49:03 -0000
|Read Time: 0 minutes
Overview
The Dell PowerEdge R7525 server powered with 2nd Gen AMD EPYC processors was released as part of the Dell server portfolio. It is a 2U form factor rack-mountable server that is designed for HPC workloads. Dell Technologies recently added support for NVIDIA A100 GPGPUs to the PowerEdge R7525 server, which supports up to three PCIe-based dual-width NVIDIA GPGPUs. This blog describes the single-node performance of selected HPC applications with both one- and two-NVIDIA A100 PCIe GPGPUs.
The NVIDIA Ampere A100 accelerator is one of the most advanced accelerators available in the market, supporting two form factors:
- PCIe version
- Mezzanine SXM4 version
The PowerEdge R7525 server supports only the PCIe version of the NVIDIA A100 accelerator.
The following table compares the NVIDIA A100 GPGPU with the NVIDIA V100S GPGPU:
NVIDIA A100 GPGPU | NVIDIA V100S GPGPU | |||
Form factor | SXM4 | PCIe Gen4 | SXM2 | PCIe Gen3 |
GPU architecture | Ampere | Volta | ||
Memory size | 40 GB | 40 GB | 32 GB | 32 GB |
CUDA cores | 6912 | 5120 | ||
Base clock | 1095 MHz | 765 MHz | 1290 MHz | 1245 MHz |
Boost clock | 1410 MHz | 1530 MHz | 1597 MHz | |
Memory clock | 1215 MHz | 877 MHz | 1107 MHz | |
MIG support | Yes | No | ||
Peak memory bandwidth | Up to 1555 GB/s | Up to 900 GB/s | Up to 1134 GB/s | |
Total board power | 400 W | 250 W | 300 W | 250 W |
The NVIDIA A100 GPGPU brings innovations and features for HPC applications such as the following:
- Multi-Instance GPU (MIG)—The NVIDIA A100 GPGPU can be converted into as many as seven GPU instances, which are fully isolated at the hardware level, each using their own high-bandwidth memory and cores.
- HBM2—The NVIDIA A100 GPGPU comes with 40 GB of high-bandwidth memory (HBM2) and delivers bandwidth up to 1555 GB/s. Memory bandwidth with the NVIDIA A100 GPGPU is 1.7 times higher than with the previous generation of GPUs.
Server configuration
The following table shows the PowerEdge R7525 server configuration that we used for this blog:
Server | PowerEdge R7525 |
Processor | 2nd Gen AMD EPYC 7502, 32C, 2.5Ghz |
Memory | 512 GB (16 x 32 GB @3200MT/s) |
GPGPUs | Either of the following: 2 x NVIDIA A100 PCIe 40 GB 2 x NVIDIA V100S PCIe 32 GB |
Logical processors | Disabled |
Operating system | CentOS Linux release 8.1 (4.18.0-147.el8.x86_64) |
CUDA | 11.0 (Driver version - 450.51.05) |
gcc | 9.2.0 |
MPI | OpenMPI-3.0 |
HPL | hpl_cuda_11.0_ompi-4.0_ampere_volta_8-7-20 |
HPCG | xhpcg-3.1_cuda_11_ompi-3.1 |
GROMACS | v2020.4 |
Benchmark results
The following sections provide our benchmarks results with observations.
High-Performance Linpack benchmark
High Performance Linpack (HPL) is a standard HPC system benchmark. This benchmark measures the compute power of the entire cluster or server. For this study, we used HPL compiled with NVIDIA libraries.
The following figure shows the HPL performance comparison for the PowerEdge R7525 server with either NVIDIA A100 or NVIDIA V100S GPGPUs:
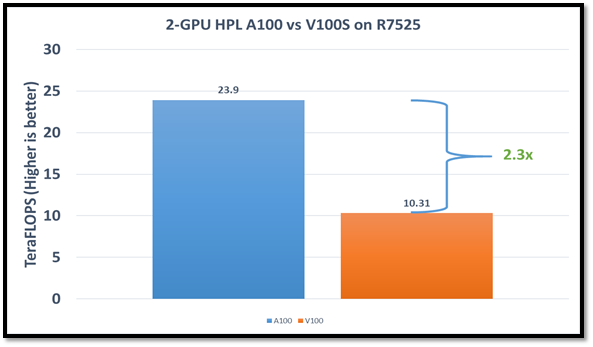
Figure1: HPL performance on the PowerEdge R7525 server with the NVIDIA A100 GPGPU compared to the NVIDIA V100SGPGPU
The problem size (N) is larger for the NVIDIA A100 GPGPU due to the larger capacity of GPU memory. We adjusted the block size (NB) used with the:
- NVIDIA A100 GPGPU to 288
- NVIDIA V100S GPGPU to 384
The AMD EPYC processors provide options for multiple NUMA combinations. We found that the best value of 4 NUMA per socket (NPS=4), with NUMA per socket 1 and 2 lower the performance by 10 percent and 5 percent respectively. In a single PowerEdge R7525 node, the NVIDIA A100 GPGPU delivers 12 TF per card using this configuration without an NVLINK bridge. The PowerEdge R7525 server with two NVIDIA A100 GPGPUs delivers 2.3 times higher HPL performance compared to the NVIDIA V100S GPGPU configuration. This performance improvement is credited to the new double-precision Tensor Cores that accelerate FP64 math.
The following figure shows power consumption of the server while running HPL on the NVIDIA A100 GPGPU in a time series. Power consumption was measured with an iDRAC. The server reached 1038 Watts at peak due to a higher GFLOPS number.
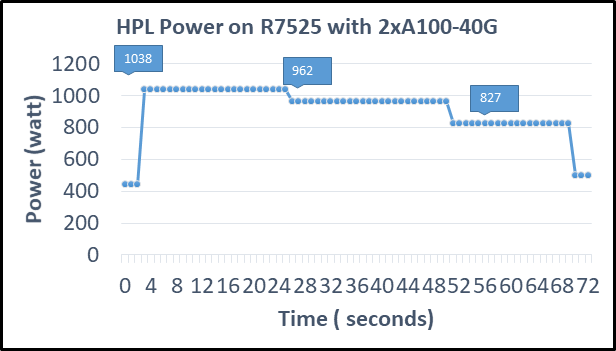
Figure2: Power consumption while running HPL
High Performance Conjugate Gradient benchmark
The High Performance Conjugate Gradient (HPCG) benchmark is based on a conjugate gradient solver, in which the preconditioner is a three-level hierarchical multigrid method using the Gauss-Seidel method.
As shown in the following figure, HPCG performs at a rate 70 percent higher with the NVIDIA A100 GPGPU due to higher memory bandwidth:
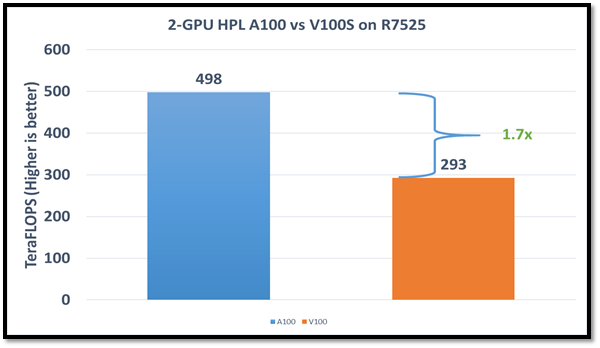
Figure 3: HPCG performance comparison
Due to different memory size, the problem size used to obtain the best performance on the NVIDIA A100 GPGPU was 512 x 512 x 288 and on the NVIDIA V100S GPGPU was 256 x 256 x 256. For this blog, we used NUMA per socket (NPS)=4 and we obtained results without an NVLINK bridge. These results show that applications such as HPCG, which fits into GPU memory, can take full advantage of GPU memory and benefit from the higher memory bandwidth of the NVIDIA A100 GPGPU.
GROMACS
In addition to these two basic HPC benchmarks (HPL and HPCG), we also tested GROMACS, an HPC application. We compiled GROMACS 2020.4 with the CUDA compilers and OPENMPI, as shown in the following table:
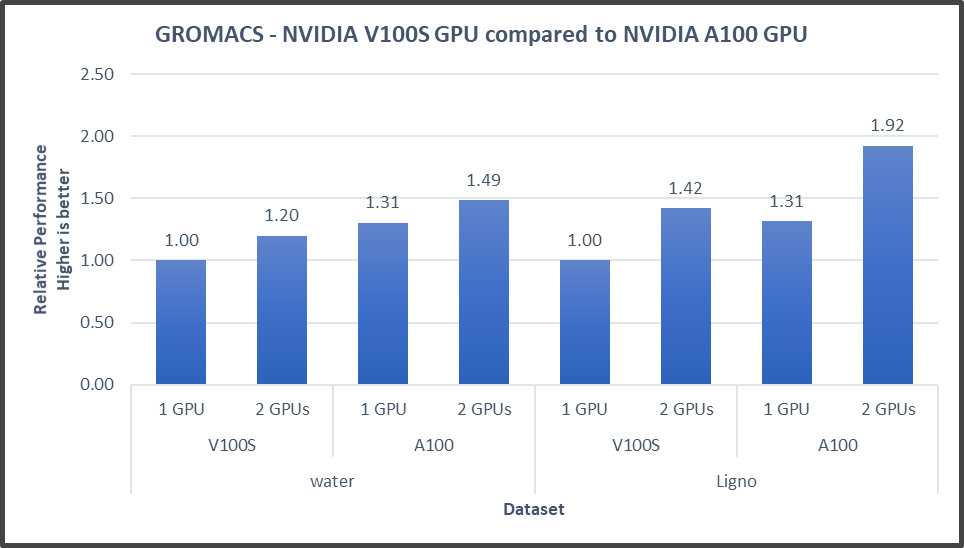
Figure4: GROMACS performance with NVIDIA GPGPUs on the PowerEdge R7525 server
The GROMACS build included thread MPI (built in with the GROMACS package). All performance numbers were captured from the output “ns/day.” We evaluated multiple MPI ranks, separate PME ranks, and different nstlist values to achieve the best performance. In addition, we used settings with the best environment variables for GROMACS at runtime. Choosing the right combination of variables avoided expensive data transfer and led to significantly better performance for these datasets.
GROMACS performance was based on a comparative analysis between NVIDIA V100S and NVIDIA A100 GPGPUs. Excerpts from our single-node multi-GPU analysis for two datasets showed a performance improvement of approximately 30 percent with the NVIDIA A100 GPGPU. This result is due to improved memory bandwidth of the NVIDIA A100 GPGPU. (For information about how the GROMACS code design enables lower memory transfer overhead, see Developer Blog: Creating Faster Molecular Dynamics Simulations with GROMACS 2020.)
Conclusion
The Dell PowerEdge R7525 server equipped with NVIDIA A100 GPGPUs shows exceptional performance improvements over servers equipped with previous versions of NVIDIA GPGPUs for applications such as HPL, HPCG, and GROMACS. These performance improvements for memory-bound applications such as HPCG and GROMACS can take advantage of higher memory bandwidth available with NVIDIA A100 GPGPUs.

HPC Application Performance on Dell PowerEdge R7525 Servers with the AMD Instinct™ MI210 GPU
Mon, 12 Sep 2022 12:11:52 -0000
|Read Time: 0 minutes
PowerEdge support and performance
The PowerEdge R7525 server can support three AMD Instinct™ MI210 GPUs; it is ideal for HPC Workloads. Furthermore, using the PowerEdge R7525 server to power AMD Instinct MI210 GPUs (built with the 2nd Gen AMD CDNA™ architecture) offers improvements on FP64 operations along with the robust capabilities of the AMD ROCm™ 5 open software ecosystem. Overall, the PowerEdge R7525 server with the AMD Instinct MI210 GPU delivers expectational double precision performance and leading total cost of ownership.
Figure 1: Front view of the PowerEdge R7525 server
We performed and observed multiple benchmarks with AMD Instinct MI210 GPUs populated in a PowerEdge R7525 server. This blog shows the performance of LINPACK and the OpenMM customizable molecular simulation libraries with the AMD Instinct MI210 GPU and compares the performance characteristics to the previous generation AMD Instinct MI100 GPU.
The following table provides the configuration details of the PowerEdge R7525 system under test (SUT):
Table 1. SUT hardware and software configurations
Component | Description |
Processor | AMD EPYC 7713 64-Core Processor |
Memory | 512 GB |
Local disk | 1.8T SSD |
Operating system | Ubuntu 20.04.3 LTS |
GPU | 3xMI210/MI100 |
Driver version | 5.13.20.22.10 |
ROCm version | ROCm-5.1.3 |
Processor Settings > Logical Processors | Disabled |
System profiles | Performance |
NUMA node per socket | 4 |
HPL | rochpl_rocm-5.1-60_ubuntu-20.04 |
OpenMM | 7.7.0_49 |
The following table contains the specifications of AMD Instinct MI210 and MI100 GPUs:
Table 2: AMD Instinct MI100 and MI210 PCIe GPU specifications
GPU architecture | AMD Instinct MI210 | AMD Instinct MI100 |
Peak Engine Clock (MHz) | 1700 | 1502 |
Stream processors | 6656 | 7680 |
Peak FP64 (TFlops) | 22.63 | 11.5 |
Peak FP64 Tensor DGEMM (TFlops) | 45.25 | 11.5 |
Peak FP32 (TFlops) | 22.63 | 23.1 |
Peak FP32 Tensor SGEMM (TFlops) | 45.25 | 46.1 |
Memory size (GB) | 64 | 32 |
Memory Type | HBM2e | HBM2 |
Peak Memory Bandwidth (GB/s) | 1638 | 1228 |
Memory ECC support | Yes | Yes |
TDP (Watt) | 300 | 300 |
High-Performance LINPACK (HPL)
HPL measures the floating-point computing power of a system by solving a uniformly random system of linear equations in double precision (FP64) arithmetic, as shown in the following figure. The HPL binary used to collect results was compiled with ROCm 5.1.3.
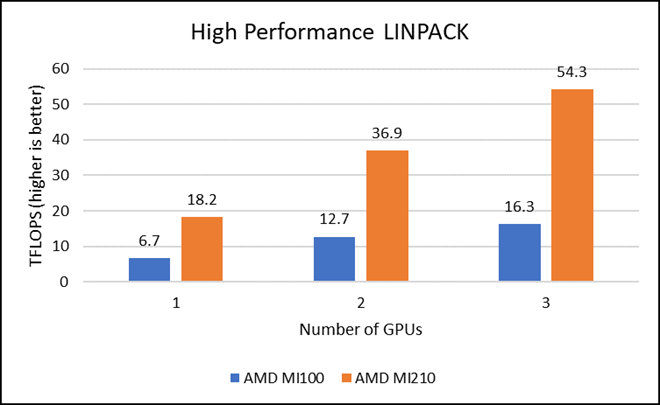
Figure 2: LINPACK performance with AMD Instinct MI100 and MI210 GPUs
The following figure shows the power consumption during a single HPL run:
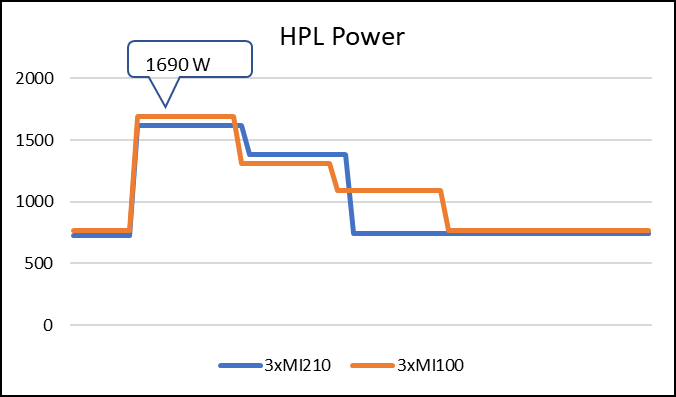
Figure 3: LINPACK power consumption with AMD Instinct MI100 and MI210 GPUs
We observed a significant improvement in the AMD Instinct MI210 HPL performance over the AMD Instinct MI100 GPU. The numbers on a single GPU test of MI210 are 18.2 TFLOPS which is approximately 2.7 times higher than MI100 number (6.75 TFLOPS). This improvement is due to the AMD CDNA2 architecture on the AMD Instinct MI210 GPU, which has been optimized for FP64 matrix and vector workloads. Also, the MI210 GPU has larger memory, so the problem size (N) used here is large in comparison to the AMD Instinct MI100 GPU.
As shown in Figure 2, the AMD Instinct MI210 has shown almost linear scalability in the HPL values on single node multi-GPU runs. The AMD Instinct MI210 GPU reports better scalability compared to its last generation AMD Instinct MI100 GPUs. Both GPUs have the same TDP, with the AMD Instinct MI210 GPU delivering three times better performance. The performance per watt value of a PowerEdge R7525 system is three times more. Figure 3 shows the power consumption characteristics in one HPL run cycle.
OpenMM
OpenMM is a high-performance toolkit for molecular simulation. It can be used as a library or as an application. It includes extensive language bindings for Python, C, C++, and even Fortran. The code is open source and actively maintained on GitHub and licensed under MIT and LGPL.
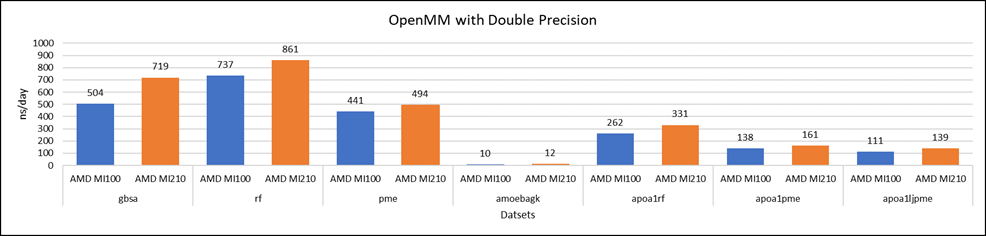
Figure 4: OpenMM double-precision performance with AMD Instinct MI100 and MI210 GPUs
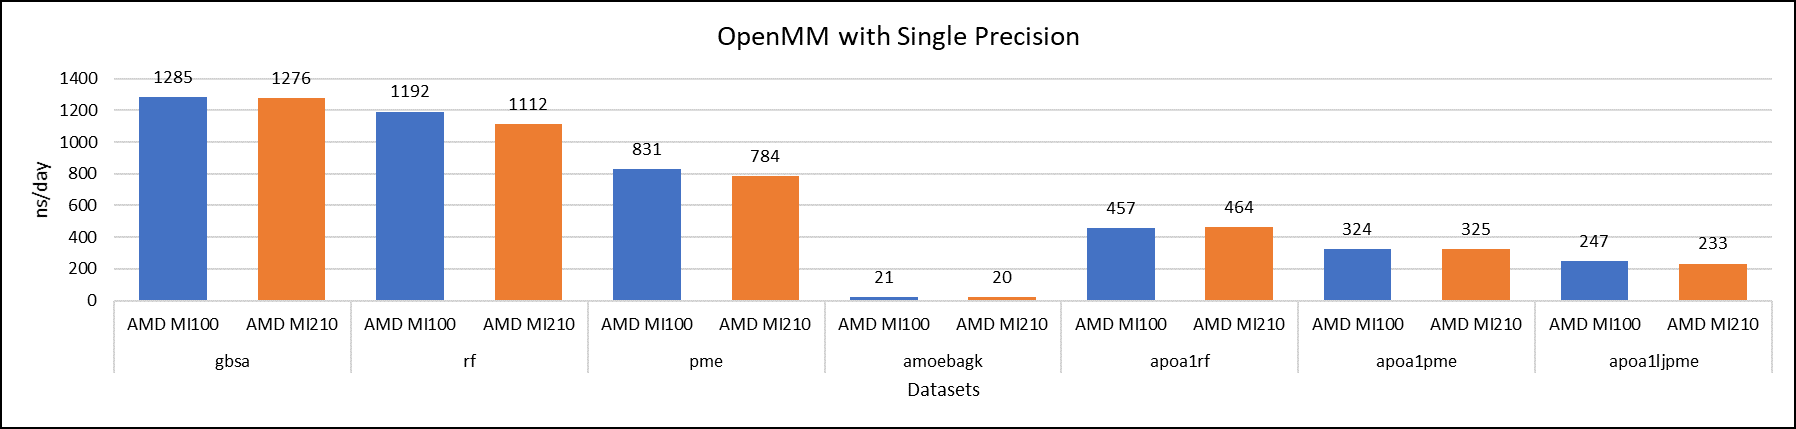
Figure 5: OpenMM single-precision performance with AMD Instinct MI100 and MI210 GPUs

Figure 6: OpenMM mixed-precision performance with AMD Instinct MI100 and MI210 GPUs
We tested OpenMM with seven datasets to validate double, single, and mixed precision. We observed exceptional double precision performance with OpenMM on the AMD Instinct MI210 GPU compared to the AMD Instinct MI100 GPU. This improvement is due to the AMD CDNA2 architecture on the AMD Instinct MI210 GPU, which has been optimized for FP64 matrix and vector workloads.
Conclusion
The AMD Instinct MI210 GPU shows an impressive performance improvement in FP64 workloads. These workloads benefit as AMD has doubled the width of their ALUs to a full 64-bits wide. This change allows the FP64 operations to now run at full speed in the new 2nd Gen AMD CDNA architecture. The applications and workloads that are designed to run on FP64 operations are expected to take full advantage of the hardware.