Home > Storage > PowerStore > Storage Admin > Dell PowerStore Manager Overview > Monitoring
Monitoring
-
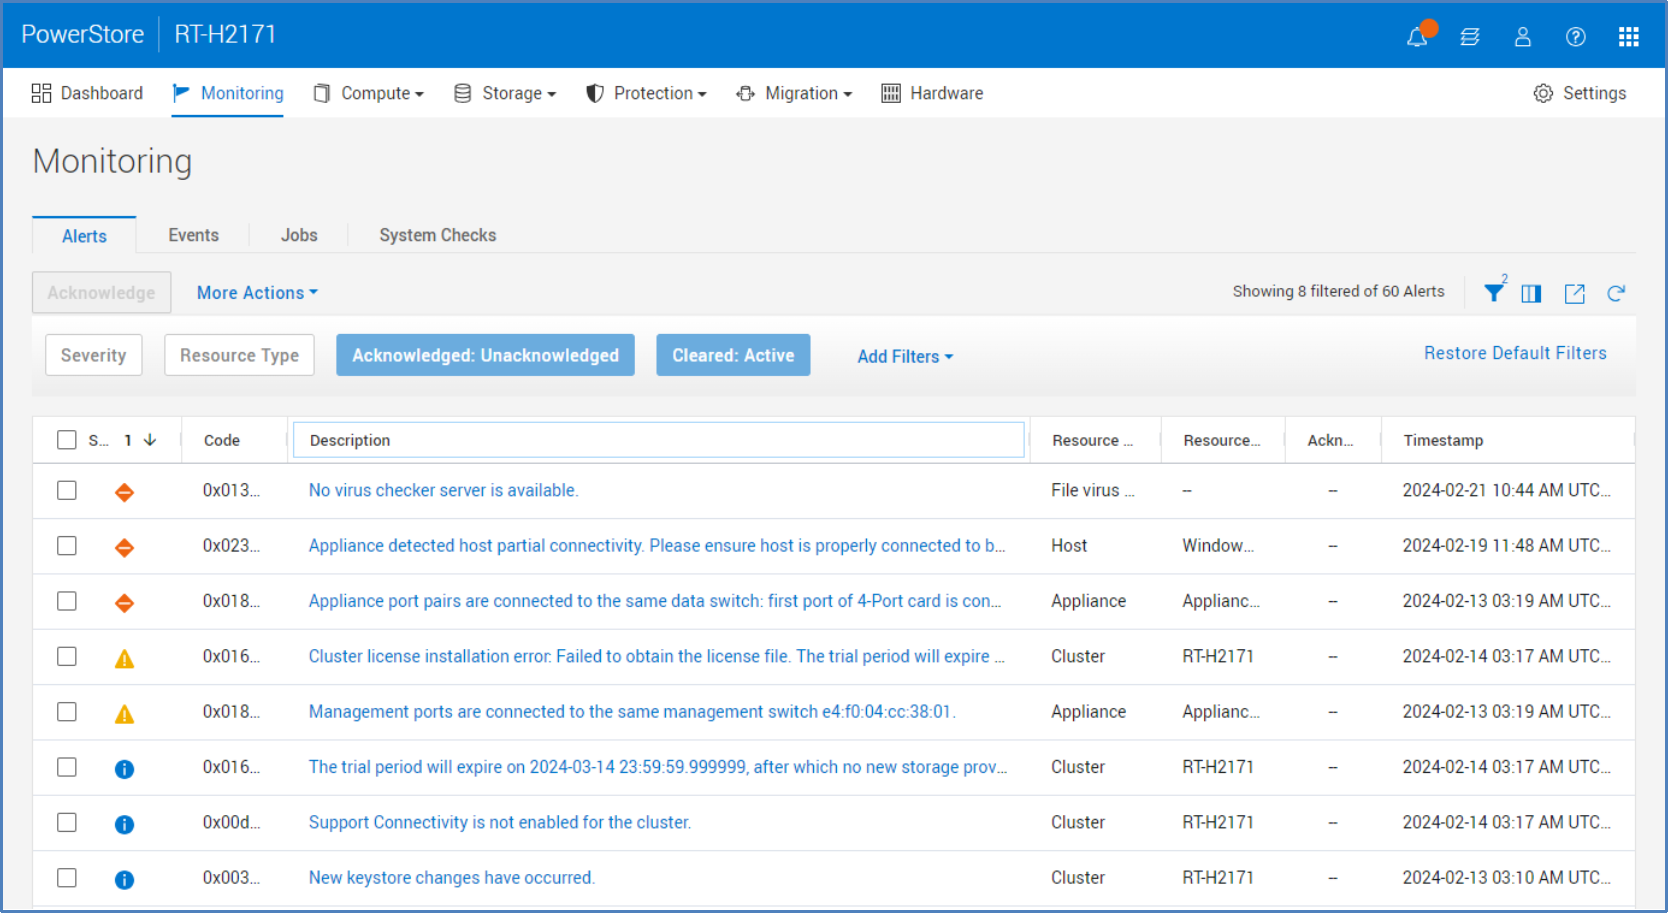
The Monitoring page is the consolidated area of all appliance alerts, events, and jobs for the cluster. Events provide information about changes to the system, but do not rise to the level of an alert that indicates a problem with the system. Alerts, as shown in Figure 7, are categorized by severity which indicates the urgency of the alert. On the Jobs tab, you can monitor the status of user and system-created jobs. In PowerStoreOS version 2.0 and later, jobs that have completed with a warning status will be displayed. When the user clicks a job, they can view each individual job step for details about the warning.

Figure 7. Monitoring page > Alerts tab
The following table shows the supported alert severities and their descriptions.
Table 4. Alert severity levels
Icon
Label
Indicates

Information
An event has occurred that does not impact system functions. No action is required.

Minor

Major

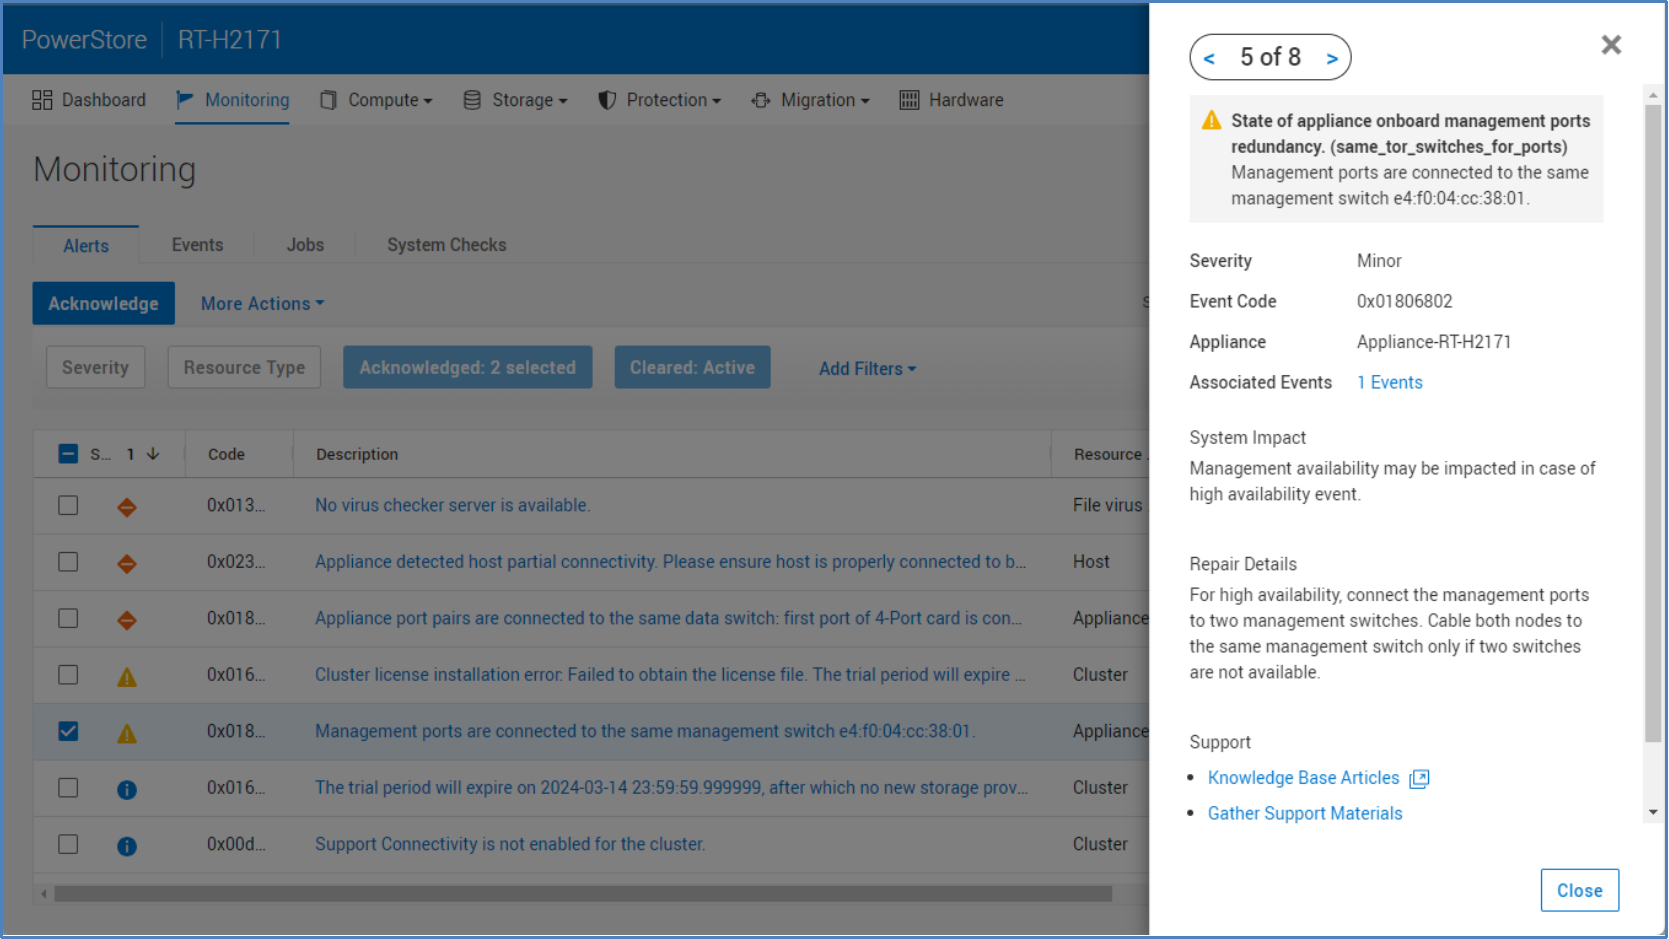
In the details of each alert, more information is displayed including the System Impact, Repair Details, and Associated Events as shown in Figure 8. This information is useful in troubleshooting scenarios and allows users to remediate issues seen on the system.

Figure 8. Monitoring page > Alert details
When alerts are no longer relevant or are resolved, the system automatically clears the alerts with no user intervention. This action ensures that cleared alerts are hidden from the default view so that only relevant issues are displayed to administrators. Cleared alerts can be optionally displayed through table filtering options. Alerts can also be acknowledged which removes the alert from default view. Acknowledging an alert does not indicate that the issue is resolved. You can view acknowledged alerts through the table-filtering options. You can also configure PowerStore Manager to send alert notifications to a specified email or SMTP server through the Settings menu.
When a user logs in to PowerStore Manager, the system may display a global alert banner across the top of the menu buttons. Global banners inform users of specific events happening on the system by displaying three different banner styles: Informational (blue), Minor/Major (yellow), or Critical (red). Multiple global alerts are supported, and the color and message on the banner will always display the most severe alert. When a user clicks the global banner alert, the alert details will slide out from the right and the user may cycle through all active global alerts. Global alerts may include expiring license warnings, NDU in progress notifications, and critical issues such as a degraded system.
System checks
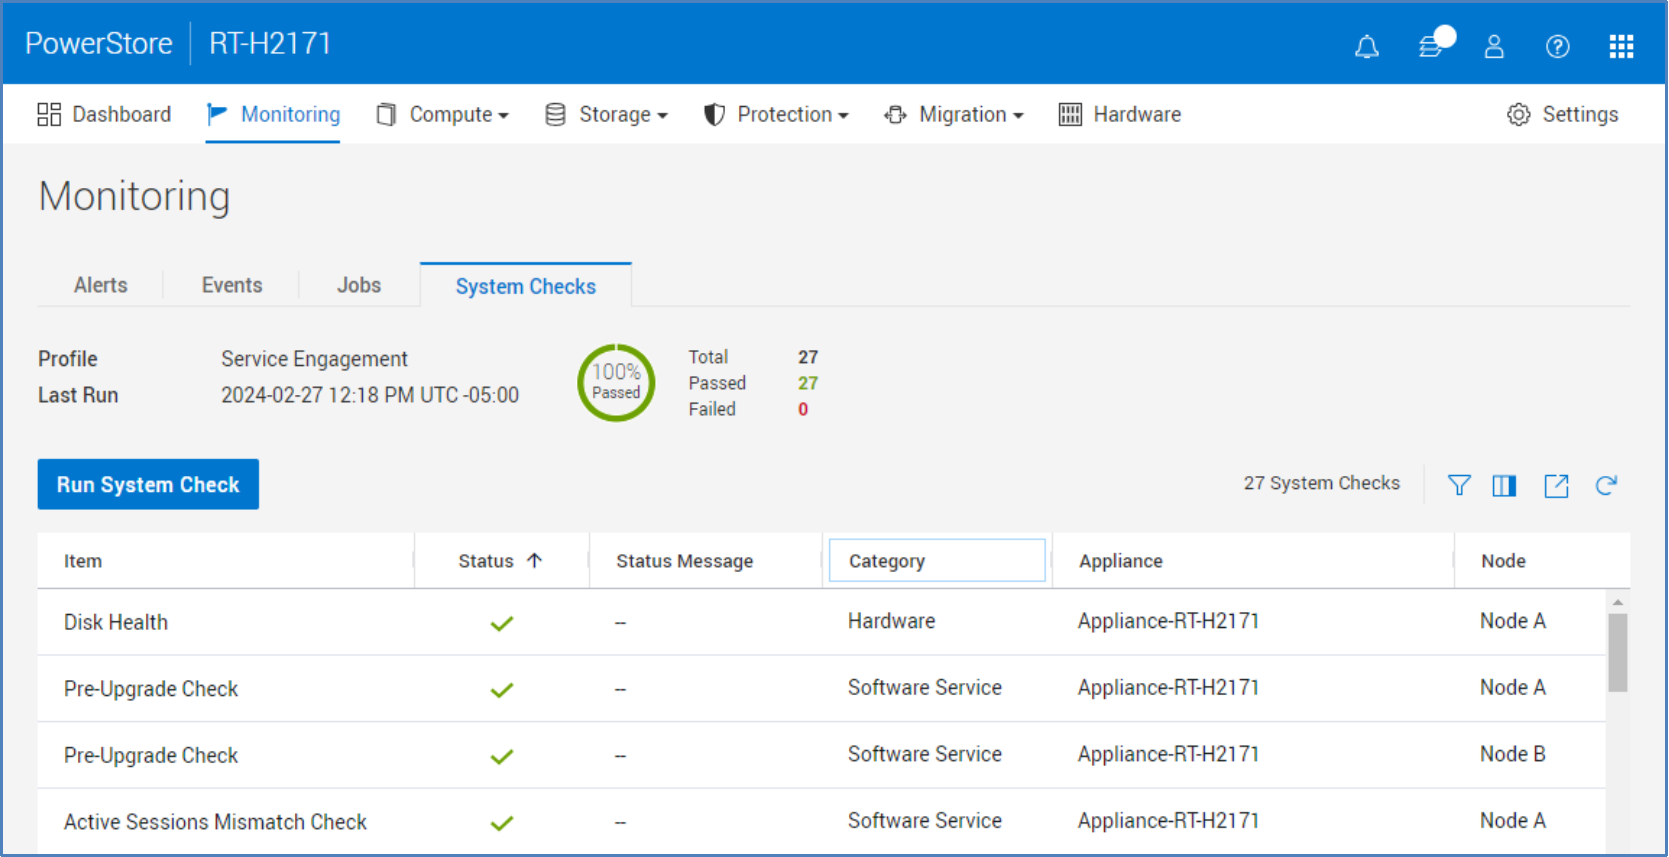
Introduced in PowerStoreOS 2.0, system checks can be run against your PowerStore cluster from the Monitoring > System Checks tab, see Figure 9. System checks can be run independently at any time to allow users to proactively check system health outside of the upgrade cycle. System Check jobs run the latest Health Check that has been installed on the system. Once the System Check job is complete, status information is displayed with a pass-to-fail ratio of the various components that were checked as shown in Figure 9.

Figure 9. Monitoring page > System Checks
