-
For PowerStore, an appliance consists of a base enclosure and optional expansion enclosures. A base enclosure includes two nodes and slots for up to 25 drives, while expansion enclosures enable adding more drives and increasing the storage capacity of the appliance. To view the overall health of the physical hardware of appliances, go to Hardware > Appliances as shown in Figure 40. This page lists all appliances that are associated with the cluster. Click an appliance in the table to display the appliance details page to review more information.

Figure 40. Hardware page
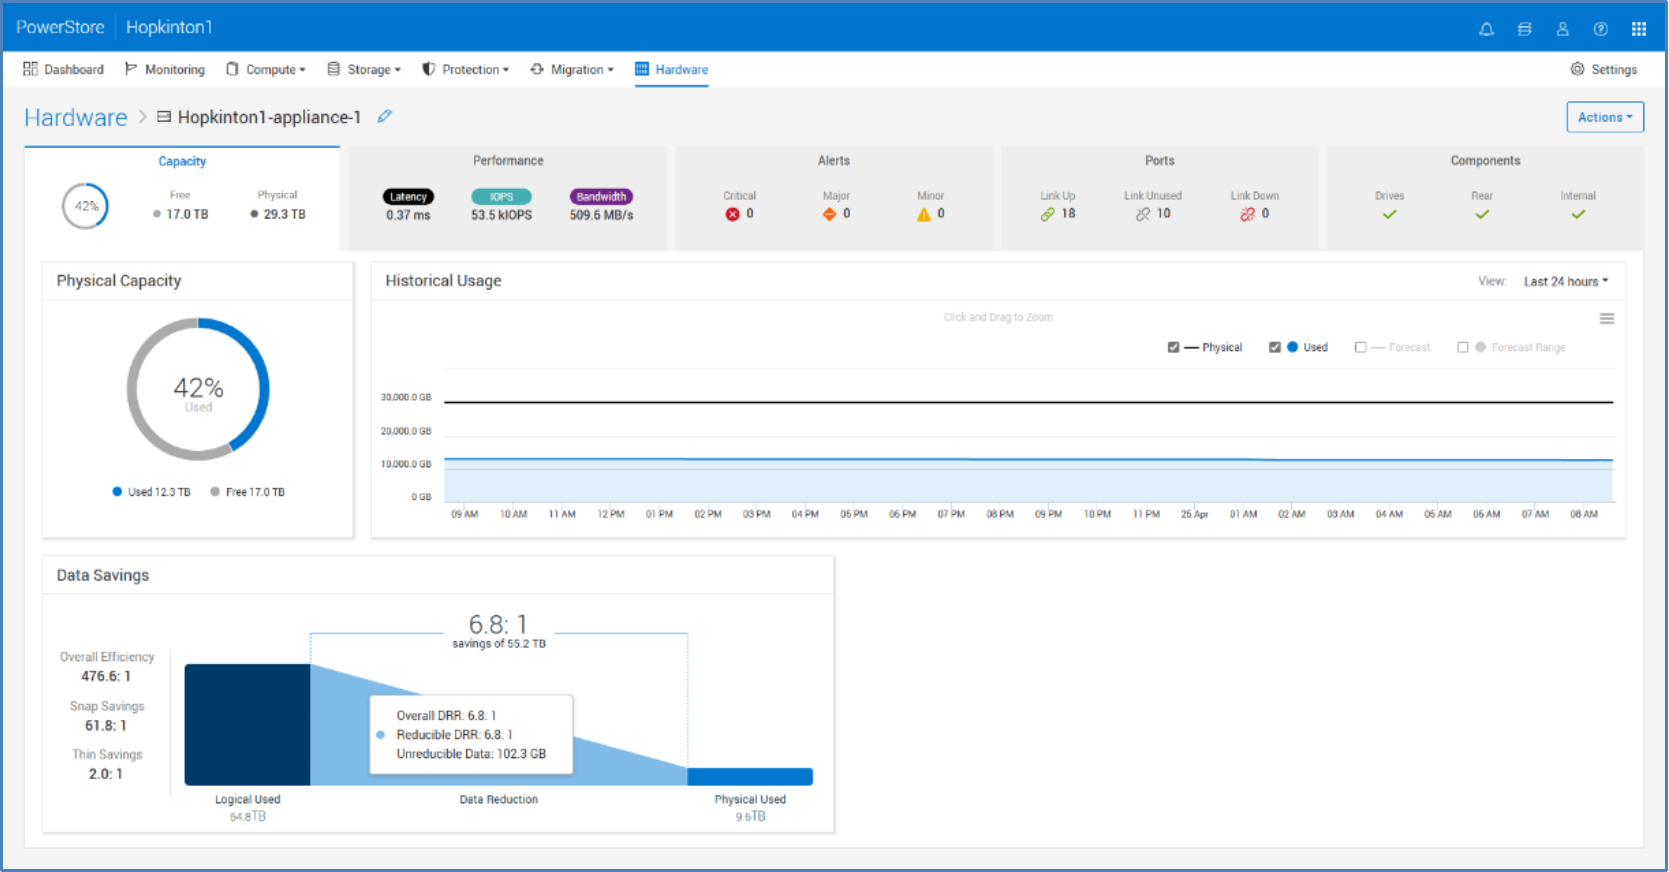
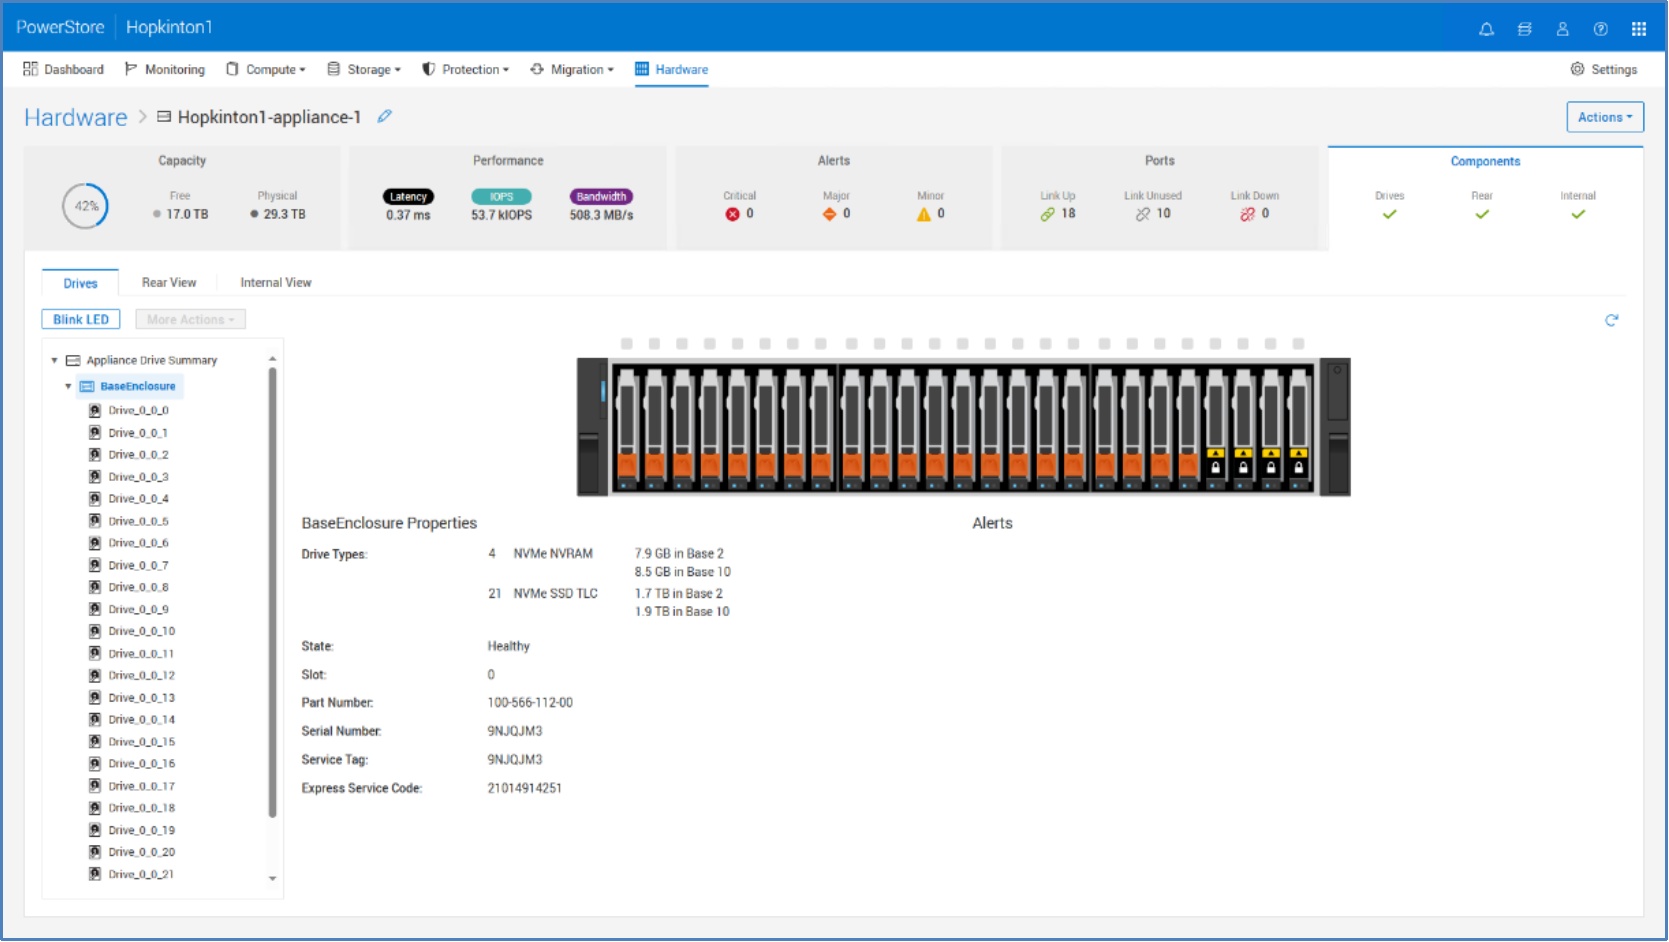
In the appliance details page, you can review the metrics, alerts, and health information for the selected appliance and its associated components (Figure 41). This information is similar to the Dashboard view, but is filtered for the selected appliance, which is useful in daily administrative tasks. In terms of physical hardware component health and status, click the Components card on the right side of the page. In the components view, you can see different views of the base enclosure including Drives (Figure 42), Rear View, and Top View. Each view has different components that can be selected for more information including the part number, health status, and other component-specific details. When a component has an issue or is faulted, the graphical figure indicates an alert, depending on the type of issue, to visually notify the user of an error.
On the Drives tab, there is an option to Blink LED. When the base enclosure is selected, click the button to blink all LEDs for the drives, the base-enclosure LED, and the rear-fault LED simultaneously. This action is useful when you are trying to identify a particular system in a rack of multiple appliances. Click the button again to stop the LEDs from blinking. When a specific drive is selected, click Blink LED to blink the LED of only that drive. This action is useful when an individual drive must be located in the data center.

Figure 41. Hardware > [APPLIANCE] > Capacity tab

Figure 42. Hardware > [APPLIANCE] > Components > Drives
Appliance Performance
From the Hardware > [APPLIANCE] > Performance card, you can view performance metrics for the selected appliance. Performance data is polled every 20 seconds and rolled into timeline charts that update at different frequencies depending on the timeline selected.
- Last hour data is updated every 20 seconds.
- Last 24 Hours data is updated every 5 minutes.
- Last 1 month data is updated every 1 hour.
- Last 2 years data is updated every 24 hours.
You can select different performance categories from the drop-down menu on the left column. The following table shows the performance metric categories available from the drop-down menu.
Table 6. Appliance Performance Metrics
Category
Metrics
Description
Summary
Latency, IOPS, Bandwidth
Displays the Latency, IOPS, and Bandwidth performance metrics for the appliance.
Bandwidth details
Latency, Total Bandwidth, Read Bandwidth, Write Bandwidth
Amount of data that moved through the system within a specified period. The bandwidth metrics include average total bandwidth, average read bandwidth, and average write bandwidth. Bandwidth is calculated by multiplying the IOPS by the IO size.
IOPS details
Latency, Total IOPS, Read IOPS, Write IOPS
Number of read and write requests that the system serviced within a specified period. The IOPS metrics include average total IOPS, average read IOPS, and average write IOPS.
Latency details
Latency, Ready Latency, Write Latency
How fast the system responded to read and write requests within a specified period. The latency metrics include average total latency, average read latency, and average write latency.
CPU Utilization details
Latency, CPU Utilization
The percentage of CPU Utilization on the cores dedicated to servicing storage I/O requests (available only for Overall Performance metrics).
IO Size details
Latency, Avg. IO Size, Read IO Size, Write IO Size
Number of read and write requests' size that performed I/O operations within a specified period. The IO size metrics include average total size, average read size, and average write size.
Queue depth
Latency, Queue Depth
The number of pending IO requests.
In PowerStoreOS 2.0, node CPU stats were added to the CPU Utilization details category which allows you to monitor each node’s CPU utilization and latency metrics.
In PowerStoreOS 3.0 and higher, you can adjust the layout to show between one and three columns for easier viewing.
Note: Appliance performance metrics are also available over REST API.
Port IO Performance
From the Hardware > [APPLIANCE] > Ports card, you can view IO Performance details for Ethernet, and Fibre Channel ports by checking the chosen port and clicking the IO Performance button from the More Actions drop-down menu. From the port IO Performance page, you can view performance metric details for Host IO latency, IOPS, Bandwidth, IO Size, and Queue Depth for that specific port. The ports card also allows you to perform link aggregation, map storage networks, tag ports for replication, and compare performance metrics.
