The following sections provide steps to troubleshoot network connectivity issues at the different layers in a network.
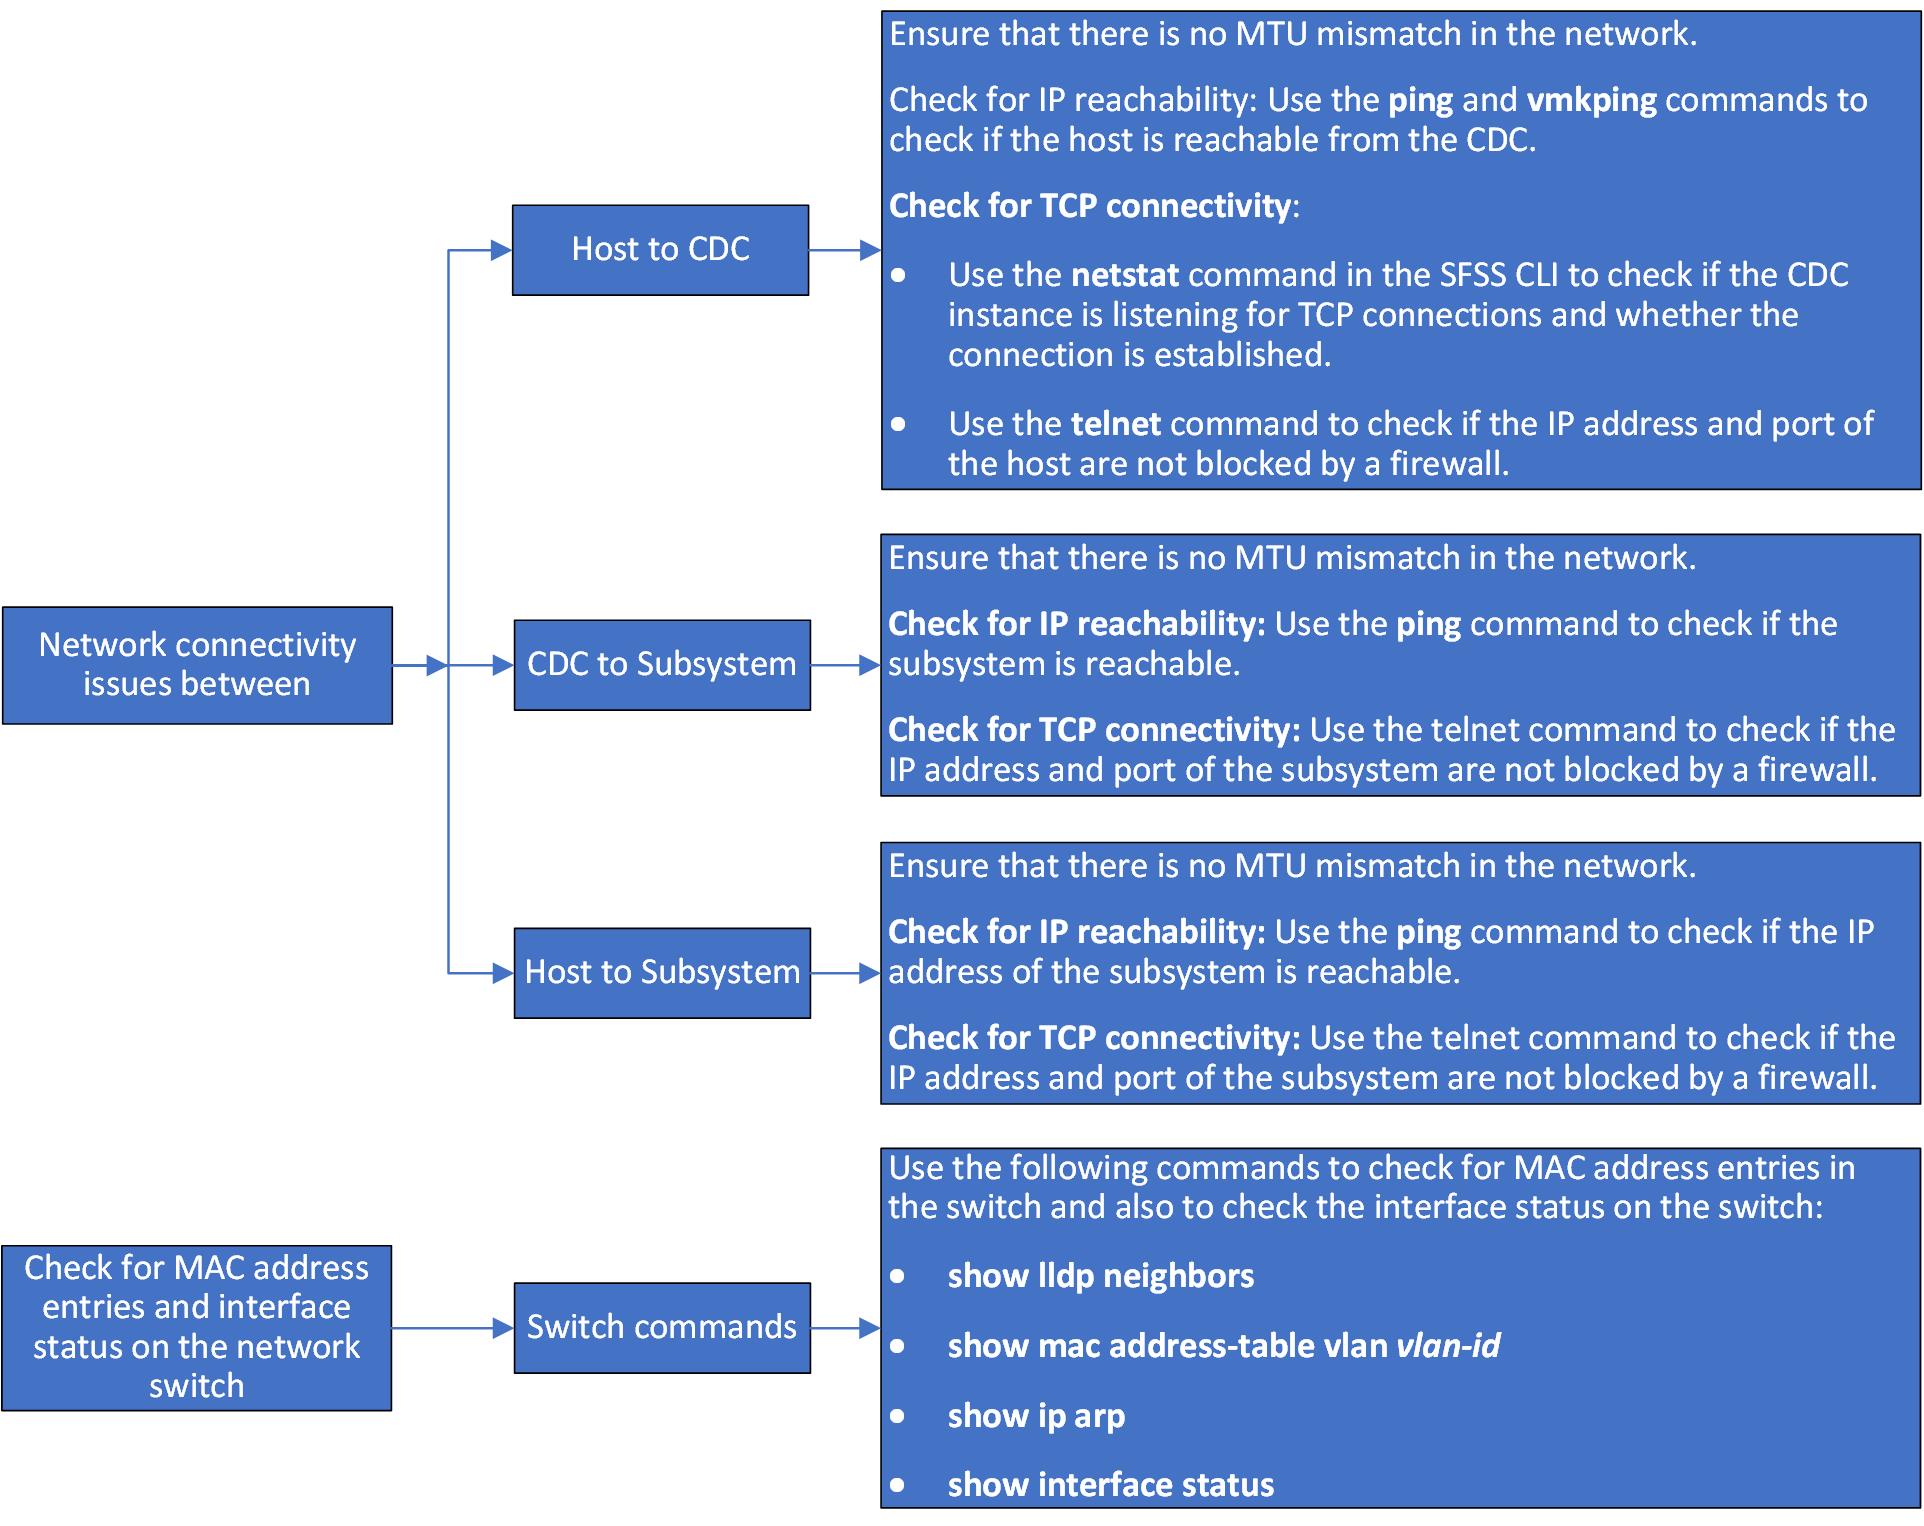

The following sections provide steps to troubleshoot network connectivity issues at the different layers in a network.
Perform the following checks to ensure that TCP connection is established successfully.
telnet command on the ESXi host to look for TCP port connectivity issues. The output shows that the IP address and port are not blocked by a firewall. [root@esxi05:~] telnet 172.18.21.250 8009
Trying 172.18.21.250...
Connected to 172.18.21.250.
Escape character is '^]'.If the telnet command is not available on the ESXi host, use the netcat (nc) command to check for TCP port connectivity.
[root@esxi05:~] nc -z 172.18.21.250 8009
Connection to 172.18.21.250 8009 port [tcp/*] succeeded!
The netcat command output shows that the TCP connection is established.
vmkping command on the ESXi host. Ensure that there is no MTU mismatch in the network. Endpoint registration fails if there is an MTU mismatch in the network. [root@esxi05:~] vmkping -I vmk2 172.18.21.250 -s 9000
PING 172.18.21.250 (172.18.21.250): 9000 data bytes
9008 bytes from 172.18.21.250: icmp_seq=0 ttl=64 time=0.307 ms
9008 bytes from 172.18.21.250: icmp_seq=1 ttl=64 time=0.283 ms
9008 bytes from 172.18.21.250: icmp_seq=2 ttl=64 time=0.239 ms
--- 172.18.21.250 ping statistics ---
3 packets transmitted, 3 packets received, 0% packet loss
round-trip min/avg/max = 0.239/0.276/0.307 ms
netstat command on the SFSS VM to check if CDC is listening for TCP connections. root@sfss:/home/stfs# sudo netstat -tulpn | grep LISTEN | grep 8009
tcp 0 0 172.18.21.250:8009 0.0.0.0:* LISTEN 3327/kube-proxyThe IP address, 172.18.21.250 is the IP address of the CDC instance. You can see from the output that the CDC instance is listening for TCP connections.
netstat command to ensure that the TCP connection is established: root@sfss:/home/stfs# sudo netstat -an | grep ESTABLISHED | grep 8009
tcp 0 0 172.18.21.250:36464 172.18.21.250:8009 ESTABLISHED
On the SFSS VM, check if the subsystem is reachable and ensure that the IP address and port of the subsystem are not blocked by a firewall.
telnet command. root@sfss:/home/stfs# telnet 172.18.21.191 8009
Trying 172.18.21.191...
Connected to 172.18.21.191.
Escape character is '^]'.ping command. root@sfss:/home/stfs# ping 172.18.21.191
PING 172.18.21.191 (172.18.21.191) 56(84) bytes of data.
64 bytes from 172.18.21.191: icmp_seq=1 ttl=64 time=0.164 ms
64 bytes from 172.18.21.191: icmp_seq=2 ttl=64 time=0.138 ms
64 bytes from 172.18.21.191: icmp_seq=3 ttl=64 time=0.172 ms
64 bytes from 172.18.21.191: icmp_seq=4 ttl=64 time=0.153 ms
64 bytes from 172.18.21.191: icmp_seq=5 ttl=64 time=0.137 ms
64 bytes from 172.18.21.191: icmp_seq=6 ttl=64 time=0.139 ms
--- 172.18.21.191 ping statistics ---
6 packets transmitted, 6 received, 0% packet loss, time 84ms
rtt min/avg/max/mdev = 0.137/0.150/0.172/0.018 ms
root@sfss:/home/stfs# ping 172.18.21.191 -s 8972
PING 172.18.21.191 (172.18.21.191) 8972(9000) bytes of data.
8980 bytes from 172.18.21.191: icmp_seq=1 ttl=64 time=0.242 ms
8980 bytes from 172.18.21.191: icmp_seq=2 ttl=64 time=0.156 ms
8980 bytes from 172.18.21.191: icmp_seq=3 ttl=64 time=0.148 ms
8980 bytes from 172.18.21.191: icmp_seq=4 ttl=64 time=0.094 ms

4 packets transmitted, 4 received, 0% packet loss, time 74ms
On the ESXi host:
telnet command to check if the IP address of the subsystem and port are not blocked. If the telnet command is not available, use the netcat (nc) command: [root@esxi05:~] nc -z 172.18.21.191 8009
Connection to 172.18.21.191 8009 port [tcp/*] succeeded![root@esxi05:~] nc -z 172.18.21.191 4420
Connection to 172.18.21.191 4420 port [tcp/*] succeeded!vmkping command to check if the subsystem is reachable from the ESXi host. [root@esxi05:~] vmkping 172.18.21.191
PING 172.18.21.191 (172.18.21.191): 56 data bytes
64 bytes from 172.18.21.191: icmp_seq=0 ttl=64 time=0.155 ms
64 bytes from 172.18.21.191: icmp_seq=1 ttl=64 time=0.116 ms
64 bytes from 172.18.21.191: icmp_seq=2 ttl=64 time=0.107 ms
--- 172.18.21.191 ping statistics ---
3 packets transmitted, 3 packets received, 0% packet loss
round-trip min/avg/max = 0.107/0.126/0.155 ms
Check if the switches have learned the endpoint MAC addresses. Enter the following commands on the switches. The examples listed below are obtained from an OS10 switch:
show lldp neighbors SAN-A# show lldp neighbors
Loc PortID Rem Host Name Rem Port Id Rem Chassis Id
--------------------------------------------------------------------------------------
ethernet1/1/1 Not Advertised b8:ce:f6:10:b1:b8 b8:ce:f6:10:b1:ba
ethernet1/1/1 Not Advertised b8:ce:f6:10:b1:b8 b8:ce:f6:10:b1:b8
ethernet1/1/2 Not Advertised b8:ce:f6:10:b1:94 b8:ce:f6:10:b1:96
ethernet1/1/2 esxi02.dell.lab b8:ce:f6:10:b1:94 vmnic4
ethernet1/1/3 Not Advertised b8:ce:f6:10:b1:d0 b8:ce:f6:10:b1:d2
ethernet1/1/3 esxi03.dell.lab b8:ce:f6:10:b1:d0 vmnic4
ethernet1/1/4 Not Advertised b8:ce:f6:10:b1:b4 b8:ce:f6:10:b1:b6
ethernet1/1/4 esxi04.dell.lab b8:ce:f6:10:b1:b4 vmnic4
ethernet1/1/31 Not Advertised 00:60:16:d3:77:f4 00:60:16:d3:77:f4
ethernet1/1/31 Dell EMC PowerStore 00:60:16:d3:77:e4 cyc-coreos
ethernet1/1/32 Not Advertised 00:60:16:d3:55:bc 00:60:16:d3:55:bc
ethernet1/1/32 Dell EMC PowerStore 00:60:16:d3:55:ac cyc-coreos
mgmt1/1/1 Rack126-N2048 Gi1/0/33 88:6f:d4:da:e2:53show mac address-table vlan vlan-id SAN-A# show mac address-table
Codes: pv <vlan-id> - private vlan where the mac is originally learnt
VlanId Mac Address Type Interface
1821 00:50:56:61:70:9f dynamic ethernet1/1/2
1821 00:50:56:6c:06:de dynamic ethernet1/1/3
1821 00:50:56:6e:36:0b dynamic ethernet1/1/4
1821 00:50:56:a4:2e:0e dynamic ethernet1/1/1
1821 3a:7a:18:a7:09:69 dynamic ethernet1/1/32
1821 f2:da:6e:ed:c2:58 dynamic ethernet1/1/31show ip arp SAN-A# show ip arp
Codes: pv <vlan-id> - private vlan where the mac is originally learnt
Address Hardware address Interface Egress Interface
---------------------------------------------------------------------
172.18.21.102 00:50:56:61:70:9f vlan1821 ethernet1/1/2
172.18.21.103 00:50:56:6c:06:de vlan1821 ethernet1/1/3
172.18.21.104 00:50:56:6e:36:0b vlan1821 ethernet1/1/4
172.18.21.191 f2:da:6e:ed:c2:58 vlan1821 ethernet1/1/31
172.18.21.250 00:50:56:a4:2e:0e vlan1821 ethernet1/1/1
Check for the interface status using the show interface status command:
SAN-A# show interface status
--------------------------------------------------------------------
Port       Description   Status Speed  Duplex Mode Vlan Tagged-Vlans
--------------------------------------------------------------------
Eth 1/1/1  esxi01          up    25G   full    T    1   1821
Eth 1/1/2  esxi02          up    25G   full    T    1   1821
Eth 1/1/3  esxi03          up    25G   full    T    1   1821
Eth 1/1/4  esxi04          up    25G   full    T    1   1821
Eth 1/1/31 PowerStore-R1.. up    25G   full    T    1   1821
Eth 1/1/32 PowerStore-R1.. up    25G   full    T    1   1821