


PERC 12 Generational Performance Boosts
Wed, 08 Feb 2023 21:17:34 -0000
|Read Time: 0 minutes
Some additional insights into the recent Tolly report on PERC 12 vs. PERC 11 and PERC 10
No matter your organization’s focus, faster, more reliable RAID is always a good thing. Recently, Tolly published a full-length report comparing the performance of Dell’s PERC 12 with prior generation PERC 11 and PERC 10. You can read that report here: https://infohub.delltechnologies.com/section-assets/tolly223103delltechnologiespoweredgeraidcontroller12performance
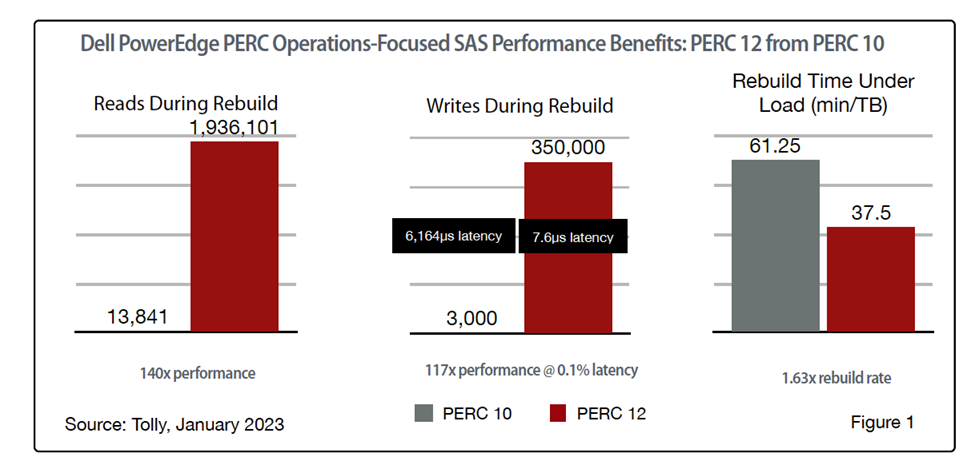
Even a quick glance at the full report will turn your head as there are some very impressive numbers. For example, PERC 12 delivers SAS read performance during rebuild that is 140x that of PERC 10; write performance during rebuilt that is 117x that of PERC 10 at 0.1% the latency; and volume rebuild time that is 1.63x the rate of PERC 10.
In total, we covered over 60 different tests that spanned PERC 10, 11, and 12 and both SAS and SSD storage environments. So much data, so little space! So, in this blog, we will focus on PERC 12 from PERC 11 and take a closer look at some of generational benefits of upgrading NVMe environments from existing PERC 11 to the new PERC 12 technology. (PERC 10 did not offer support for NVMe.)
PERC 12 Speeds & Feeds: IOPS & Bandwidth
While most of us (hopefully) don’t spend our time going “0-60” in our cars, it has become a standard metric for car manufactures. Similarly, “IOPS and bandwidth” have become standard metrics for storage solutions. As with cars, it is not because the use case is a common one but because the extreme cases can go a long way in highlighting technological achievements – which end up helping one’s more mundane use cases. With that introduction, let’s look at the test results.
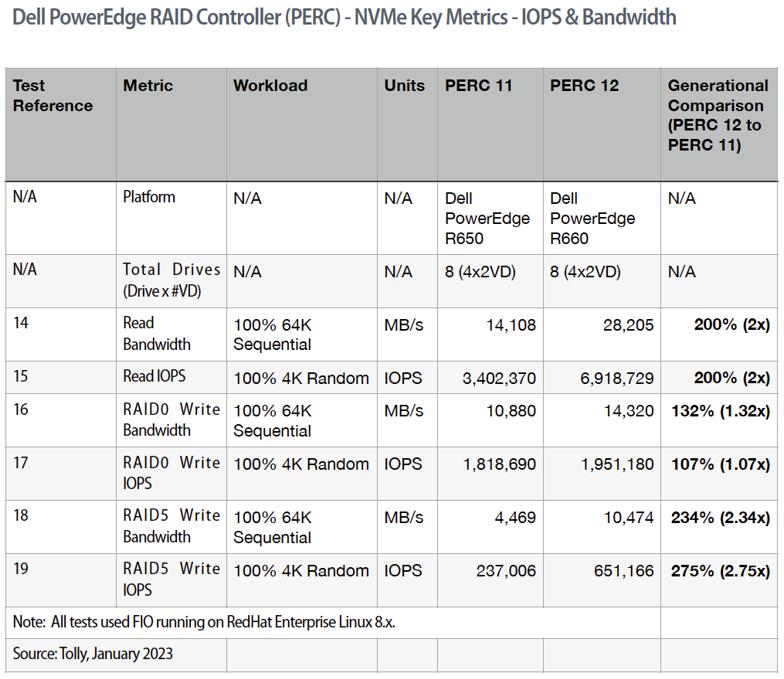
All these data points can be found in our Tolly report referenced above. For both reads and writes, we are interested in the maximum values for read/write operations and overall throughput.
To show maximum throughput, 64K sequential reads are used. To show maximum operations, 4K random reads are used. For simplicity with comparing results, 100% of the test uses the same pattern.
While out table contains all the raw results, it is the comparison column on the far right that draws our interest. In every case, PERC 12 outperforms PERC 11 with NVMe.
While RAID0 results are included, the fact that RAID0 does not provide protection against disk failure and, thus, is not relevant to most organizations.
Looking at RAID5, then, a quick glance shows that PERC 12 delivers twice (or more) the IOPS and bandwidth for both read and write operations when compared to PERC 11.
All these tests were run on “optimal” environments. That is, disk arrays with all of the disks operational. But that isn’t always the case in the realworld.
PERC 12 Rebuild Performance & “Tail” Latency
Across the board, what I find most impressive about PERC 12 is how it improves performance during rebuild. In the real world, disk failures happen. Always have, probably always will. What is important is what happens to your system in such situations.
Fortunately, RAID5 is all about data protection. Thus, when a RAID5 array has a disk failure, no data is lost. When a new, replacement disk is inserted, however, a “rebuild” has to take place. The RAID5 controller rebuilds the protected array by writing data to the “fresh” disk. Traditionally, this has translated into degraded performance for the array during the rebuild. PERC 12 changes all that.
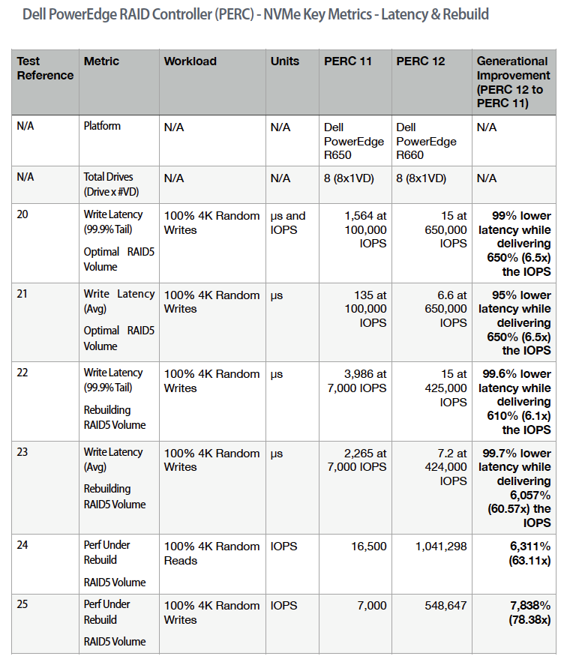
Again, looking at data from our report, there are several things to note.
First, you will note that in addition to average latency, we are also reporting “tail” latency. This latency value reports the latency for 99.9% of the test results. Looked at another way, it is the latency for all but the “worst” 0.1% of the results.
Tail latency is a much more rigorous measurement because of the scope of results that it covers. The test data shown in this table cover both “optimal” environments as well as tests run with rebuilds in progress. In all cases, the latency is dramatically lower. PERC 12 reduces average/tail latency by 95% to 99.7% compared with PERC 11.
At the same time, PERC 12 boosts 600% of the IOPS delivered with PERC 11.
And, as mentioned earlier, performance under rebuild is dramatically improved. PERC 12 random read IOPS are more than 60x PERC 11. PERC 12 random writes are more than 78x PERC 11.
Outro
Whether you are on a five-year refresh cycle and are jumping from PERC 10 to PERC 12 or on a latest-to-latest cycle and moving from PERC 11 directly PERC 12, the numbers are impressive no matter what test scenario you look at.
For a boost in real-world performance – especially during RAID volume rebuild – PERC 12 has your back.
Related Blog Posts

VxRail’s Latest Hardware Evolution
Thu, 04 Jan 2024 17:22:21 -0000
|Read Time: 0 minutes
December is a time of celebration and anticipation, a month in which we may reflect on the events of the year and look ahead to what is yet to come. Charles Dickens’ “A Christmas Carol” – and its many stage and movie remakes – is one of those literary classics that helps showcase this season’s magic at its finest. It is even said that there is a special kind of magic—one full of excitement, innovation, and productivity—that finds a way to (hyper)converge the past, present, and future for data center administrators all around the world who have been good all year!
No, your wondering eyes do not deceive you. Appearing today are VxRail’s next generation platforms—the VE-660 and VP-760—in all-new, all-NVMe configurations! While Santa’s elves have spent the year building their backlog of toys and planning supply-chain delivery logistics that rival SLA standards of the world’s largest e-tailers, the VxRail team has been hard at work innovating our VxRail family portfolio to ensure that your workloads can run faster than ever before. So, let’s grab a glass of eggnog and invite the holiday spirits along for a tour of VxRail past, present, and future to better understand our latest portfolio addition.
 Figure 1. VxRail VE-660
 Figure 2. VxRail VP-760
Spirit of VxRail Past
 Figure 3. Santa still runs 3-tier architecture. He needs VxRail and the speed of NVMe!When VxRail first launched almost 8 years ago in early 2016, we introduced the concept of hyperconverged infrastructure to the masses with one easily-managed platform that combined best-of-breed Dell PowerEdge servers with VMware technology. This new age of data center management brought better performance, extended capabilities, and time-saving advantages to data center admins everywhere. Over the years, we’ve sought to improve the offering by taking advantage of the latest hardware standards and technologies.
This was especially true earlier this summer when we launched the VE-660 and VP-760 VxRail platforms based on 16th Generation Dell PowerEdge servers. These next-gen successors to the VxRail E-Series and P-Series platforms not only contained the latest hardware innovations, but also represented a systemic change in the overall VxRail offering.
First, the mainline E- and P-series platforms were respectively re-christened as the VE-660 and VP-760. This was done primarily to invite easier comparison points to the underlying PowerEdge servers on which they’re based – the R660 and R760. Second, we tracked how the use of accelerators in the data center had evolved over the years and made the strategic decision to fold the capabilities of the V-Series platform into the P-Series by way of specific riser configurations. Now, customers have the ability to glean all the benefits of a high-performant 2U system with the choice of either storage-optimized (up to 28 total drive bays) or accelerator-optimized (up to 2x double wide or 6x single wide GPUs) chassis configurations—whichever best aligns to the specifics of their workload needs. And third, VxRail platforms dropped the storage type suffix from the model name. Hybrid and all-flash (and as of today, all-NVME–more on this later) storage variants are now offered as part of the riser configuration selection options of these baseline platforms, where applicable.
These changes are representative of how the breadth and depth of customer needs have grown tremendously over the years. By taking these steps to streamline the VxRail portfolio, we charted an evolutionary path forward that continues our commitment to offer greater customer choice and flexibility.
Spirit of VxRail Present
These themes of greater choice and flexibility are amplified by the architectural improvements underpinning these new VxRail platforms. Primary among them is the introduction of Intel® 4th Generation Xeon® Scalable processors. Intel’s latest generation of processors do more than bump VxRail core density per socket to 56 (112 max per node). They also come with built-in AMX accelerators (Advanced Matrix Extensions) that support AI and HPC workloads without the need for any additional drivers or hardware. For a deeper dive into the Intel® AMX capability set, the Spirit of VxRail Present invites you to read this blog: VxRail and Intel® AMX, Bringing AI Everywhere, authored by Una O’Herlihy.
Intel’s latest processors also usher in support for DDR5 memory and PCIe Gen 5, two other architectural pillars that underpin significant jumps in performance. The following table offers a high-level overview and comparison of these pillars and a useful at-a-glance primer for those considering a technology refresh from earlier generation VxRail:
Table 1. VxRail 14th Generation to 16th Generation comparison
VxRail VE-660 & VP-760 | VxRail E560, P570 & V570 | |
Intel Chipset | 4th Generation Xeon | 2nd Generation Xeon |
Cores | 8 - 56 | 4 - 28 |
TDP | 125W – 350W | 85W – 205W |
Max DRAM Memory | 4TB per socket | 1.5TB per socket |
Memory Channels | 8 (DDR5) | 6 (DDR4) |
Memory Bandwidth | Up to 4800 MT/s | Up to 2933 MT/s |
PCIe Generation | PCIe Gen 5 | PCIe Gen 3 |
PCIe Lanes | 80 | 48 |
PCIe Throughput | 32 GT/s | 8 GT/s |
As the operational needs of a business change day-by-day, finding the right balance between workload density and load balance can often feel like an infinite war for resources. The adoption of DDR5 memory across the latest generation of VxRail platforms offers additional flexibility in the way system resources can be divvied up by virtue of two key benefits: greater memory density and faster bandwidth. The VE-660 and VP-760 wield eight memory channels per processor, with the ability to slot up to two 4800MT/s DIMMs per channel for a maximum memory capacity of 8TB per node. Compared to a VxRail P570, the density and speed improvements are staggering: 33% more memory channels per processor, 2.6x increase in per system total memory, and up to a 64% increase in memory speed! With faster and greater density compute and memory available for workloads, each node in a VxRail cluster can handle more VMs, and if there is ever a case of task bottlenecking, there are plenty of resources still available for optimal load balancing.
When we consider the presence of PCIe Gen 5, we see an even greater increase in the overall performance envelope. PowerEdge’s Next-Generation Tech Note does a great job of contextualizing the capabilities of PCIe Gen 5. The main takeaway for VxRail, however, is that it increases the maximum bandwidth achievable from various peripheral components by roughly 25% when compared to PCIe Gen 4 and roughly 66% when compared to PCIe Gen 3. In particular, the jump in available PCIe lanes (48 lanes to a luxurious 80 lanes) and associated throughput (8 GT/s to 32 GT/s per lane) from Gen 3 to Gen 5 significantly reduces performance bottlenecks, resulting in faster storage transfer rates and more bandwidth for accelerators to process AI and ML workloads.
PCIe Gen 5 is also backwards compatible with previous generation peripherals, enabling a certain degree of flexibility with respect to VxRail’s component extensibility and longevity in the data center. Yesterday’s technologies can still be used, but the VE-660 and VP-760 can adapt to growing workload demands by taking full advantage of the latest peripherals as they are released. They are even equipped with an additional PCIe slot over their E- & P-Series predecessors, providing extra dimensions of configuration. These boons in flexibility ensure any investment into this generation of VxRail enjoys longer relevance as your infrastructure backbone.
Spirit of VxRail Future
Even with all these architectural improvements defining the VP-760 and VE-660, we knew we could find ways of improving the capability set. So, we made our list of desired features (and checked it twice!) and determined that the best way to augment these next-generation hardware enhancements would be with the introduction of all-NVMe storage options.
The Spirit of VxRail Past wishes to remind us that VxRail with all-NVMe storage is not new—NVMe first made its way to the VxRail lineup with the P580N and E560N almost four years ago and has been a mainstay facet of the VxRail with vSAN architecture ever since. However, what is most compelling about all-NVMe versions of the VE-660 and VP-760—what the Spirit of VxRail Future wishes to strongly communicate—is that NVMe opens the door to two very compelling benefits: additional flexibility of choice with respect to vSAN architecture and an associated increase in overall storage capacity with the addition of read intensive NVMe drives in sizes of up to 15.36TB.
The following figure outlines all of the generational advantages customers can benefit from when transitioning from existing 14th Generation VxRail environments to VP-760 all-NVMe platforms.
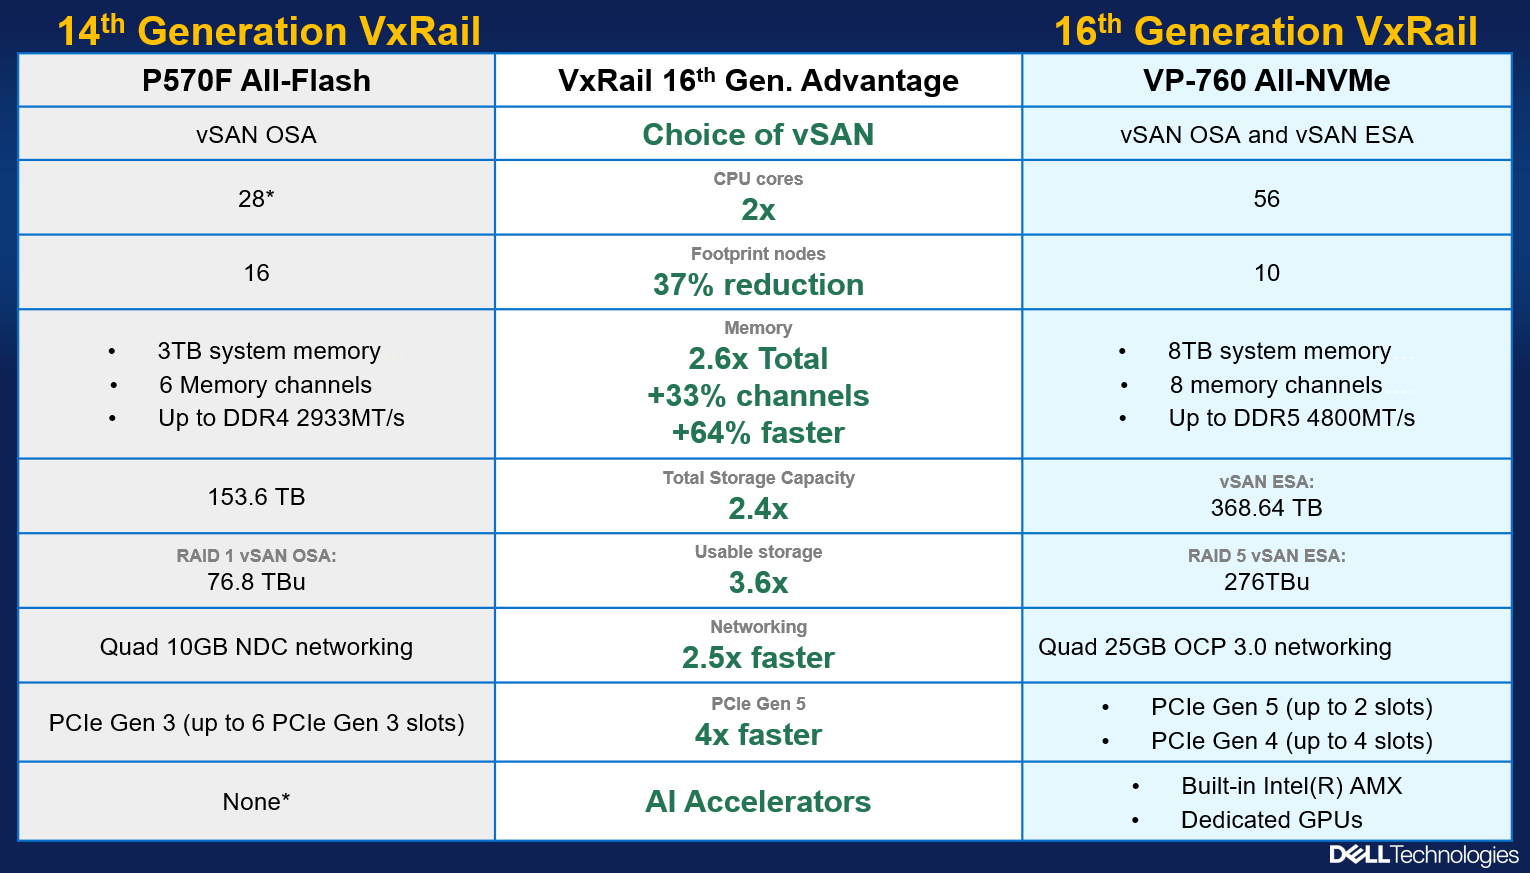 Figure 4. The VxRail 16th Generation all-NVMe advantage
In addition, VxRail on 16th Generation hardware can now support deployments with either vSAN Original Storage Architecture (OSA) or vSAN Express Storage Architecture (ESA). David Glynn provided a great summary of the core value vSAN ESA brings to the table for VxRail in his blog written nearly a year ago. With today’s launch, the VP-760 and VE-660 can now take advantage of vSAN ESA’s single-tier storage architecture that enables RAID-5 resiliency and capacity with RAID-1 performance. Customers who choose to deploy with vSAN OSA can also see the benefit of these new read intensive NVMe drives, with a total storage per node of up to 122.88TB in the VE-660 and 322.56TB in the VP-760. For those who deploy with vSAN ESA, maximum achievable storage is 153.6TB on the VE-660 and up to 368.64TB on the VP-760.
The Spirit of VxRail Future has seen the value of all-NVMe and is content knowing that VxRail will continue to underpin VMware mission-critical workloads for years to come.
Resources
Author: Mike Athanasiou, Sr. Engineering Technologist

OneFS 9.5 Performance Enhancements for Video Editing

Wed, 19 Jul 2023 18:16:59 -0000
|Read Time: 0 minutes
Of the many changes in OneFS 9.5, the most exciting are the performance enhancements on the NVMe-based PowerScale nodes: F900 and F600. These performance increases are the result of some significant changes “under-the-hood” to OneFS. In the lead-up to the National Association of Broadcasters show last April, I wanted to qualify how much of a difference the extra performance would make for Adobe Premiere Pro video editing workflows. Adobe is one of Dell’s biggest media software partners, and Premiere Pro is crucial to all sorts of media production, from broadcast to cinema.
The awesome news is that the changes to OneFS make a big difference. I saw 40% more video streams with the software upgrade: up to 140 streams of UHD ProRes422 from a single F900 node!
Changes to OneFS
Broadly speaking, there were changes to three areas in OneFS that resulted in the performance boost in version 9.5. These areas are L2 cache, backend networking, and prefetch.
L2 cache -- Being smart about how and when to bypass L2 cache and read directly from NVMe is one part of the OneFS 9.5 performance story. PowerScale OneFS clusters maintain a globally accessible L2 cache for all nodes in the cluster. Manipulating L2 cache can be “expensive” computationally speaking. During a read, the cluster needs to determine what data is in cache, whether the read should be added to cache, and what data should be expired from cache. NVMe storage is so performant that bypassing the L2 cache and reading data directly from NVMe frees up cluster resources. Doing so results in even faster reads on nodes that support it.
Backend networking -- OneFS uses a private backend network for internode communication. With the massive performance of NVMe based storage and the introduction of 100 GbE, limits were getting reached on this private network. OneFS 9.5 gets around these limitations with a custom multichannel approach (similar in concept to nconnect from the NFS world for the Linux folks out there). In OneFS 9.5, the connection channels on the backend network are bonded in a carefully orchestrated way to parallelize some aspects, while still keeping a predictable message ordering.
Prefetch -- The last part of the performance boost for OneFS 9.5 comes from improved file prefetch. How OneFS prefetches file system metadata was reworked to more optimally read ahead at the different depths of the metadata tree. Efficiency was improved and “jitter” between file system processes minimized.
Our lab setup
First a little background on PowerScale and OneFS. PowerScale is the updated name for the Isilon product line. The new PowerScale nodes are based on Dell servers with compute, RAM, networking, and storage. PowerScale is a scale-out, clustered network-attached-storage (NAS) solution. To build a OneFS file system, PowerScale nodes are joined to create cluster. The cluster creates a single NAS file system with the aggregate resources of all the nodes in the cluster. Client systems connect using a DNS name, and OneFS SmartConnect balances client connections between the various nodes. No matter which node the client connects to, that client has the potential to access all the data on the entire cluster. Further, the client systems benefit from the all the nodes acting in concert.
Even before the performance enhancements in OneFS 9.5, the NVMe-based PowerScale nodes were speedy, so a robust lab environment was going to be needed to stress the system. For this particular set of tests, I had access to 16 workstations running the latest version of Adobe Premiere Pro 2023. Each workstation ran Windows 10 with Nvidia GPU, Intel processor, and 10 GbE networking. On the storage side, the tests were performed against a minimum sized 3-node F900 PowerScale cluster with 100 GbE networking.
Adobe Premiere Pro excels at compressed video editing. The trick with compressed video is that an individual client workstation will get overwhelmed long before the storage system. As such, it is critical to evaluate whether any dropped frames are the result of storage or an overwhelmed workstation. A simple test is to take a single workstation and start playing back parallel compressed video streams, such as ProRes 422. Keeping a close watch on the workstation performance monitors, at a certain point CPU and GPU usage will spike and frames will drop. This test will show the maximum number of streams that a single workstation can handle. Because this test is all about storage performance, keeping the number of streams per workstation to a healthy range takes individual workstation performance out of the equation.
I settled on 10x streams of ProRes 422 UHD video running at 30 frames per second per workstation. Each individual video stream was ~70 MBps (560mbps). Running ten of these streams meant each workstation was pulling around 700 MBps (though with Premiere Pro prefetching this number was closer to 800 MBps). With this number of video streams, the workstation wasn’t working too hard and it was well within what would fit down a 10 GbE network pipe.
Running some quick math here, 16 workstations each pulling 800-ish MBps works out to about 12.5 GBps of total throughput. This throughput is not enough throughput to overwhelm even a small 3-node F900 cluster. In order to stress the system, all 16 workstations were manually pointed to single 100 GbE port on a single F900 node. Due to the clustered nature of OneFS, the clients will get benefit from the entire cluster. But even with the rest of the cluster behind it, at a certain point, a single F900 node is going to get overwhelmed.
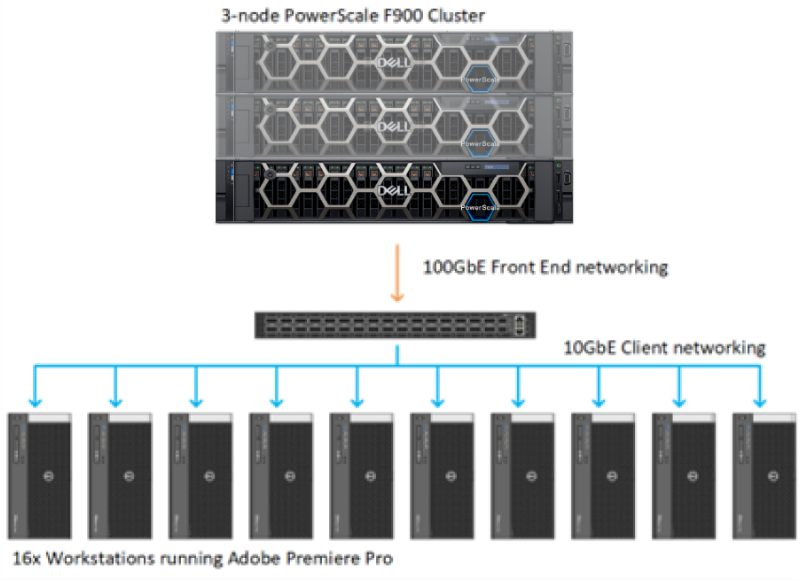
Figure 1. OneFS Lab configuration
Test methodology
The first step was to import test media for playback. Each workstation accessed its own unique set of 10x one-hour long UHD ProRes422 clips. Then a separate Premiere Pro project was created for each workstation with 10 simultaneous layers of video. The plan was to start playback one by one on each workstation and see where the tipping point was for that single PowerScale F900 node. The test was to be run first with OneFS 9.4 and then with OneFS 9.5.
Adobe Premiere Pro has a debug overlay called DogEars. In addition to showing dropped frames, DogEars provides some useful metrics about how “healthy” video playback is in Premiere Pro. Even before a system starts to drop frames, latency spikes and low prefetch buffers show when Premiere Pro is struggling to sustain playback.
The metrics in DogEars that I was focused on were the following:
Dropped frames: This metric is obvious, dropped frames are unacceptable. However, at times Premiere Pro will show single digit dropped frames at playback start.
FramePrefetchLatency: This metric only shows up during playback. The latency starts high while the prefetch frame buffer is filling. When that buffer gets up to slightly over 300 frames, the latency drops down to around 20 to 30 milliseconds. When the storage system was overwhelmed, this prefetch latency goes well above 30 milliseconds and stays there.
CompleteAheadOfPlay: This metric also only shows up during playback. The number of frames creeps up during playback and settles in at slightly over 300 prefetched frames. The FramePrefetchLatency above will be high (in the 100ms range or so) until the 300 frames are prefetched, at which point the latency will drop down to 30ms or lower. When the storage system is stressed, Premiere Pro is never able to fill this prefetch buffer, and it never gets up to the 300+ frames.

Figure 2. Premiere Pro with Dogears overlay
Test results
With the test environment configured and the individual projects loaded, it was time to see what the system could provide.
With the PowerScale cluster running OneFS 9.4, playback was initiated on each Adobe Premiere workstation. Keep in mind that all the workstations were artificially pointed to a single node in this 3-node F900 cluster. That single F900 node running OneFS 9.4 could handle 10x of the workstations, each playing back 10x UHD streams. That’s 100x streams of UHD ProRes 422 video from one node. Not too shabby.
At 110x streams (11 workstations), no frames were dropped, but the CompleteAheadOfPlay number on all the workstations started to go below 300. Also, the FramePreFetchLatency spiked to over 100 milliseconds. Clearly, the storage node was unable to provide more performance.
After reproducing these results several times to confirm accuracy, we unmounted the storage from each workstation and upgraded the F900 cluster to OneFS 9.5. Time to see how much of a difference the OneFS 9.5 performance boost would make for Premiere Pro.
As before, each workstation loaded a unique project with unique ProRes media. At 100x streams of video, playback chugged along fine. Time to load up additional streams and see where things break. 110, 120, 130, 140… playback from the single F900 node continued to chug along with no drops and acceptable latency. It was only at 150 streams of video that playback began to suffer. By this time, that single F900 node was pumping close to 10GBps out of that single 100 GbE NIC port. These 14x workstations were not entirely saturating the connection, but getting close. And the performance was a 40% bump from the OneFS 9.4 numbers. Impressive.
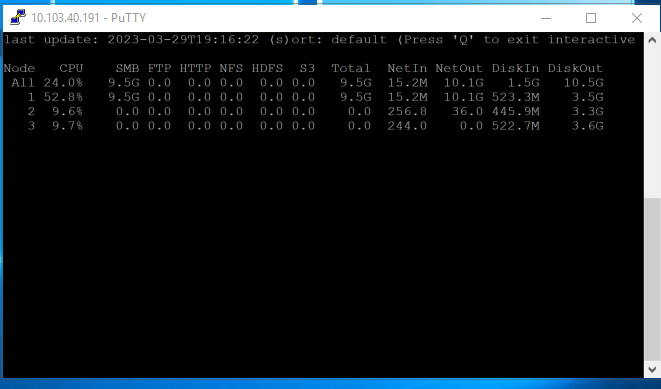
Figure 3. isi statistics output with 140 streams of video from a single node
These results exceeded my expectations going into the project. Getting a 40% performance boost with a code upgrade to existing hardware is impressive. This increase lined up with some of the benchmarking tools used by engineering. But performance from a benchmark tool vs. a real-world application are often two entirely different things. Benchmark tools are particularly inaccurate for video playback where small increases in latency can result in unacceptable results. Because Adobe Premiere is one of the most widely used applications with PowerScale storage, it made sense as a test platform to gauge these differences. For more information about PowerScale storage and media, check out https://Dell.to/media.
Click here to learn more about the author, Gregory Shiff