


Top benefits to using Intel Optane NVMe for cache drives in VxRail
Performance, endurance, and all without a price jump!
There is a saying that “A picture paints a thousand words” but let me add that a “graph can make for an awesome picture”.
Last August we at VxRail worked with ESG on a technical validation paper that included, among other things, the recent addition of Intel Optane NVMe drives for the vSAN caching layer. Figure 3 in this paper is a graph showing the results of a throughput benchmark workload (more on benchmarks later). When I do customer briefings and the question of vSAN caching performance comes up, this is my go-to whiteboard sketch because on its own it paints a very clear picture about the benefit of using Optane drives – and also because it is easy to draw.
In the public and private cloud, predictability of performance is important, doubly so for any form of latency. This is where caching comes into play, rather than having to wait on a busy system, we just leave it in the write cache inbox and get an acknowledgment. The inverse is also true. Like many parents I read almost the same bedtime stories to my young kids every night, you can be sure those books remain close to hand on my bedside “read cache” table. This write and read caching greatly helps in providing performance and consistent latency. With vSAN all-flash there no longer any read cache as the flash drives at the capacity layer provide enough random read access performance… just as my collection of bedtime story books has been replaced with a Kindle full of eBooks. Back to the write cache inbox where we’ve been dropping things off – at some point, this write cache needs to be empty, and this is where the Intel Optane NVMe drives shine. Drawing the comparison back to my kids, I no longer drive to a library to drop off books. With a flick of my finger I can return, or in cache terms de-stage, books from my Kindle back to the town library - the capacity drives if you will. This is a lot less disruptive to my day-to-day life, I don’t need to schedule it, I don’t need to stop what I’m doing, and with a bit of practice I’ve been able to do this mid story Let’s look at this in actual IT terms and business benefits.
To really show off how well the Optane drives shine, we want to stress the write cache as much as possible. This is where benchmarking tools and the right knowledge of how to apply them come into play. We had ESG design and run these benchmarking workloads for us. Now let’s be clear, this test is not reflective of a real-world workload but was designed purely to stress the write cache, in particular the de-staging from cache to capacity. The workload that created my go-to whiteboard sketch was the 100% sequential 64KB workload with a 1.2TB working set per node for 75 minutes.
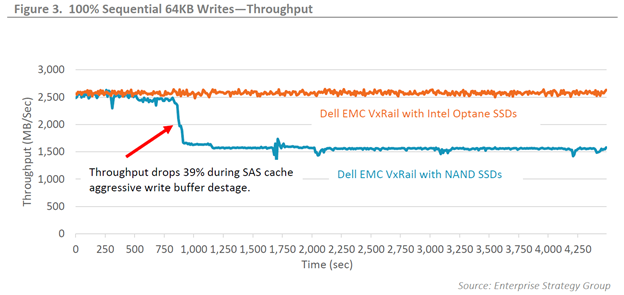
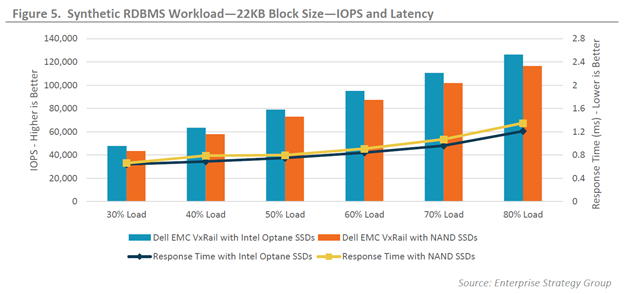
The graph clearly shows the benefit of the Optane drives, they keep on chugging at 2,500MB/sec of throughput the entire time without dropping a beat. What’s not to like about that! This is usually when the techie customer in the room will try to burst my bubble by pointing out the unrealistic workload that is in no way reflective of their environment, or most environments… which is true. A more real-world workload would be a simulated relational database workload with a 22KB block size, mixing random 8K and sequential 128K I/O, with 60% reads and 40% writes, and a 600GB per node working set, which is quite a mouthful and is shown in figure 5. The results there show a steady 8.4-8.8% increase in IOPS across the board and a slower rise in latency resulting in a 10.5% lower response time under 80% load.
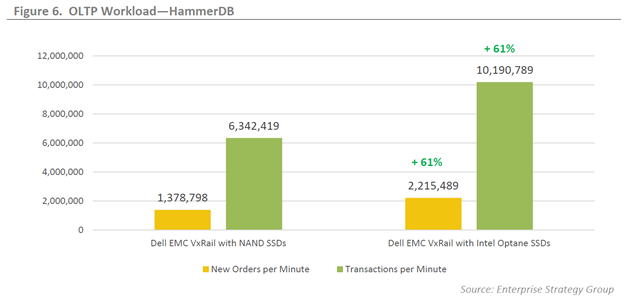
Those of you running OLTP workloads will appreciate the graph shown in figure 6 where HammerDB was used to emulate the database activity of a typical online brokerage firm. The Optane cache drives under that workload sustained a remarkable 61% more transactions per minute (TPM) and new orders per minute (NOPM). That can result in significant business improvement for an online brokerage firm who adopts Optane drives versus one who is using NAND SSDs.
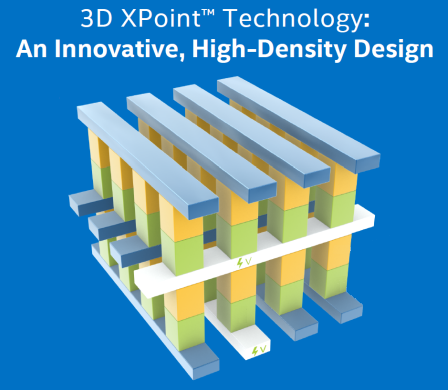
When it comes to write cache, performance is not everything, write endurance is also extremely important. The vSAN spec requires that cache drives be SSD Endurance Class C (3,650 TBW) or above, and Intel Optane beats this hands down with an over tenfold margin at 41 PBW (41,984 TBW). The Intel Optane 3D XPoint architecture allows memory cells to be individually addressed in a dense, transistor-less, stackable design. This extremely high write endurance capability has let us spec a smaller sized cache drive, which in turn lets us maintain a similar VxRail node price point, enabling you the customer to get more performance for your dollar.
What’s not to like? Typically, you get to pick any two; faster/better/cheaper. With Intel Optane drives in your VxRail you get all three; more performance and better endurance, at roughly the same cost. Wins all around!
Author: David Glynn, Sr Principal Engineer, VxRail Tech Marketing
Resources: Dell EMC VxRail with Intel Xeon Scalable Processors and Intel Optane SSDs
Related Blog Posts

I feel the need – the need for speed (and endurance): Intel Optane edition
Wed, 13 Oct 2021 17:37:52 -0000
|Read Time: 0 minutes
It has only been three short months since we launched VxRail on 15th Generation PowerEdge, but we're already expanding the selection of configuration offerings. So far we've added 18 additional processors to power your workloads, including some high frequency and low core count options. This is delightful news for those with applications that are licensed per core, an additional NVIDIA GPU - the A30, a slew of additional drives, and doubled the RAM capacity to 8TB. I've probably missed something, as it can be hard to keep up with the all the innovations taking place within this race car that is VxRail!
In my last blog, I hinted at one of those drive additions, faster cache drives. Today I'm excited to announce that you can now order, and turbo charge your VxRail with the 400GB or 800GB Intel P5800X – Intel’s second generation Optane NVMe drive. Before we delve into some of the performance numbers, let’s discuss what it is about the Optane drives that makes them so special. More specifically, what is it about them that enables them to deliver so much more performance, in addition to significantly higher endurance rates.
 To grossly over-simplify it, and my apologies in advance to the Intel engineers who poured their lives into this, when writing to NAND flash an erase cycle needs to be performed before a write can be made. These erase cycles are time-consuming operations and the main reason why random write IO capabilities on NAND flash is often a fraction of the read capability. Additionally, a garbage collection is running continuously in the background to ensure that there is space available to incoming writes. Optane, on the other hand, does bit-level write in place operations, therefore it doesn’t require an erase cycle, garbage collection, or performance penalty writes. Hence, random write IO capability almost matches the random read IO capability. So just how much better is endurance with this new Optane drive? Endurance can be measured in Drive Writes Per Day (DWPD), which measures how many times the drive's entire size could be overwritten each day of its warranty life. For the 1.6TB NVMe P5600 this is 3 DWPD, or 55 MB per second, every second for five years – just shy of 9PB of writes, not bad. However, the 800GB Optane P5800X will endure 146PB over its five-year warranty life, or almost 1 GB per second (926 MB/s) every second for its five year 100 DWPD warranty life. Not quite indestructible, but that is a lot of writes, so much so you don’t need extra capacity for wear leveling and a smaller capacity drive will suffice.
You might wonder why you should care about endurance, as Dell EMC will replace the drive under warranty anyway – there are three reasons. When a cache drive fails, its diskgroup is taken offline, so not only have you lost performance and capacity, your environment is taking on the additional burden of a rebuild operation to re-protect your data. Secondly, more and more systems are being deployed outside of the core data center. Replacing a drive in your data center is straightforward, and you might even have spares onsite, but what about outside of your core datacenter? What is your plan for replacing a drive at a remote office, or a thousand miles away? What if that remote location is not an office but an oilrig one hundred miles offshore, or a cruise ship halfway around the world where the cost of getting a replacement drive there is not trivial? In these remote locations, onsite spares are commonplace, but the exceptions are what lead me to the third reason, Murphy's Law. IT and IT staffing might be an afterthought at these remote locations. Getting a failed drive swapped out at a remote location which lacks true IT staffing may not get the priority it deserves, and then there is that ever present risk of user error... “Oh, you meant the other drive?!? Sorry...”
Cache in its many forms plays an important role in the datacenter. Cache enables switches and storage to deliver higher levels of performance. On VxRail, our cache drives fall into two categories, SAS and NVMe, with NVMe delivering up to 35% higher IOPS and 14% lower latency. Among our NVMe cache drive we have two from Intel, the 1.6TB P5600 and the Optane P5800X, in 400GB and 800GB capacities. The links for each will bring you to the drive specification including performance details. But how does the performance at a drive level impact performance at the solution level? Because, at the end of the day that is what your application consumes at the solution level, after cache mirroring, network hops, and the vSAN stack. Intel is a great partner to work with, when we checked with them about publishing solution level performance data comparing the two drives side-by-side, they were all for it.
In my over-simplified explanation above, I described how the write cycle for Optane drives is significantly different as an erase operation and does not need to be done first. So how does that play out in a full solution stack? Figure 1 compares a four node VxRail P670F cluster, running a 100% sequential write 64KB workload. Not a test that reflects any real-world workload, but one that really stresses the vSAN cache layer, highlights the consistent write performance that 3D XPoint technology delivers, and shows how Optane is able to de-stage cache when it fills up without compromising performance.
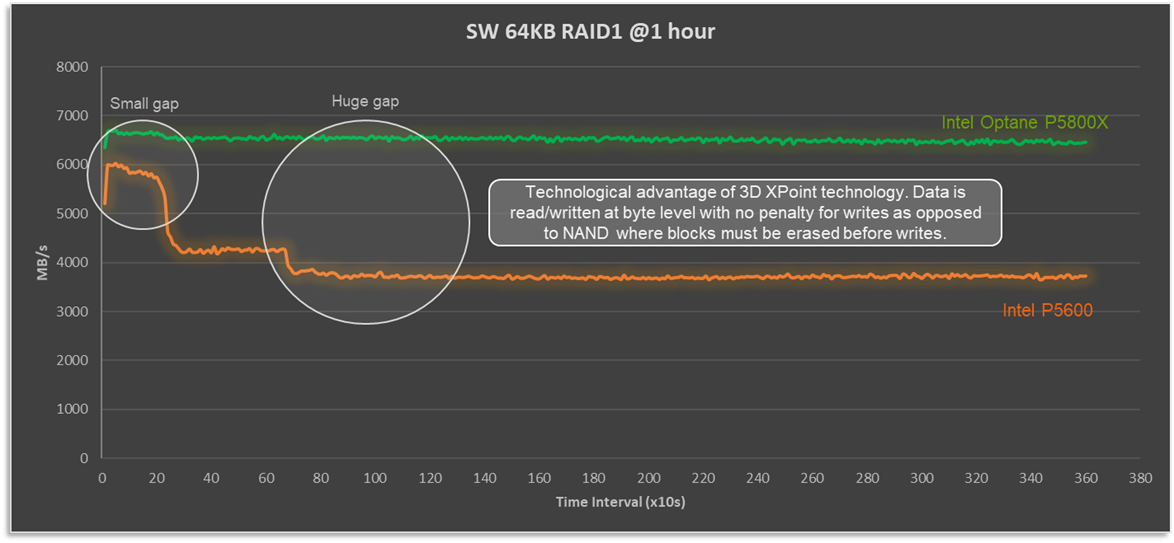
Figure 1: Optane cache drives deliver consistent and predictable write performance
When we look at performance, there are two numbers to keep in mind: IOPS and latency. The target is to have high IOPS with low and predictable latency, at a real-world IO size and read:write ratio. To that end, let’s look at how VxRail performance differs with the P5600 and P5800X under OLTP32K (70R30W) and RDBMS (60R40W) benchmark workload, as shown in Figure 2.
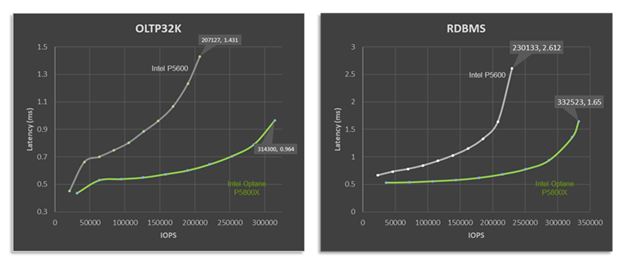
Figure 2: Optane cache drives deliver higher performance and lower latency across a variety of workload types.
It doesn't take an expert to see that with the P5800X this four node VxRail P670F cluster's peak performance is significantly higher than when it is equipped with the P5600 as a cache drive. For RDBMS workloads up to 44% higher IOPS with a 37% reduction in latency. But peak performance isn't everything. Many workloads, particularly databases, place a higher importance on latency requirements. What if our workload, database or otherwise, requires 1ms response times? Maybe this is the Service Level Agreement (SLA) that the infrastructure team has with the application team. In such a situation, based on the data shown, and for a OLTP 70:30 workload with a 32K block size, the VxRail cluster would deliver over twice the performance at the same latency SLA, going from 147,746 to 314,300 IOPS.
In the datacenter, as in life, we are often faced with "Good, fast, or cheap. Choose two." When you compare the price tag of the P5600 and P5800X side by side, the Optane drive has a significant premium for its good and fast. However, keep in mind that you are not buying an individual drive, you are buying a full stack solution of several pieces of hardware and software, where the cost of the premium pales in comparison to the increased endurance and performance. Whether you are looking to turbo charge your VxRail like a racecar, or make it as robust as a tank, Intel Optane SSD drives will get you both.
Author Information
David Glynn, Technical Marketing Engineer, VxRail at Dell Technologies
Twitter: @d_glynn
LinkedIn: David Glynn
Additional Resources
Intel SSD D7P5600 Series 1.6TB 2.5in PCIe 4.0 x4 3D3 TLC Product Specifications
Intel Optane SSD DC P5800X Series 800GB 2.5in PCIe x4 3D XPoint Product Specifications

100 GbE Networking – Harness the Performance of vSAN Express Storage Architecture
Wed, 05 Apr 2023 12:48:50 -0000
|Read Time: 0 minutes
For a few years, 25GbE networking has been the mainstay of rack networking, with 100 GbE reserved for uplinks to spine or aggregation switches. 25 GbE provides a significant leap in bandwidth over 10 GbE, and today carries no outstanding price premium over 10 GbE, making it a clear winner for new buildouts. But should we still be continuing with this winning 25 GbE strategy? Is it time to look to a future of 100 GbE networking within the rack? Or is that future now?
This question stems from my last blog post: VxRail with vSAN Express Storage Architecture (ESA) where I called out VMware’s 100 GbE recommended for maximum performance. But just how much more performance can vSAN ESA deliver with 100GbE networking? VxRail is fortunate to have its performance team, who stood up two identical six-node VxRail with vSAN ESA clusters, except for the networking. One was configured with Broadcom 57514 25 GbE networking, and the other with Broadcom 57508 100 GbE networking. For more VxRail white papers, guides, and blog posts visit VxRail Info Hub.
When it comes to benchmark tests, there is a large variety to choose from. Some benchmark tests are ideal for generating headline hero numbers for marketing purposes – think quarter-mile drag racing. Others are good for helping with diagnosing issues. Finally, there are benchmark tests that are reflective of real-world workloads. OLTP32K is a popular one, reflective of online transaction processing with a 70/30 read-write split and a 32k block size, and according to the aggregated results from thousands of Live Optics workload observations across millions of servers.
One more thing before we get to the results of the VxRail Performance Team's testing. The environment configuration. We used a storage policy of erasure coding with a failure tolerance of two and compression enabled.
When VMware announced vSAN with Express Storage Architecture they published a series of blogs all of which I encourage you to read. But as part of our 25 GbE vs 100 GbE testing, we also wanted to verify the astounding claims of RAID-5/6 with the Performance of RAID-1 using the vSAN Express Storage Architecture and vSAN 8 Compression - Express Storage Architecture. In short, forget the normal rules of storage performance, VMware threw that book out of the window. We didn’t throw our copy out of the window, well not at first, but once our results validated their claims… it went out.
Let’s look at the data: Boom!
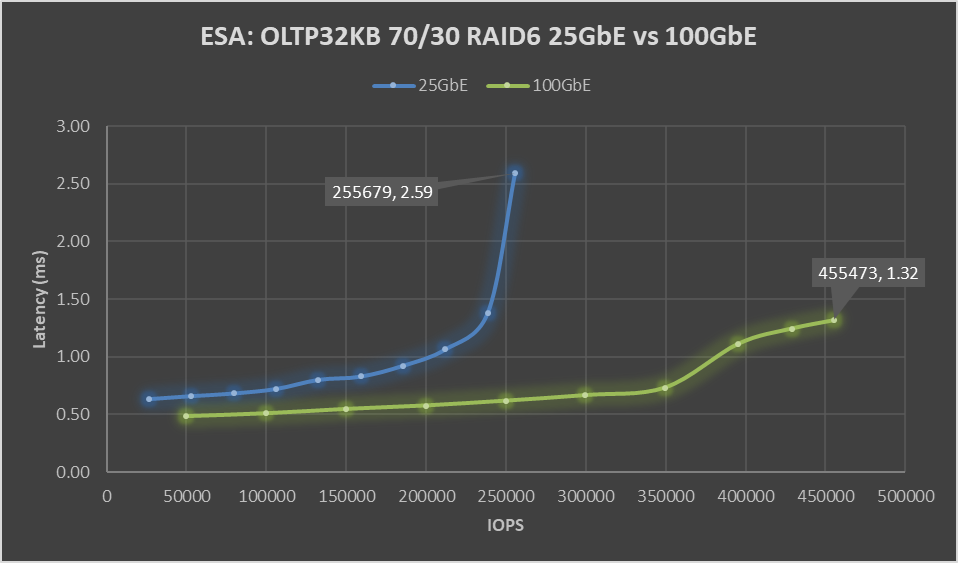
Figure 1. ESA: OLTP32KB 70/30 RAID6 25 GbE vs 100 GbE performance graph
Boom! A 78% increase in peak IOPS with a substantial 49% drop in latency. This is a HUGE increase in performance, and the sole difference is the use of the Broadcom 57508 100 GbE networking. Also, check out that latency ramp-up on the 25 GbE line, it’s just like hitting a wall. While it is almost flat on the 100 GbE line.
But nobody runs constantly at 100%, at least they shouldn’t be. 60 to 70% of absolute max is typically a normal day-to-day comfortable peak workload, leaving some headroom for spikes or node maintenance. At that range, there is an 88% increase in IOPS with a 19 to 21% drop in latency, with a smaller drop in latency attributable to the 25 GbE configuration not hitting a wall. As much as applications like high performance, it is needed to deliver performance with consistent and predictable latency, and if it is low all the better. If we focus on just latency, the 100 GbE networking enabled 350K IOPS to be delivered at 0.73 ms, while the 25 GbE networking can squeak out 106K IOPS at 0.72 ms. That may not be the fairest of comparisons, but it does highlight how much 100GbE networking can benefit latency-sensitive workloads.
Boom, again! This benchmark is not reflective of real-world workloads but is a diagnostic test that stresses the network with its 100% read-and-write workloads. Can this find the bottleneck that 25 GbE hit in the previous benchmark?
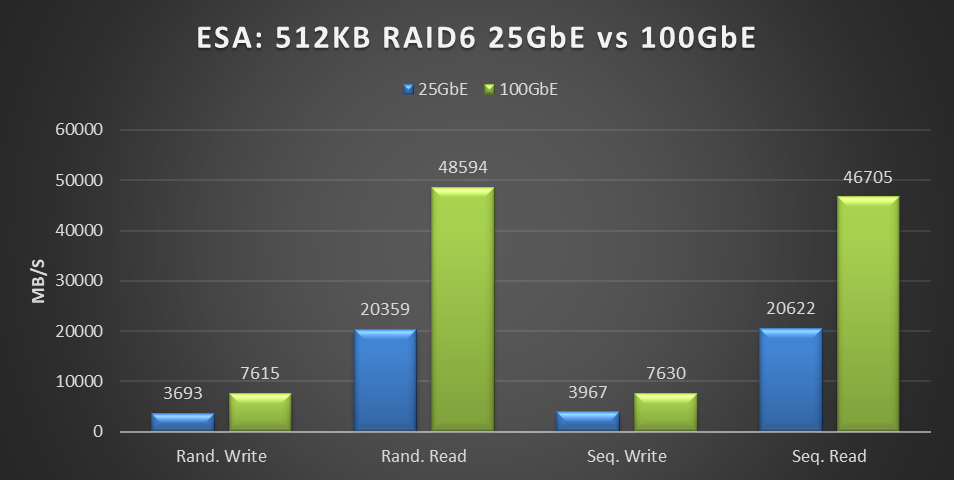
Figure 2. ESA: 512KB RAID6 25 GbE vs 100 GbE performance graph
This testing was performed on a six-node cluster, with each node contributing one-sixth of the throughput shown in this graph. 20359MB/s of random read throughput for the 25 GbE cluster or 3393 MB/s per node. Which is slightly above the theoretical max throughput of 3125 MB/s that 25 GbE can deliver. This is the absolute maximum that 25 GbE can deliver! In the world of HCI, the virtual machine workload is co-resident with the storage. As a result, some of the IO is local to the workload, resulting in higher than theoretical throughput. For comparison, the 100 GbE cluster achieved 48,594 MB/s of random read throughput, or 8,099 MB/s per node out of a theoretical maximum of 12,500 MB/s.
But this is just the first release of the Express Storage Architecture. In the past, VMware has added significant gains to vSAN, as seen in the lab-based performance analysis of Harnessing the Performance of Dell EMC VxRail 7.0.100. We can only speculate on what else they have in store to improve upon this initial release.
What about costs, you ask? Street pricing can vary greatly depending on the region, so it's best to reach out to your Dell account team for local pricing information. Using US list pricing as of March 2023, I got the following:
Component | Dell PN | List price | Per port | 25GbE | 100GbE |
Broadcom 57414 dual 25 Gb | 540-BBUJ | $769 | $385 | $385 |
|
S5248F-ON 48 port 25 GbE | 210-APEX | $59,216 | $1,234 | $1,234 |
|
25 GbE Passive Copper DAC | 470-BBCX | $125 | $125 | $125 |
|
Broadcom 57508 dual 100Gb | 540-BDEF | $2,484 | $1,242 |
| $1,242 |
S5232F-ON 32 port 100 GbE | 210-APHK | $62,475 | $1,952 |
| $1,952 |
100 GbE Passive Copper DAC | 470-ABOX | $360 | $360 |
| $360 |
Total per port |
|
|
| $1,743 | $3,554 |
Overall, the per-port cost of the 100 GbE equipment was 2.04 times that of the 25 GbE equipment. However, this doubling of network cost provides four times the bandwidth, a 78% increase in storage performance, and a 49% reduction in latency.
If your workload is IOPS-bound or latency-sensitive and you had planned to address this issue by adding more VxRail nodes, consider this a wakeup call. Adding dual 100Gb came at a total list cost of $42,648 for the twelve ports used. This cost is significantly less than the list price of a single VxRail node and a fraction of the list cost of adding enough VxRail nodes to achieve the same level of performance increase.
Reach out to your networking team; they would be delighted to help deploy the 100 Gb switches your savings funded. If decision-makers need further encouragement, send them this link to the white paper on this same topic Dell VxRail Performance Analysis (similar content, just more formal), and this link to VMware's vSAN 8 Total Cost of Ownership white paper.
While 25 GbE has its place in the datacenter, when it comes to deploying vSAN Express Storage Architecture, it's clear that we're moving beyond it and onto 100 GbE. The future is now 100 GbE, and we thank Broadcom for joining us on this journey.