


Can AI Shape Cellular Network Operations?
Mobile network operators (MNOs) are in the process of overlaying their conventional macro cellular networks with shorter-range cells such as outdoor pico-cells. This substantially increases network complexity, which makes OPEX planning and management challenging. Artificial intelligence (AI) offers the potential for MNOs to operate their networks in a more cost-efficient manner. Even though AI deployment has its challenges, most agree such deployment will ease emerging network, model, and algorithm complexity.
Advancements in error coding and communication design have resulted in the performance of the point-to-point link being close to the Shannon limit. This has proven to be effective for designing the fourth generation (4G) long-term evolution (LTE)-Advanced air interface, which has multiple parallel point-to-point links. However, 5G air interfaces are more complicated due to their complex network topology and coordination schemes, and vastly diverse end-user applications. Deriving any performance optimum is computationally infeasible. AI, however, can tame the network complexity by providing competitive performances.
Cellular networks have been designed with the goal of approximating end-to-end system behavior using simple modeling approaches that are amenable to clean mathematical analysis. For example, practical systems use digital pre-distortion to linearize the end-to-end model, for which information theory provides a simple closed-form capacity expression. However, with non-linearities in the wireless channel (e.g., mm-Wave) or device components (e.g., power amplifier), it’s difficult to analytically model such behaviors.
In contrast, AI-based detection strategies can easily model such non-linearities. There are examples in cellular networks where the optimal algorithms are well characterized but complex to implement in practice. For example, for a point-to-point multiple-input-multiple-output (MIMO) link operating with an M-ary quadrature amplitude modulation (QAM) constellation and K spatial streams or reconstruction in compressive spectrum sensing, optimum solutions are extremely complex. In practice, most MIMO systems employ linear receivers, e.g., linear minimum mean squared error (MMSE) receivers, which are known to be sub-optimal yet are easy to implement. AI can offer an attractive performance–complexity trade-off. For example, a deep-learning-based MIMO receiver can provide better performance than linear receivers in a variety of scenarios, while retaining low complexity.
Deep learning can be used for devising computationally efficient approaches for physical (PHY) layer communication receivers. Supervised learning can be used for MIMO symbol detection and channel decoding, fetching potentially superior performance; recurrent neural network (RNN)-based detection can be used for MIMO orthogonal frequency division multiplexing (OFDM) systems; convolutional neural network (CNN)-based supervised learning techniques can deliver channel estimation; unsupervised learning approaches can be used for automatic fault detection and root cause analysis leveraging self-organizing maps; deep reinforced learning (DRL) can be used for designing spectrum access, scheduling radio resources, and cell-sectorization. An AI-managed edge or data center can consider diverse network parameters and KPIs for optimizing on-off operation of servers while ensuring uninterrupted services for the clients. Leveraging historical data collected by data center servers, it’s possible to learn emerging service-usage patterns.
Standards bodies like the Third Generation Partnership Project (3GPP) have defined Network Data Analytics Function (NWDAF) specifications for data collection and analytics in automated cellular networks (3GPP TR 23.791 specification). By leaving AI model development to implementation, 3GPP provides adequate flexibility for network vendors to deploy AI-enabled use cases. The inbound interfaces ingest data from various sources such as operation, administration, and maintenance (OAM), network function (NF), application function (AF), and data repositories; the outbound interfaces relay the algorithmic decisions to the NF and AF blocks, respectively.
In addition to 3GPP, MNOs (AT&T, China Mobile, Deutsche Telekom, NTT DOCOMO, and Orange) established the O-RAN Alliance (https://www.o-ran.org/) with the intent to automate network functions and reduce operating expenses. The O-RAN architecture, which is shown in the following figure, includes an AI-enabled RAN intelligent controller (RIC) for both non-real time (non-RT) and near-real time (near-RT), multi-radio access technology protocol stacks.
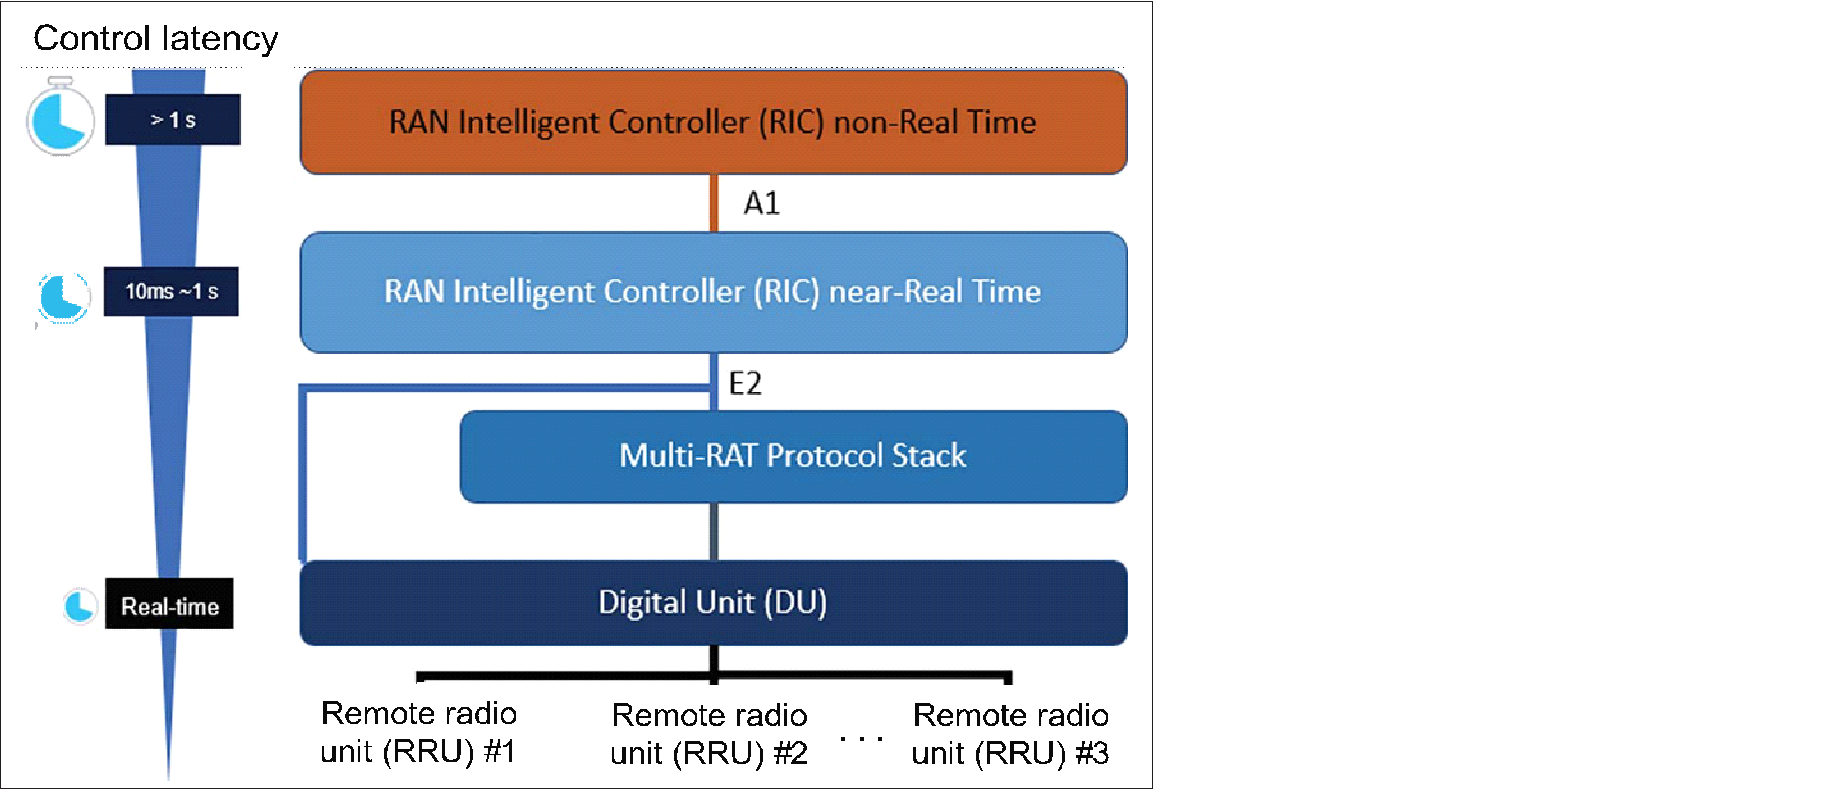
Figure: O-RAN Architecture (source: O-RAN Alliance)
The non-RT functions include service and policy management, higher-layer procedure optimization, and model training for the near-RT RAN functionality. The near-RT RIC is compatible with legacy radio resource management and enhances challenging operational functions such as seamless handover control, Quality of Service (QoS) management, and connectivity management with AI. The O-RAN alliance has set up two work groups standardizing the A1 interface (between non-RT RIC and near-RT RIC) and E2 interface (between near-RT RIC and digital unit [DU] stack).
Even though AI shows great promise for cellular networks, significant challenges remain:
- From a PHY and MAC layer perspective, training a cellular AI model using over-the-air feedback to update layer weights based on the back-propagation algorithm is expensive in terms of uplink control overhead.
- Separation of information across network protocol layers make it difficult to obtain labeled training data. For example, training an AI model residing within a base-station scheduler might be challenging if it requires access to application layer information.
- It is important for cellular networks to be able to predict the worst-case behavior. This isn’t always easy for non-linear AI building blocks.
- Cellular networks and wireless standards have been designed based on theoretical analysis, channel measurements, and human intuition. This approach allows domain experts to run computer simulations to validate communication system building blocks. AI tools remain black boxes. It is still challenging to develop analytical models to test correctness and explain behaviors in a simple manner.
- If a communication task is performed using an AI model, it is often unclear whether the dataset used for training the model is general enough to capture the distribution of inputs as encountered in reality. For example, if a neural network-based symbol detector is trained under one modulation and coding scheme (MCS), it is unclear how the system would perform for a different MCS level. This is important because if the MCS is changing adaptively due to mobility and channel fading, there has to be a way of predicting system behavior.
- Interoperability is crucial in today’s software defined everything (SDE). Inconsistency among AI-based modules from different vendors can potentially deteriorate overall network performance. For example, some actions (e.g., setting handover threshold) taken by an AI-based module from one vendor could counteract the actions taken by another network module (which may or may not be AI-based) from a second vendor. This could lead to unwanted handover occurrences between the original BS and the neighboring BS, causing increased signaling overhead.
In summary, MNOs agree that:
- Training needs to be distributed as more complex scenarios arise.
- More tools explaining AI decision making are essential.
- More tools are needed to compare AI model output to theoretical performance bounds.
- AI models need to adapt based on surrounding contextual information.
- AI deployment should first focus on wider timescale models until a point is reached when model decision making is indistinguishable from experts.
- Fail-safe wrappers around models should limit impact of cascading errors.
AI can revitalize wireless communications. There are challenges to overcome, but, done right, there is opportunity to deliver massive-scale autonomics in cellular networks that support ultra-reliable low-latency communications, enhanced mobile broadband, and massive machine-to-machine communications.
Related Blog Posts

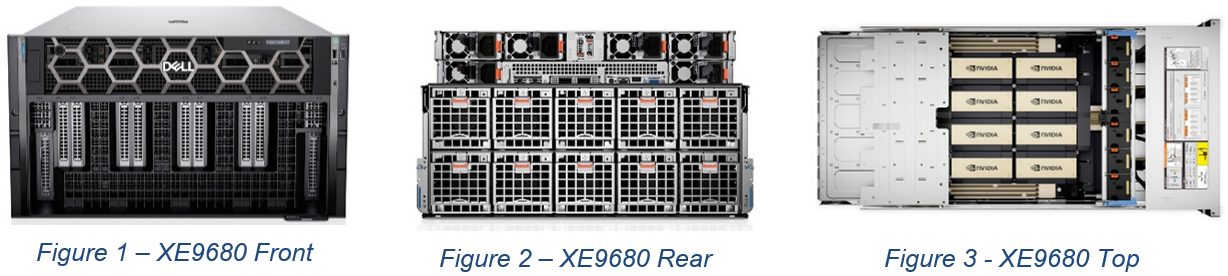
How Dell PowerEdge XE9680 Accelerates AI and High Performance Computing
Tue, 11 Apr 2023 21:37:45 -0000
|Read Time: 0 minutes
The Dell PowerEdge XE9680 is a high-performance server designed to deliver exceptional performance for machine learning workloads, AI inferencing, and high-performance computing. In this short blog, we summarize three articles that showcase the capabilities of the Dell PowerEdge XE9680 in different computing scenarios.
Unlocking Machine Learning with Dell PowerEdge XE9680
The first article, which I co-wrote with Liz Raymond, Naye Yoni, and Frank Han, describes how Dell PowerEdge XE9680 can unlock machine learning performance by delivering high-speed processing and efficient training of machine learning models. Based on our testing, we concluded that Dell PowerEdge XE9680 can help organizations unlock the full potential of their machine learning workloads:
Unlocking Machine Learning with Dell PowerEdge XE9680: Insights into MLPerf 2.1 Training Performance
Accelerating AI Inferencing with Dell PowerEdge XE9680
The second article, also co-written with Liz Raymond, Naye Yoni, and Frank Han, focuses on how the Dell PowerEdge XE9680 can accelerate AI inferencing using various models to make predictions or decisions. Our testing found that the Dell PowerEdge XE9680 can help organizations achieve faster and more accurate AI inferencing:
Accelerating AI Inferencing with Dell PowerEdge XE9680: A Performance Analysis
Accelerating High Performance Computing with Dell PowerEdge XE9680
The third article, co-written with Frank Han, showcases how Dell PowerEdge XE9680 can accelerate high-performance computing (HPC) by leveraging parallel processing techniques to solve complex problems. It focuses on the system's impressive performance in the HPL benchmark, which measures HPC performance. We concluded that the Dell PowerEdge XE9680 can help organizations achieve faster and more efficient HPC performance, enabling them to solve complex problems in less time:
Accelerating High-Performance Computing with Dell PowerEdge XE9680: A Look at HPL Performance
Author: Delmar Hernandez, Server Technologist

Overview of MLPerf™ Inference v2.0 Results on Dell Servers
Fri, 09 Sep 2022 15:15:36 -0000
|Read Time: 0 minutes
Dell Technologies has been an active participant in the MLCommons™ Inference benchmark submission since day one. We have completed five rounds of inference submission.
This blog provides an overview of the latest results of MLPerf Inference v2.0 closed data center, closed data center power, closed edge, and closed edge power categories on Dell servers from our HPC & AI Innovation Lab. It shows optimal inference and power (performance per watt) performance for Dell GPU-based servers (DSS 8440, PowerEdge R750xa, PowerEdge XE2420, PowerEdge XE8545, and PowerEdge XR12). The previous blog about MLPerf Inference v1.1 performance results can be found here.
What is new?
- There were 3,800 performance results for this round compared to 1,800 performance results for v1.1. Additionally, 885 systems in v2.0 compared to 424 systems in v1.1 shows that there were more than twice the systems submitted for this round.
- For the 3D U-Net benchmark, the dataset now used is the KiTs 2019 Kidney Tumor Segmentation set.
- Early stopping was introduced in this round to replace a deterministic minimum query count with a function that dynamically determines when further runs are not required to identify additional performance gain.
Results at a glance
Dell Technologies submitted 167 results to the various categories. The Dell team made 86 submissions to the closed data center category, 28 submissions to the closed data center power category, and 53 submissions to the closed edge category. For the closed data center category, the Dell team submitted the second most results. In fact, Dell Technologies submitted results from 17 different system configurations with the NVIDIA TensorRT and NVIDIA Triton inference engines. Among these 17 configurations, the PowerEdge XE2420 server with T4 and A30 GPUs and the PowerEdge XR12 server with the A2 GPU were two new systems that have not been submitted before. Additionally, Dell Technologies submitted to the reintroduced Multiterm scenario. Only Dell Technologies submitted results for different host operating systems.
Noteworthy results
Noteworthy results include:
- The PowerEdge XE8545 and R750xa servers yield Number One results for performance per accelerator with NVIDIA A100 GPUs. The use cases for this top classification include Image Classification, Object Detection, Speech-to-text, Medical Imaging, Natural Language Processing, and Recommendation.
- The DSS 8440 server yields Number Two results for system performance for multiple benchmarks including Speech-to-text, Object Detection, Natural Language Processing, and Medical Image Segmentati on uses cases among all submissions.
- The PowerEdge R750xa server yields Number One results for the highest system performance for multiple benchmarks including Image Classification, Object Detection, Speech-to-text, Natural Language Processing, and Recommendation use cases among all the PCIe-based GPU servers.
- The PowerEdge XE8545 server yields Number One results for the lowest multistrand latency with NVIDIA Multi-Instance GPU (MIG) in the edge category for the Image Classification and Object Detection use cases.
- The PowerEdge XE2420 server yields Number One results for the highest T4 GPU inference results for the Image Classification, Speech-to-text, and Recommendation use cases.
- The PowerEdge XR12 server yields Number One results for the highest performance per watt with NVIDIA A2 GPU results in power for the Image Classification, Object Detection, Speech-to-text, Natural Language Processing, and Recommendation use cases.
MLPerf Inference v2.0 benchmark results
The following graphs highlight the performance metrics for the Server and Offline scenarios across the various benchmarks from MLCommons. Dell Technologies presents results as an method for our customers to identify options to suit their deep learning application demands. Additionally, this performance data serves as a reference point to enable sizing of deep learning clusters. Dell Technologies strives to submit as many results as possible to offer answers to ensure that customer questions are resolved.
For the Server scenario, the performance metric is queries per second (QPS). For the Offline scenario, the performance metric is Offline samples per second. In general, the metrics represent throughput, and a higher throughput indicates a better result. In the following graphs, the Y axis is an exponentially scaled axis representing throughput and the X axis represents the systems under test (SUTs) and their corresponding models. The SUTs are described in the appendix.
Figure 1 through Figure 6 show the per card performance of the various SUTs on the ResNet 50, BERT, SSD, 3dUnet, RNNT, and DLRM modes respectively in the Server and Offline scenarios:
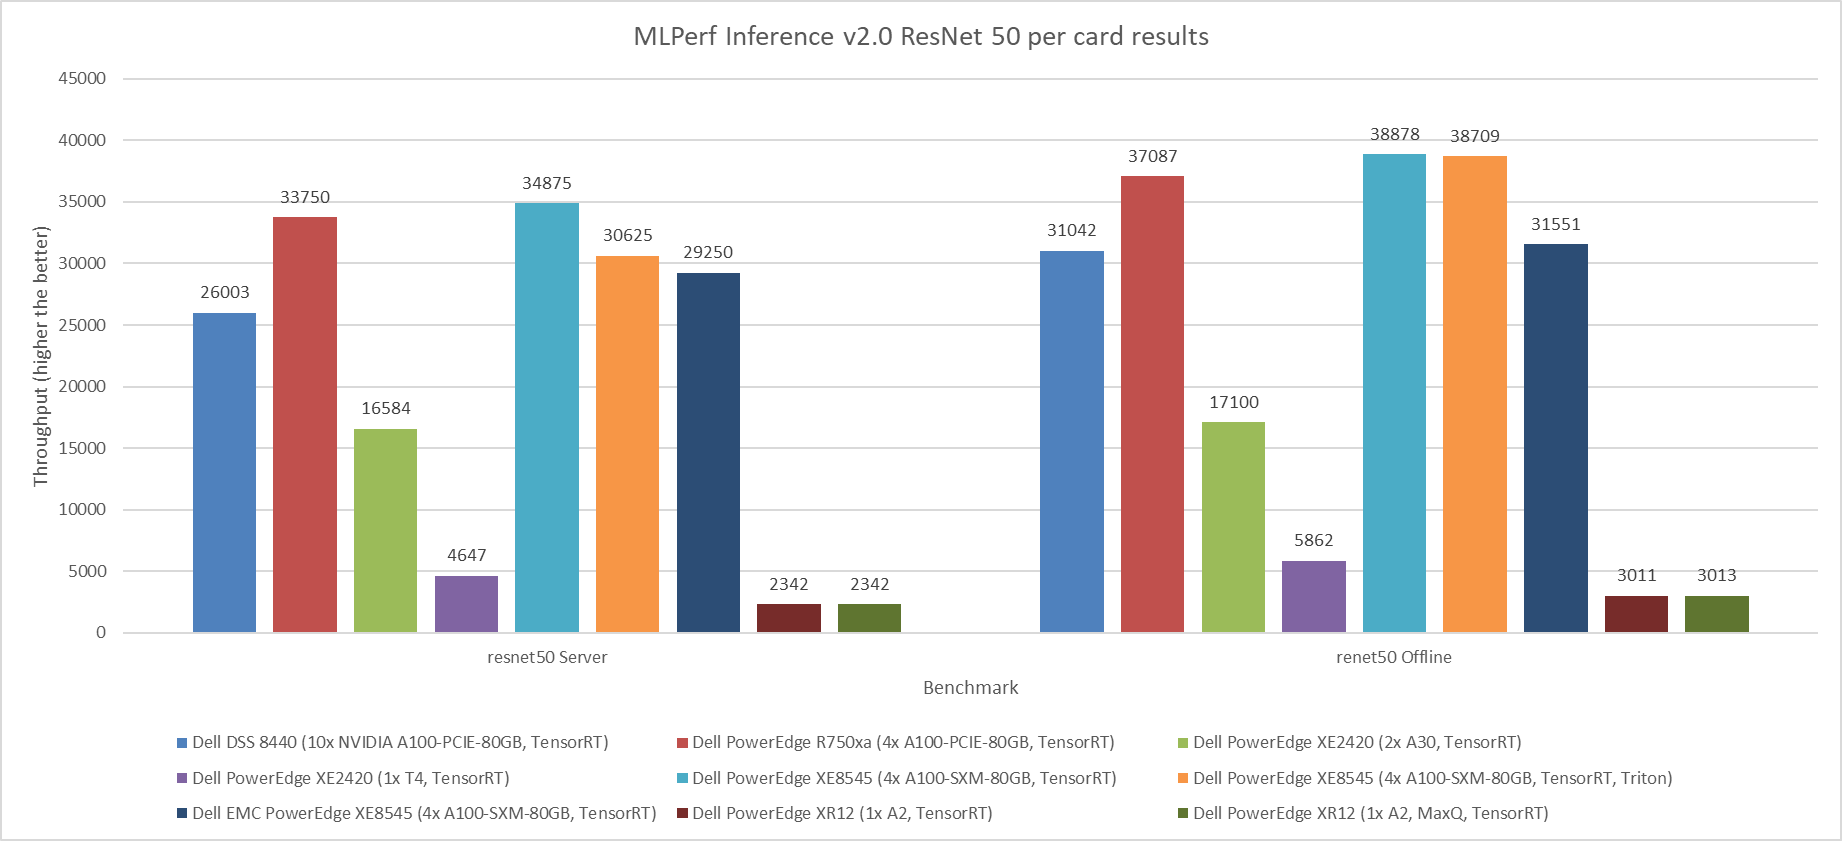
Figure 1: MLPerf Inference v2.0 ResNet 50 per card results
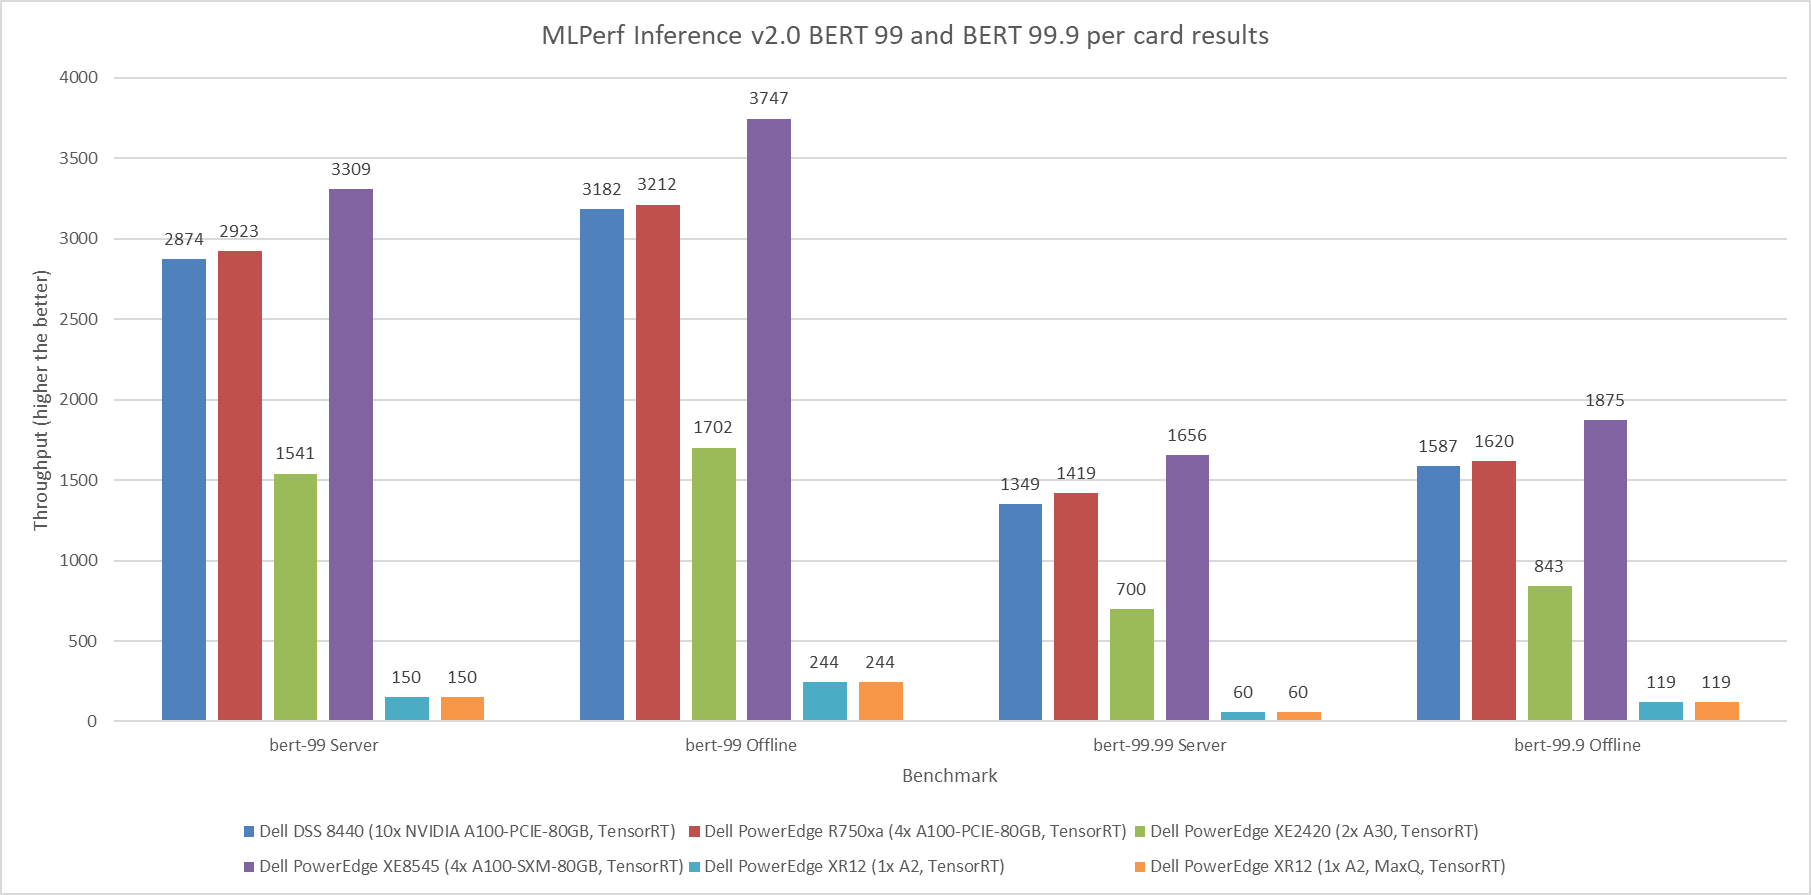
Figure 2: MLPerf Inference v2.0 BERT default and high accuracy per card results
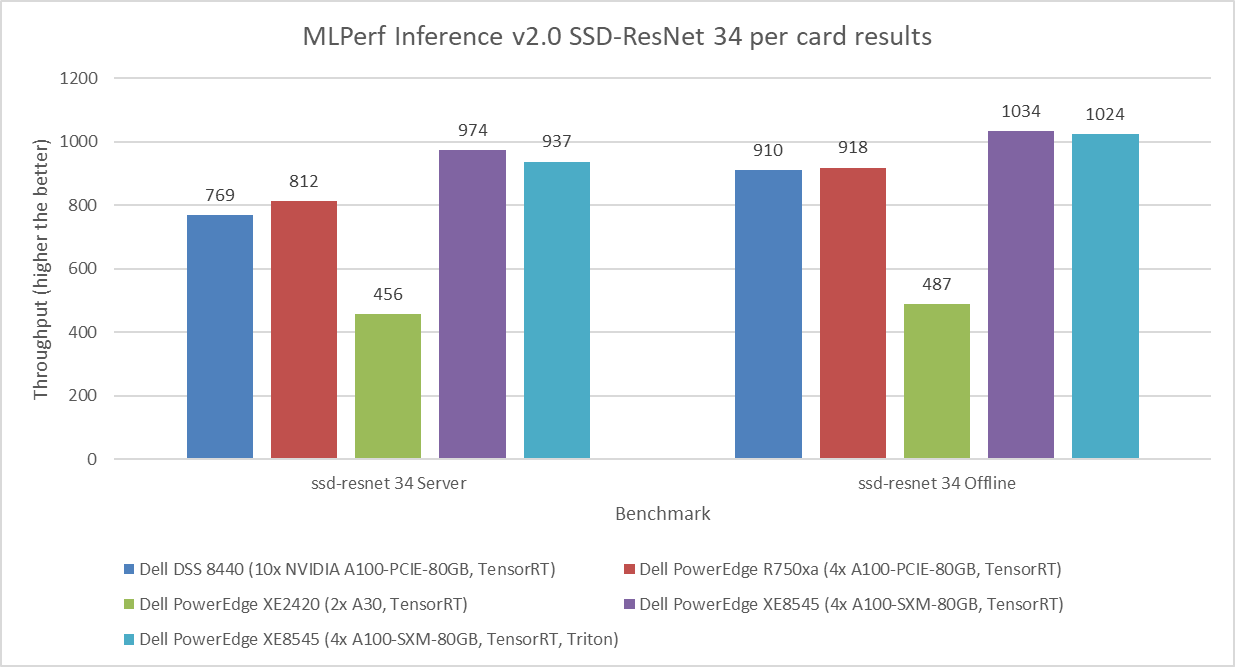
Figure 3: MLPerf Inference v2.0 SSD-ResNet 34 per card results
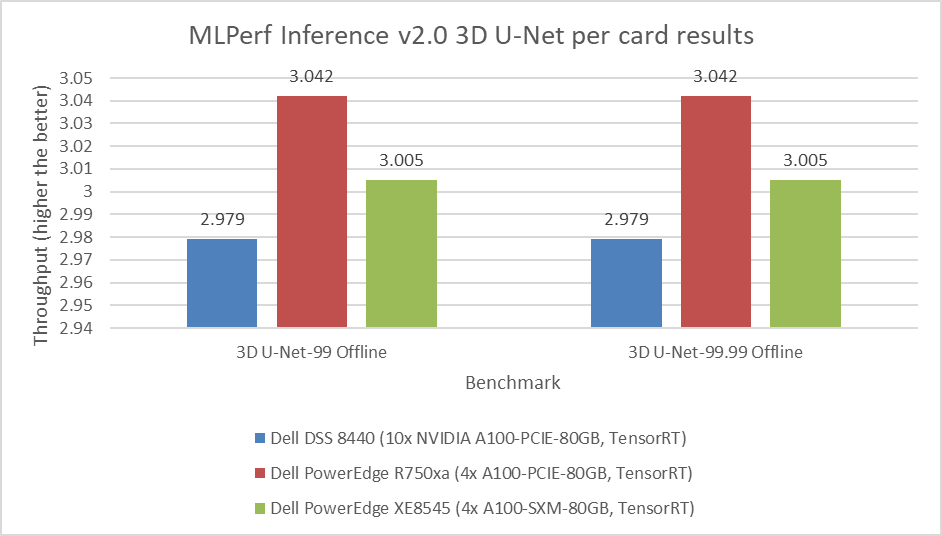
Figure 4: MLPerf Inference v2.0 3D U-Net per card results
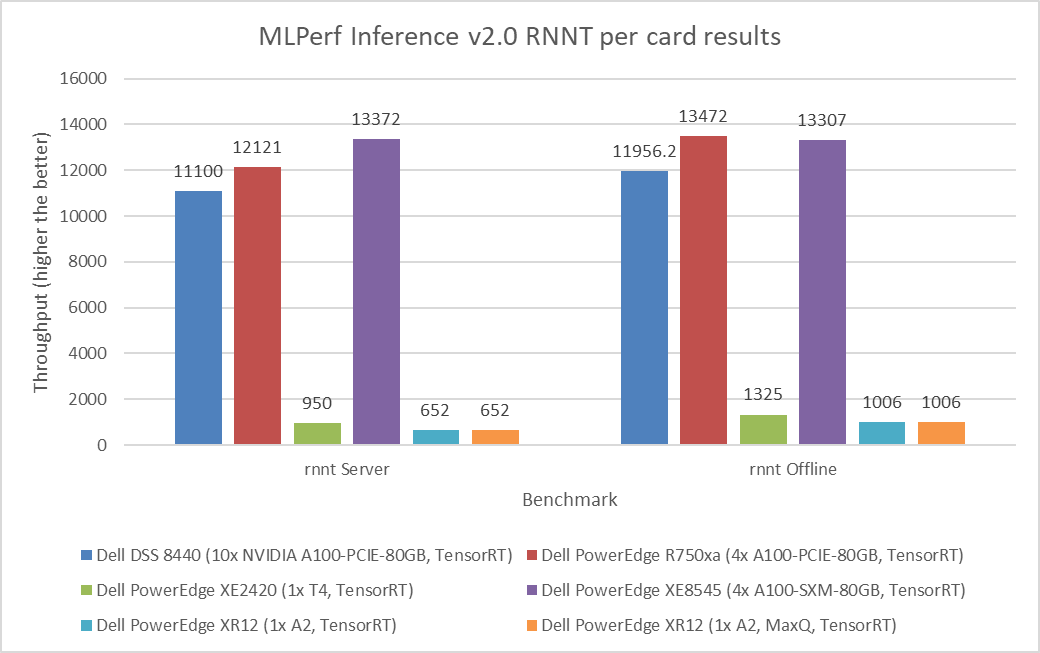
Figure 5: MLPerf Inference v2.0 RNNT per card results
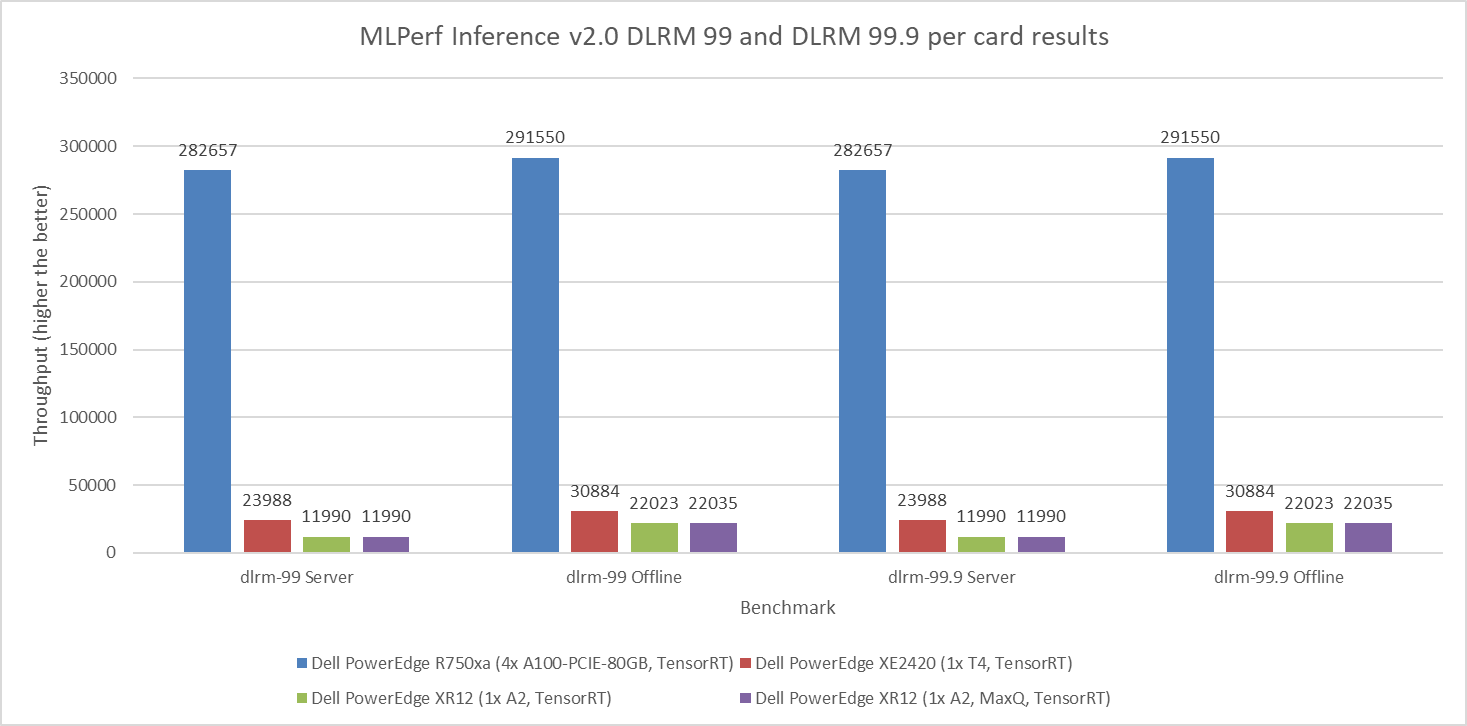
Figure 6: MLPerf Inference v2.0 DLRM default and high accuracy per card results
Observations
The results in this blog have been officially submitted to and accepted by the MLCommons organization. These results have passed compliance tests, been peer reviewed, and adhered to the constraints enforced by MLCommons. Customers and partners can reproduce our results by following steps to run MLPerf Inference v2.0 in its GitHub repository.
Submissions from Dell Technologies included approximately 140 performance results and 28 performance and power results. Across the various workload tasks including Image Classification, Object Detection, Medical Image Segmentation, Speech-to-text, Language Processing, and Recommendation, server performance from Dell Technologies was promising.
Dell servers performed with optimal performance and power results. They were configured with different GPUs such as:
- NVIDIA A30 Tensor Core GPU
- NVIDIA A100 (PCIe and SXM)
- NVIDIA T4 Tensor Core GPU
- NVIDIA A2 Tensor Core GPU, which is newly released
More information about performance for specific configurations that are not discussed in this blog can be found in the v1.1 or v1.0 results.
The submission included results from different inference backends such as NVIDIA TensorRT and NVIDIA Triton. The appendix provides a summary of the full hardware and software stacks.
Conclusion
This blog quantifies the performance of Dell servers in the MLPerf Inference v2.0 round of submission. Readers can use these results to make informed planning and purchasing decisions for their AI workload needs.
Appendix
Software stack
The NVIDIA Triton Inference Server is an open-source inferencing software tool that aids in the deployment and execution of AI models at scale in production. Triton not only works with all major frameworks but also with customizable backends, further enabling developers to focus on their AI development. It is a versatile tool because it supports any inference type and can be deployed on any platform including CPU, GPU, data center, cloud, or edge. Additionally, Triton supports the rapid and reliable deployment of AI models at scale by integrating well with Kubernetes, Kubeflow, Prometheus, and Grafana. Triton supports the HTTP/REST and GRPC protocols that allow remote clients to request inferencing for any model that the server manages.
The NVIDIA TensorRT SDK delivers high-performance deep learning inference that includes an inference optimizer and runtime. It is powered by CUDA and offers a unified solution to deploy on various platforms including edge or data center. TensorRT supports the major frameworks including PyTorch, TensorFlow, ONNX, and MATLAB. It can import models trained in these frameworks by using integrated parsers. For inference, TensorRT performs orders of magnitude faster than its CPU-only counterparts.
NVIDIA MIG can partition GPUs into several instances that extend compute resources among users. MIG enables predictable performance and maximum GPU use by running jobs simultaneously on the different instances with dedicated resources for compute, memory, and memory bandwidth.
SUT configuration
The following table describes the SUT from this round of data center inference submission:
Table 1: MLPerf Inference v2.0 system configurations for DSS 8440 and PowerEdge R750xa servers
Platform | DSS 8440 10xA100 TensorRT | R750xa 4xA100 TensorRT |
MLPerf system ID | DSS8440_A100_PCIE_80GBx10_TRT | R750xa_A100_PCIE_80GBx4_TRT |
Operating system | CentOS 8.2 | |
CPU | Intel Xeon Gold 6248R CPU @ 3.00 GHz | Intel Xeon Gold 6338 CPU @ 2.00 GHz |
Memory | 768 GB | 1 TB |
GPU | NVIDIA A100 | |
GPU form factor | PCIe | |
GPU count | 10 | 4 |
Software stack | TensorRT 8.4.0 CUDA 11.6 cuDNN 8.3.2 Driver 510.39.01 DALI 0.31.0 | |
Table 2: MLPerf Inference v2.0 system configurations for PowerEdge XE2420 servers
Platform | PowerEdge XE2420 1xA30 TensorRT | PowerEdge XE2420 2xA30 TensorRT | PowerEdge XE2420 1xA30 TensorRT MaxQ | PowerEdge XE2420 1xAT4 TensorRT |
MLPerf system ID | XE2420_A30x1_TRT | XE2420_A30x2_TRT | XE2420_A30x1_TRT_MaxQ | XE2420_T4x1_TRT |
Operating system | Ubuntu 20.04.4 | CentOS 8.2.2004 | ||
CPU | Intel Xeon Gold 6252 CPU @ 2.10 GHz | Intel Xeon Gold 6252N CPU @ 2.30 GHz | Intel Xeon Silver 4216 CPU @ 2.10 GHz | Intel Xeon Gold 6238 CPU @ 2.10 GHz |
Memory | 1 TB | 64 GB | 256 GB | |
GPU | NVIDIA A30 | NVIDIA T4 | ||
GPU form factor | PCIe | |||
GPU count | 1 | 2 | 1 | 1 |
Software stack | TensorRT 8.4.0 CUDA 11.6 cuDNN 8.3.2 Driver 510.39.01 DALI 0.31.0 | |||
Table 3: MLPerf Inference v2.0 system configurations for PowerEdge XE8545 servers
Platform | PowerEdge XE8545 4xA100 TensorRT | PowerEdge XE8545 4xA100 TensorRT, Triton | PowerEdge XE8545 1xA100 MIG 1x1g.10g TensorRT
|
MLPerf system ID | XE8545_A100_SXM_80GBx4_TRT | XE8545_A100_SXM_80GBx4_TRT_Triton | XE8545_A100_SXM_80GB_1xMIG_TRT |
Operating system | Ubuntu 20.04.3 | ||
CPU | AMD EPYC 7763 | ||
Memory | 1 TB | ||
GPU | NVIDIA A100-SXM-80 GB | NVIDIA A100-SXM-80 GB (1x1g.10gb MIG) | |
GPU form factor | SXM | ||
GPU count | 4 | 1 | |
Software stack | TensorRT 8.4.0 CUDA 11.6 CuDNN 8.3.2 Driver 510.47.03 DALI 0.31.0 | ||
| Triton 22.01 |
| |
Table 4: MLPerf Inference v2.0 system configurations for PowerEdge XR12 servers
Platform | PowerEdge XR12 1xA2 TensorRT | PowerEdge XR12 1xA2 TensorRT MaxQ |
MLPerf system ID | XR12_A2x1_TRT | XR12_A2x1_TRT_MaxQ |
Operating system | CentOS 8.2 | |
CPU | Intel Xeon Gold 6312U CPU @ 2.40 GHz | |
Memory | 256 GB | |
GPU | NVIDIA A2 | |
GPU form factor | PCIe | |
GPU count | 1 | |
Software stack | TensorRT 8.4.0 CUDA 11.6 cuDNN 8.3.2 Driver 510.39.01 DALI 0.31.0 | |