
Assets

Inverse Design Meets Big Data: A Spark-Based Solution for Real-Time Anomaly Detection
Wed, 17 Jan 2024 18:27:32 -0000
|Read Time: 0 minutes
Inverse design is a process in which you start with a wanted outcome and performance goals. It works backward to find the system configuration and design parameters to achieve goals instead of the more traditional forward design, in which known parameters shape the design.
For accurate and timely identification of anomalies in big data streams from servers, it is important to configure an optimal combination of technologies. We first pick the autoencoder technique that shapes the multivariate analytics, then configure Kafka-Spark-Delta integration for dataflow, and finally select the data grouping at the source for the analytics to fire.
The iDRAC module in Dell PowerEdge servers gathers critical sideband data in its sensor bank. This data can be programmed for real-time streaming, but not every signal (data-chain) is relevant to online models that consume them. For example, if the goal is to find servers in the data center that are overheating, the internal residual battery charge in servers is not useful. Composable iDRAC data from PowerEdge servers is pooled in networked PowerScale storage. The most recent chunks of data are loaded onto memory for anomaly detection over random samples. Computed temporal fluctuations in anomaly strength complete the information synthesis from raw data. This disaggregated journey from logically grouped raw data to information using the Dell Data Lakehouse (DLH) network infrastructure specification (not shown here) triggers action in real-time. The following figure captures the architecture:
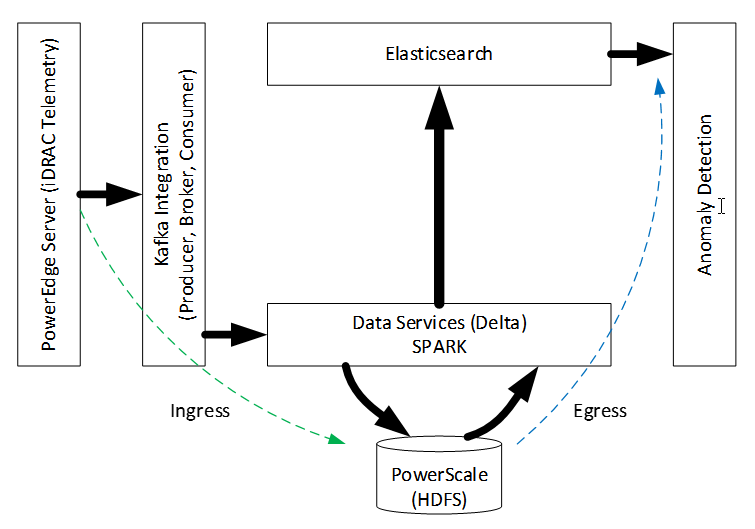
Figure 1. End-to-end architecture for streaming analytics
The pipeline has two in-order stages─ingress and egress. In the ingress stage, target model (for example, overheating) features influence data enablement, capture frequency, and streamer parameterization. Server iDRACs [1] write to the Kafka Pump (KP), which interprets native semantics for consumption by the multithreaded Kafka Consumer, as shown in the following figure:
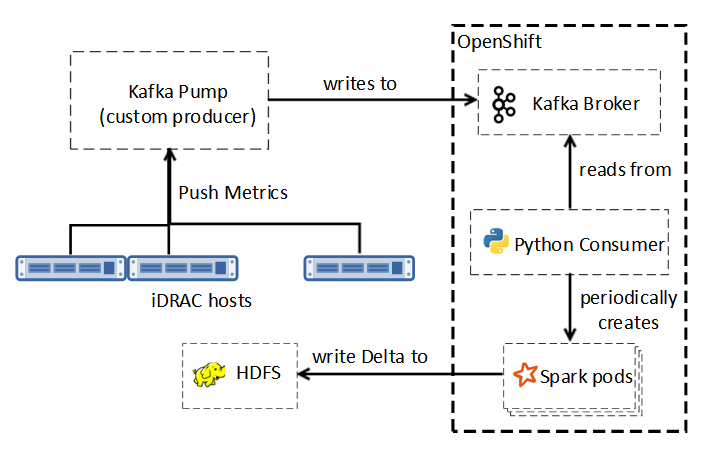
Figure 2. Kafka to Delta
The reader thread collects data from the configured input buffer while the writer thread periodically flushes this data by concatenating to the HDFS storage in Delta format, using Spark services for in-memory computing, scalability, and fault tolerance. Storage and data-management reliability, scalability, efficiency of HDFS and Delta Lake, coupled with the Spark and Kafka performance considerations influenced our choices.
In the egress stage of the pipeline, we apply anomaly strength analytics to the pretrained autoencoder [2] model. The use of NVIDIA A100 GPUs accelerated autoencoder training. Elasticsearch helped sift through random samples of the most recent server data bundle for anomaly identification. Aggregated Z-score error deviations over these samples helped characterize the precise multivariate anomaly strength (as shown in the following figure), extrapolation of which over a temporal window captured undesirable fluctuations. 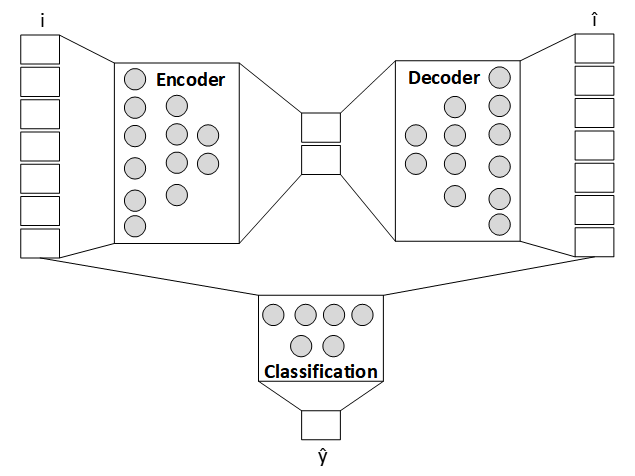
Figure 3. Anomaly analytics
We used Matplotlib to render, but you can alternatively manufacture on-demand events to drive corrections in the substrate. If generalized, this approach can continuously identify machine anomalies.
Conclusion
In this PoC, we combined several emerging technologies. We used Kafka for real-time data ingestion with Spark for reliable high-performance processing, HDFS with Delta Lake for storage, and advanced analytics for anomaly detection. We designed a Spark solution for real-time anomaly detection. By using autoencoders, supplemented with a strategy to quantify anomaly strength without requiring periodic drift compensation, we proved that modern data analytics integrates well on Dell DLH infrastructure. This infrastructure includes Red Hat OpenShift, Dell PowerScale storage, PowerEdge compute, and PowerSwitch network elements.
References:
[1] Telemetry Streaming with iDRAC9— Custom Reports Get Started
[2] D. Bank, N. Koenigstein, R. Giryes, “Autoencoders”, arXiv:2003.05991v2, April 2021.

Is GPU integration critical for Predictive Analytics?
Wed, 05 Apr 2023 18:22:40 -0000
|Read Time: 0 minutes
GPUs are getting widespread attention in the Predictive Analytics (PredAn) space. This is due to their ability to perform parallel computation on large volumes of data. GPUs leverage complex models that are tightly integrated to the simulation required to do control synthesis for real-time response in Industry 4.0 (I4) solutions. Consider the predictive maintenance use-case, where telemetry from servers in the datacenter are captured for failure analysis in the analytics cluster and control sequences generated to avoid downtime. Clearly, to be on track, the machine needs to project current data into the future and simulate fault partitions in the monitorable list to negotiate a fix, all in a tight time-window. However, prediction and simulation are inherently slow, particularly when this needs to be done on many fault partitions over multiple servers.
We argue that two things can help:
- Linearizing prediction with Koopman filters
- Leveraging generative models for control synthesis in the simulation space
We use Koopman filter to project data into a skinnier latent basis space for Dimension Reduction (DR) and embed this transformation inside an autoencoder. A probe to convert eigen-vector sections to an Eigen Value Sequence (EVS) that correlates to survival probabilities can then be transformed to Time2Failure (T2F) estimates. This failure detection can then be tagged with a reference to a pre-calibrated auto-fix script derived using Anomaly Fingerprinting (AF) while simulating the projected fault partition. Generative models (GAN) allow performance and footprint optimization, resulting in faster inferencing. In that sense, this improves inferencing throughput. We train generative models for Data, DR, T2F and AF and use them for fast inferencing. Figure 1(a) shows the inferencing flow, 1(b) shows Koopman linearization, and 1(c) shows the underlying GAN footprint.
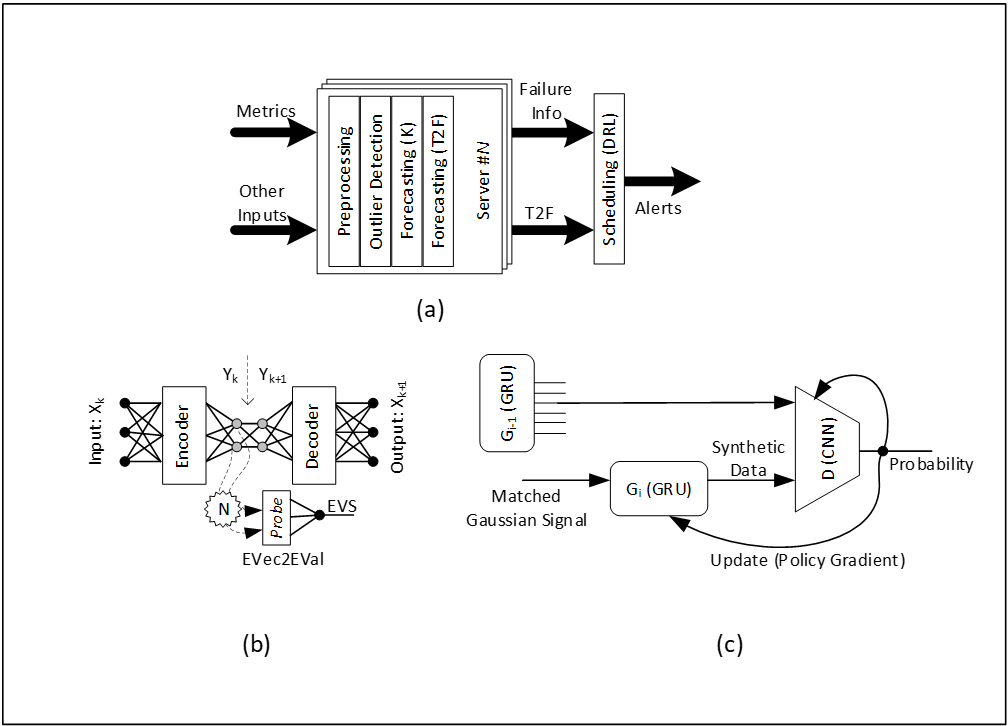
Figure 1. Inferencing flow, Koopman linearization, and the underlying GAN footprint
In figure 1(a), T2F estimates for all faults on all servers are triaged by the scheduler using DRL in the inferencing phase. In figure 1(b), each fault-group, eigen-vector dimension is searched in the autoencoder frame by resizing the encoder depth for failure clarity in EVS. In figure 1(b), G2 is derived from G1, and G1 from G0 for each fault group. Generative model synthesis enables the mapping of complex computation to high-performance low-footprint analogues that can be leveraged at inference time.
The GPU Argument
A GPU is typically used for both training and inferencing. In the predictive maintenance testbed, we stream live telemetry from iDRACs to the analytics cluster built using Splunk services like streaming, indexing, search, tiering and data-science tools on Robin.io k8s platform. The cluster has access to Nvidia GPU resources for both training and inferencing. The plot in figure 2(a) shows that the use of asynchronous access to Multi-Instance GPU (MIG) inferencing provides performance gain over blocking alternative, measured using wall-clock estimates. The GPU scheduler manages asynchronous T2F workloads better, and blocking calls would require timeout reconfiguration in production. The plot in figure 2(b) shows that inferencing performance of generative models improved by 15% (for 12+ episodes) when selective optimization (DRL-on-CPU and T2F-Calculation-on-GPU) was opted. The direction of this trend makes sense because DRL-in-GPU requires frequent memory-to-memory transfers and so is an ideal candidate for CPU pinning, whereas T2F estimates are dense but relatively less frequent computations that do well when mapped to GPU with MIG enabled. As the gap between the plots widens, this indicates that the CPU only computation cannot keep up with data pile-up, so input sections need to be shortened. The plot in figure 2(c) shows that fewer batches (assuming fixed dataset size) shortened epochs needed to achieve the desired training accuracy in GAN. However, larger batch size requires more GPU memory implying MIG disablement for improved throughput and energy consumption. Based on this data, we argue that dedicating a GPU for training (single kernel) as opposed to switching kernels (between training and inferencing) improves throughput. This tells us that the training GPU (without MIG enablement) and the inferencing GPU (with MIG enablement) should be kept separate in I4 for optimal utilization and performance. Based on current configuration choices, this points to dual Nvidia A30 GPU preference as opposed to a single Nvidia A100 GPU attached to the Power Edge server worker node. The plot in figure 2(d) shows that single layer generative models improve inferencing performance and scales more predictively. The expectation is that multilayering would do better. The plot indicates performance improvement as the section size increases, although more work is needed to understand the impact of multilayering.
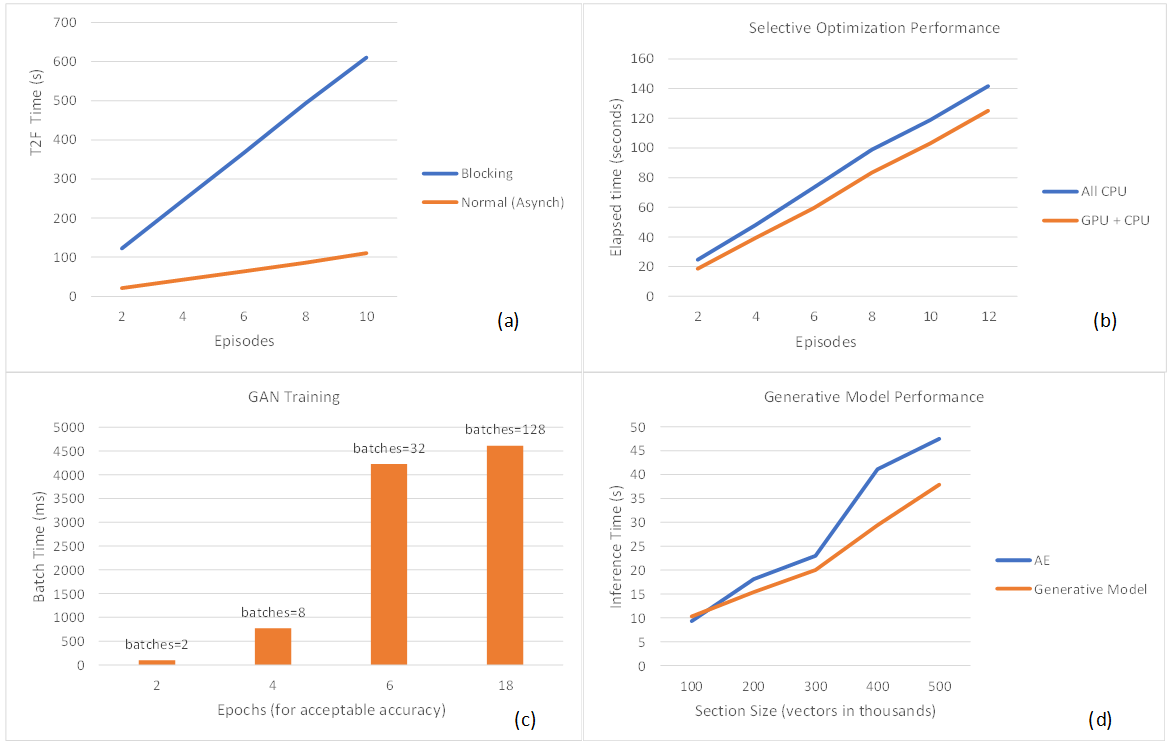
Figure 2. (a) Asynchronous calls for MIG inferencing provide performance gain over blocking calls. (b) Selective optimization provides better inferencing performance. (c) Larger training batch size (fewer batches) shortens the epochs needed to achieve acceptable accuracy. (d) Generative models improve inferencing performance.
In conclusion, predictive analytics is essential for maintenance in the era of digital transformation. We present a solution that scales with Dell server telemetry specification. It is widely accepted that for iterative error correction, linear feedback control systems perform better than their non-linear counterparts. We shaped predictions to behave linearly. By using generative models, one can achieve faster inferencing. We proposed a new way to couple generative models with Digital Twins (DT) simulation models for scheduling shaped by DRL. Our experiments indicate that GPU in analytics cluster accelerates response performance in I4 feedback loops (e.g., MIG enablement at inferencing, leveraging generative models to fast-track control synthesis).
References
- Brunton, S. L.; Budišić, M; Kaiser, E; Kutz, N. Modern Koopman Theory for Dynamical Systems. arXiv 2102.12086 2021.
- Brophy, E; Wang, Z; She, Q; Ward, T. Generative Adversarial Networks in Time Series: A Systematic Literature Survey. ACM Computing Surveys 2023, 55(10), Article 199.
- Matsuo, Y; LeCun, Y; Sahani, M; Precup, D; Silver, D; Sugiyama; M; Uchibe, E; Morimoto, J. Deep learning, reinforcement learning, and world models. Neural Networks Elsevier Press 2022, 152(2022), pp 267-275.
- Gara, S et al. Telemetry Streaming with iDRAC9. Dell White Paper May 2021.
AI-based Edge Analytics in the Service Provider Space
Fri, 15 Jan 2021 11:48:37 -0000
|Read Time: 0 minutes
Introduction
Advances in Service Provider performance management lags behind growth in digital transformation. Consider, for example, Dynamic Spectrum Sharing (DSS) in 5G networks – operators need to rapidly map small-cell flows to available frequency bands, in the presence of constraints like differing radio technologies and interference. Another example is the need to detect and/or predict infrastructure failures from KPIs, Traces, Profiles and Knowledge-bases, to trigger a fix before an issue manifests itself. Yet another example is energy optimization in data-centers, where servers are powered off to save energy, and workloads are moved around in the cluster, without affecting end to-end service. It is clear that in all of these scenarios, and in numerous other use-cases affecting industries such as factory automation, automotive, IIoT, smart cities, energy, healthcare, entertainment, and surveillance, AI on Big Data needs to replace legacy IT processes and tasks to trigger timely changes in the network substrate. The following figure illustrates how Big Data from the substrate can be consumed by fast-responding, interconnected AI models to act on service degradations. The traditional approach of DevOps reacting to irregularities visualized through Network Operations Center (NOC) terminals does not scale. Gartner and IDC both predict that by 2024 more than 60 percent of Mobile Network Operators (MNO) will adopt AI-based analytics in their IT operations.
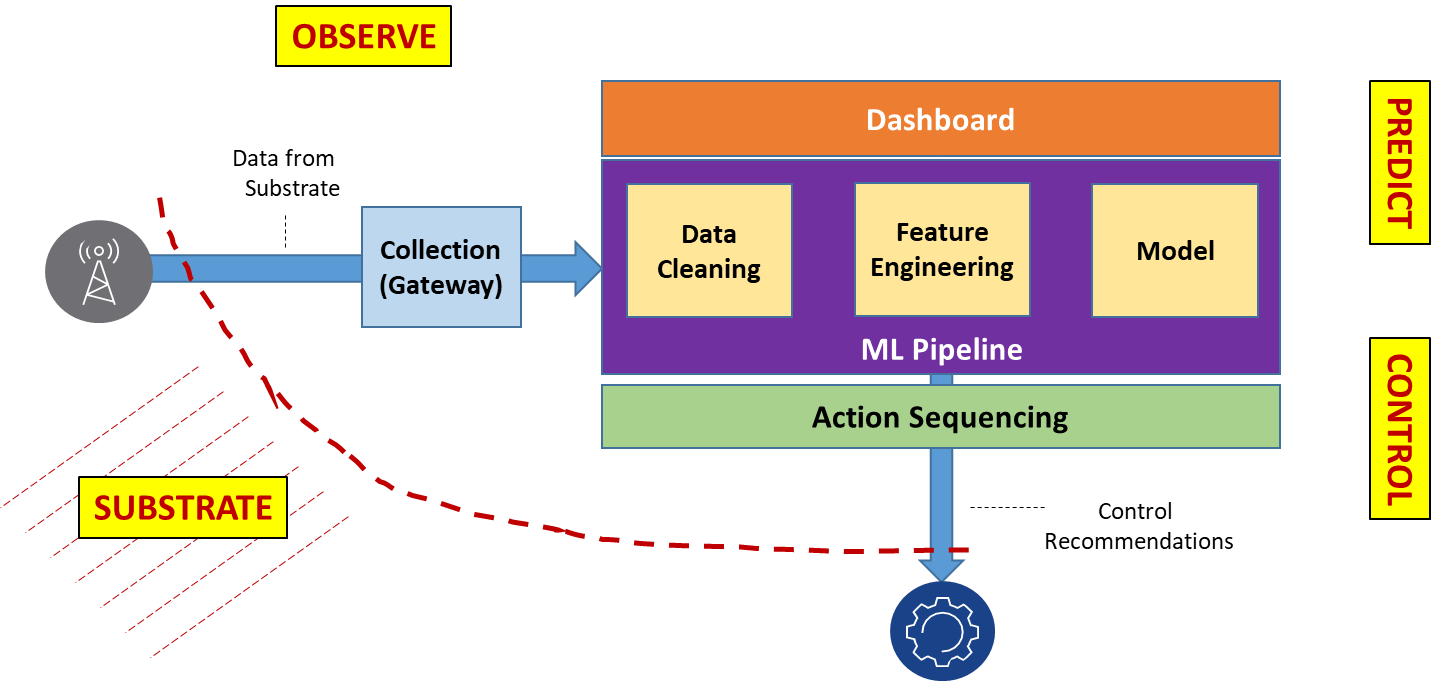
Figure 1. Decision and Controls with Models
Architecture
Data streams originating in the substrate, and gathered in the collection gateway, may be compressed. There may be gaps in data collection that need interpolation. Not all data types collected will have an equal impact on decision-making, which means that feature-filtering is important for decision-making. These issues justify the need for multi-stage pre-processing. Similarly, rapid decision-making can be achieved through multi-stage interconnected models using deep-learning technology. Instead of having one huge and complex model, experts agree that simpler interconnected models lead to more reusable design. The following figure illustrates the decision-making process. It shows a sample interconnected model graph that detects anomalies, identifies root-causes, and decides on a control sequence to recommend remediation measures.
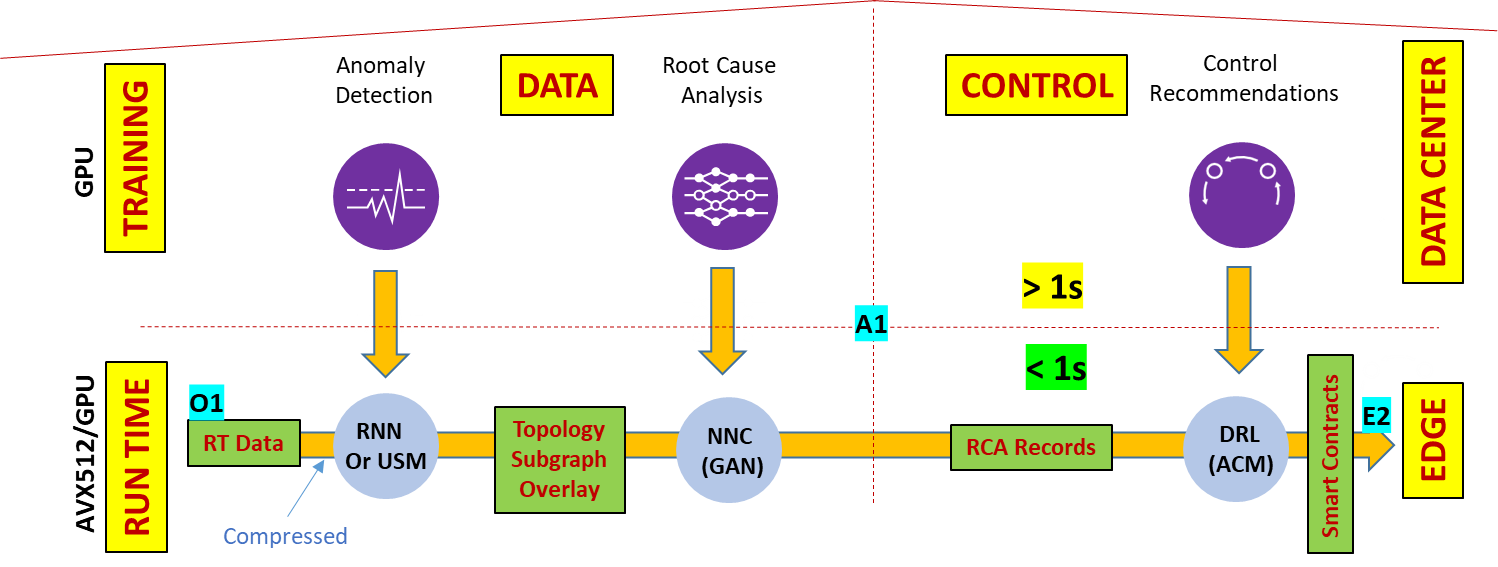
Figure 2. Runtime acceleration key for real-time loops
Deep-learning is a good tool for inductive reasoning, but deductive reasoning is also important for decision-making (for example, to limit cascading errors) and this requires one or more postprocessing stages. Collectively, these arguments point to a need for auto-pipelining through Function-as-a Service (FaaS) for WebScale automation in the cloud-native space. Add to this the need for streaming, visualization, and time-series databases for selective data-processing in the stages, and what we end up with is a Machine Learning Operating System (ML-OS) that provides these services. An ML-OS, such as Nuclio, automatically maps pipelined functions (for example, python definitions) to cloud-native frameworks, utilizing specified configurations, as well as supporting open-source tools for visualization, streaming, in-memory time-series databases, and GPU-based model acceleration. Applications developed on the ML-OS ingest data and output control sequences for continuous optimization in decision-making. These real-time decision-making loops collectively enable WebScale Network Automation, Slice Management, RAN operations, Traffic Optimization, QoE Optimization, and Security. The following figure illustrates the AIOPs platform.
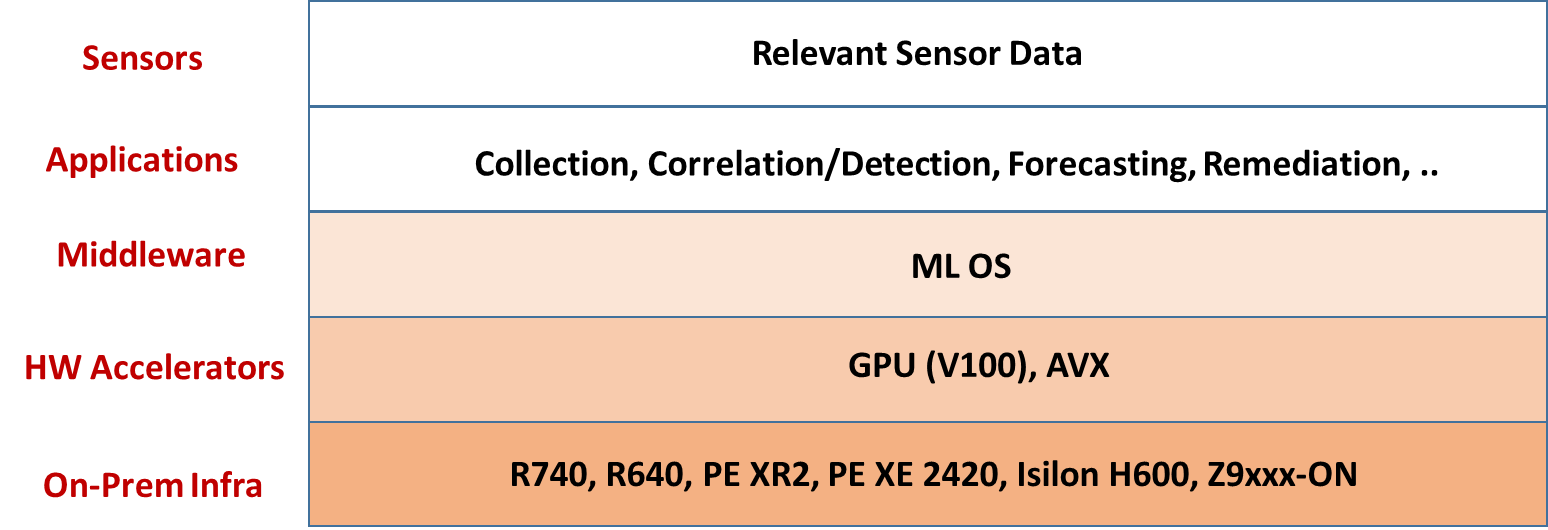
Figure 3. AIOPs Platform
Deployment
In this section we show our prototype deployment using Generation (substrate) and Analytics infrastructure, as shown in the following figure. Generation includes workload that is placed in Red Hat OpenStack (R16) VMs, where synthetically-generated tomography images are compressively sensed in one VM and then reconstructed in another VM. System performance metrics from this workload environment are exported to the Service Telemetry Framework (STF) Gateway placed in RedHat OpenShift (v4.3) containers, which gather data for streaming to the Analytics cluster placed in VMware (v6.7) VMs. The Analytics cluster includes Iguazio ML-OS with native GPU acceleration, and Anodot models for correlation and anomaly detection.
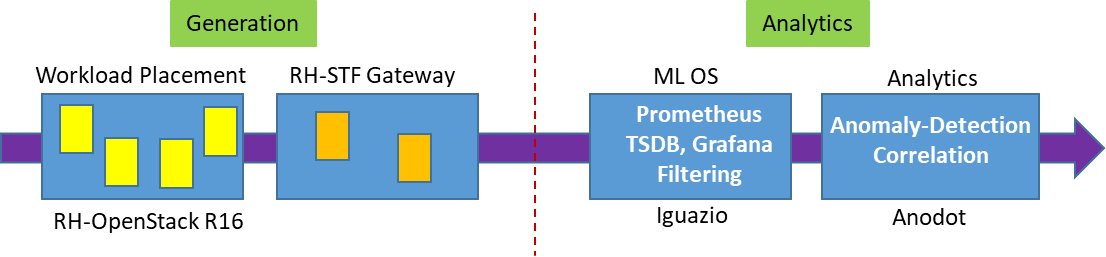
Figure 4. Workload layout in virtual infrastructure
The OpenStack cluster has 3 physical control nodes (R640) and 2 physical compute nodes (R740). Vm-1 generates random tomography images, which are compressed and dispatched to Vm-2 for Reconstruction using L1 Lasso Regression. OpenShift (OCP) is deployed on a pool of VMware virtual hosts (v6.7) with vSAN (see Reference Design) on 3 physical nodes (R740xd). OCP deployment spans 3 control and 5 compute virtual hosts. There is a separate administration virtual host (CSAH) for infrastructure services (DHCP, DNS, HAPROXY, TFTP, PXE, and CLI) on the OCP platform. vSphere CSI drivers are enabled on the OCP platform so that persistent volume requirements for OCP pods are satisfied by vSAN storage. RH STF deployed on OpenShift facilitates the automated collection of measurements from a workload environment over RabbitMQ message bus. STF stores metrics in the local Prometheus database and can forward to data sinks like Nuclio or Isilon (remote storage). Nuclio ML-OS is installed as 3 data VMs and 3 application VMs using data, client, and management networks. Anodot models in the application VMs process metrics from the OpenStack environment to detect anomalies and correlate them, as shown in the following figure.
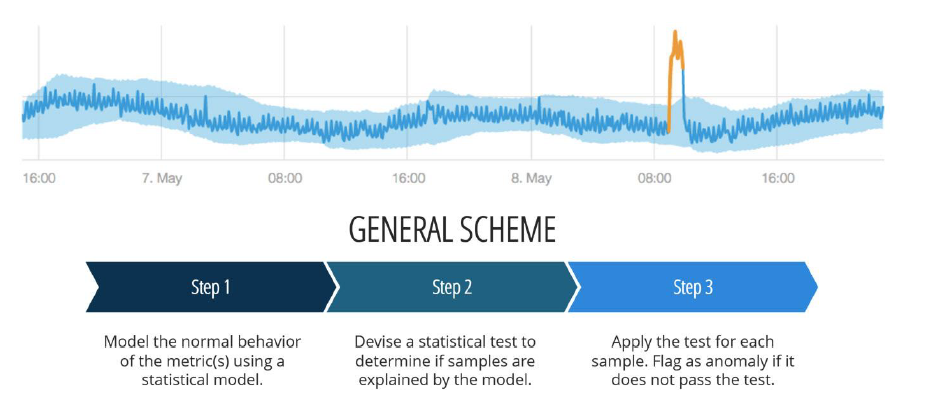
Figure 5. Sleeve tightening of metrics in Anodot
Building Blocks
The Python snippet and image snapshot shown below capture a workload running in the OpenStack space. Self-timed logic (not shown here) in Vm-1 is used to randomly generate CPU -utilization surges in compression by resizing imaging resolution. The Anodot dashboard shows the resulting surge in CPU-utilization in Vm-2 during reconstruction, hinting at a root cause issue. Similar behavior can be seen in network utilization, which the Anodot dashboard shows by aligning the anomalies to indicate correlation.
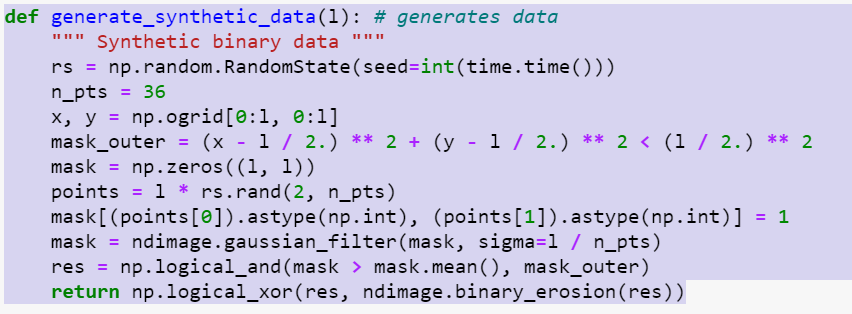
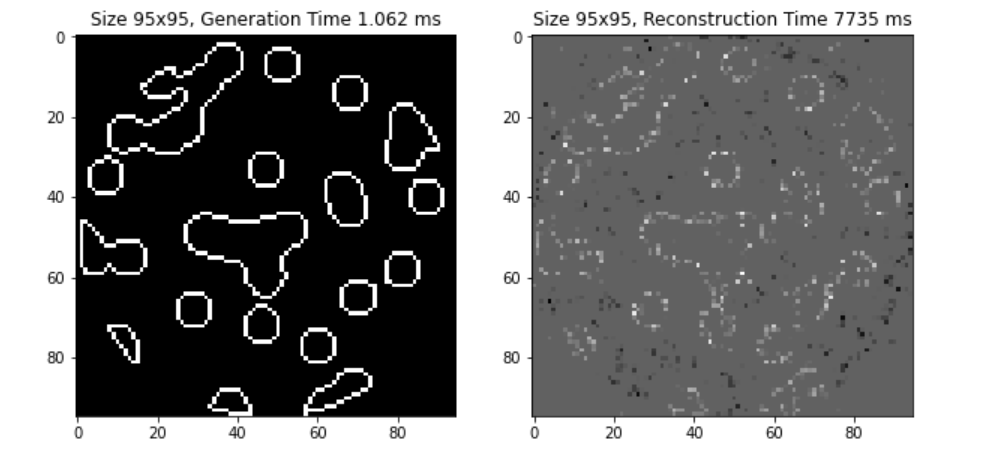
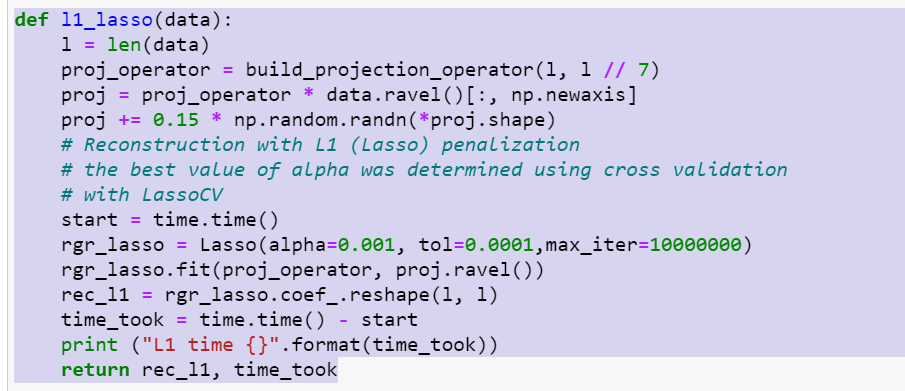

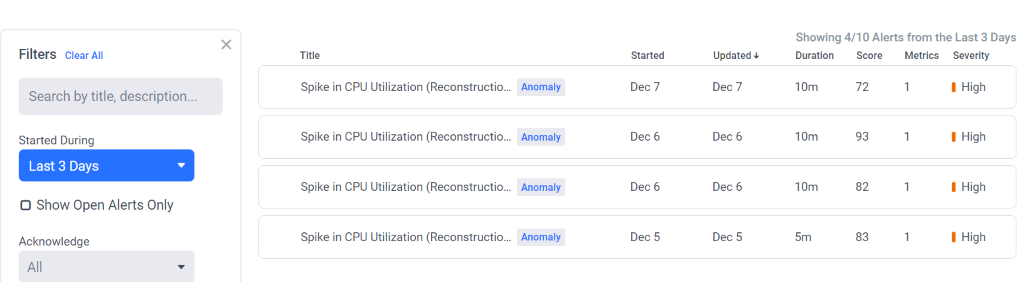
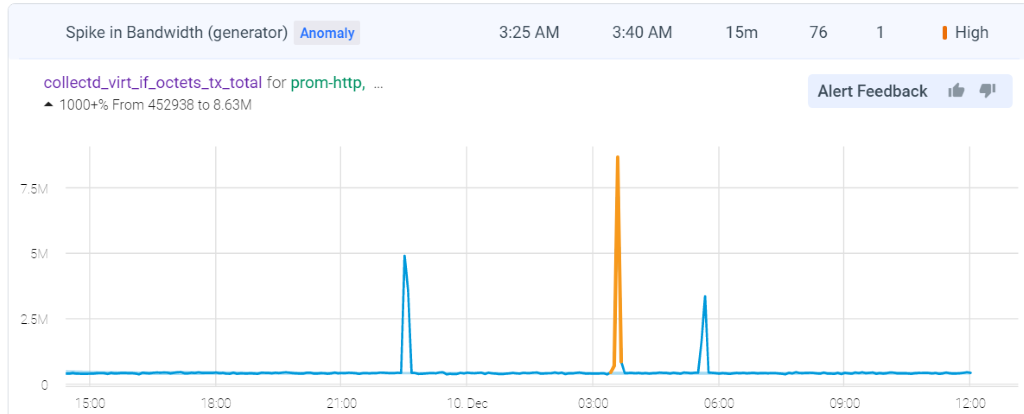
Figure 6. Anomaly detection in Anodot
Summary
The analytics solution proposed here uses open interfaces to aggregate data from all segments of the network, such as RAN, Packet Core, IMS, Messaging, Transport, Platform, and Devices. This provides the ability to correlate metrics and events across all nodes to create an end-to-end view of the network, the flow or a slice. AI turns this end-to-end insight into tangible inferences that drive autonomics in the substrate through control sequences.

Can AI Shape Cellular Network Operations?
Tue, 01 Dec 2020 17:55:41 -0000
|Read Time: 0 minutes
Mobile network operators (MNOs) are in the process of overlaying their conventional macro cellular networks with shorter-range cells such as outdoor pico-cells. This substantially increases network complexity, which makes OPEX planning and management challenging. Artificial intelligence (AI) offers the potential for MNOs to operate their networks in a more cost-efficient manner. Even though AI deployment has its challenges, most agree such deployment will ease emerging network, model, and algorithm complexity.
Advancements in error coding and communication design have resulted in the performance of the point-to-point link being close to the Shannon limit. This has proven to be effective for designing the fourth generation (4G) long-term evolution (LTE)-Advanced air interface, which has multiple parallel point-to-point links. However, 5G air interfaces are more complicated due to their complex network topology and coordination schemes, and vastly diverse end-user applications. Deriving any performance optimum is computationally infeasible. AI, however, can tame the network complexity by providing competitive performances.
Cellular networks have been designed with the goal of approximating end-to-end system behavior using simple modeling approaches that are amenable to clean mathematical analysis. For example, practical systems use digital pre-distortion to linearize the end-to-end model, for which information theory provides a simple closed-form capacity expression. However, with non-linearities in the wireless channel (e.g., mm-Wave) or device components (e.g., power amplifier), it’s difficult to analytically model such behaviors.
In contrast, AI-based detection strategies can easily model such non-linearities. There are examples in cellular networks where the optimal algorithms are well characterized but complex to implement in practice. For example, for a point-to-point multiple-input-multiple-output (MIMO) link operating with an M-ary quadrature amplitude modulation (QAM) constellation and K spatial streams or reconstruction in compressive spectrum sensing, optimum solutions are extremely complex. In practice, most MIMO systems employ linear receivers, e.g., linear minimum mean squared error (MMSE) receivers, which are known to be sub-optimal yet are easy to implement. AI can offer an attractive performance–complexity trade-off. For example, a deep-learning-based MIMO receiver can provide better performance than linear receivers in a variety of scenarios, while retaining low complexity.
Deep learning can be used for devising computationally efficient approaches for physical (PHY) layer communication receivers. Supervised learning can be used for MIMO symbol detection and channel decoding, fetching potentially superior performance; recurrent neural network (RNN)-based detection can be used for MIMO orthogonal frequency division multiplexing (OFDM) systems; convolutional neural network (CNN)-based supervised learning techniques can deliver channel estimation; unsupervised learning approaches can be used for automatic fault detection and root cause analysis leveraging self-organizing maps; deep reinforced learning (DRL) can be used for designing spectrum access, scheduling radio resources, and cell-sectorization. An AI-managed edge or data center can consider diverse network parameters and KPIs for optimizing on-off operation of servers while ensuring uninterrupted services for the clients. Leveraging historical data collected by data center servers, it’s possible to learn emerging service-usage patterns.
Standards bodies like the Third Generation Partnership Project (3GPP) have defined Network Data Analytics Function (NWDAF) specifications for data collection and analytics in automated cellular networks (3GPP TR 23.791 specification). By leaving AI model development to implementation, 3GPP provides adequate flexibility for network vendors to deploy AI-enabled use cases. The inbound interfaces ingest data from various sources such as operation, administration, and maintenance (OAM), network function (NF), application function (AF), and data repositories; the outbound interfaces relay the algorithmic decisions to the NF and AF blocks, respectively.
In addition to 3GPP, MNOs (AT&T, China Mobile, Deutsche Telekom, NTT DOCOMO, and Orange) established the O-RAN Alliance (https://www.o-ran.org/) with the intent to automate network functions and reduce operating expenses. The O-RAN architecture, which is shown in the following figure, includes an AI-enabled RAN intelligent controller (RIC) for both non-real time (non-RT) and near-real time (near-RT), multi-radio access technology protocol stacks.
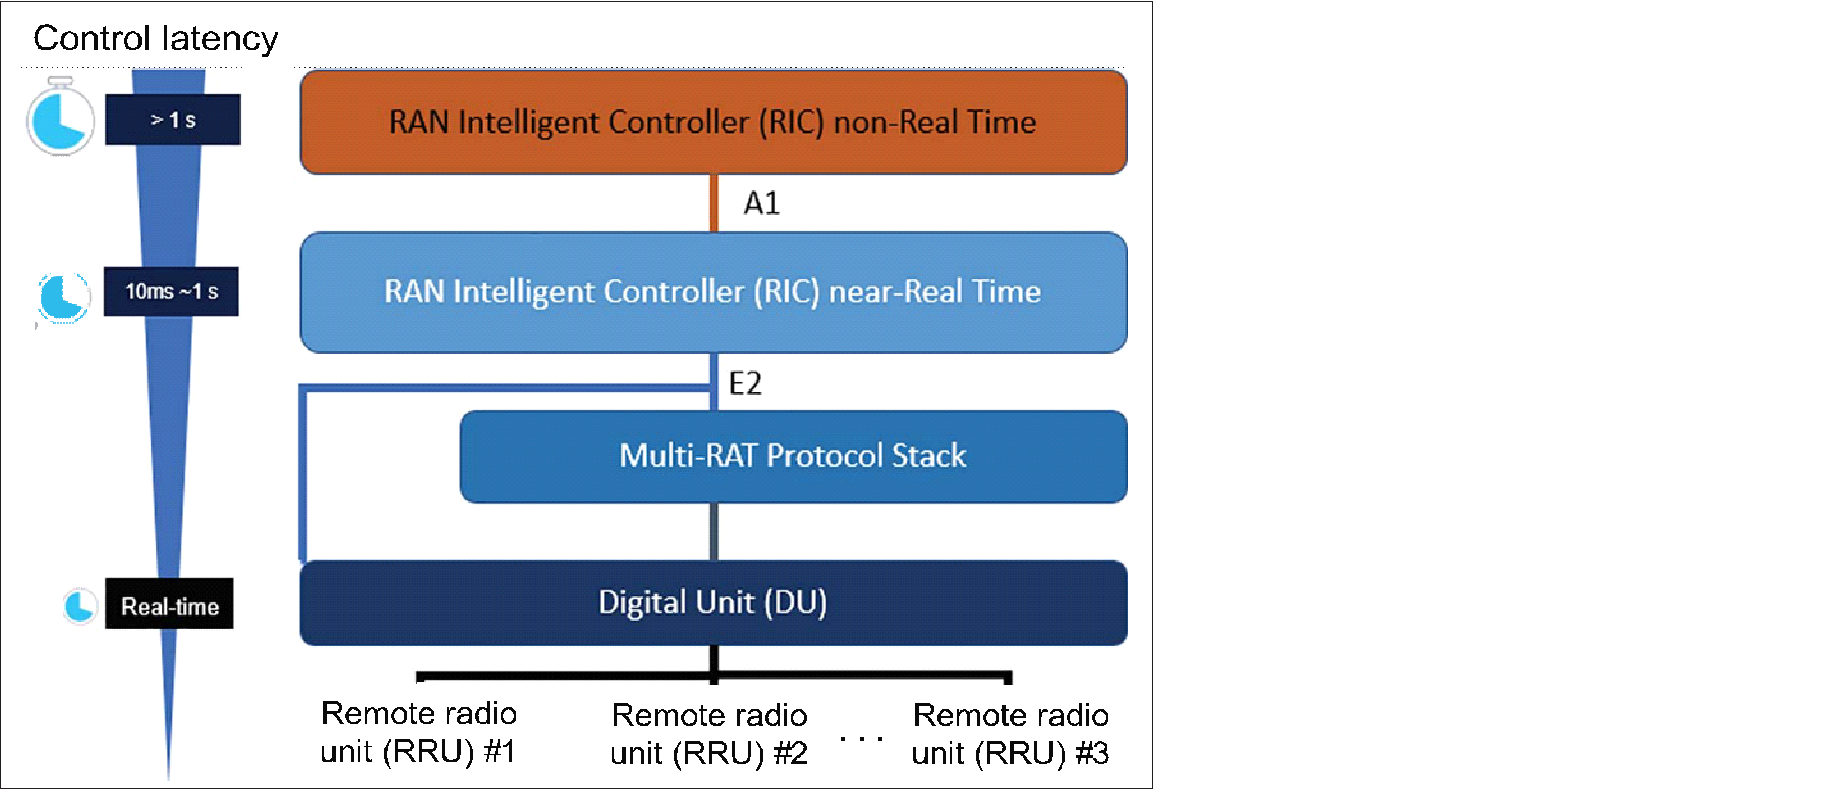
Figure: O-RAN Architecture (source: O-RAN Alliance)
The non-RT functions include service and policy management, higher-layer procedure optimization, and model training for the near-RT RAN functionality. The near-RT RIC is compatible with legacy radio resource management and enhances challenging operational functions such as seamless handover control, Quality of Service (QoS) management, and connectivity management with AI. The O-RAN alliance has set up two work groups standardizing the A1 interface (between non-RT RIC and near-RT RIC) and E2 interface (between near-RT RIC and digital unit [DU] stack).
Even though AI shows great promise for cellular networks, significant challenges remain:
- From a PHY and MAC layer perspective, training a cellular AI model using over-the-air feedback to update layer weights based on the back-propagation algorithm is expensive in terms of uplink control overhead.
- Separation of information across network protocol layers make it difficult to obtain labeled training data. For example, training an AI model residing within a base-station scheduler might be challenging if it requires access to application layer information.
- It is important for cellular networks to be able to predict the worst-case behavior. This isn’t always easy for non-linear AI building blocks.
- Cellular networks and wireless standards have been designed based on theoretical analysis, channel measurements, and human intuition. This approach allows domain experts to run computer simulations to validate communication system building blocks. AI tools remain black boxes. It is still challenging to develop analytical models to test correctness and explain behaviors in a simple manner.
- If a communication task is performed using an AI model, it is often unclear whether the dataset used for training the model is general enough to capture the distribution of inputs as encountered in reality. For example, if a neural network-based symbol detector is trained under one modulation and coding scheme (MCS), it is unclear how the system would perform for a different MCS level. This is important because if the MCS is changing adaptively due to mobility and channel fading, there has to be a way of predicting system behavior.
- Interoperability is crucial in today’s software defined everything (SDE). Inconsistency among AI-based modules from different vendors can potentially deteriorate overall network performance. For example, some actions (e.g., setting handover threshold) taken by an AI-based module from one vendor could counteract the actions taken by another network module (which may or may not be AI-based) from a second vendor. This could lead to unwanted handover occurrences between the original BS and the neighboring BS, causing increased signaling overhead.
In summary, MNOs agree that:
- Training needs to be distributed as more complex scenarios arise.
- More tools explaining AI decision making are essential.
- More tools are needed to compare AI model output to theoretical performance bounds.
- AI models need to adapt based on surrounding contextual information.
- AI deployment should first focus on wider timescale models until a point is reached when model decision making is indistinguishable from experts.
- Fail-safe wrappers around models should limit impact of cascading errors.
AI can revitalize wireless communications. There are challenges to overcome, but, done right, there is opportunity to deliver massive-scale autonomics in cellular networks that support ultra-reliable low-latency communications, enhanced mobile broadband, and massive machine-to-machine communications.