


AI-based Edge Analytics in the Service Provider Space
Introduction
Advances in Service Provider performance management lags behind growth in digital transformation. Consider, for example, Dynamic Spectrum Sharing (DSS) in 5G networks – operators need to rapidly map small-cell flows to available frequency bands, in the presence of constraints like differing radio technologies and interference. Another example is the need to detect and/or predict infrastructure failures from KPIs, Traces, Profiles and Knowledge-bases, to trigger a fix before an issue manifests itself. Yet another example is energy optimization in data-centers, where servers are powered off to save energy, and workloads are moved around in the cluster, without affecting end to-end service. It is clear that in all of these scenarios, and in numerous other use-cases affecting industries such as factory automation, automotive, IIoT, smart cities, energy, healthcare, entertainment, and surveillance, AI on Big Data needs to replace legacy IT processes and tasks to trigger timely changes in the network substrate. The following figure illustrates how Big Data from the substrate can be consumed by fast-responding, interconnected AI models to act on service degradations. The traditional approach of DevOps reacting to irregularities visualized through Network Operations Center (NOC) terminals does not scale. Gartner and IDC both predict that by 2024 more than 60 percent of Mobile Network Operators (MNO) will adopt AI-based analytics in their IT operations.
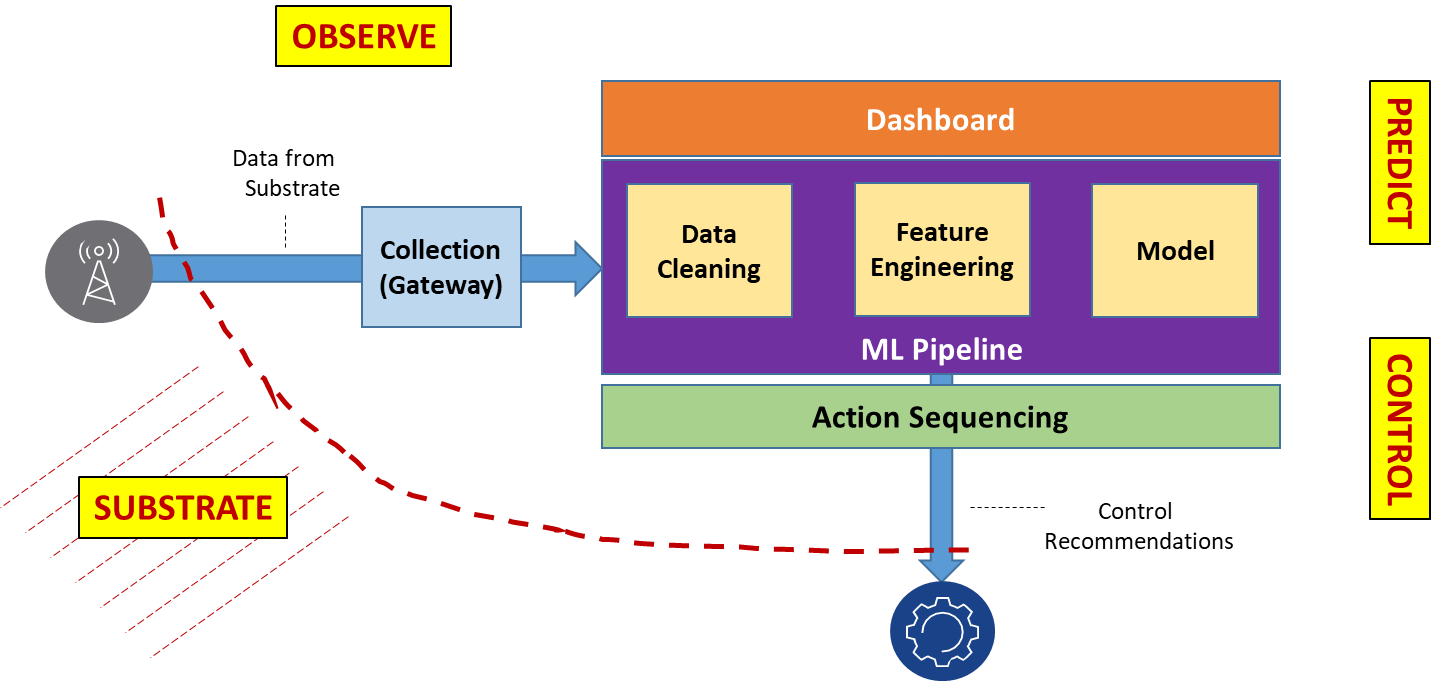
Figure 1. Decision and Controls with Models
Architecture
Data streams originating in the substrate, and gathered in the collection gateway, may be compressed. There may be gaps in data collection that need interpolation. Not all data types collected will have an equal impact on decision-making, which means that feature-filtering is important for decision-making. These issues justify the need for multi-stage pre-processing. Similarly, rapid decision-making can be achieved through multi-stage interconnected models using deep-learning technology. Instead of having one huge and complex model, experts agree that simpler interconnected models lead to more reusable design. The following figure illustrates the decision-making process. It shows a sample interconnected model graph that detects anomalies, identifies root-causes, and decides on a control sequence to recommend remediation measures.
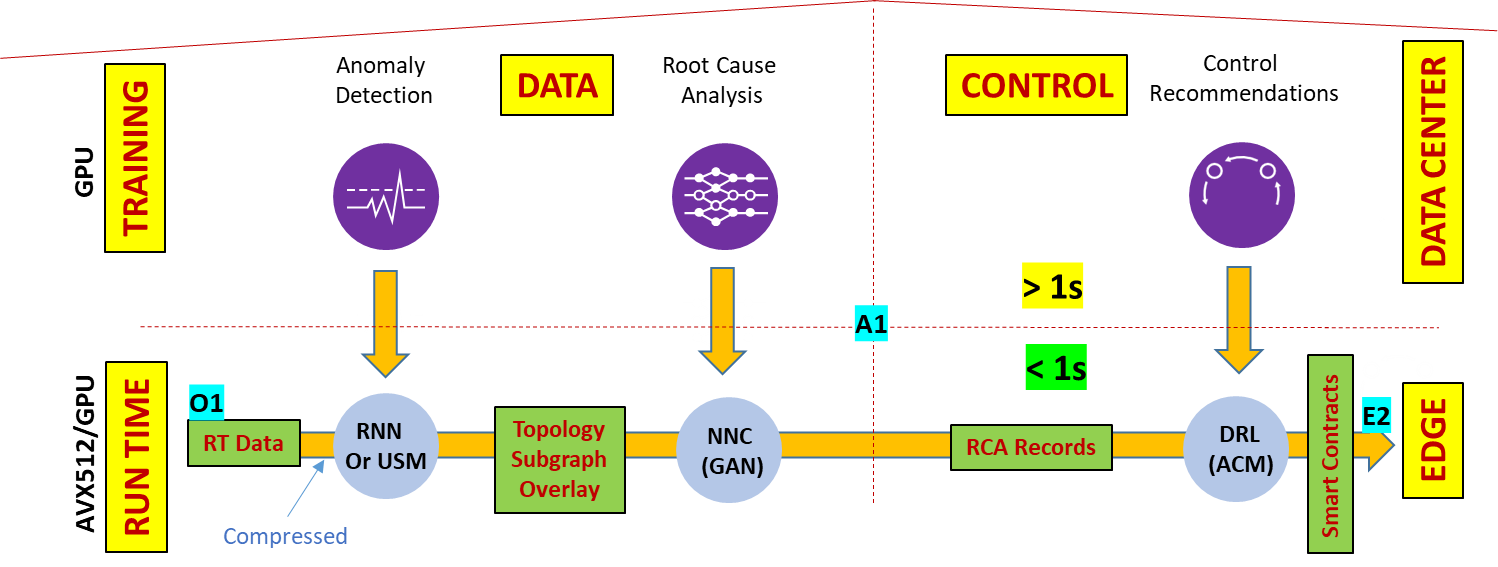
Figure 2. Runtime acceleration key for real-time loops
Deep-learning is a good tool for inductive reasoning, but deductive reasoning is also important for decision-making (for example, to limit cascading errors) and this requires one or more postprocessing stages. Collectively, these arguments point to a need for auto-pipelining through Function-as-a Service (FaaS) for WebScale automation in the cloud-native space. Add to this the need for streaming, visualization, and time-series databases for selective data-processing in the stages, and what we end up with is a Machine Learning Operating System (ML-OS) that provides these services. An ML-OS, such as Nuclio, automatically maps pipelined functions (for example, python definitions) to cloud-native frameworks, utilizing specified configurations, as well as supporting open-source tools for visualization, streaming, in-memory time-series databases, and GPU-based model acceleration. Applications developed on the ML-OS ingest data and output control sequences for continuous optimization in decision-making. These real-time decision-making loops collectively enable WebScale Network Automation, Slice Management, RAN operations, Traffic Optimization, QoE Optimization, and Security. The following figure illustrates the AIOPs platform.
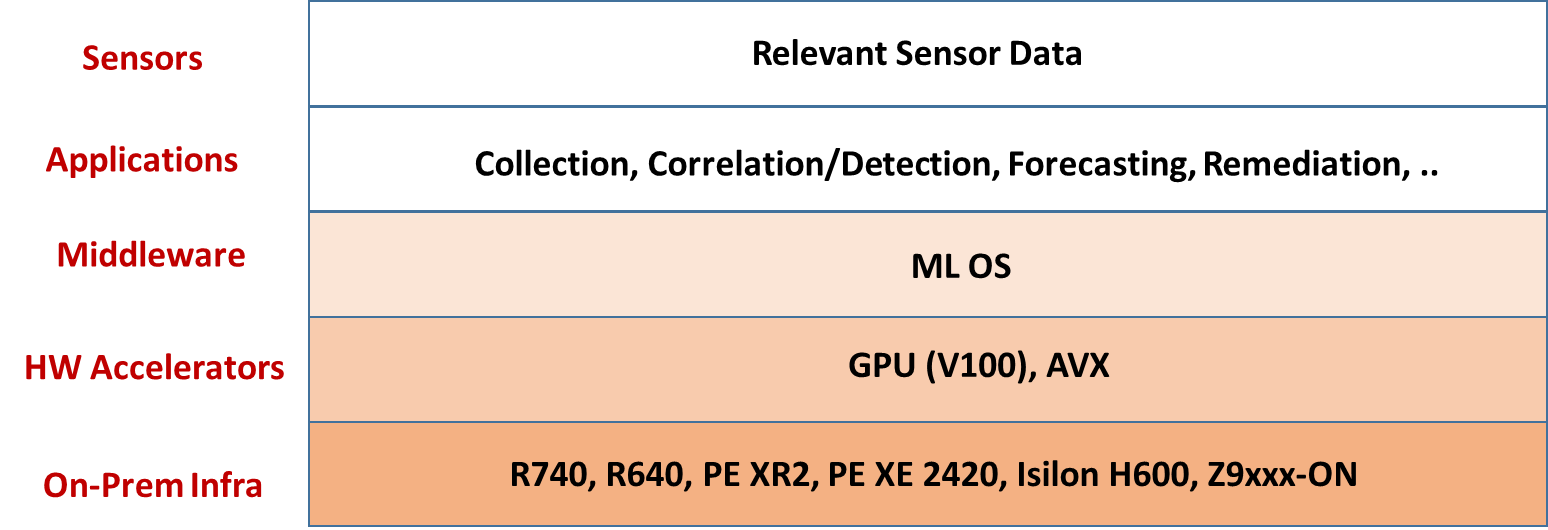
Figure 3. AIOPs Platform
Deployment
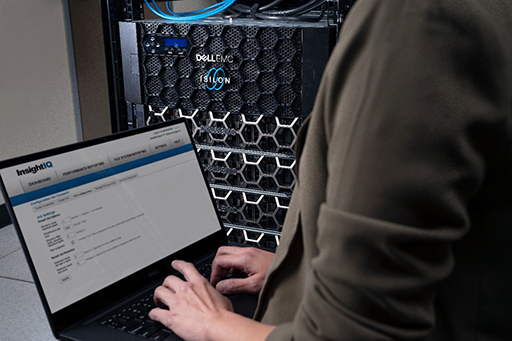
In this section we show our prototype deployment using Generation (substrate) and Analytics infrastructure, as shown in the following figure. Generation includes workload that is placed in Red Hat OpenStack (R16) VMs, where synthetically-generated tomography images are compressively sensed in one VM and then reconstructed in another VM. System performance metrics from this workload environment are exported to the Service Telemetry Framework (STF) Gateway placed in RedHat OpenShift (v4.3) containers, which gather data for streaming to the Analytics cluster placed in VMware (v6.7) VMs. The Analytics cluster includes Iguazio ML-OS with native GPU acceleration, and Anodot models for correlation and anomaly detection.
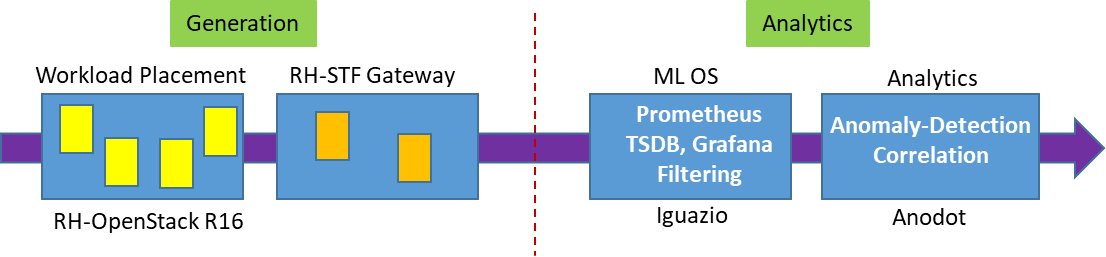
Figure 4. Workload layout in virtual infrastructure
The OpenStack cluster has 3 physical control nodes (R640) and 2 physical compute nodes (R740). Vm-1 generates random tomography images, which are compressed and dispatched to Vm-2 for Reconstruction using L1 Lasso Regression. OpenShift (OCP) is deployed on a pool of VMware virtual hosts (v6.7) with vSAN (see Reference Design) on 3 physical nodes (R740xd). OCP deployment spans 3 control and 5 compute virtual hosts. There is a separate administration virtual host (CSAH) for infrastructure services (DHCP, DNS, HAPROXY, TFTP, PXE, and CLI) on the OCP platform. vSphere CSI drivers are enabled on the OCP platform so that persistent volume requirements for OCP pods are satisfied by vSAN storage. RH STF deployed on OpenShift facilitates the automated collection of measurements from a workload environment over RabbitMQ message bus. STF stores metrics in the local Prometheus database and can forward to data sinks like Nuclio or Isilon (remote storage). Nuclio ML-OS is installed as 3 data VMs and 3 application VMs using data, client, and management networks. Anodot models in the application VMs process metrics from the OpenStack environment to detect anomalies and correlate them, as shown in the following figure.
Figure 5. Sleeve tightening of metrics in Anodot
Building Blocks
The Python snippet and image snapshot shown below capture a workload running in the OpenStack space. Self-timed logic (not shown here) in Vm-1 is used to randomly generate CPU -utilization surges in compression by resizing imaging resolution. The Anodot dashboard shows the resulting surge in CPU-utilization in Vm-2 during reconstruction, hinting at a root cause issue. Similar behavior can be seen in network utilization, which the Anodot dashboard shows by aligning the anomalies to indicate correlation.
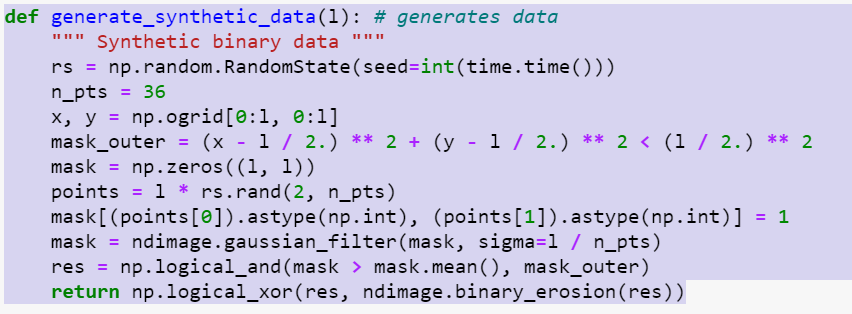
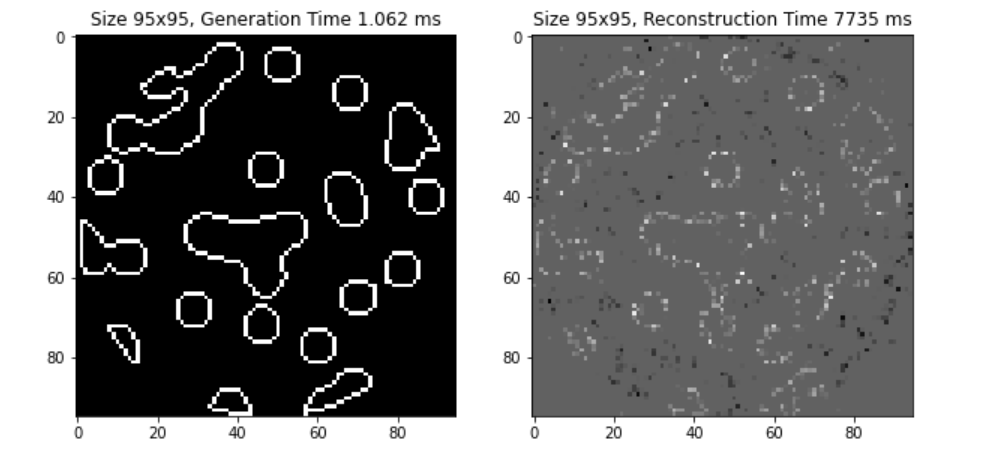
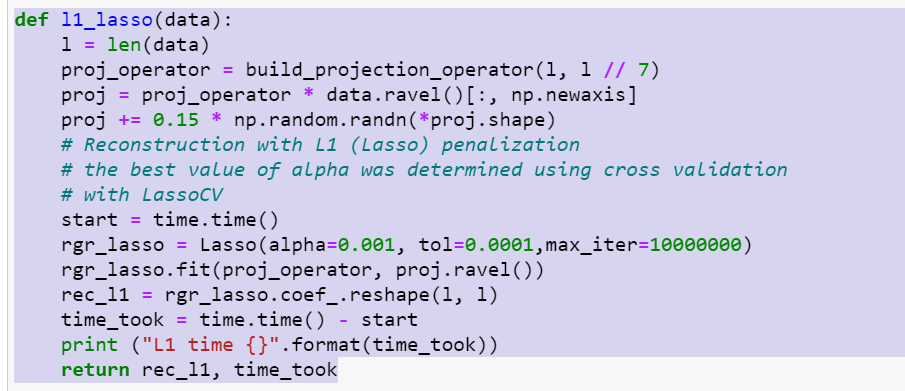

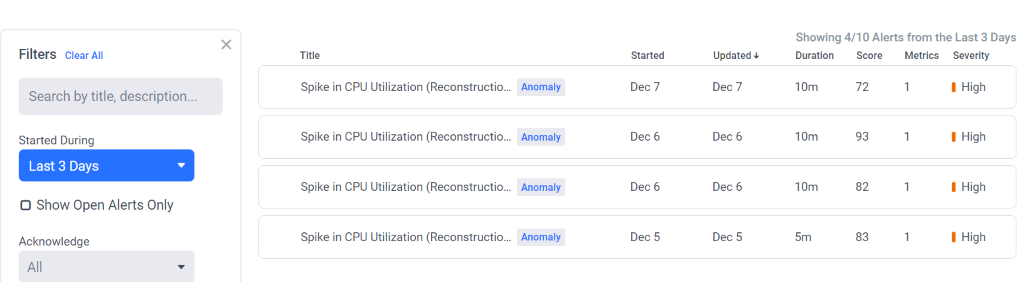
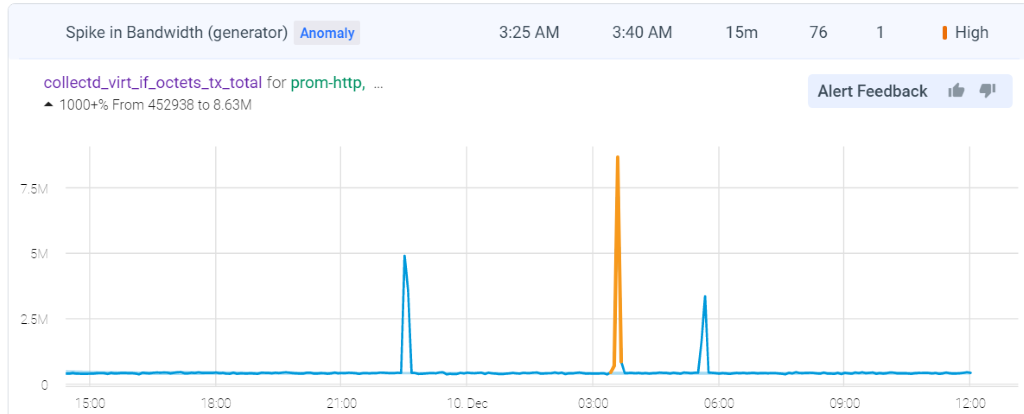
Figure 6. Anomaly detection in Anodot
Summary
The analytics solution proposed here uses open interfaces to aggregate data from all segments of the network, such as RAN, Packet Core, IMS, Messaging, Transport, Platform, and Devices. This provides the ability to correlate metrics and events across all nodes to create an end-to-end view of the network, the flow or a slice. AI turns this end-to-end insight into tangible inferences that drive autonomics in the substrate through control sequences.