Home > Workload Solutions > High Performance Computing > White Papers > Dell Validated Design for HPC Life Science with 4th Gen Intel Xeon Scalable Processors and Dell PowerScale > Methodology
Methodology
-
Molecular dynamics (MD) simulation
MDs estimate the movement of every atom in a molecular system and predict interatomic interactions based on a general model of physics. In a typical simulation, all possible interactions among the atoms and molecules are predicted for a given time, and it provides a potential dynamic progression view of the system.
There are about 37 software that fall into this category, and each one of them is designed for specific scientific purpose. Among the 37 tools, six of them are developed to take advantage of HPC systems. Amber and GROMACS are the most popular for biomolecular simulations. In this study, we tested GROMACS with synthetic and real data. GROMACS can be run on CPUs and GPUs in single-node and multi-node (cluster) configurations. It is free, open-source software released under the GNU General Public License (GPL).
BWA-GATK v3.6 pipeline
To determine the recommended software and hardware configuration that can keep pace with the daily output of the latest NGS instrumentation, three test cases were evaluated. For each case, the observed wall clock time was recorded for the BWA-GATK Germline Variant Calling pipeline using different resource configurations, data layouts, and sample data.
Data for benchmarking secondary analysis runtime consisted of three human WGS datasets, ERR091571, SRR3124837, and ERR194161, representing 10X, 30X, and 50X sample coverage, respectively. These datasets are available at the European Nucleotide Archive (ENA).
While BWA has been stable for many years, some radical modifications have been made to GATK version 4 and up. While the versions of GATK before four support multi-threading, version 4 and up support only single-thread operation. To remedy this shortcoming, the Spark version of GATK is also provided; however, it is mostly experimental.
For benchmarking GATK v3.6, we used the same pipeline for all the previous benchmarks, however, two different versions of pipelines for GATK v4.2 are created based on the germline cohort data analysis pipeline as shown in Figure 2. Figure 2. Main steps for germline cohort data
 This pipeline is designed to perform germline variant calling for benchmark purposes. Steps in the pipeline and their applications are listed in Figure 2. Step 1 consists of three applications piped together. An output from BWA is passed directly to Samtools for the file conversion from SAM to BAM. The converted output from Samtools feeds to sambamba for sorting the sequence reads by their chromosome locations. This piping technique can save writing a large file twice; however, this can deplete the multi-tasking capability of the CPU easily if many samples are processed through this pipeline. There is an upper number of samples concurrently processed with piping, otherwise, the total number of cores in a system is the maximum number of samples that can be run together.
Without a proper cohort dataset, it is not possible to obtain a reliable runtime from Step 7, Joint-Call Cohort. It is worth noting that the results from Step 7 are not realistic as we tested with a single sample. The actual runtime of Step 7 will grow according to the size of the cohort.
Table 6. Steps in the tested BWA-GATK v3.6 pipeline
Step
Operation
Applications
1
Align and Sort
BWA, Samtools, Sambamba
2
Mark and Remove Duplicates
Sambamba
3
Generate Realigning Targets
GATK - RealignerTargetCreator
4
Realign around Insertion and Deletion
GATK - IndelRealigner
5
Recalibrate Base
GATK - BaseRecalibrator
6
Call Variants
GATK - HaplotypeCaller
7
Consolidate GVCFs
GATK – GenotypeGVCFs
8
Recalibrate Variants
GATK – VariantRecalibrator
9
Apply Variant Recalibrations
GATK - ApplyRecalibration
Tuxedo pipeline
Gene expression analysis is as important as identifying Single Nucleotide Polymorphism (SNP), insertion/deletion (indel), or chromosomal restructuring. Ultimately, all physiological and biochemical events depend on the final gene expression product, proteins. Although most mammals have an additional controlling layer before protein expression, knowing how many transcripts exist in a system helps to characterize the biochemical status of a cell. Ideally, technology should enable us to quantify all proteins in a cell, which would advance the progress of Life Science significantly; however, we are far from achieving this.
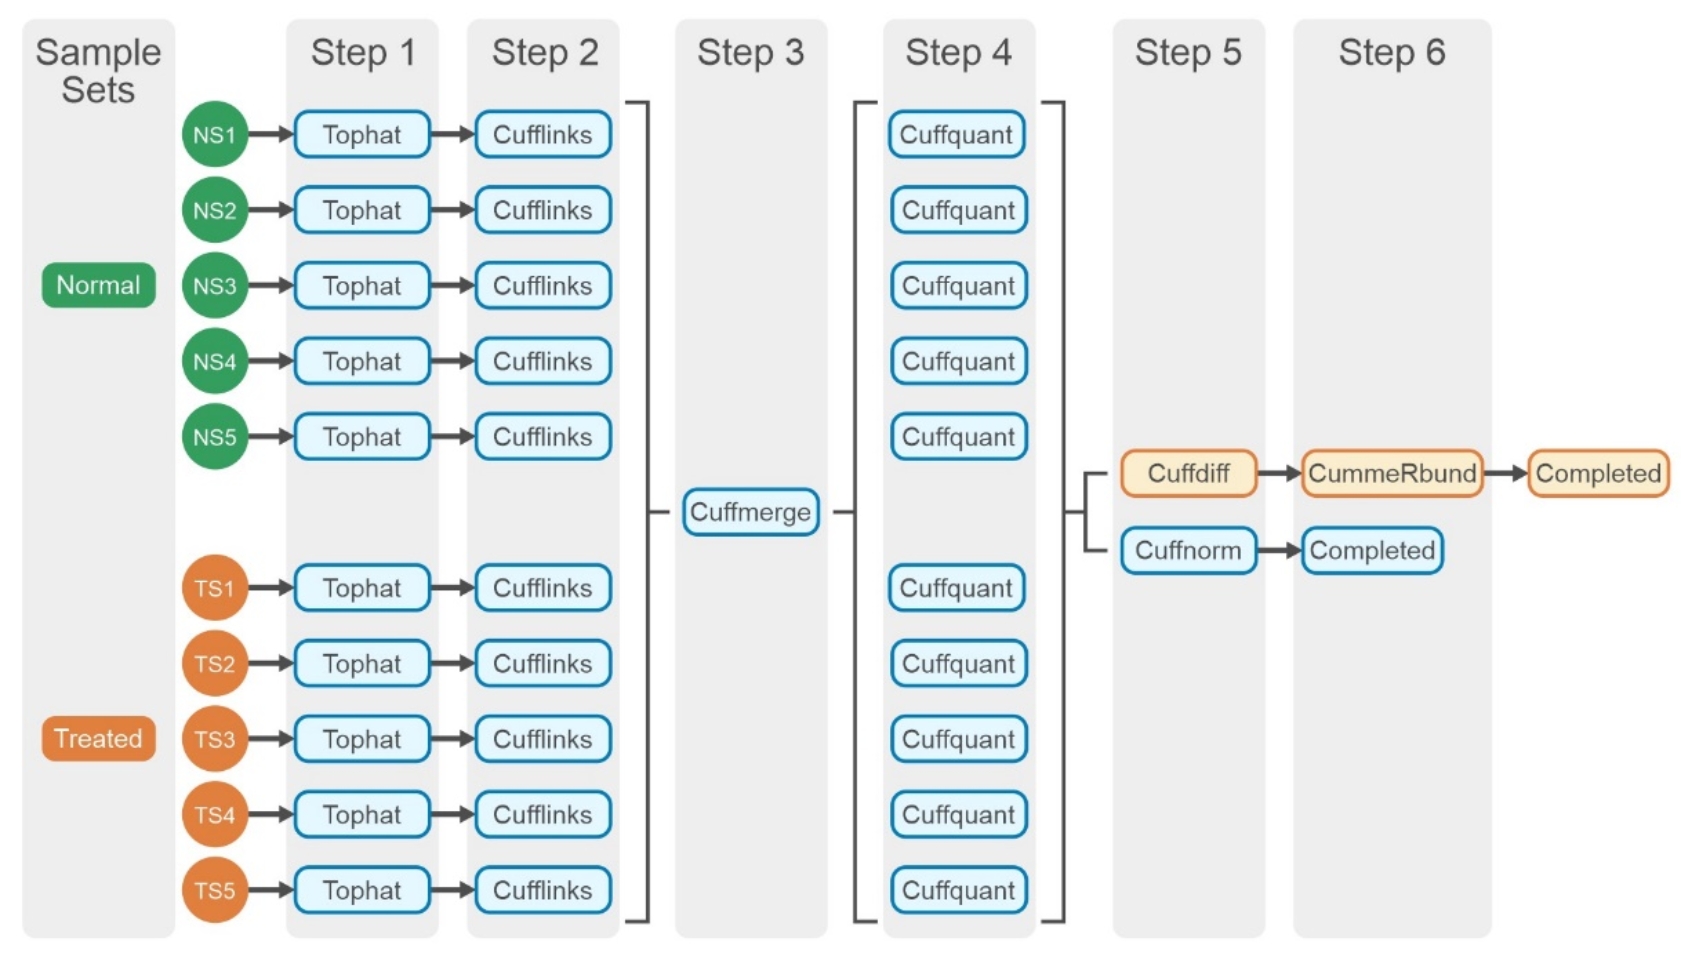
The Tuxedo pipeline suite offers a set of tools for analyzing a variety of RNA-Seq data, including short-read mapping, identification of splice junctions, transcript and isoform detection, differential expression, visualizations, and quality control metrics. The tested workflow is a differentially expressed gene (DEG) analysis, and the detailed steps in the pipeline are shown in Figure 3. A performance study of the RNA-Seq pipeline is not trivial because the nature of the workflow requires input files that are non-identical but similar in size. Hence, 185 RNA-Seq paired-end read data are collected from a public data repository. All the read datafiles contain around 25 million fragments (MF) and have similar read lengths. The samples for a test are randomly selected from the pool of the 185 paired end read files. Although these test data will not have any biological meaning, certainly these data with a high level of noise will put the tests in the worst-case scenario.
 Figure 3. Steps in the Tuxedo pipeline
