


Achieving Significant Virtualization Performance Gains with New 16G Dell® PowerEdge™ R760 Servers
Download PDF
Summary
With the latest Dell PowerEdge R760 16G servers utilizing the PCIe® 5.0 interface to connect networking and storage to the CPU, there are great performance increases in data movement over previous PCIe generations. These improvements can be utilized by hyperconverged infrastructures running on these servers.
This Direct from Development (DfD) tech note presents a generational server performance comparison in a virtualized environment comparing new 16G Dell PowerEdge R760 servers deployed with new KIOXIA CM7 Series SSDs with prior generation 14G Dell PowerEdge R740xd servers deployed with prior generation KIOXIA CM6 Series SSDs.
As presented by the test results, the latest Dell generation PowerEdge servers perform the same amount of work in less time and deliver faster performance in a virtualized environment when compared with prior PCIe server generations.
Market positioning
Data center infrastructures typically fall into three categories: traditional, converged and hyperconverged. Hyperconverged infrastructures enable users to add compute, memory and storage requirements as needed, delivering the flexibility of horizontal and vertical scaling. However, many virtual machine (VM) configurations run in converged infrastructures, and their ability to scale is often difficult when VM clusters require more storage.
VMware®, Inc. enables hyperconverged infrastructures through VMware ESXi™ and VMware vSAN™ platforms. The VMware ESXi platform is a popular enterprise-grade virtualization platform that scales compute and memory as needed and provides simple management of large VM clusters. The VMware vSAN platform enables the infrastructure to transition from converged to hyperconverged, delivering incredibly fast performance since storage is local to the servers themselves. The platforms support a new VMware vSAN Express Storage Architecture™ (ESA) that has gone through a series of optimizations to utilize NVMe™ SSDs more efficiently than in the past.
Product features
Dell PowerEdge 760 Rack Server (Figure 1)
Specifications: https://www.delltechnologies.com/asset/en-us/products/servers/technical-support/poweredge-r760-spec-sheet.pdf.
Figure 1: Side angle of Dell PowerEdge 760 Rack Server1
KIOXIA CM7 Series Enterprise NVMe SSD (Figure 2) Specifications:https://americas.kioxia.com/en-us/business/ssd/enterprise-ssd.html.
Figure 2: Front view of KIOXIA CM7 Series SSD2
PCIe 5.0 and NVMe 2.0 specification compliant; Two configurations: CM7-R Series (read intensive), 1 Drive Write Per Day3 (DWPD), up to 30,720 gigabyte4 (GB) capacities and CM7-V Series (higher endurance mixed use), 3 DWPD, up to 12,800 GB capacities.
Performance specifications: SeqRead = up to 14,000 MB/s; SeqWrite = up to 7,000 MB/s; RanRead = up to 2.7M IOPS; RanWrite = up to 600K IOPS.
Hardware/Software test configuration
The hardware and software equipment used in this virtualization comparison (Figure 3):
Server Information | ||
Server Model | Dell PowerEdge R7605 | Dell PowerEdge R740xd6 |
No. of Servers | 3 | 3 |
BIOS Version | 1.3.2 | 2.18.1 |
CPU Information | ||
CPU Model | Intel® Xeon® Gold 6430 | Intel Xeon Silver 4214 |
No. of Sockets | 2 | 2 |
No. of Cores | 64 | 24 |
Frequency (in gigahertz) | 2.1 GHz | 2.2 GHz |
Memory Information | ||
Memory Type | DDR5 | DDR4 |
Memory Speed (in megatransfers per second) | 4,400 MT/s | 2,400 MT/s |
Memory Size (in gigabytes) | 16 GB | 32 GB |
No. of DIMMs | 16 | 12 |
Total Memory (in gigabytes) | 256 GB | 384 GB |
SSD Information | ||
SSD Model | KIOXIA CM7-R Series | KIOXIA CM6-R Series |
Form Factor | 2.5-inch7 | 2.5-inch |
Interface | PCIe 5.0 x4 | PCIe 4.0 x4 |
No. of SSDs | 12 | 12 |
SSD Capacity (in terabytes4) | 3.84 TB | 3.84 TB |
Drive Write(s) Per Day (DWPD) | 1 | 1 |
Active Power | 25 watts | 19 watts |
Operating System Information | ||
Operating System (OS) | VMware ESXi | VMware ESXi |
OS Version | 8.0.1, 21813344 | 8.0.1, 21495797 |
VMware vCenter® Version | 8.0.1.00200 | 8.0.1.00200 |
Storage Type | vSAN ESA | vSAN ESA |
Load Generator Information (Test Software) | ||
Load Generator | HyperConverged Infrastructure Benchmark (HCIBench) | HCIBench |
Load Generator Version | 2.8.2 | 2.8.2 |
Figure 3: Hardware/Software configuration used in the comparison
Set-up and test procedures
Set-up:
The latest VMware ESXi 8.0 operating system was installed on all hosts.
Two clusters were created in VMware’s vCenter management interface with ‘High Availability’ and ‘Distributed Resource Scheduler’ disabled for testing.
Each Dell PowerEdge R760 host was added into a cluster - then each Dell PowerEdge R740xd host was added into a separate cluster.
VMkernel adapters were set up to have VMware vMotion™ migration, provisioning, management and the VMware vSAN platform enabled for both test configurations.
In the VMware vSAN configurations, twelve KIOXIA CM7 Series drives were added for the Dell PowerEdge R760 cluster (four drives per server), and twelve KIOXIA CM6 Series drives were added for the Dell PowerEdge R740xd cluster (four drives per server). The default storage policy was set to ‘vSAN ESA Default Policy – RAID 5’ for both configurations.
The HCIBench load generator (virtual appliance) was then imported and configured on the network.
Test procedures:
The latest VMware ESXi 8.0 operating system was installed on all hosts.
Six tests were run on each cluster – four performance tests and two power consumption tests as follows:
Performance tests:
IOPS: This metric measured the number of Input/Output operations per second that the system completed. Throughput: This metric measured the amount of data transferred per second to and from the storage devices.
Read Latency: This metric measured the time it took to perform a read operation. It included the average time it took for the load generator to not only issue the read operation, but also the time it took to complete the operation and receive a ‘successfully completed’ acknowledgement.
Write Latency: This metric measured the time it took to perform a write operation. It included the average time it took for the load generator to not only issue the write operation, but also the time it took to complete the operation and receive a ‘successfully completed’ acknowledgement.
Power consumption tests:
IOPS per Watt: This metric measured the amount of IOPS performed in conjunction with the power consumed by the cluster.
Throughput per Watt: This metric measured the amount of throughput performed in conjunction with the power consumed by the cluster.
For the four performance tests, the following five workloads were run with the test results recorded. For the two power consumption tests, the latter four workloads were run with the test results recorded.
100% Sequential Write (256K block size, 1 thread): This workload is representative of a data logging use case. 100% Random Read (4K block size, 4 threads): This workload is representative of a read cache system.
Random 70% Read / 30% Write (4K block size, 4 threads): This workload is representative of a common mixed read/write ratio used in commercial database systems.
Random 50% Read /50% Write (4K block size, 4 threads): This workload is representative of other common IT use cases such as email.
Blender (block sizes/threads vary): This workload is representative of a mix of many types of sequential and random workloads at various block sizes and thread counts as VMs request storage against the vSAN storage pool.
Test results8
IOPS (Figure 4): The results are in IOPS - the higher result for each is better.
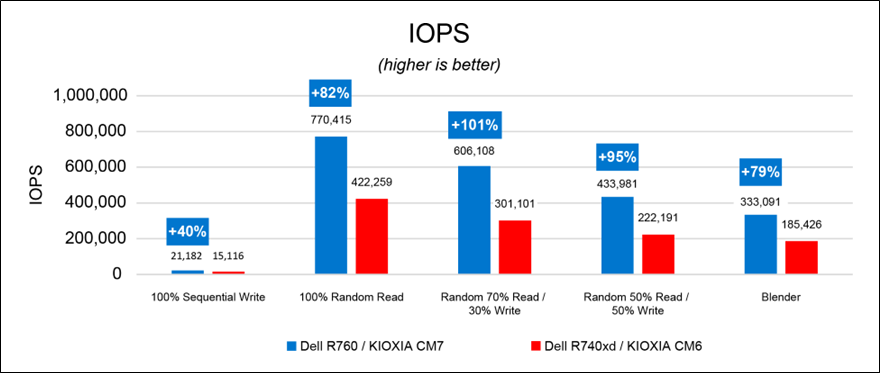
Figure 4: IOPS results
Throughput (Figure 5): The results are in megabytes per second (MB/s) - the higher result for each is better.
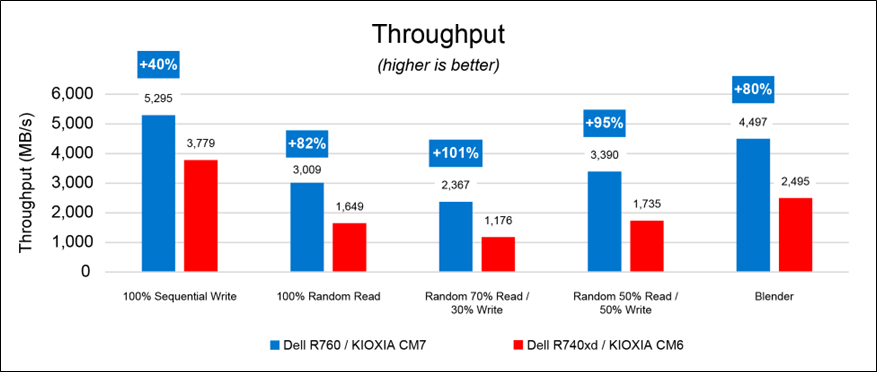
Figure 5: throughput results
Read Latency (Figure 6): The results are in milliseconds (ms) - the lower result for each is better. The 100% sequential write workloads for both configurations were not included for this test as the workload does not include read operations.
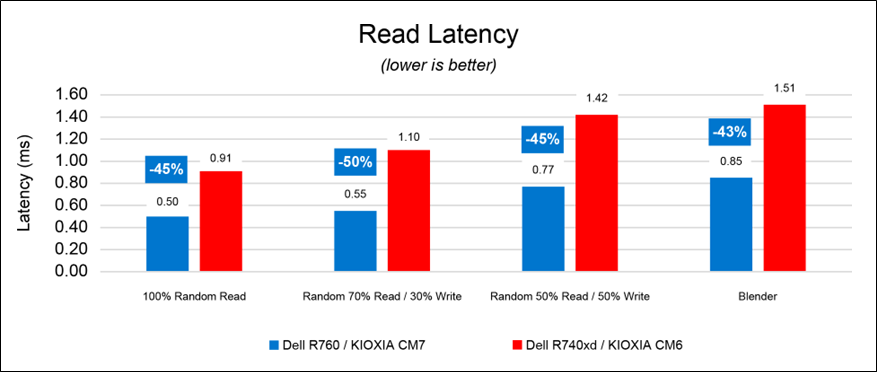
Figure 6: read latency results
Write Latency (Figure 7): The results are in milliseconds - the lower result for each is better. The 100% random read workloads for both PCIe configurations were not included for this test as the workload does not include write operations.
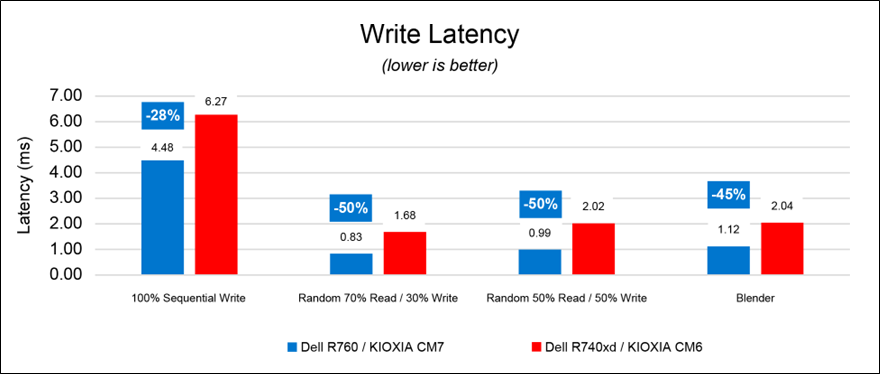
Figure 7: write latency results
IOPS per Watt (Figure 8): The results show the amount of IOPS performed per power consumed by the cluster and are in IOPS per watt (IOPS/W). The higher result for each is better.
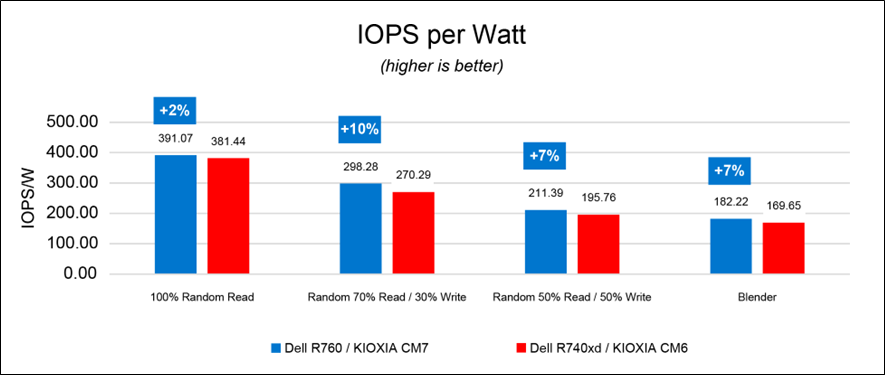
Figure 8: IOPS per watt results
Throughput per Watt (Figure 9): The results show the amount of throughput performed per power consumed by the cluster and are in MB/s per watt (MBps/W). The higher result for each is better.
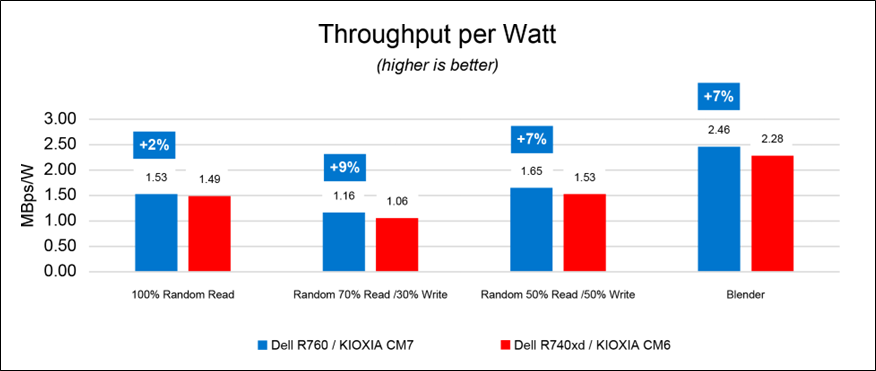
Figure 9: throughput per watt results
Final analysis
The Dell PowerEdge R760 servers equipped with new KIOXIA CM7 Series enterprise NVMe SSDs outperformed the Dell PowerEdge 740xd servers and SSDs in IOPS, throughput and latency. They also delivered higher performance per watt. With the newer generation of Dell PowerEdge servers, there are notable performance increases associated with hyperconverged infrastructures that directly affect server, CPU, memory and storage performance when compared with prior generations.
References
Footnotes
1. The product image shown is a representation of the design model and not an accurate product depiction.
2. The product image shown was provided with permission from KIOXIA America, Inc. and is a representation of the design model and not an accurate product depiction.
3. Drive Write Per Day (DWPD) means the drive can be written and re-written to full capacity once a day, every day for five years, the stated product warranty period. Actual results may vary due to system configuration, usage and other factors. Read and write speed may vary depending on the host device, read and write conditions and file size.
4. Definition of capacity - KIOXIA Corporation defines a megabyte (MB) as 1,000,000 bytes, a gigabyte (GB) as 1,000,000,000 bytes and a terabyte (TB) as 1,000,000,000,000 bytes. A computer operating system, however, reports storage capacity using powers of 2 for the definition of 1Gbit = 230 bits = 1,073,741,824 bits, 1GB = 230 bytes = 1,073,741,824 bytes and 1TB = 240 bytes = 1,099,511,627,776 bytes and therefore shows less storage capacity. Available storage capacity (including examples of various media files) will vary based on file size, formatting, settings, software and operating system, and/or pre-installed software applications, or media content. Actual formatted capacity may vary.
5. The Dell PowerEdge R760 server features a PCIe 4.0 backplane.
6. The Dell PowerEdge R740xd server features a PCIe 3.0 backplane.
7. 2.5-inch indicates the form factor of the SSD and not its physical size.
8. Read and write speed may vary depending on the host device, read and write conditions and file size.
Trademarks
Dell and PowerEdge are registered trademarks or trademarks of Dell Inc.
Intel and Xeon are registered trademarks of Intel Corporation or its subsidiaries in the U.S. and/or other countries NVMe is a registered or unregistered trademark of NVM Express, Inc. in the United States and other countries. PCIe is a registered trademark of PCI-SIG.
VMware, VMware ESXi, VMware vMotion, VMware vSAN, VMware vSAN Express Storage Architecture and VMware vCenter are registered trademarks or trademarks of VMware Inc. in the United States and/or various jurisdictions.
All other company names, product names and service names may be trademarks or registered trademarks of their respective companies.
Disclaimers
© 2023 Dell, Inc. All rights reserved. Information in this tech note, including product specifications, tested content, and assessments are current and believed to be accurate as of the date that the document was published and subject to change without prior notice. Technical and application information contained here is subject to the most recent applicable product specifications.
Related Documents

16th Generation Dell PowerEdge R760 server with Broadcom NICs: Save money, do more work, and use less energy
Mon, 15 Apr 2024 20:10:10 -0000
|Read Time: 0 minutes
Principled Technologies testing showed that a 16th Generation Dell PowerEdge R760 server featuring a Broadcom BCM57508-P2100G NIC delivered all three vs. previous-generation PowerEdge servers
The last 20 years have seen a dramatic increase in the amount of data businesses generate, analyze, and store. During this period of data proliferation, businesses gained access to a wealth of new sources of data from the rise of the internet, the widespread adoption of smart phones, and the growth of the internet of things (IoT). More powerful processors have made it possible for businesses to analyze this data in new ways using tools such as machine learning (ML) and artificial intelligence (AI). These developments mean many organizations need to add servers to their data centers to keep up with the growth in demand for compute capacity and storage, but it can be difficult to balance the need for higher performance and the challenge of reducing costs. Additionally, energy conservation has become increasingly important as energy costs have risen and businesses have made goals to reduce their carbon footprint to fight climate change.
We tested the performance and power efficiency of three generations of Dell PowerEdge servers to help businesses understand which of these servers to choose to meet the demands of data proliferation, reducing costs, and energy conservation. This report outlines our test methodologies and findings in the context of an increasingly cost-sensitive and conservation-conscious business landscape. We measured the Ops/s and the performance per watt ratio using the Memtier benchmark utility. We ran write and read commands against the popular open-source, in-memory data structure store Redis. Common use cases of Redis include message broker software[1] and real-time streaming analytics [2], among others.
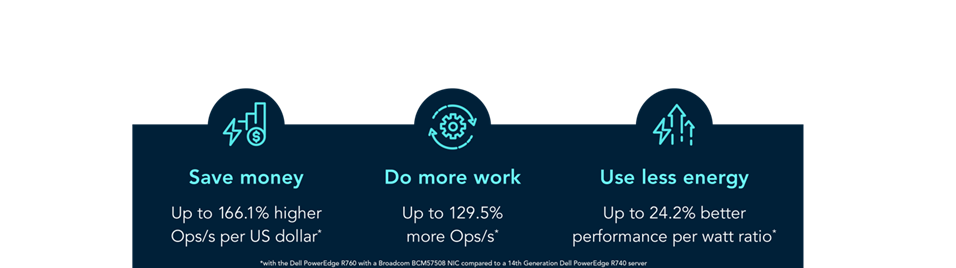
Our testing showed that by choosing the 16th Generation Dell PowerEdge R760 featuring a Broadcom BCM57508-P2100G NIC, organizations can save more money, do more work, and use less energy.
Spend less to do the same amount of work with Dell PowerEdge R760 servers with Broadcom NICs

Figure 1: The Ops/s that the servers processed, the price of the servers in US dollars, and the Ops/s per US dollar of the servers. Higher Ops/s per US dollar is better. Source: Principled Technologies.

Figure 2: The Ops/s that the servers processed, the price of the servers in US dollars, and the Ops/s per US dollar of the servers. Higher Ops/s per US dollar is better. Source: Principled Technologies.
When looking at adding capacity, using the latest servers can boost performance, but as with any business decision, organizations should weigh the costs as well as the benefits associated with purchasing the latest equipment. Perhaps an organization has reasons they may consider equipment that is one or two generations back, say, to match existing equipment. However, this decision can be critical to both purchase and ongoing costs. To understand how much you can reduce costs by using the latest more powerful and more energy efficient servers, we obtained list pricing for the configurations we tested.[3] We configured the servers in these price comparisons as closely as possible to those we tested, but some minor differences were unavoidable because of product availability.
The PowerEdge R760 with a Broadcom NIC processed 2.29 times as many Ops/s as the PowerEdge R740 at a cost that is 13.7 percent lower. As Figure 1 shows, the PowerEdge R760 processed 166.1 percent more Ops/s per Dollar as the PowerEdge R740. In addition to the lower purchase price, the PowerEdge R760 was 24.2 percent more energy efficient in our tests, which could further reduce costs by requiring less energy for operation and cooling.
The PowerEdge R760 with a Broadcom NIC processed 30.6 percent more Ops/s than the PowerEdge R750 at a cost that is only 3.9 percent higher. The cost difference between the PowerEdge R750 and the PowerEdge R760 is relatively small compared to the difference in performance, and as Figure 2 shows, the PowerEdge R760 server offered 25.4 percent more Ops/s per US dollar than the PowerEdge R750.
The impact of these cost, energy efficiency, and performance numbers will vary depending on the needs of a given data center. Let’s examine what the performance and value of these servers would look like in several scenarios.
If an organization needed the additional database processing power of 10 PowerEdge R760 servers, they could meet those needs with any of the servers we tested, but they would spend the least ($318,236.20) if they bought 10 PowerEdge R760 servers. To meet those needs with the PowerEdge R750 servers, they’d spend $399,181.54, and with the PowerEdge R740 servers, they’d pay $847,046.62.
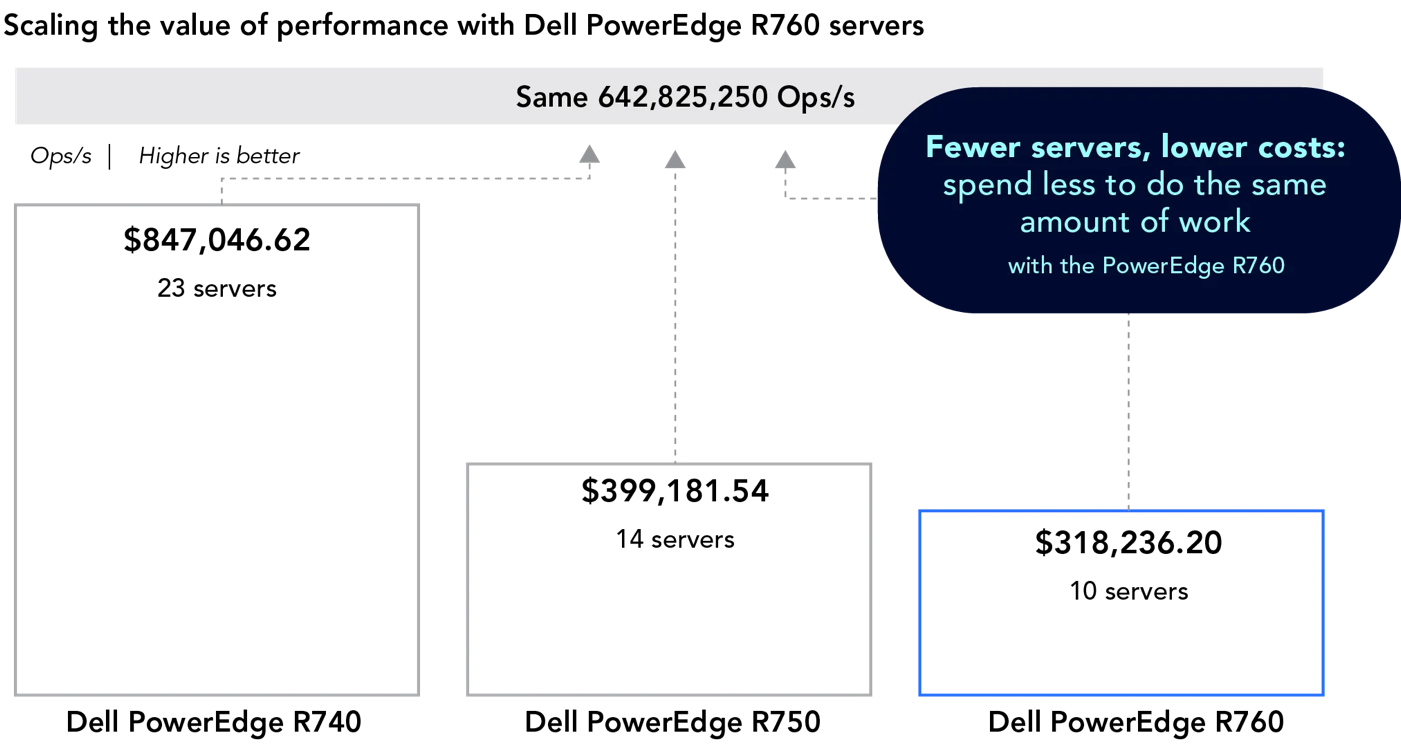
Figure 3: A comparison of how many servers it would take to do the same work as 10 Dell PowerEdge R760 servers and the cost in USD. Source: Principled Technologies.
The savings scale with the size of an organization’s database processing needs: 500 PowerEdge R760 servers would cost $15,911,810.00 and process 32,141,262,500 Ops/s. To do the same amount of work, the organization would need to purchase approximately 653 PowerEdge R750 servers, which would cost $19,956,907.00: over $4 million US dollars more than choosing the PowerEdge R760. Using this same hypothetical, an organization would need to purchase approximately 1,147 PowerEdge R740 servers to do the work of 500 PowerEdge R760 servers, at a cost of $42,319,539.95: over $26 million US dollars more than choosing the PowerEdge R760.
When you consider the higher performance, the savings discussed above, and the lower energy costs of the more efficient PowerEdge R760 with a Broadcom NIC, it becomes clear that organizations will save the most money by choosing the latest-generation Dell PowerEdge R760 server.
Better performance with the Dell PowerEdge R760 server
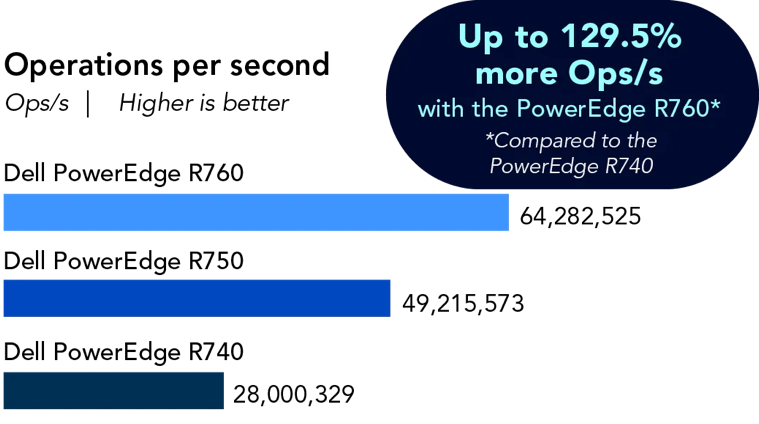
Figure 4: The Ops/s the servers processed. Higher is better. Source: Principled Technologies.
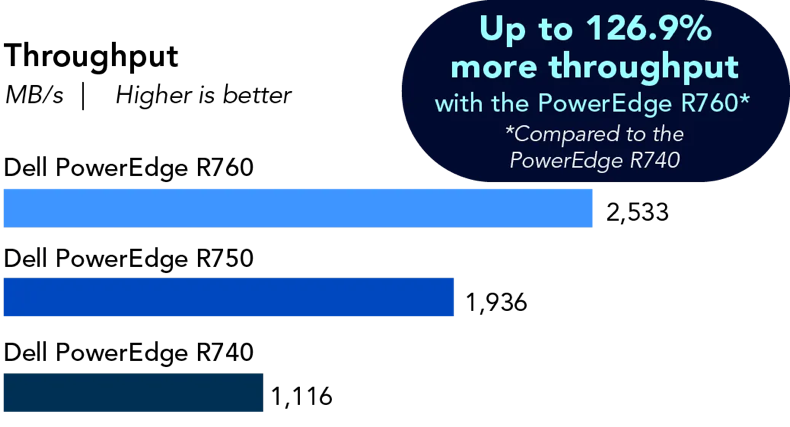
Figure 5: The throughput of the servers in MB/s. Higher is better. Source: Principled Technologies.

Figure 5: The performance per watt of the servers in Ops/s per watt. Higher is better. Source: Principled Technologies.
Bytes per second and operations per second (Ops/s) are both measures of throughput, or rates. Bytes per second are a system level statistic that typically come from either disk or network. We often refer to this metric in terms of a multiplier, such as megabytes per second (MB/s) or gigabytes per second (GB/s). In the case of our testing, we measured MB/s that passed through the ethernet controller. Ops/s typically refers to an application measure, in this case the operations per second that Redis processed during our memtier tests. Both measures of throughput are important to consider depending on what you are trying to measure. An increase in either number shows improvement in the amount of data (MB/s) or operations (Ops/s) that the server or application processed in a fixed amount of time.
When we compared the throughput of the three Dell PowerEdge servers, we found that the PowerEdge R760 server offered up to 126.9 percent more MB/s throughput and processed up to 129.5 percent more Ops/s than the PowerEdge R740 server. The PowerEdge R760 offered up to 30.8 percent more MB/s throughput and processed up to 30.6 percent more Ops/s than the previous-generation PowerEdge R750 server. Organizations that want the highest performing server should consider the PowerEdge R760, based on these findings.
Save money by getting more performance per watt with the PowerEdge R760 server featuring a Broadcom NIC
To understand the power efficiency of the servers, we measured the work a server did (Ops/s), and divided it by the power the server used (watts). We found that the PowerEdge R760 with a Broadcom NIC offered up to 24.2 percent better operations per second per watt than the 14th Generation Dell PowerEdge R740 server, and up to 9.2 percent better operations per second per watt than the 15th Generation Dell PowerEdge R750 server. Organizations that select these new servers with Broadcom ethernet controllers can reduce the amount of power necessary to process a given unit of work, which will help reduce their energy costs and carbon footprint.
Our hands-on testing of the Dell PowerEdge R760
To help organizations understand which PowerEdge server best meets their needs, we ran a series of tests comparing the performance and power efficiency of three servers that Dell is currently selling:
- 16th Generation Dell PowerEdge R760
- 15th Generation Dell PowerEdge R750
- 14th Generation Dell PowerEdge R740
These results might also be helpful for organizations considering upgrading their older servers to the latest-generation PowerEdge R760.
For testing, we used the database Redis, a widely-used, in-memory, open-source key-value store—a type of NoSQL database that uses pairs of keys and associated values to quickly access information. Companies including Twitter, GitHub, Snapchat, Craigslist, and StackOverflow rely on Redis for their operations.[4]
In the case of traditional relational databases, the architecture is such that the designers of the database must model, or structure, the data in a certain way. When applications request data and the data is not in memory, the database must retrieve the data from disk, causing a small delay. This architecture works well for some applications, but not all. In many types of applications, a developer may need to store data with less structure—perhaps strings, hashes, lists, or arrays. Redis works well for this, as its architecture is based on a key and a value. A key can have multiple values, resulting in databases that are comprised of a long list of keys and their associated values, with the potential for fewer complexities and slowdowns of relational databases. This data design makes Redis useful for web application user session data (such as cookies) and other small elements of data that web server applications need frequently. Caching that data in Redis allows web applications to return data very quickly.
Memtier, the benchmark utility we used, is a utility that runs set (write) and get (read) commands against a Redis database. Those commands simulate different request patterns. According to Redis, the memtier_benchmark is “a high-throughput benchmarking tool” that can “generate various traffic patterns against both Memcached and Redis instances.”[5] Various parameters that the operator can use, such as data size and key-pattern, can alter the traffic pattern that memtier returns. By operating the memtier utility on a client server and targeting a Redis server, we utilized the Redis server’s processor and ethernet controller subsystems heavily.
We configured all three of the servers we tested with Red Hat Enterprise Linux 8.7 and the most recent firmware as of March 14th, 2023 for the PowerEdge R740 and PowerEdge R750, and April 6th, 2023 for the PowerEdge R760. We recorded the operations per second (Ops/s) and throughput (MB/s) during the test and used those readings for our results. We used an external power meter to measure the power draw by the power supply units (PSUs) while the servers were under load and recorded the average power draw for the entire duration of the test. Then, we calculated the power efficiency (Ops/s/watt) of the devices using the results of our testing. We wanted to utilize close to 100 percent of the database server’s CPU capacity to see how the systems performed under stress. We used the memtier_benchmark to create a roughly 100GB database and ran a constant size, 32 byte (default/small), 100 percent read workload to create enough load to reach nearly 100 percent CPU usage. Read-only operations constitute the majority of the workload in applications such as content streaming and data analysis. Additionally, testing with read-only operations provides comparable performance metrics without the additional complexity of write operations.
Dell PowerEdge R760 servers with Broadcom BCM57508-P2100G NICs
The Dell PowerEdge R760 server is a 2U, two-socket server that features a Broadcom BCM57508-P2100G Dual-Port 100GbE PCl Ethernet Controller. Dell designed the PowerEdge R760 to handle “demanding workloads including artificial intelligence, database analytics, and high-density virtualization.”[6] A wide range of businesses can use the PowerEdge R760 for workloads that demand high performance, such as:
- Artificial intelligence
- Virtualized workloads
- Machine learning
- Database analysis
According to Dell, users of the PowerEdge R760 server can:
- “Add up to two 4th generation Intel® Xeon® scalable processors with up to 56 cores for fast and accurate performance
- Accelerate in-memory workloads with up to 32 DDR5 RDIMMS up to 4800 MT/s(1DPC)
- Maximize performance with up to 2x double-wide or 6x single-wide GPUs for finishing workloads faster
- [Use the] new Smart Flow chassis to air-cool some of the highest core count CPUs within current IT infrastructure”[7]
The PowerEdge R760 server includes built-in security features such as secured component verification, signed firmware and drift detection, dynamic system lockdown, and BIOS recovery.[8] The PowerEdge R760 also features intelligent automation features such as OpenManage Enterprise, CloudIQ solutions, and PowerEdge iDRAC. The OpenManage systems management portfolio enables administrators to deploy, configure, monitor, and manage PowerEdge servers, including easily obtaining power data and capping power as necessary. For more information about the Dell PowerEdge R760 server, visit: https://www.dell.com/en-us/shop/productdetailstxn/poweredge-r760.
About the Broadcom BCM57508-P2100G Dual-Port 100GbE PCle 4.0 ethernet controller

A network interface controller (NIC) is a hardware component in a server that connects the server to a network. The NIC translates outgoing data from the server into a format that the network can read and translates incoming data from the network into a format that the server can read. A higher performing NIC can reduce latency, increase throughput, and allow the server to transmit and receive a great volume of data.
The Dell PowerEdge R760 features the Broadcom BCM57508-P2100G Dual-Port 100GbE PCle 4.0 ethernet controller, which supports speeds of up to 200 Gigabits per second. Broadcom designed the BCM57508-P2100G “to build highly-scalable, feature-rich networking solutions in servers for enterprise and cloud-scale networking and storage applications, including high-performance computing, telco, machine learning, storage disaggregation, and data analytics.”[9]
The BCM57508-P2100G features TruFlow™, which Broadcom asserts can “increase VM density up to 50 percent.”[10] The BCM57508-P2100G also features BroadSAFE® technology, “to provide unparalleled platform security” and a “unique set of highly-optimized hardware acceleration engines to enhance network performance and improve server efficiency.”[11]
Efficiency and expansion: Unraveling the challenges of the growing data center market
We’ve shown that the PowerEdge R760 is more energy-efficient and offers better performance than previous-generation PowerEdge servers, but why does that matter? Organizations realize the value of their data and the insights they provide. Despite economic uncertainty, spending on servers has remained consistent with previous years, and many experts expect it to increase.[12] According to one industry analyst, “despite the general tightening of spending by governments and corporations..., organizations are still spending on infrastructure even if they are, in some cases, cutting back on personnel.”[13] Increasingly, to deal with the ever growing importance of their data, businesses are aware that adopting new technologies such as ML and AI is “both a necessity and a race.”[14]
While the new 16th Generation server we tested uses more power, it does so more efficiently—in this example resulting in an approximately 20 percent lower annual cost, based on the following calculations. In our example if we factor in power usage, our tested 16th Generation server used approximately 831W (.831kW), while the 14th Generation server used approximately 450W (.450kW). In an earlier section we established that an organization would need 1,147 PowerEdge R740 servers to do the work of 500 PowerEdge R760 servers. Thus we can calculate the data center power cost per year as follows:
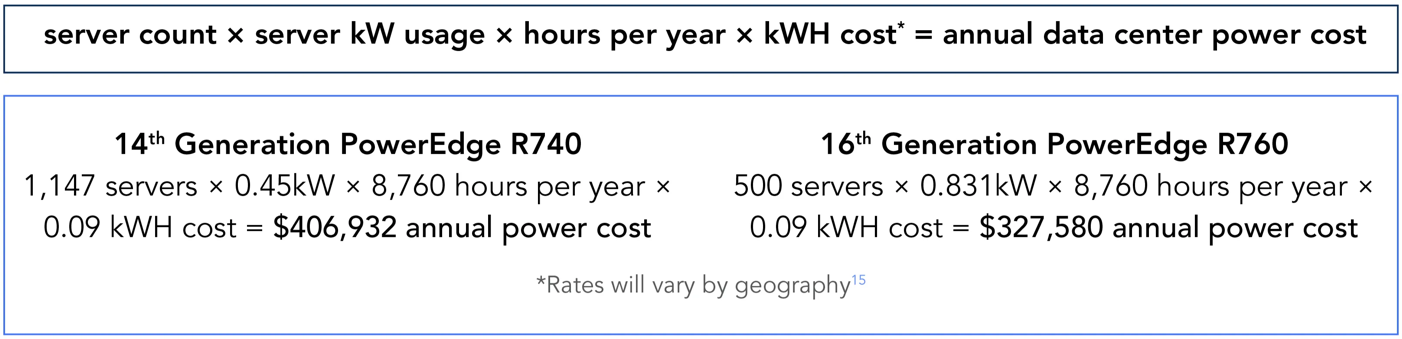
Figure 7: Calculations showing the annual power cost of the servers in US dollars. Lower is better. Source: Principled Technologies.[15]
Sustainability challenges
As new technologies and data proliferation have increased the demands on data center performance and capacity, sustainability concerns have begun to put pressure on companies to increase the efficiency and reduce the carbon footprint of their data centers. By some estimates, the carbon footprint of data centers worldwide equals that of the airline industry.[16] According to S&P Global Market Intelligence, “the data center industry faces pressure from multiple sources— including government, financial markets, and corporate clients—to improve sustainability and reduce carbon emissions.”[17] Over the last few years, businesses have contended with volatile energy prices that have trended higher.[18] For many companies, the energy consumption of their servers is a significant expense.[19]
The sustainability challenges related to data centers are not limited to carbon emissions. Many data centers use large amounts of water to cool their servers. According to the U.S. Department of Energy, an average data center that uses evaporative cooling can consume 3 to 5 million gallons of water per day— similar to the daily capacity of a city of 30,000-50,000 people.[20] Roughly 20 percent of data centers in the U.S. rely on watersheds that are under stress from drought.[21] Choosing more efficient servers can help organizations meet internal and external climate goals and reduce their water usage and carbon footprints.
Managing costs over time
So far in this report we have explained why choosing the PowerEdge R760 to meet new capacity needs can save money and provide better performance, but what about organizations considering upgrading to newer, more efficient servers? In addition to the savings associated with reducing cooling costs, businesses that upgrade older servers may also save money by avoiding some of the other costs associated with delaying their server replacements. Older servers become more expensive to operate as they age. According to analysis by IDC, businesses reported an average annual operating cost of $7,541 per server during the first three years of use; during years 4 to 6, those servers reached a high of an average of $22,511 per server, a 199 percent increase.[22] Upgrading aging servers can reduce the amount of time IT spends on compliance, maintenance, and security, as newer servers often include the most recent manageability and security features. Aging servers may also contribute to slower response times and a diminished customer experience. Research by Deloitte found that “with a 0.1s improvement in site speed…consumers spent almost 10 percent more” on retail sites.[23] Upgrading to the latest-generation server technology can provide a better user experience.
Historically, server manufacturers have improved the performance of their systems in parallel with the growing demand for data processing, but the ever increasing reliance on data processing plus the rapid growth of resource-hungry technologies such as ML and AI have combined to make data center processing and power consumption challenges even more urgent. ML and AI workloads require a large amount of processing power, and therefore can lead to data centers running at higher power densities, which creates more demand on cooling systems. Some analysts estimate the use of ML will grow at a compound annual growth rate of 35.6 percent until 2030.[24] Data centers will need more powerful, more energy-efficient systems to keep up with this growing demand.
According to the International Monetary Fund (IMF), “energy prices surged to near historic highs in recent years amid the pandemic and the war in Ukraine.”[25] In their latest World Economic Outlook forecast, the IMF predicted “that growth will slow from 3.4 percent last year to 2.8 percent this year.”[26] Faced with volatile energy prices and growing economic uncertainty, many organizations are looking for ways to lower computing costs without sacrificing performance. Organizations can potentially gain performance and reduce cooling costs by upgrading their servers to more powerful models that consume less energy under load. Upgrading to more efficient servers can also help businesses meet their climate change goals.
Server power consumption
In the last two decades, server capabilities have increased dramatically, becoming more powerful and more efficient. While businesses have benefited from the advanced analytics and data processing capabilities of these new servers, they have come at a cost due to the energy required to run them. The design of a server and its components determine how much power it will consume during operation.
Thermal design power
Thermal design power (TDP) refers to the maximum theoretical amount of power, measured in watts, a computer chip (typically a processor or peripheral component) uses.
TDP can be a helpful starting point in considering what the total power draw of a server could be or what power supplies the server should be equipped with. Using these wattage approximations and other server energy usage information, data center designers can calculate the approximate British Thermal Units (BTUs) a data center will need for cooling. Because of advancements in technology and performance such as increased core count, the TDP of many processors has doubled in the last few years, making power considerations even more significant.[27]
Key factors in server design that affect power consumption
Multiple factors in server design affect power consumption. In many servers, the central processor uses more power than other components. Based on some models, the processor can consume as much as 32 percent of the server’s power.[28] A study by the Swedish Energy Agency examined data center and server energy consumption and found, “the central processing unit (CPU) is the largest contributor to the total server power consumption, followed by peripheral slots (including network card slot and input and output devices (I/O) devices), conduction losses, memory, motherboard, disk/storage, and cooling fan.”[29]
CPUs are, of course, not the only components that require power. Every component in a server consumes power, from disks to graphics processing units (GPUs) to power supply units (PSUs), and can therefore impact the server’s power efficiency. Adding more disks or GPUs might increase the server’s power consumption, while using fewer disks or no GPUs might decrease it. Similarly, using a higher efficiency power supply can reduce a server’s power consumption—according to one source, by 3 to 4 percent.[30]
The NIC also has an impact on the power consumption of a server. Based on the specifications Broadcom lists for the NICs in the servers we tested, the 100Gb Broadcom BCM957508-P2100G NIC in the PowerEdge R760 typically draws 16.0W and the 25Gb BCM957414-P225p NIC in the PowerEdge R740 typically draws 10.9W with Passive DAC at 55°C ambient temperature.[31] This means that choosing the PowerEdge R760 instead of the PowerEdge R750 would provide a NIC with four times the raw capacity that draws less than 50 percent more power. Based on the specifications Broadcom lists for a 10Gb BCM57712 NIC with the same configuration as the one in the PowerEdge R740 we tested, we estimate that selecting the PowerEdge R760 over the PowerEdge R740 would provide a NIC with ten times the raw capacity that draws less than 80 percent more power.[32]
Data center cooling
Cooling is critical to a data center’s operation because poorly managed heat can lead to “downtime, damage to critical components, and a shorter lifespan for equipment.”[33] A data center’s cooling generally falls into two categories: direct cooling of the servers and cooling the data center floor. Inside the servers, cooling technologies focus on moving the heat that the server generates away from the devices. On the data center floor, cooling technologies focus on maintaining a comfortable—if warm—ambient room temperature.[34]
The most common cooling system data centers use is a computer room air conditioner (CRAC). A CRAC works the same way as a residential air conditioner, but is inside of a server room. The CRAC method is energy inefficient but one of the most affordable methods of data center cooling.[35] A more energy-efficient method of cooling a data center is evaporative cooling. However, this requires a large amount of water, so it is not always the most environmentally friendly option depending on the watershed in the location of the data center.
Dell incorporated several cooling technologies into 16th Generation PowerEdge servers to help organizations meet the demands of reducing energy costs and environmental impact. These include high-performing fans and redesigned heatsinks to improve airflow and thermal management.[36] According to Dell, high airflow “is achieved using new impedance airflow paths, new storage backplane ingredients, and optimized mechanical structures all tuned to provide up to a 15% higher airflow compared to traditional designs.”[37] Software solutions such as OME Power Manager will automatically adjust power usage based on policies that admins can customize. To learn more about the power management benefits of OME, visit https://www.principledtechnologies.com/Dell/OpenManage-Power-Manager-1122.pdf.
Conclusion
Organizations don’t have to choose between saving money, doing more work, and using less energy; the new 16th Generation Dell PowerEdge R760 servers with Broadcom NICs do all three. In our hands-on testing, the new 16th Generation Dell PowerEdge R760 server featuring a Broadcom NIC offered 166.1 percent more Ops/s per US dollar, 129.5 percent more Ops/s, and 24.2 percent better performance per watt than the 14th Generation Dell PowerEdge R740 server. This means the PowerEdge R760 with a Broadcom NIC did over twice as much work at a lower cost with nearly 25 percent better power efficiency than the PowerEdge R740. When compared to the 15th Generation Dell PowerEdge R750, the PowerEdge R760 processed 29.8 percent more Ops/s at a lower cost in terms of Ops/s per US dollar and offered 3.8 percent better performance per watt.
In addition to lowering cooling costs and carbon emissions, choosing the latest-generation servers can help businesses lower other operating costs, such as maintenance and security compliance. Because the latest-generation Dell PowerEdge R760 servers offer more compute capacity, fewer servers can do more work, potentially reducing licensing costs and the physical footprint of a data center. Newer servers often feature the most recent manageability and security features, which can make it easier for businesses to manage their servers and protect their data. By choosing servers with better performance, businesses can reduce the response time of their systems and provide a better user experience.
Increasingly, businesses are under pressure to reduce the energy consumption and cost of their data centers while maintaining or increasing performance. Key web technologies such as Redis can offer businesses a competitive edge, but they also require a large amount of data processing. Businesses can meet these challenges with Dell PowerEdge R760 servers with Broadcom NICs that offer better cost-efficiency, performance, and power-efficiency.
This project was commissioned by Dell Technologies.
September 2023
Principled Technologies is a registered trademark of Principled Technologies, Inc.
All other product names are the trademarks of their respective owners.
[1] Redis, “Low-latency message queue & broker software,” accessed June 20, 2023, https://redis.com/solutions/use-cases/messaging/.
[2] Redis, “What is Redis?,” accessed June 20, 2023, https://aws.amazon.com/redis/.
[3] Prices obtained from Dell Marketing, US only. We used list pricing because it was the only pricing readily available for all three servers and because discounts vary.
[4] Redis, “Low-latency message queue & broker software.”
[5] Redis, “memtier_benchmark: A High-Throughput Benchmarking Tool for Redis and Memcached,” accessed June 15, 2023, https://redis.com/blog/memtier_benchmark-a-high-throughput-benchmarking-tool-for-redis-memcached/.
[6] Dell, “PowerEdge R760 Rack Server,” accessed June 7, 2023, https://www.dell.com/en-us/shop/productdetailstxn/poweredge-r760.
[7] Dell, “PowerEdge R760 Rack Server.”
[8] Dell.
[9] Broadcom, “BCM57508 – 200GbE,” accessed June 5, 2023, https://www.broadcom.com/products/ethernet-connectivity/network-adapters/bcm57508-200g-ic.
[10] Broadcom, “BCM57508 – 200GbE.”
[11] Broadcom.
[12] Timothy Prickett Morgan, “The Interesting Years Ahead for Servers,” accessed June 11, 2023, https://www.nextplatform.com/2023/01/04/the-interesting-years-ahead-for-servers/.
[13] Timothy Prickett Morgan, “The Interesting Years Ahead for Servers.”
[14] OliverWyman, “Machine Learning: Competitive Advantage and Strategic Imperative,” accessed June 11, 2023, https://www.oliverwyman.com/our-expertise/insights/2016/nov/Machine-Learning-Competitive-Advantage-and-Strategic-Imperative.html.
[15] Mary Zhang, “United States Data Centers: Top 10 Locations,” accessed July 27, 2023, https://dgtlinfra.com/united-states-data-centers/.
[16] S&P Global Market Intelligence, “Sustainability is no longer a ‘nice to have’ goal for the data center industry,” accessed June 14, 2023, https://www.spglobal.com/marketintelligence/en/news-insights/research/sustainability-is-no-longer-a-nice-to-have-goal-for-the-data-center-industry.
[17] S&P Global Market Intelligence, “Sustainability is no longer a ‘nice to have’ goal for the data center industry.”
[18] Lori Aniti, “Wholesale U.S. electricity prices were volatile in 2022,” accessed June 14, 2023, https://www.eia.gov/todayinenergy/detail.php?id=55139.
[19] InfoQ, “The Problem of Power Consumption in Servers,” accessed June 14, 2023, https://www.infoq.com/articles/power-consumption-servers/.
[20] Marcus Law, “Energy efficiency predictions for data centres in 2023,” accessed June 14, 2023, https://datacentremagazine.com/articles/efficiency-to-loom-large-for-data-centre-industry-in-2023.
[21] Michael Copley, “Data centers, backbone of the digital economy, face water scarcity and climate risk,” accessed June 14, 2023, https://www.npr.org/2022/08/30/1119938708/data-centers-backbone-of-the-digital-economy-face-water-scarcity-and-climate-ris.
[22] IDC, “Optimizing Performance with Frequent Server Replacements for Enterprise,” accessed June 12, 2023, https://www.delltechnologies.com/asset/en-us/products/servers/industry-market/server-infrastructure-resiliency-enterprise-whitepaper.pdf.
[23] Deloitte, “Milliseconds make Millions,” accessed June 12, 2023, https://www2.deloitte.com/content/dam/Deloitte/ie/Documents/Consulting/Milliseconds_Make_Millions_report.pdf.
[24] GVR, “Machine Learning Industry Data Book,” accessed June 14, 2023, https://www.grandviewresearch.com/sector-report/machine-learning-industry-data-book.
[25] Adil Mohommad, Mehdi Raissi, Kyuho Lee, Chapheng Fizzarotti, “IMF Blog: Volatile Commodity Prices Reduce Growth and Amplify Swings in Inflation,” accessed May 17, 2023, https://www.imf.org/en/Blogs/Articles/2023/03/28/volatile-commodity-prices-reduce-growth-and-amplify-swings-in-inflation.
[26] Mehdi Benatiya Andaloussi, Chiara Maggi, “IMF Blog: World Economic Outlook Shows Economies Facing High Uncertainty,” accessed June 21, 2023, https://www.imf.org/en/Blogs/Articles/2023/04/19/world-economic-outlook-shows-economies-facing-high-uncertainty.
[27] Robert Curtis et al, The Future of Server Cooling,” accessed June 8, 2023, https://infohub.delltechnologies.com/p/the-future-of-server-cooling-part-2-new-it-hardware-features-and-power-trends-1/.
[28] Kazi Main Uddin Ahmed, Manuel Alvarez, Math Bollen, “A Review of Data Centers Energy Consumption And Reliability Modeling,” accessed June 14, 2023, https://www.researchgate.net/publication/355862079_A_Review_of_Data_Centers_Energy_Consumption_And_Reliability_Modeling#pf8.
[29] Kazi Main Uddin Ahmed, Manuel Alvarez, Math Bollen, “A Review of Data Centers Energy Consumption And Reliability Modeling.”
[30] Patrick Kennedy, “Deep Dive into Lowering Server Power Consumption,” accessed June 8, 2023, https://www.servethehome.com/deep-dive-into-lowering-server-power-consumption-intel-inspur-hpe-dell-emc/.
[31] Broadcom, “Broadcom Eternet NICs,” accessed July 25, 2023, https://docs.broadcom.com/doc/PCIe-NIC-Ethernet-Adapters-Specification-Sheet.
[32] Allied Telesis, “Broadcom NetXtreme II® Network Adapter User Guide,” accessed July 25, 2023, https://www.alliedtelesis.com/sites/default/files/documents/installation-guides/brcm_nx2_server_t7-10.pdf.
[33] Datacenters.com, “Data Center Cooling: Future of Cooling Systems, Methods and Technologies,” accessed June 6, 2023, https://www.datacenters.com/news/data-center-cooling-future-of-cooling-systems-methods-and-technologies.
[34] Brien Posey, “Data center temperature and humidity guidelines,” accessed June 20, 2023, https://www.techtarget.com/searchdatacenter/tip/Data-center-temperature-and-humidity-guidelines.
[35] LDP Associates, “What are the Different Types of Data Center Cooling?,” accessed June 21, 2023, https://www.ldpassociates.com/what-are-the-different-types-of-data-center-cooling/.
[36] Matt Ogle and Hasnain Shabbir, “Multi Vector Cooling 2.0 for Next-Generation PowerEdge Servers,” accessed September 8, 2023, https://infohub.delltechnologies.com/p/multi-vector-cooling-2-0-for-next-generation-poweredge-servers/.
[37] Dell, “The Future of Server Cooling - Part 2: New IT hardware Features and Power Trends,” accessed July 25, 2023, https://infohub.delltechnologies.com/p/the-future-of-server-cooling-part-2-new-it-hardware-features-and-power-trends-1/.
Author: Principled Technologies

A Path to Virtualization at the Edge
Thu, 14 Mar 2024 16:47:05 -0000
|Read Time: 0 minutes

Get next-generation performance at the edge from the Dell PowerEdge XR family of servers
Executive Summary
Edge sensors and devices generate data on a massive scale. And much of the data is generated in rugged environments. Heavy machinery used in underground mining operations, for example, can be outfitted with smart sensors to monitor gas concentrations, air quality, and temperature. Once this data is captured by a high-performance edge server, an analytics application processes the data to generate real-time insights.
Prowess Consulting investigated options for organizations looking for rugged edge servers with the performance needed for compute-intensive analytics. We started by evaluating the Dell™ PowerEdge™ XR7620 server, a member of Dell Technologies’ PowerEdge XR rugged servers portfolio. We looked at performance, durability, and compliance to military and telecom industry standards.
We then compared the PowerEdge XR7620 server to the PowerEdge XE2420 server, a previous-generation rugged edge server, and observed significant generational performance gains. Finally, we compared the PowerEdge XR7620 server to another member of the PowerEdge XR family, the PowerEdge XR4000 series servers. This helped us summarize key differences between the PowerEdge XR7620 server and the PowerEdge XR4000 series. We found that, for organizations looking for the ideal edge server, the PowerEdge XR7620 server delivers high performance, including excellent virtualization capabilities and VMware vSAN™ performance, whereas the PowerEdge XR4000 series servers deliver excellent density and deployment flexibility.
Life at the Edge
Modern businesses are processing more data at the edge. This brings a unique set of requirements for edge servers: the need for high performance, the ability for a server to fit into tiny spaces, and the ability to tolerate the extremes of remote field deployments whether on a manufacturing floor or in a busy retail environment.
Workloads like data analytics and AI/ML that process data at the edge drive the need for high performance. Decoupled from your data center, servers at the edge combat a host of environmental and logistical challenges. A factory that combines Internet of Things (IoT) and digital twin technologies to automate resource allocation and optimize efficiency through analytics and AI will need servers on the factory floor to generate actionable data. And that means exposure to heat, vibration, dust, and more.
How your organization addresses the dual considerations of performance and durability inherent to edge computing is key. Regardless of your solution, maximizing performance and safeguarding against harsh environments is critical.
The PowerEdge XR7620 Server: Performance and Durability at the Edge
Performance
Research by Prowess Consulting shows that the new PowerEdge XR7620 server, powered by 4th Gen Intel® Xeon® Scalable processors, can meet the challenges of ensuring performance and durability. The PowerEdge XR7620 server is a two-socket server featuring data center–level compute with high performance, high capacity, and reduced latency. Moreover, its rugged form factor ensures performance-protecting durability, from military deployments to the factory floor. The PowerEdge XR7620 server can process and analyze data at the point of capture for maximum impact when away from the data center. Given its high performance, the PowerEdge XR7620 server excels at tasks like virtualization.
The PowerEdge XR7620 server also offers compact GPU- and CPU-optimized variants to further customize performance.
Durability
The PowerEdge XR7620 server—like the entire PowerEdge XR family—is purpose-built to withstand the most extreme environments. It can handle dust, humidity, extreme temperatures, shocks, and more. And it’s both MIL-STD-810G and Network Equipment Building System (NEBS) Level 3, GR-3108 Class 1, tested[1]. This means the PowerEdge XR7620 server is compliant with edge-computing standards for both the telecom industry (NEBS Level 3) and military-related applications (MIL-STD-810G). These are foundational requirements, and we dove deeper into their importance.
NEBS Level 3
“NEBS describes the environment of a typical United States Regional Bell Operating Company (RBOC) central office. NEBS is the most common set of safety, spatial, and environmental design standards applied to telecommunications equipment in the United States. It is not a legal or regulatory requirement, but rather an industry requirement.”[2]
NEBS levels relate primarily to the telecom industry and are rated 1–3. Whereas NEBS Levels 1 and 2 are essentially office-based and targeted toward more controlled environments like data centers, NEBS Level 3 is the standard. It’s what telecom and network providers base their installation requirements on, as this level ensures equipment operability. It also requires the most time, effort, and cost in terms of design and maintenance.
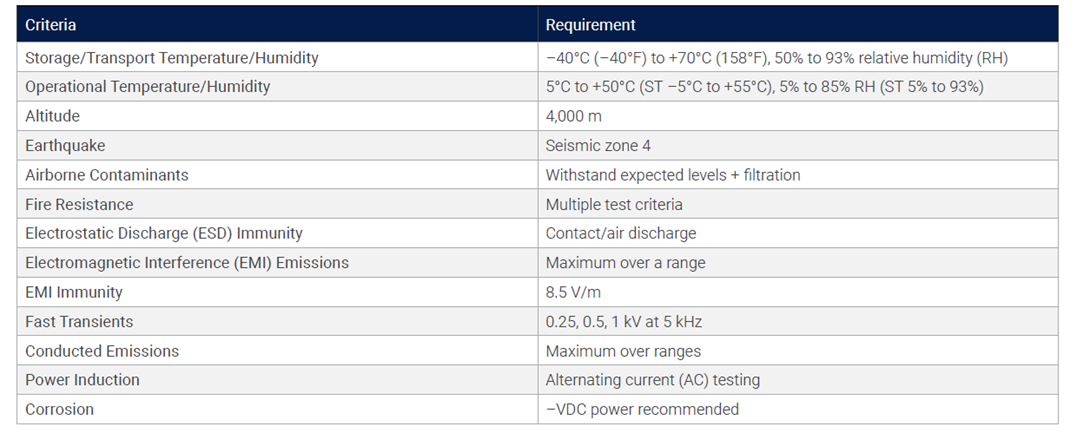
Table 1 illustrates the specific requirements for NEBS Level 3.
Table 1. NEBS Level 3 requirements[3]
MIL-STD
“This Standard contains materiel acquisition program planning and engineering direction for considering the influences that environmental stresses have on materiel throughout all phases of its service life. It is important to note that this document [the MIL-STD-810G standard] does not impose design or test specifications. Rather, it describes the environmental tailoring process that results in realistic materiel designs and test methods based on materiel system performance requirements.”[4]
A military standard (MIL-STD) is a US defense standard that centers around ensuring standardization and interoperability for the products used by the US Department of Defense (DoD). There are different standards for specific use cases and industries, and the PowerEdge XR7620 server specifically addresses the 810G standard. The 810G standard centers around environmental engineering and testing, and it provides a rigorous framework—rather than universal guidelines—for vetting potential deployments through extensive testing.
Figure 1 shows a decision tree from the 810G standard guidelines that illustrates how rigorous and extensive the requirements for testing are to meet 810G compliance.
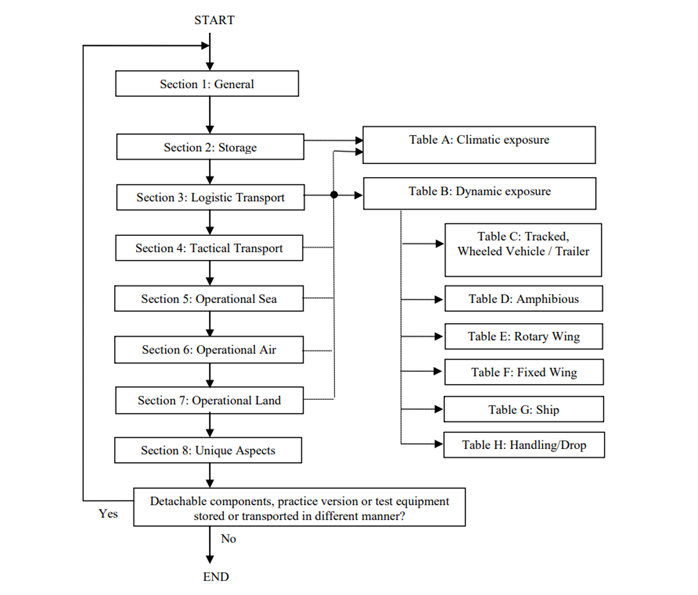
Figure 1. A decision tree from the MIL-STD-810G guidelines[5]
The PowerEdge XR7620 Server: A New Generation
Prowess Consulting examined the performance difference between the PowerEdge XR7620 server and the previous-generation PowerEdge XE2420 server. We began by comparing the processors between the generations.
The 4th Gen Intel Xeon Scalable processors that power the PowerEdge XR7620 server provide a number of benefits over the 2nd Gen Intel Xeon Scalable processors that power the PowerEdge XE2420 server. These benefits include:
- 1.53x average generation-on-generation performance improvement[6]
- Up to 1.60x higher input/output operations per second (IOPS) and up to 37% latency reduction for large-packet sequential reads using integrated Intel® Data Streaming Accelerator (Intel® DSA) versus the prior generation[7]
- Up to 95% fewer cores and 2x higher level-1 compression throughput using integrated Intel® QuickAssist Technology (Intel® QAT) versus the prior generation[8]
We then reviewed the top-line specs between the PowerEdge XE2420 server and the PowerEdge XR7620 server, shown in Table 3 in the Methodology section. These specs show a clear and consistent improvement between generations. Further analysis of SPEC® CPU 2017 Integer and Floating Point (FP) rates—both of which measure CPU processing power by integer and floating point rates, respectively—shows the same generational increase, with the PowerEdge XR7620 server and its 4th Gen Intel Xeon Scalable processors the clear winner. These results are shown in Figures 2 and 3.
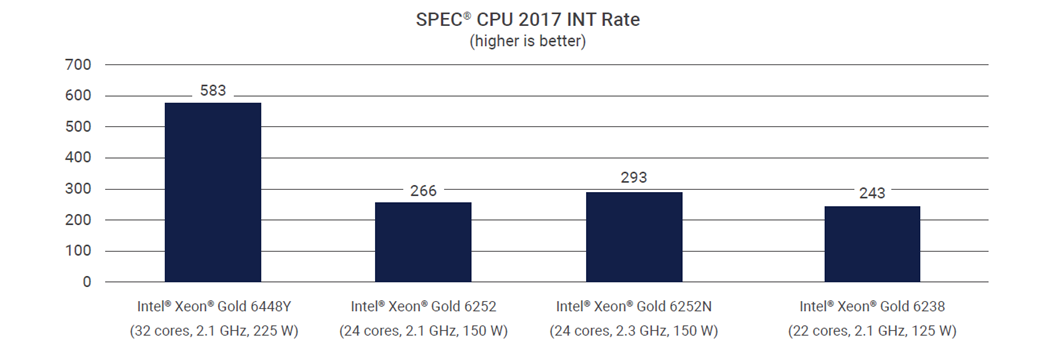
Figure 2. SPEC® CPU INT Rate for the Dell™ PowerEdge™ XR7620 server (with an Intel® Xeon® Gold 6448Y processor) versus the PowerEdge XE2420 server (with Intel Xeon Gold 6252, Intel Xeon Gold 6252N, and Intel Xeon Gold 6238 processors)[9]
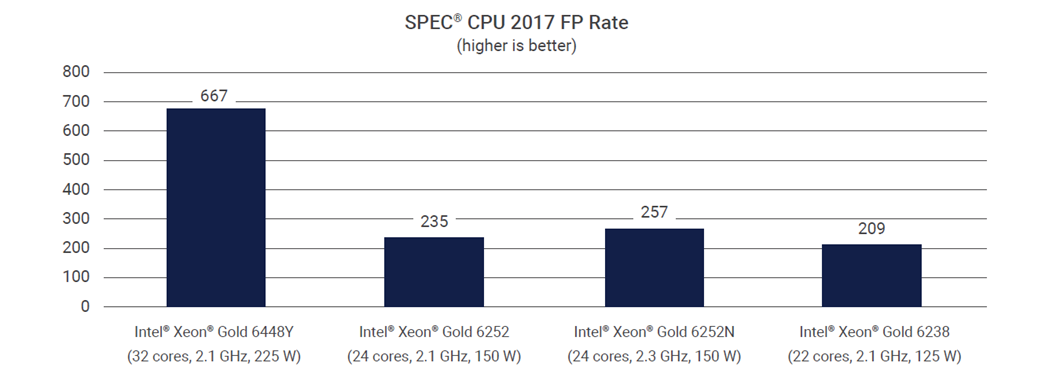
Figure 3. SPEC® CPU FP rate for the Dell™ PowerEdge™ XR7620 server (with an Intel® Xeon® Gold 6448Y processor) versus the PowerEdge XE2420 server (with Intel Xeon Gold 6252, Intel Xeon Gold 6252N, and Intel Xeon Gold 6238 processors)9
This performance improvement between generations can also be seen by comparing VMware vSAN deployments. The PowerEdge XE2420 server and the PowerEdge XR7620 server can both implement two-node vSAN deployments. However, as noted previously, the PowerEdge XR7620 server will be more performant with those deployments. This higher level of performance doesn’t just come from the upgraded processor, either. The 4th Gen Intel Xeon Scalable processors in the PowerEdge XR7620 are optimized to take full advantage of the new features and software improvements in VMware vSphere® 8, including GPU- and CPU-based acceleration.
The PowerEdge XR Family
Before we examine the Dell PowerEdge XR family of servers in more detail, Figure 4 provides a quick visual reference of the servers discussed in this report.
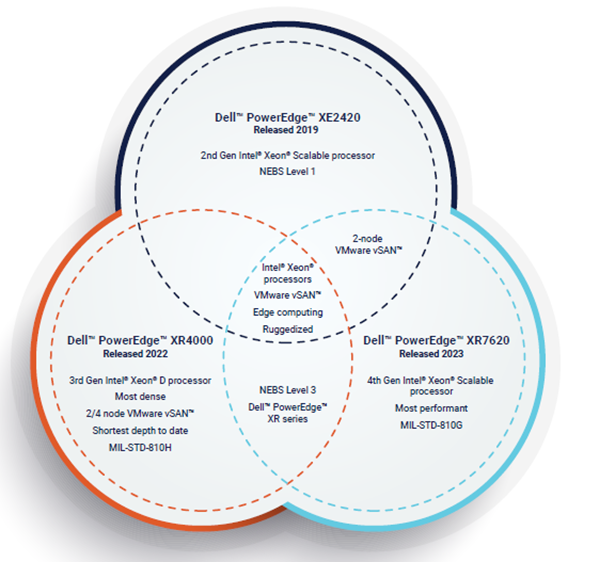
- Venn diagram of the Dell™ PowerEdge™ XE2420, XR7620, and XR4000 series servers
VMmark® Examination of PowerEdge XR7620 and PowerEdge XR4000 Series Servers
The PowerEdge XR7620 server is part of the PowerEdge XR family of servers, all of which are built to handle the most extreme environments while still delivering performance and reliability. We wanted to examine the PowerEdge XR7620 server alongside some of its “younger siblings,” the PowerEdge XR4000 series servers, and investigate the inter-generational differences. (While not discussed in this study, PowerEdge XR8000 series servers provide excellent flexibility and stability, and would be the “elder sibling” in the family.)
To do this, we analyzed VMmark® results for both the PowerEdge XR4510c (representing the PowerEdge XR4000 series) and the PowerEdge XR7620, shown in Table 4 in the Methodology section. VMmark is a tool for hardware vendors and others to measure the performance, scalability, and power consumption of virtualization platforms. VMmark allows for: benchmarking of virtual data center performance and power consumption; comparing performance and power consumption between different virtualization platforms; and examining how changes in hardware, software, or configuration affect performance within the virtualization environment.[10]
The VMmark results show the PowerEdge XR7620 server can achieve more performance across more tiles (fourteen versus four). These results also illustrate what can be achieved with a full, dual-socket server with the latest-generation processors in a short-depth, 2U ruggedized chassis at the edge. Moreover, the 4th Gen Intel Xeon Scalable processors in the PowerEdge XR7620 server also account for the higher performance. While the PowerEdge XR7620 server’s overall performance wins are expected, what’s missing is how performant at the edge PowerEdge XR4000 series servers are. Given the smaller size and shorter form factor overall, the PowerEdge XR4000 series servers are very performant relative to size, and they are an excellent option when a smaller, denser, more flexible deployment is called for. Moreover, their redundancy allows for more hardware failures, making them resilient and durable.
- Optional witness node on the Dell™ PowerEdge™ XR4000 series servers[11]
VMware vSAN is an “enterprise-class storage virtualization software that provides the simplest path to hyperconverged infrastructure (HCI) and multi-cloud.”[12] VMware vSAN is widely deployed, so we also compared vSAN deployments inter-generationally. While the PowerEdge XR7620 server (and PowerEdge XE2420 server, too) can implement two-node vSAN deployments, PowerEdge XR4000 series servers can implement four-node vSAN deployments. Additionally, the PowerEdge XR7620 server can also be deployed in a two-node architecture using a vSAN witness appliance to take advantage of the many benefits of vSAN—especially its performance benefits. While both servers take advantage of vSAN, the PowerEdge XR7620 server will offer more overall performance, whereas PowerEdge XR4000 series servers offer the highest density in the smallest form factor.
There is, however, another significant benefit to the upgraded PowerEdge XR7620 server: power savings and sustainability. As Table 4 in the Methodology section shows, the PowerEdge XR7620 server offers double the cores of the PowerEdge XR4510c server tested for less than double the wattage, resulting in a smaller power draw when the PowerEdge XR7620 is deployed the edge. The PowerEdge XR7620 server reduces power consumption, leading to higher energy efficiency and power availability for the PowerEdge XR7620 server. The reduced power consumption can also potentially lower total cost of ownership (TCO) and help meet your business’s sustainability goals.
Potential PowerEdge XR Family Use Cases
The PowerEdge XR family of servers has use cases in retail, manufacturing, defense, and telecom. We explore two specific use cases in the following sections.
The PowerEdge XR7620 Server: Autonomous Driving
Let’s examine how the PowerEdge XR7620 server—which excels at virtualization—might perform in a real-world setting in the auto industry. As demand increases for technologies such as advanced driver assistance systems (ADAS) and autonomous driving capabilities, the industry needs more efficient development and testing. Virtualization is a key strategy for generating this efficiency, and it’s leading to a change in the way vehicles are designed, developed, manufactured, tested, and maintained.[13]
As software becomes increasingly essential to the average vehicle, updating that software as efficiently as possible becomes a customer pain point and a business requirement. Vast amounts of data are generated when physically testing the update process in the factory or out on the track. You’ll need a high-performance server to capture and process that data as it’s generated for the fastest analytics and most actionable insights possible. Moreover, the 4th Gen Intel Xeon Scalable processors in the PowerEdge XR7620 server are optimized to use the software upgrades in vSphere 8, allowing you to modernize your hardware and software as you replace aging assets, while increasing capacity.
Additionally, this server must be able to withstand the dust and temperature fluctuations of the factory, or the vibrations and humidity of the track, or a host of other adverse conditions. The PowerEdge XR7620 server meets both performance and durability needs, offering the levels of performance required for intense data analytics and the ruggedized form factor required at the edge.
PowerEdge XR4000 Series Servers: Telecom Deployments
Let’s take a proper look at PowerEdge XR4000 series servers now. If the PowerEdge XR7620 server is at home on the factory floor, then the PowerEdge XR4000 series server is at home under the cell tower. While the PowerEdge XR7620 server is built for durability, PowerEdge XR4000 series servers are especially rugged and come in Dell’s smallest form factor for flexibility and customization in the most difficult deployments. They are NEBS Level 3 and MIL-STD-810H tested.[14] Moreover, their four sleds in a single 2U chassis offer excellent scalability and portability when in the field. They have “rackable” and “stackable” configuration options for maximum deployment flexibility, and they support multiple configurations within each option. And PowerEdge XR4000 series servers do so while still offering the high performance needed for analytics and virtualization at the edge.
Finding an Edge Within the PowerEdge XR Family
While the PowerEdge XR family of servers all feature a ruggedized, short-depth form factor, there’s a spectrum of purpose-built options to consider, varying from maximum performance at one end to maximum density and durability at the other.
As our research shows, the PowerEdge XR7620 server is an excellent choice for maximum performance within the PowerEdge family of servers examined. It’s powered by the next-generation Intel Xeon Gold 6448Y processor, giving the PowerEdge XR7620 server excellent virtualization capabilities and vSAN performance. And the PowerEdge XR7620 server does all this in a ruggedized, short-depth form factor that provides the durability required for intense edge computing.
The PowerEdge XR7620 Server: Under the Hood
The performance of the PowerEdge XR7620 server shouldn’t be seen as a simple generational update. It owes some of its performance to the 4th Gen Intel Xeon Scalable processors and the Dell™ PowerEdge RAID Controller 12 (PERC 12).
Intel® Xeon® Gold 6448Y Processor
The Intel Xeon Gold 6448Y processor found in the PowerEdge XR7620 server is based on 4th Gen Intel Xeon Scalable processor architecture, representing a serious upgrade from 2nd and 3rd Gen processors in several ways. With double the cores, a higher max turbo frequency, and a larger cache than the previous model’s processor, the Intel Xeon Gold 6448Y processor is built for performance. Moreover, the processor features Intel DSA, which helps speed up data movement and improve transformation operations to increase performance for storage, networking, and data-intensive workloads.[15]
Dell™ PERC 12
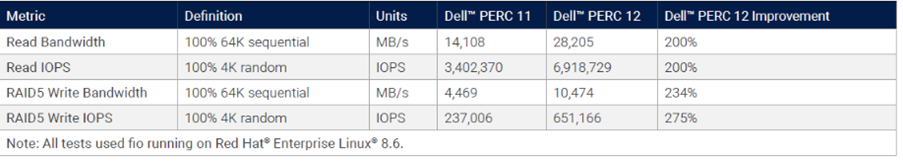
PERC 12, Dell’s latest RAID controller, features the new Broadcom® SAS4116W series chip and offers increased capabilities compared with its predecessor, PERC 11. These capabilities include support for 24 gigabits per second (Gb/s) Serial-Attached SCSI (SAS) drives, increased cache memory speed, and a single front controller that supports both NVM Express® (NVMe®) and SAS. Table 2 shows the generational improvement between PERC 11 and PERC 12.[16]
Table 2. IOPS/bandwidth comparison between the Dell™ PERC 11 and PERC 12 controllers16
PowerEdge XR4000 Series Servers: Inside the Box
At the density end of the spectrum, we have the PowerEdge XR4000 series servers. These are Dell Technologies’ shortest-depth servers to date: modular 2U servers with a sled-based design for maximum flexibility. They come in two new 14”-depth form factors called “rackable” and “stackable,” and they offer rack or wall mounting options.
PowerEdge XR4000 series servers also feature an optional nano-server-sled that can serve as an in-chassis witness node for the vSAN cluster. This replaces the need for a virtual witness node and establishes a native, self-contained, two-node vSAN cluster—even in the 14” x 12” stackable configuration. You can choose between two and four nodes in a chassis while still using vSAN because of the in-chassis witness node. This makes virtual machine (VM) deployments possible where latency or bandwidth constraints previously prevented doing so. PowerEdge XR4000 series servers offer high-performance edge computing in a form factor small enough to fit in a backpack.[17] This form factor and size also lead to high computing density, which is the measurement of the amount of information that can be stored and processed in a given area to determine efficient use of space.
When Rugged Matters as Much as Performance
Our research concludes that the Dell PowerEdge XR family of servers is a great option for organizations looking for reliable, high-performing servers in ruggedized, short-depth form factors designed specifically for edge computing. Among the range of PowerEdge XR family servers examined by Prowess, the PowerEdge XR7620 server represents a solid upgrade from the previous generation, and is the performance-focused offering in the new PowerEdge XR family of servers. PowerEdge XR4000 series servers are the high-density, performant option when durability and space constraints are primary concerns.
Learn More
For more information on the Dell PowerEdge XR7620 server, see “Dell’s PowerEdge XR7620 for Telecom/Edge Compute” and the PowerEdge XR7620 server product page.
For more information on the new offerings in the PowerEdge XR family, see “Dell PowerEdge Gets Edgy with XR8000, XR7620, and XR5610 Servers.”
Methodology
Table 3 shows the configuration details for the comparison between the PowerEdge XE2420 server and the PowerEdge XR7620 server.
Table 3. Dell™ PowerEdge™ XR7620 server versus PowerEdge XE2420 server comparison
Server | ||
Processor | 2nd Gen Intel® Xeon® Scalable processors | 4th Gen Intel® Xeon® Scalable processors |
Cores per Processor | Up to 24 | Up to 32 |
Number of Processors Supported | 2 | 2 |
Memory | 16 x DDR4 RDIMM/LR-DIMM (12 DIMMs are balanced), up to 2,993 megatransfers per second (MT/s) | 16 x DDR5 DIMM slots, supports RDIMM 1 TB max, speeds up to 4,800 MT/s; supports registered error correction code (ECC) DDR5 DIMMs only |
Drive Bays | Up to 4 x 2.5-inch SAS/SATA/NVMe® solid-state drives (SSDs); up to 6 Enterprise and Data Center SSD Form Factor (EDSFF) drives | Front bays: Up to 4 x 2.5-inch SAS/SATA/NVMe® SSDs, 61.44 TB max; up to 8 x E3.S NVMe® direct drives, 51.2 TB max |
Dimensions | 2 x 2.5-inches or 4 x 2.5 with seven possible configurations | Rear-accessed configuration:
Front accessed configuration:
|
Weight | 17.36 kg (38.19 pounds) to 18.93 kg (41.65 pounds), depending on configuration | Max 21.16 kg (46.64 pounds) |
Form Factor | 2U rack | 2U rack |
Table 4 shows the configuration details for the VMmark comparison between the two PowerEdge XR family servers.
Table 4, VMmark® comparison between the Dell™ PowerEdge™ XR7620 server and the PowerEdge XR4510c server
VMmark® 3.1.1 Results | ||
Summary | ||
Category | Dell™ PowerEdge™ XR4510c[23] | Dell™ PowerEdge™ XR7620[24] |
VMmark® 3 Average Watts | 1,085.50 | 1,878.63 |
VMmark® 3 Applications Score | 4.93 | 14.08 |
VMmark® 3 Infrastructure Score | 2.15 | 1.06 |
VMmark® 3 Score | 4.37 | 11.48 |
VMmark® 3 PPKW | 4.0285 at 4 tiles | 6.1093 at 14 tiles |
Configuration | ||
Server | Dell™ PowerEdge™ XR4510c23 | Dell™ PowerEdge™ XR762024 |
Nodes | 4 physical (with local hardware-based witness node) | 2 (with VMware vSAN™ witness appliance) |
Storage | VMware vSAN™ 8.0—all-flash | VMware vSAN™ 8.0—all-flash |
Hypervisor | VMware ESXi™ 8.0 GA, build 20513097 | VMware ESXi™ 8.0b, build 21203435 |
Data Center Management Software | VMware vCenter Server® 8.0 GA, build 20519528 | VMware vCenter Server® 8.0c, build 21457384 |
Number of Servers in System Under Test | 4 | 2 |
Processor | Intel® Xeon® D-2776NT processor | Intel® Xeon® Gold 6448Y processor |
Processor Speed (GHz)/Intel® Turbo Boost Technology Speed (GHz) | 2.10 GHz/3.20 GHz | 2.10 GHz/4.10 GHz |
Total Sockets/Cores/Threads in Test | 4 sockets/64 cores/128 threads | 4 sockets/128 cores/256 threads |
Memory Size (in GB, Number of DIMMs) | 512 GB, 4 | 2,048 GB, 16 |
Memory Type and Speed | 128 GB 4Rx4 DDR4 3,200 MT/s LRDIMM | 128 GB DDR5 4Rx4 4,800 MT/s RDIMMs |
The analysis in this document was done by Prowess Consulting and commissioned by Dell Technologies.
Results have been simulated and are provided for informational purposes only. Any difference in system hardware or software design or configuration may affect actual performance.
Prowess Consulting and the Prowess logo are trademarks of Prowess Consulting, LLC.
Copyright © 2023 Prowess Consulting, LLC. All rights reserved.
Other trademarks are the property of their respective owners.
[1] Dell. “Dell’s PowerEdge XR7620 for Telecom/Edge Compute.” May 2023. https://infohub.delltechnologies.com/p/dell-s-poweredge-xr7620-for-telecom-edge-compute/.
[2] Cisco. “Cisco Firepower 4112, 4115, 4125, and 4145 Hardware Installation Guide.” June 2023. www.cisco.com/c/en/us/td/docs/security/firepower/41x5/hw/guide/install-41x5.html.
[3] Dell. “Computing on the Edge: NEBS Criteria Levels.” November 2022. https://infohub.delltechnologies.com/p/computing-on-the-edge-nebs-criteria-levels/.
[4] MIL-STD-810. “Environmental Engineering Considerations and Laboratory Tests.” May 2022. https://quicksearch.dla.mil/qsDocDetails.aspx?ident_number=35978.
[5] US Department of Defense. “Environmental Engineering Considerations And Laboratory Tests.” Revision G Change 1 (change incorporated). Figure 402-1. Life Cycle Environmental Profile Development Guide. April 2014. https://quicksearch.dla.mil/qsDocDetails.aspx?ident_number=35978 [then select the "Revision G Change 1 (change incorporated)" document].
[6] Intel. Performance Index (4th Gen Intel Xeon Scalable Processors, G1). Accessed May 2023. www.intel.com/PerformanceIndex.
[7] Intel. Performance Index (4th Gen Intel Xeon Scalable Processors, N18). Accessed May 2023. www.intel.com/PerformanceIndex.
[8] Intel. Performance Index (4th Gen Intel Xeon Scalable Processors, N16). Accessed May 2023. www.intel.com/PerformanceIndex.
[9] Data provided by Dell Technologies in May 2023.
[10] VMware. “VMmark.” Accessed June 2023. www.vmware.com/products/vmmark.html.
[11] Dell. "XR4000w Multi-Node Edge Server (Intel)." Accessed July 2023. https://www.dell.com/en-us/shop/ipovw/poweredge-xr4000w.
[12] VMware. “What Is VMware vSAN?” Accessed July 2023. www.vmware.com/products/vsan.html.
[13] Luxoft. “Achieving the benefits of SDVs using virtualization.” May 2023. www.luxoft.com/blog/virtualization-revolutionizing-software-defined-vehicles-development.
[14] Dell. “Dell PowerEdge XR4000 Specification Sheet.” Accessed June 2023. www.dell.com/en-us/dt/oem/servers/rugged-servers.htm#pdf-overlay=//www.delltechnologies.com/asset/en-us/solutions/oem-solutions/technical-support/dell-oem-poweredge-xr4000-spec-sheet.pdf.
[15] Intel. “Intel® Accelerator Engines.” Accessed June 2023. www.intel.com/content/www/us/en/products/docs/accelerator-engines/overview.html.
[16] Dell. “Dell PowerEdge RAID Controller 12.” May 2023. https://infohub.delltechnologies.com/p/dell-poweredge-raid-controller-12/.
[17] Dell. “VMmark on XR4000.” January 2023. https://infohub.delltechnologies.com/p/vmmark-on-xr4000/.
[18] Intel. “Intel Xeon D2776NT Processor.” Accessed June 2023. https://ark.intel.com/content/www/us/en/ark/products/226239/intel-xeon-d2776nt-processor-25m-cache-up-to-3-20-ghz.html.
[19] Dell. “Dell EMC PowerEdge XE2420 Technical Specifications.” Accessed June 2023. https://dl.dell.com/topicspdf/poweredge-xe2420_reference-guide_en-us.pdf.
[20] Dell. “PowerEdge XE2420 Specification Sheet.” Accessed June 2023. https://i.dell.com/sites/csdocuments/Product_Docs/en/PowerEdge-XE2420-Spec-Sheet.pdf.
[21] Intel. “Intel Xeon Gold 6448Y Processor.” Accessed June 2023. https://ark.intel.com/content/www/us/en/ark/products/232384/intel-xeon-gold-6448y-processor-60m-cache-2-10-ghz.html.
[22] Dell. “PowerEdge XR7620 Specification Sheet.” Accessed June 2023. www.delltechnologies.com/asset/en-us/products/servers/technical-support/poweredge-xr7620-spec-sheet.pdf.
[23] VMmark. “VMmark® 3.1.1 Results, November 29, 2022.” www.vmware.com/content/dam/digitalmarketing/vmware/en/pdf/vmmark/2022-11-29-Dell-PowerEdge-XR4510c-serverPPKW.pdf.
[24] VMmark. “VMmark® 3.1.1 Results, May 16, 2023.” www.vmware.com/content/dam/digitalmarketing/vmware/en/pdf/vmmark/2023-05-16-Dell-PowerEdge-XR7620.pdf.