


MD Simulation of GROMACS with AMD EPYC 7003 Series Processors on Dell EMC PowerEdge Servers
AMD has recently announced and launched its third generation 7003 series EPYC processors family (code named Milan). These processors build upon the proceeding generation 7002 series (Rome) processors and improve L3 cache architecture along with an increased memory bandwidth for workloads such as High Performance Computing (HPC).
The Dell EMC HPC and AI Innovation Lab has been evaluating these new processors with Dell EMC’s latest 15G PowerEdge servers and will report our initial findings for the molecular dynamics (MD) application GROMACs in this blog.
Given the enormous health impact of the ongoing COVID-19 pandemic, researchers and scientists are working closely with the HPC and AI Innovation Lab to obtain the appropriate computing resources to improve the performance of molecular dynamics simulations. Of these resources, GROMACS is an extensively used application for MD simulations. It has been evaluated with the standard datasets by combining the latest AMD EPYC Milan processor (based on Zen 3 cores) with Dell EMC PowerEdge servers to get most out of the MD simulations.
In a previous blog, Molecular Dynamic Simulation with GROMACS on AMD EPYC- ROME, we published benchmark data for a GROMACS application study on a single node and multinode with AMD EPYC ROME based Dell EMC servers.
The results featured in this blog come from the test bed described in the following table. We performed a single-node and multi-node application study on Milan processors, using the latest AMD stack shown in Table 1, with GROMACS 2020.4 to understand the performance improvement over the older generation processor (Rome).
Table 1: Testbed hardware and software details
Server | Dell EMC PowerEdge 2-socket servers (with AMD Milan processors) | Dell EMC PowerEdge 2-socket servers (with AMD Rome processors) |
Processor Cores/socket Frequency (Base-Boost ) Default TDP Processor bus speed | 7763 (Milan) 64 2.45 GHz – 3.5 GHz 280 W 256 MB 16 GT/s | 7H12 (Rome) 64 2.6 GHz – 3.3 GHz 280 W 256 MB 16 GT/s |
Processor Cores/socket Frequency Default TDP Processor bus speed | 7713 (Milan) 64 2.0 GHz – 3.675 GHz 225 W 256 MB 16 GT/s | 7702 (Rome) 64 2.0 GHz – 3.35 GHz 200 W 256 MB 16 GT/s |
Processor Cores/socket Frequency Default TDP Processor bus speed | 7543 (Milan) 32 2.8 GHz – 3.7 GHz 225 W 256 MB 16 GT/s | 7542 (Rome) 32 2.9 GHz – 3.4 GHz 225 W 128 MB 16 GT/s |
Operating system | Red Hat Enterprise Linux 8.3 (4.18.0-240.el8.x86_64) | Red Hat Enterprise Linux 7.8 |
Memory | DDR4 256 G (16 GB x 16) 3200 MT/s | |
BIOS/CPLD | 2.0.2 / 1.1.12 |
|
Interconnect | NVIDIA Mellanox HDR | NVIDIA Mellanox HDR 100 |
Table 2: Benchmark datasets used for GROMACS performance evaluation
Datasets | Details |
1536 K and 3072 K | |
1400 K and 3000 K | |
Prace – Lignocellulose | 3M |
The following information describes the performance evaluation for the processor stack listed in the Table 1.
Rome processors compared to Milan processors (GROMACS)
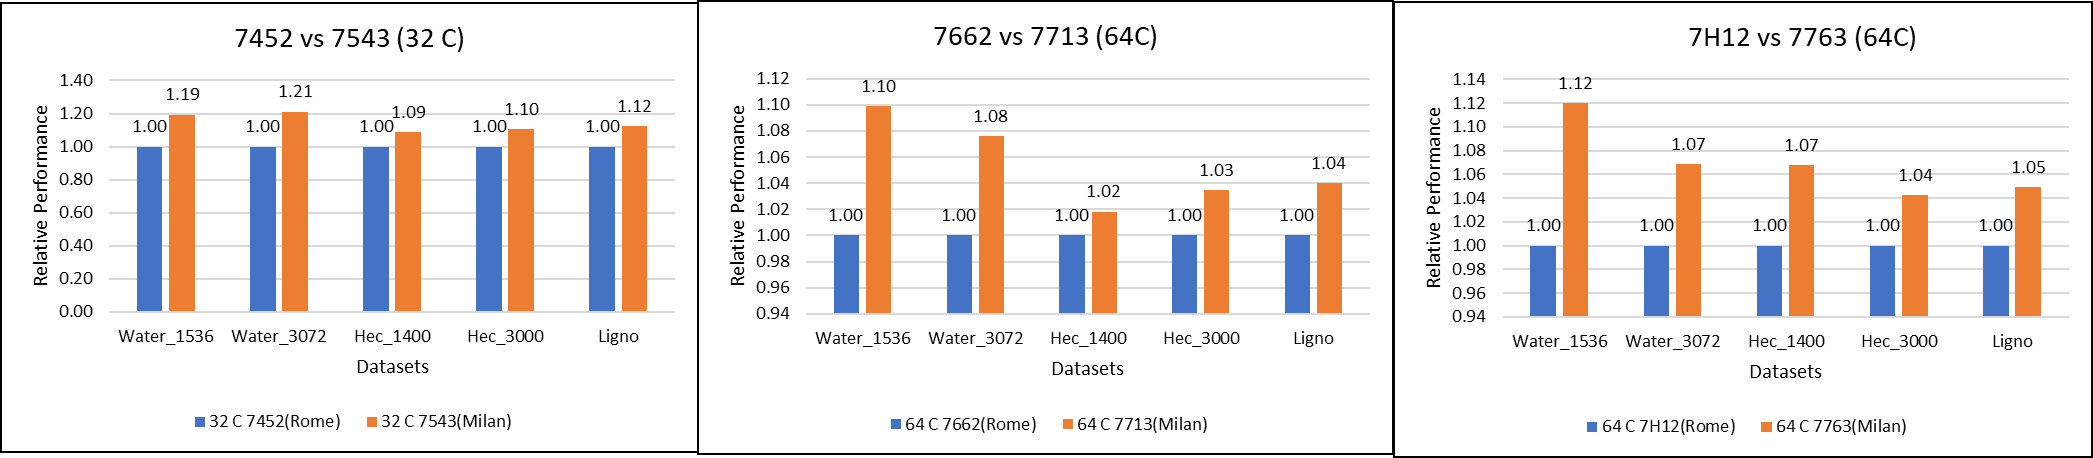 Figure 1: GROMACS performance comparison with AMD Rome processors
For performance benchmark comparisons, we selected Rome processors that are closest to their Milan counterparts in terms of hardware features such as cache size, TDP values, and Processor Base/Turbo Frequency, and marked the maximum value attained for Ns/day by each of the datasets mentioned in Table 2.
Figure 1 shows a 32C Milan processor has higher performance improvements (19 percent for water 1536, 21 percent for water 3072, and 10 to approximately 12 percent with HECBIO sim and lingo cellulose datasets) compared to a 32C Rome processor. This result is due to a higher processor speed and improved L3 cache, wherein more data can be accessed by each core.
Next, with the higher end processor we see only 10 percent gain with respect to the water dataset, as they are more memory intensive. Some percentage is added on due to improvement of frequency for the remaining datasets. Overall, the Milan processor results demonstrated a substantial performance improvement for GROMACS over Rome processors.
Milan processors comparison (32C processors compared to 64C processors)
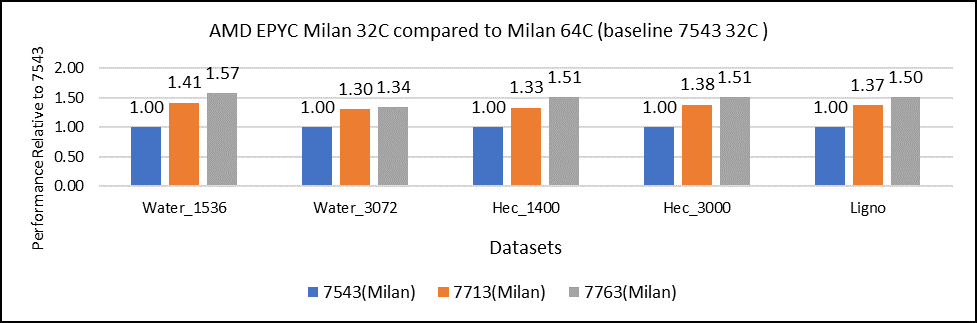
Figure 2: GROMACS performance with Milan processors
Figure 2 shows performance relative to the performance obtained on the 7543 processor. For instance, the performance of water 1536 is improved from the 32C processor to the 64 core (64C) processor from 41 percent (7713 processor) to 57 percent (7763 processor). The performance improvement is due to the increasing core counts and higher CPU core frequency performance improvement. We observed that GROMACS is frequency sensitive, but not to a great extent. Greater gains may be seen when running GROMACS across multiple ensembles runs or running dataset with higher number of atoms.
We recommend that you compare the price-to-performance ratio before choosing the processor based on the datasets with higher CPU core frequency, as the processors with a higher number of lower-frequency cores may provide better total performance.
Multi-node study with 7713 64C processors
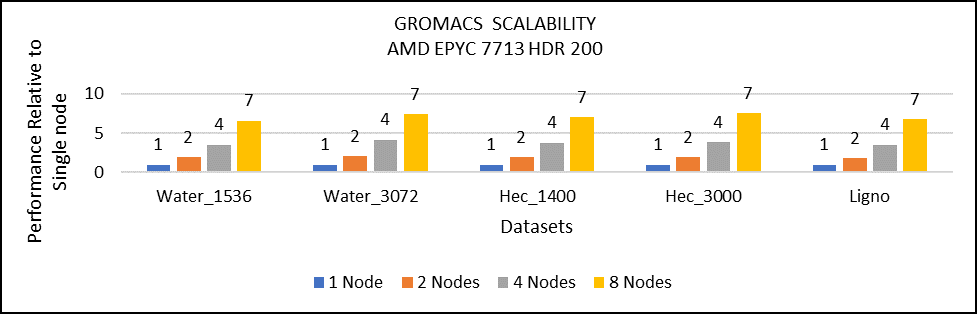
Figure 3: Multi-node study with 7713 64c SKUs
For multi-node tests, the test bed was configured with an NVIDIA Mellanox HDR interconnect running at 200 Gbps and each server included an AMD EPYC 7713 processor. We achieved the expected linear performance scalability for GROMACS of up to four nodes and across each of the datasets. All cores in each server were used while running the benchmarks. The performance increases are close to linear across all the dataset types as core count increases.
Conclusion
For the various datasets we evaluated, GROMACS exhibited strong scaling and was compute intensive. We recommend a processor with high core count for smaller datasets (water 1536, hec 1400); larger datasets (water 3072, ligno,HEC 3000) would benefit from memory per core. Configuring the best BIOS options is important to get the best performance out of the system.
For more information and updates, follow this blog site.