NVIDIA nVector + nVector Lite, SPECviewperf 13, Maya, Multi VMs test
Home > Workload Solutions > Virtual Desktop Infrastructure > White Papers > Technical White Paper—VDI Graphics Acceleration on a Dell MX7000 Modular Chassis > NVIDIA nVector + nVector Lite, SPECviewperf 13, Maya, Multi VMs test
NVIDIA nVector + nVector Lite, SPECviewperf 13, Maya, Multi VMs test
-
This section describes the details of Test Case 1, which we ran with the SPECviewperf 13 Autodesk Maya workload. We analyze the SPEC scores and the host and endpoint resource utilization.
We provisioned four virtual workstation VMs on the MX740c compute host that was enabled with GPUs. We configured NVIDIA T4-8Q vGPU profiles for each virtual workstation. Three virtual workstations were connected to virtual machine endpoints running the NVIDIA nVector automated workload, and one of the virtual workstations was connected to the Wyse 5070 thin client. For the virtual workstation connected to the thin client, we ran the test manually and collected EUE metrics using the NVIDIA nVector Lite tool.
The following table shows the virtual workstation configuration that we used for testing:
Table 11. Workstation VM configuration
Configuration
Value
vCPU
6
vMemory
32768
HardDisk
120
GPU
grid_t4-8q
GPUDriverVersion
442.06
FRL
disabled
vSYNC
default
vDAVersion
7.10.1
DirectConnectVersion
7.10.1
CPUAffinity
Unset
Screen Resolution
1920 x 1080
QuantityMonitors
1
For this test, we sized virtual workstations to use the maximum available GPU frame buffer of 32 GB on the compute host with four virtual workstations running an 8 GB profile each. We enabled two NVIDIA T4 GPUs, each having a frame buffer of 16 GB, per compute host. The following table gives the SPECviewperf 13 benchmark score for the testing. The performance of this system can be compared with the other benchmark scores available on the SPEC website.
Table 12. Maya SPEC score for Test Case 1
VM name
Maya score
Desktop-1
119.042
Desktop-2
129.522
Desktop-3
117.536
Desktop-4 (Thin Client)
118.94
Average
121.26
The following table shows the average compute host utilization metrics during the test:
Table 13. Average host utilization metrics
Workload
Density per host
Average CPU %
Average GPU %
Average memory consumed
Average memory active
Average net Mbps per user
SPECviewperf 13 Maya
4
18.77%
79.42%
114 GB
114 GB
9.63 Mbps
The following graphs show the host utilization metrics while running the SPECviewperf 13 Maya workload and the EUE metrics, including image quality, frame rate, and end-user latency collected from the nVector Lite tool.
The following figure shows the CPU core utilization on the compute host enabled with GPUs running four virtual workstation machines. The average CPU core utilization during the test was 18.76 percent, with a peak utilization of 24.72 percent. The SPECviewperf 13 workload is typically more graphics-intensive than CPU-intensive and is designed to measure the GPU performance. Therefore, the low CPU utilization shown is expected.
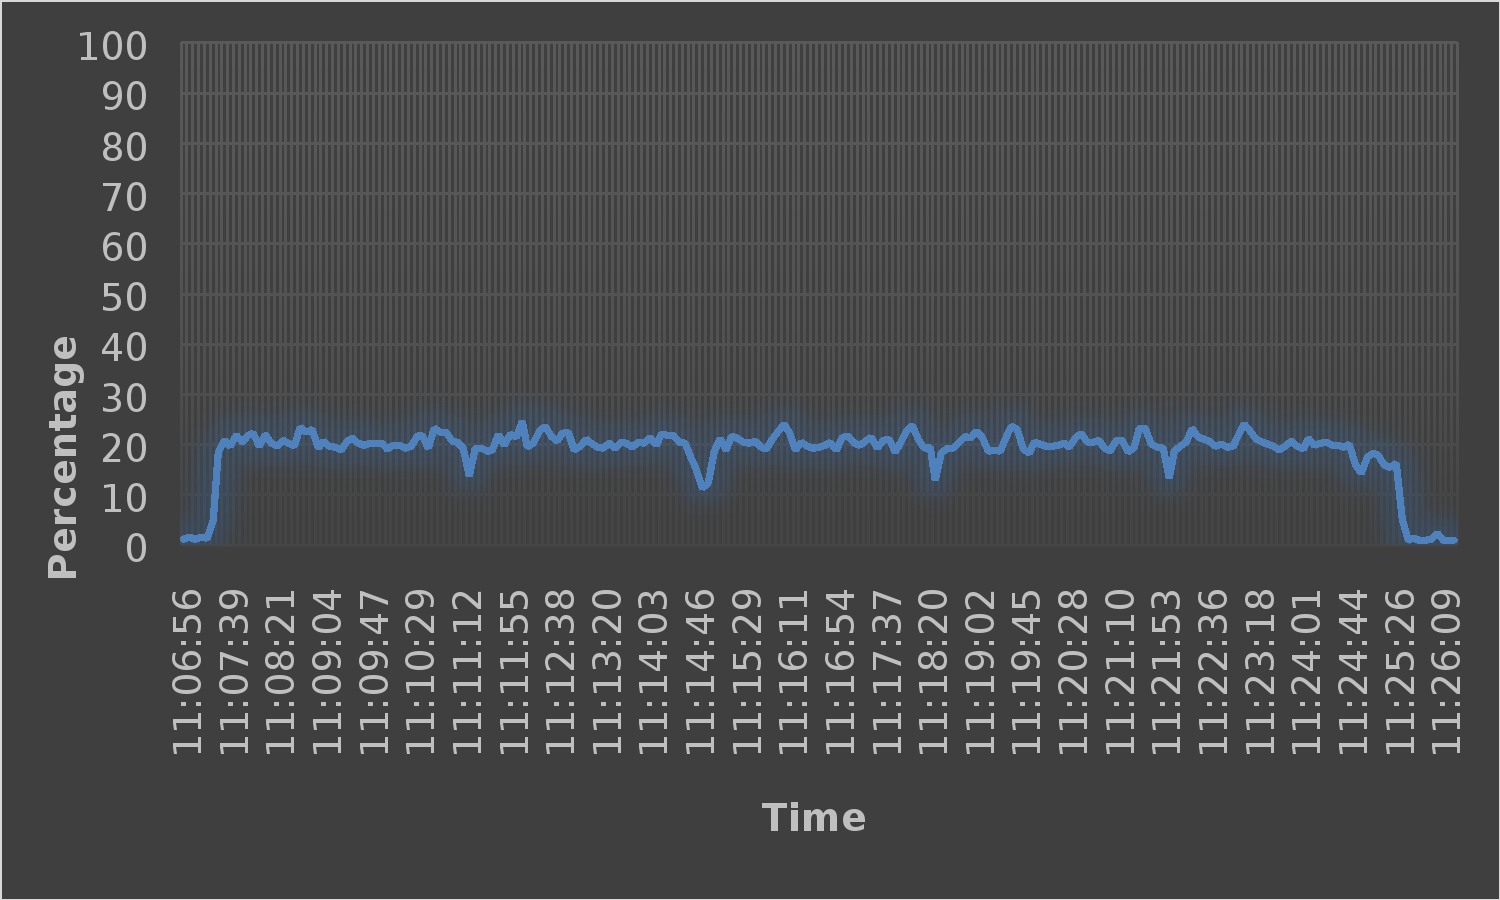
Figure 11. CPU core utilization
The following figure shows the GPU utilization for the system under test. We gathered GPU metrics through the NVIDIA System Management Interface on the VMware ESXi host. GPU utilization spiked to a maximum during the test. The high GPU utilization is expected because the SPECviewperf 13 workload is designed to measure the performance of the GPU. The average GPU utilization across the GPUs during testing was 79 percent.
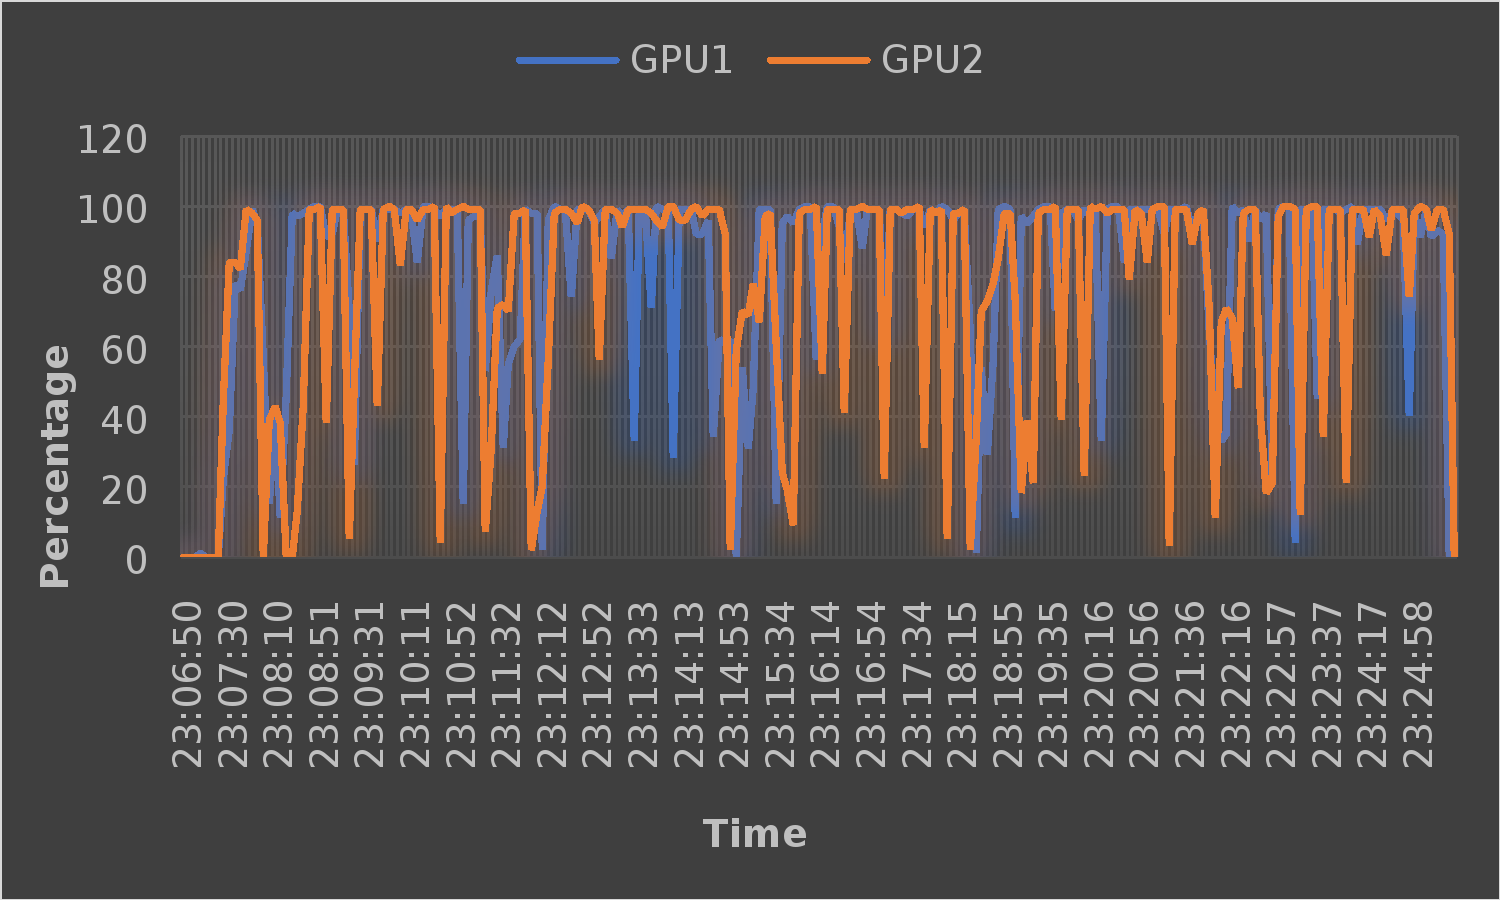
Figure 12. GPU utilization
The following figure shows the free memory that was available on the compute host during the test. There were not many variations in memory usage throughout the test because all vGPU-enabled VM memory was reserved. There was no memory ballooning or swapping on either host, indicating that there were no memory constraints on the host.
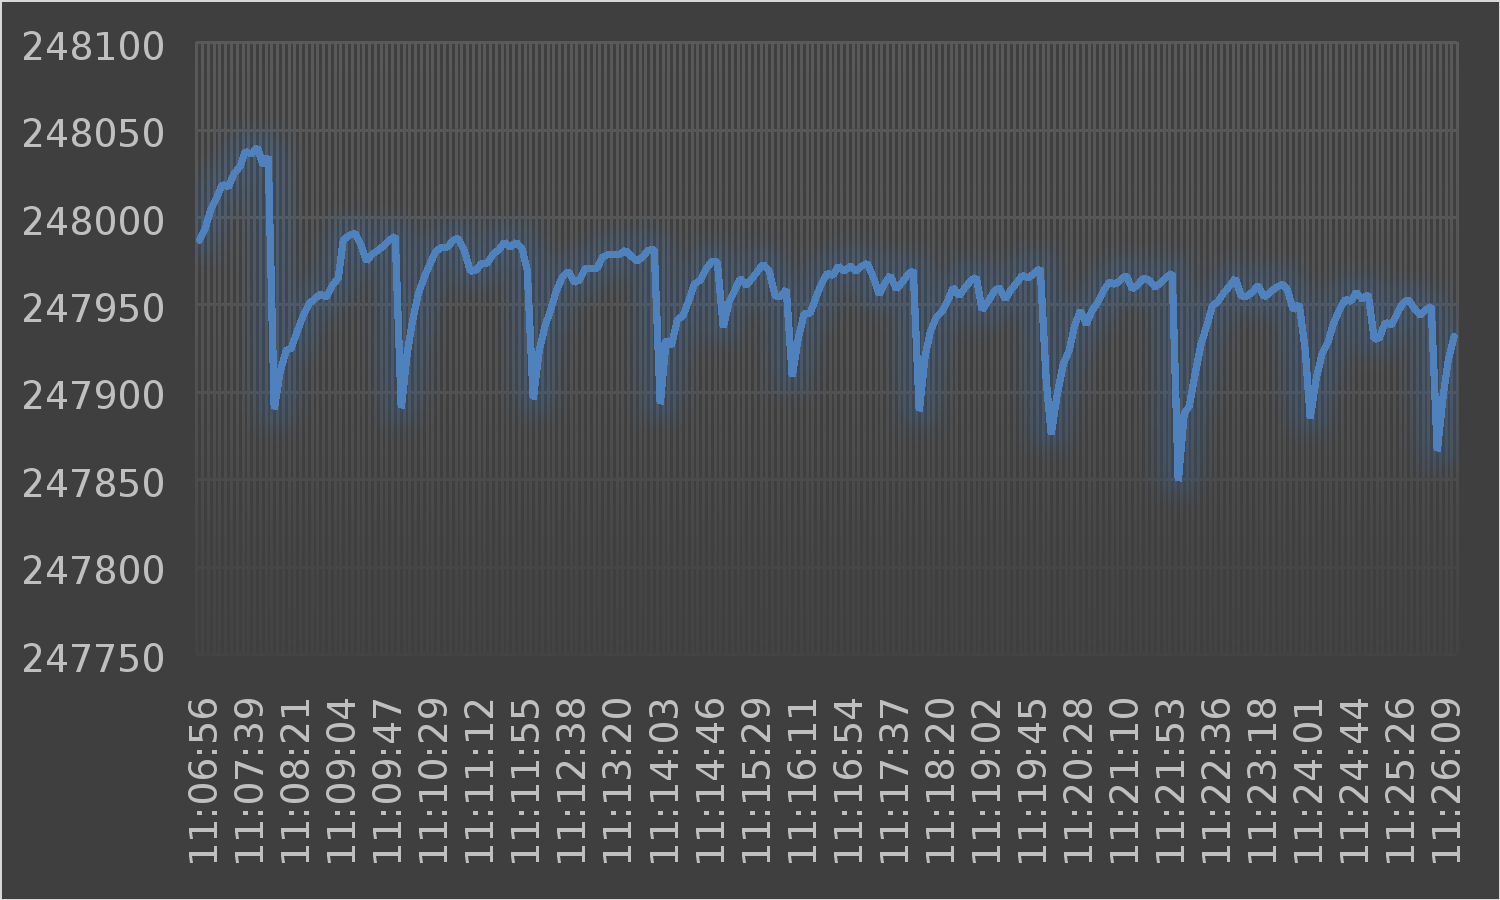
Figure 13. Free memory
The following figure shows the network utilization of the tested system for the duration of the test. The peak network utilization recorded during the test was 111 MBits. There was more than enough bandwidth available for the workload and the display protocol to accommodate the workload. Each server had a single 25 GbE (25,000 MBits) network card connected to it.
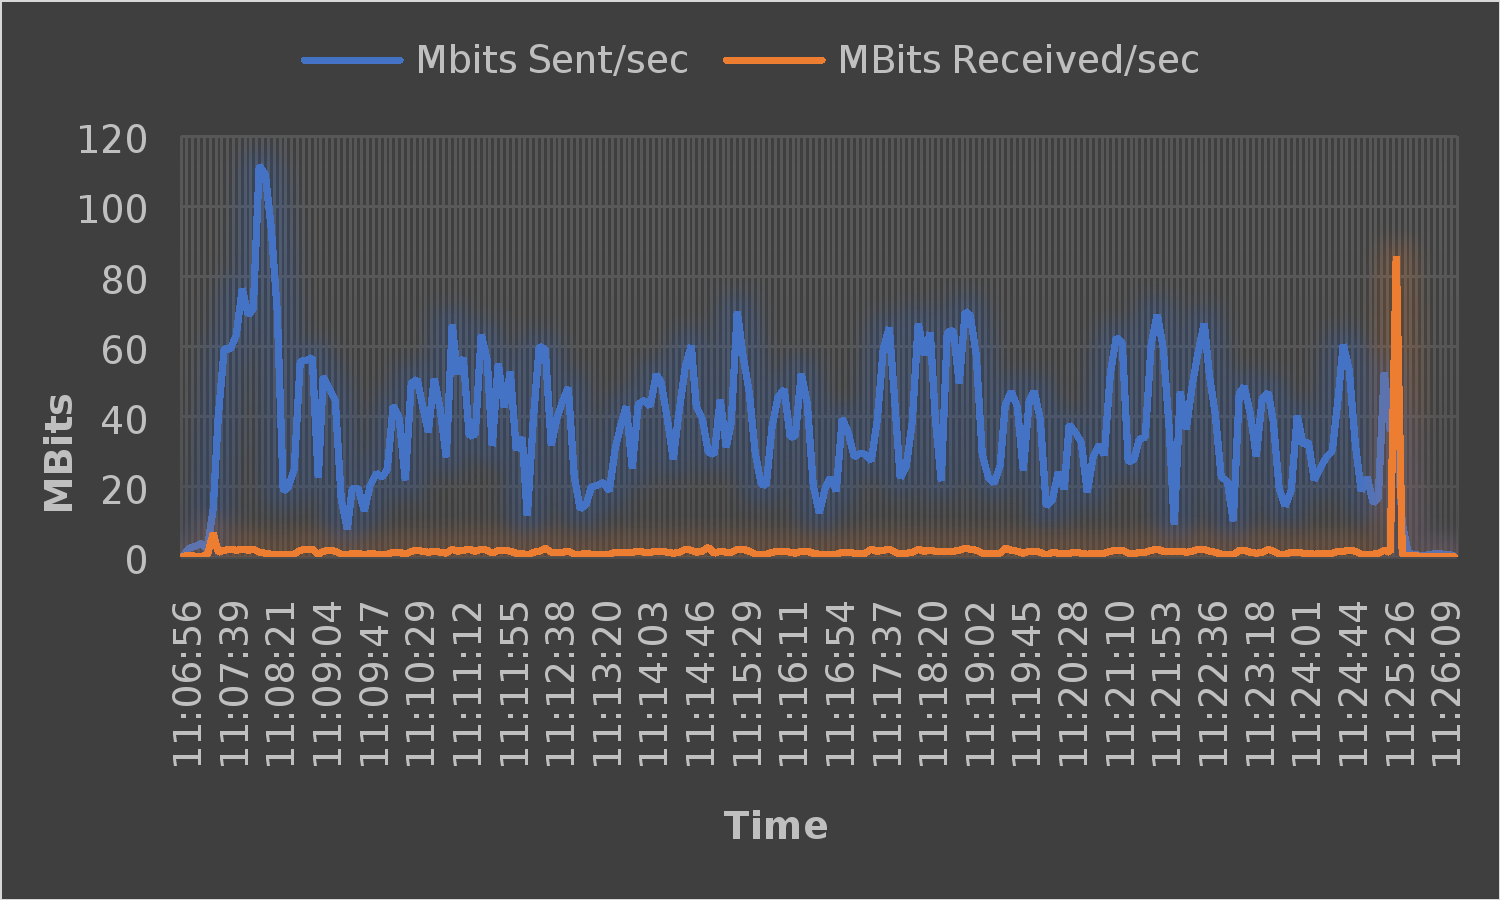
Figure 14. Network usage
nVector Lite Endpoint Metrics
The image quality on the Wyse 5070 thin client was captured using nVector Lite and the SSIM heatmap index. This testing takes screenshots on the endpoint (the Wyse Thin Client) and the virtual workstation and makes comparisons of how the display protocol is performing. The image quality recorded was approximately 91 percent, as shown in the following figure. This SSIM measurement value shows that the image quality was not degraded significantly by the remoting protocol.
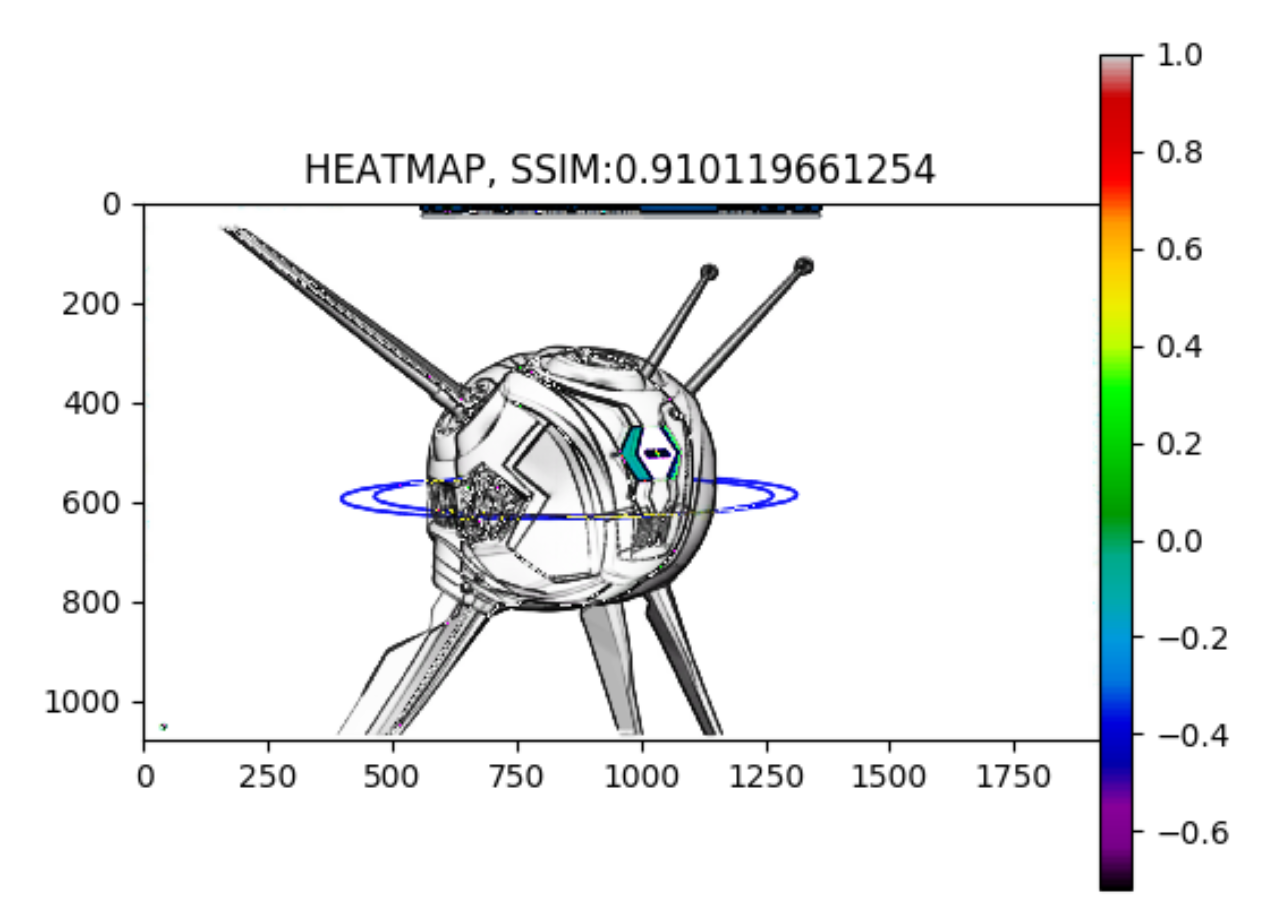
Figure 15. Image quality–Heatmap
The image frame rate was captured on the virtual workstations and the Wyse 5070 Thin Client. The frames that were measured at the thin client are those frames that the remote protocol displayed. The maximum remoted frames that the display protocol displays was set to 60 frames. The nVector tool measured FPS and flip rate, which are defined as follows:
- FPS–The frames per second as measured from the GPU
- Flip rate–The remoted frames per second as measured from the Blast Extreme display protocol
Figure 16 shows a comparison of FPS and flip rate. The display protocol setting caps the flip rate at 60. For a good use experience, ensure that the maximum configured flip rate is no lower than the frame rate and the maximum observed flip rate is equal to the frame rate.
Figure 16 shows the flip rate to be close to the frame rate at all times, indicating a good user experience.
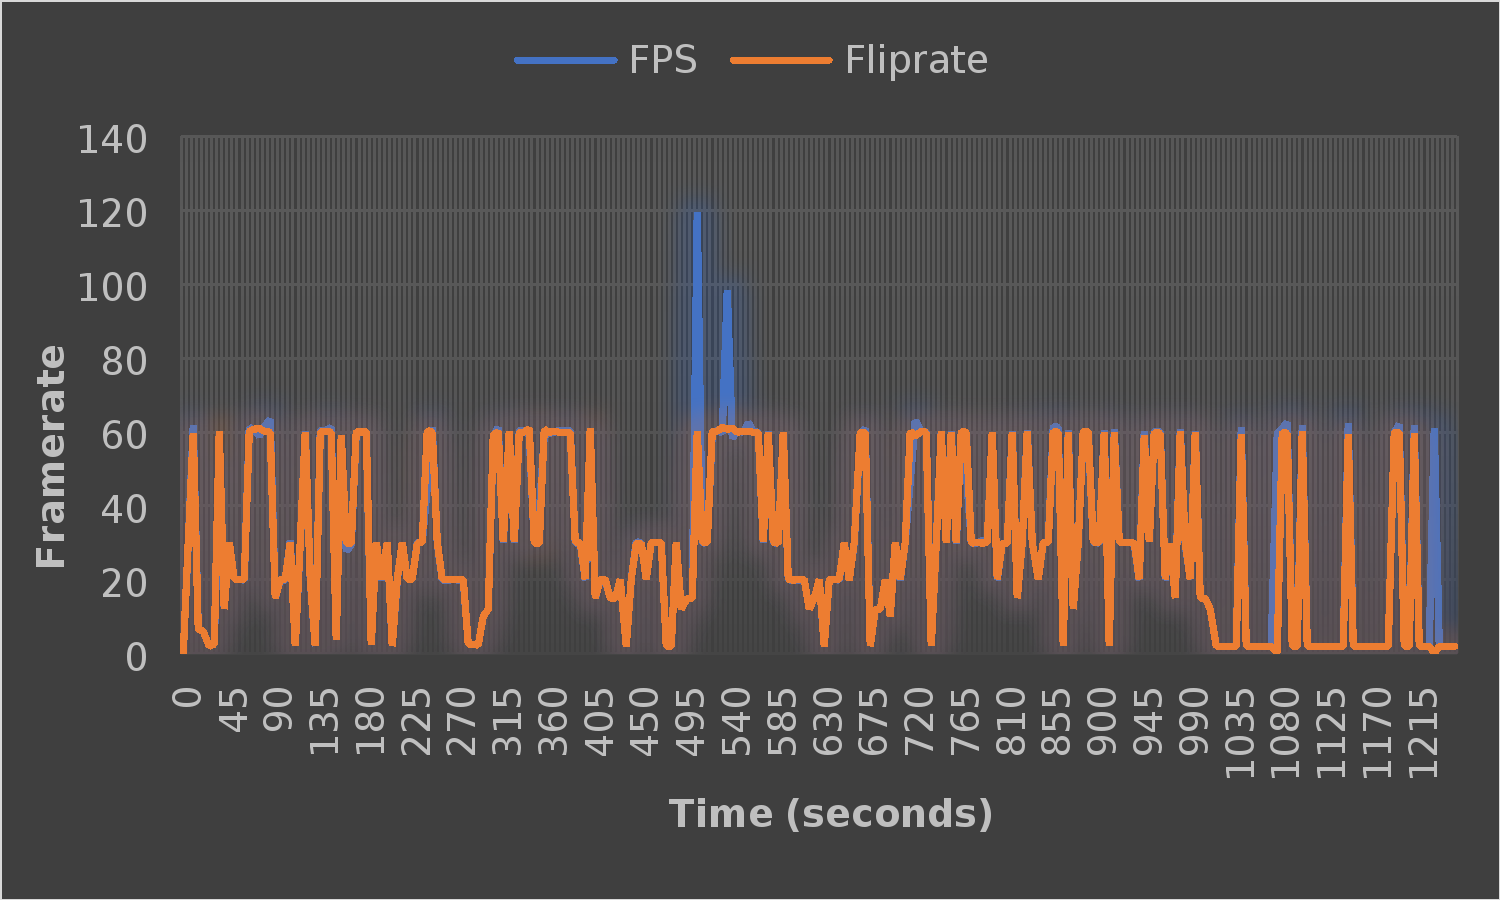
Figure 16. Image frame rate
The end-user latency metric gives an indication to VDI administrators of how responsive the VDI session is at the user’s endpoint. The average end-user latency measured by the nVector Lite tool during the test was 140.48 ms. This value is higher than the value recorded during the 3ds Max test. However, this value was not high enough to impact the responsiveness in the endpoints.
The user experience was measured in a subjective manner by logging into a user session and performing a series of tasks that indicate responsiveness. Some of these tasks include opening multiple applications and observing the launch time, drawing a figure 8 in a graphics editor, and dragging windows around the desktop to observe smoothness. These tasks performed as expected and the experience was determined to be excellent with no observable latency or delays.
