Home > Workload Solutions > SQL Server > Guides > Reference Architecture Guide—Consolidate and Simplify Mixed Database Workloads > Storage IOPS
Storage IOPS
-
The number of IOPS demonstrates the load on a storage system. Innovations like SSDs and NVMe flash drives have increased IOPS densities, enabling storage arrays to support more databases and a greater diversity of workloads.
We structured the incremental tests for this solution so that, in terms of storage load, the most intensive IOPS workload—the OLTP databases—were the first to be tested. All other incremental workloads would then have a minimal impact on the OLTP databases. A slight loss in IOPS does not represent a significant impact to database performance.
The OLTP use case test findings show that the OLTP SQL Server databases 1 and 2 generated 16,627 and 17,304 IOPS, respectively, on the PowerMax 2000 storage array, and the single Oracle database generated 42,145 IOPS. Because these three databases have the entire infrastructure dedicated to their performance during the first test, the expectation was that these IOPS values would be the maximum achieved during testing.
The following table summarizes the IOPS for each OLTP database:
Table 8. IOPS for OLTP databases
Workload
Database
IOPS
OLTP
SQL Server 1
17,304
SQL Server 2
16,627
Oracle
42,145
Total
76,076
The addition of DSS workloads places an additional IOPS load on the storage arrays. However, we must also consider the average read I/O size and write I/O size. The following table shows the average read I/O size and write I/O size for each of the databases:
Table 9. Average read and write I/O sizes for each database in the OLTP and DSS workloads
DSS database
Read I/O size (KB)
Write I/O size (KB)
SQL Server 1
180.17
64.2
SQL Server 2
157.97
63.99
Oracle
127.82
184.70
OLTP database
Read I/O size (KB)
Write I/O size (KB)
SQL Server 1
12.95
8.90
SQL Server 2
13.04
8.98
Oracle
10.48
10.94
Although the IOPS numbers for the DSS workloads seem low when compared to the IOPS numbers for the OLTP databases, the larger I/O read/write sizes mean that more data is transferred for each storage operation. Thus, in the case of DSS, the number of IOPS is lower than that for OLTP, but the load on the storage array is significant because the data transferred is larger. Therefore, DSS workload performance, in general, is measured in terms of throughput captured as MB/s instead of IOPS.
The following table summarizes the numbers of IOPS for the OLTP and DSS workloads:
Table 10. IOPS for OLTP and DSS workloads
Workload
Databases
IOPS
OLTP
SQL Server 1
16,417
SQL Server 2
16,410
Oracle
40,387
DSS
SQL Server 1
6,783
SQL Server 2
6,720
Oracle
13,842
Total
100,559
Comparing the IOPS numbers for the two OLTP database workloads, a slight loss of an average of 3.5 percent in IOPS occurred when we added the DSS workload. As is expected and reasonable, placing more load on a storage array has a slight impact across database workloads. The key point is that performance remains in a range that meets the SLA for the business.
The snapshot OLTP database workloads represent test and development databases. The following table shows the IOPS results of all three databases with mixed workload use cases running in parallel:
Table 11. IOPS results with all three workload use cases running in parallel
Workload
Database
IOPS
OLTP
SQL Server 1
15,643
SQL Server 2
16,177
Oracle
42,234
DSS
SQL Server 1
6,375
SQL Server 2
7,587
Oracle
13,688
Snapshot OLTP
SQL Server 1
1,332
Oracle
3,103
Total
106,139
Comparing the new workload combination to the previous combination, a slight loss of about 4 percent in IOPS for the OLTP databases occurred when the workload increased. The test findings show that as the workload increased on the PowerMax array, the IOPS performance remained stable (see Table 8, Table 10, and Table 11). The capability of the storage array to sustain IOPS performance as the workload increased demonstrates the strength of the PowerMax platform for mixed database and workload consolidation.
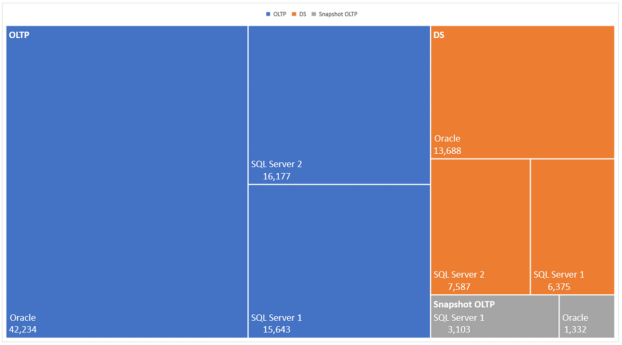
The treemap in the following figure shows the distribution of IOPS for each database across all three workload use cases running in parallel. As indicated by the blue tiles, of the three OLTP databases, Oracle generated the greatest number of IOPS, while the two SQL Server databases generated IOPS ranging from 15,643 to 16,177. The orange tiles represent the addition of the DSS databases, and the gray tiles represent the addition of the snapshot OLTP database.

Figure 12. Treemap of IOPS based on test results for all three workload use cases
