Home > AI Solutions > Artificial Intelligence > White Papers > MLPerf™ Inference v2.1 with NVIDIA GPU-Based Benchmarks on Dell PowerEdge Servers > Summary
Summary
-
The following sections compare the results from MLPerf v2.0 and MLPerf v2.1, and provide performance improvements.
Performance improvement from MLPerf v2.0 to MLPerf v2.1
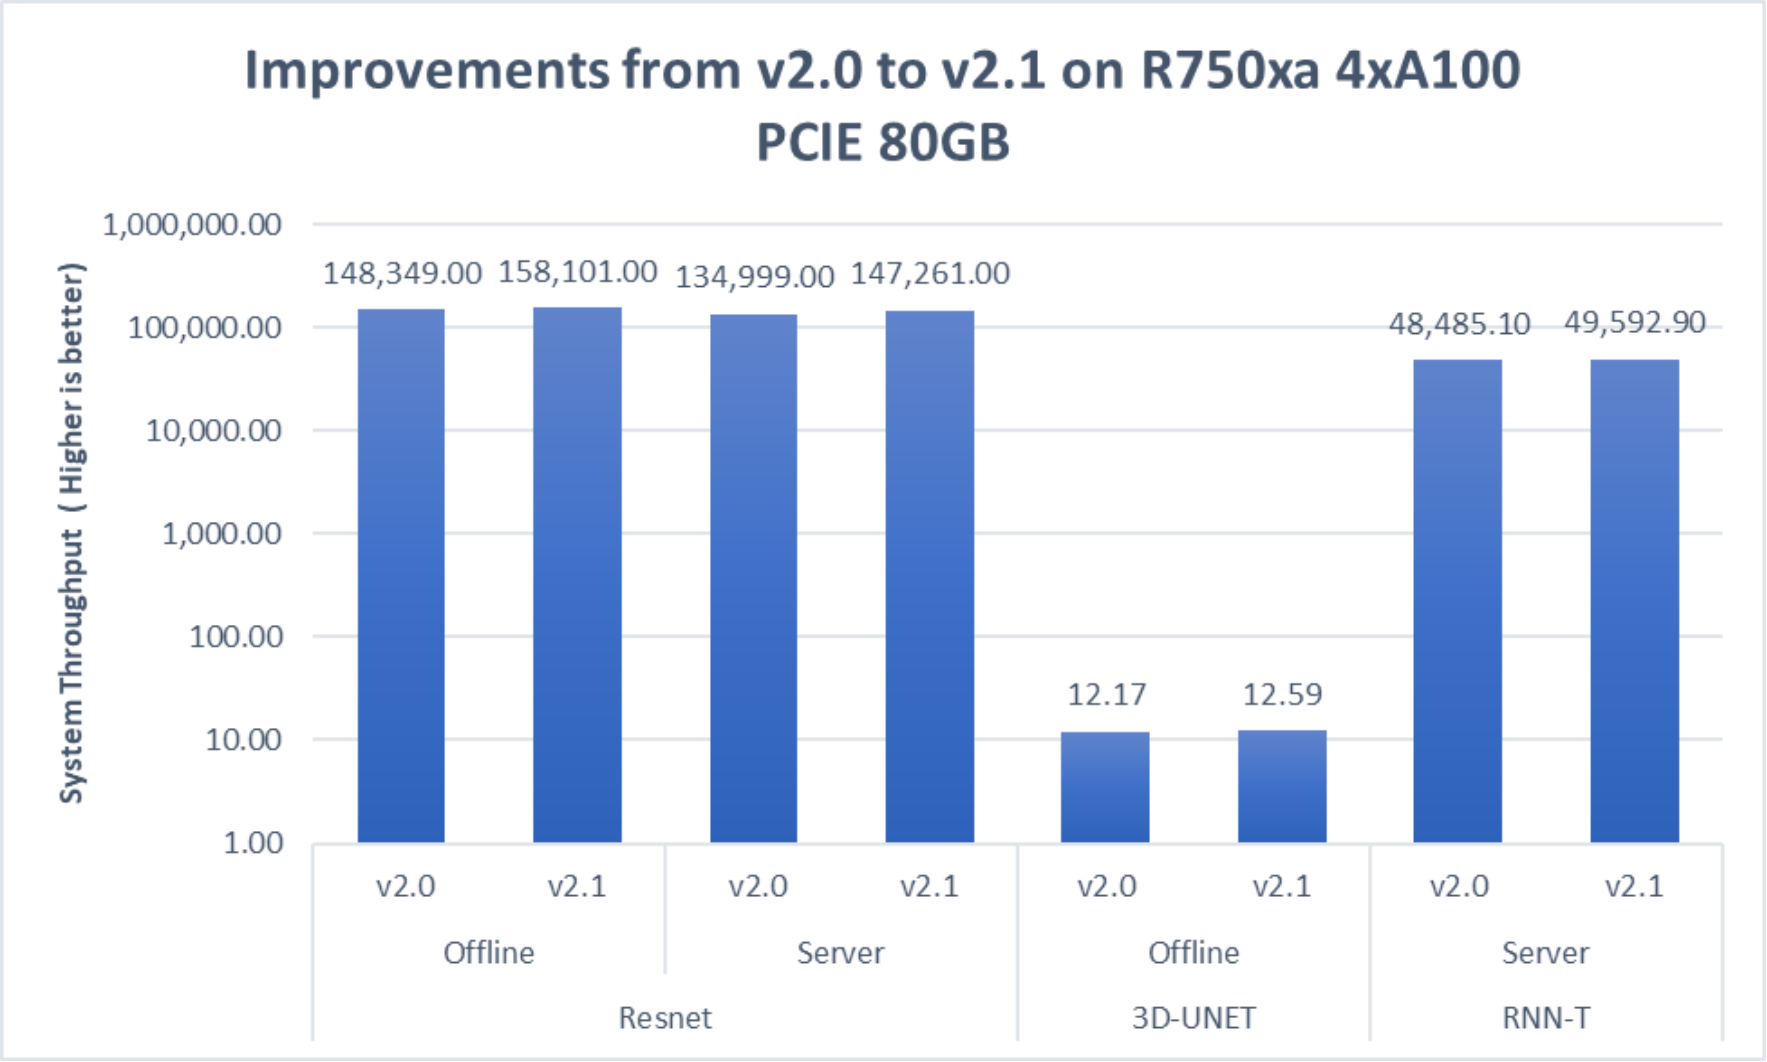
Figure 11. Improvement of performance on the PowerEdge R750xa server for MLPerf v2.1 on an exponential y axis
The following figure shows the performance gains:
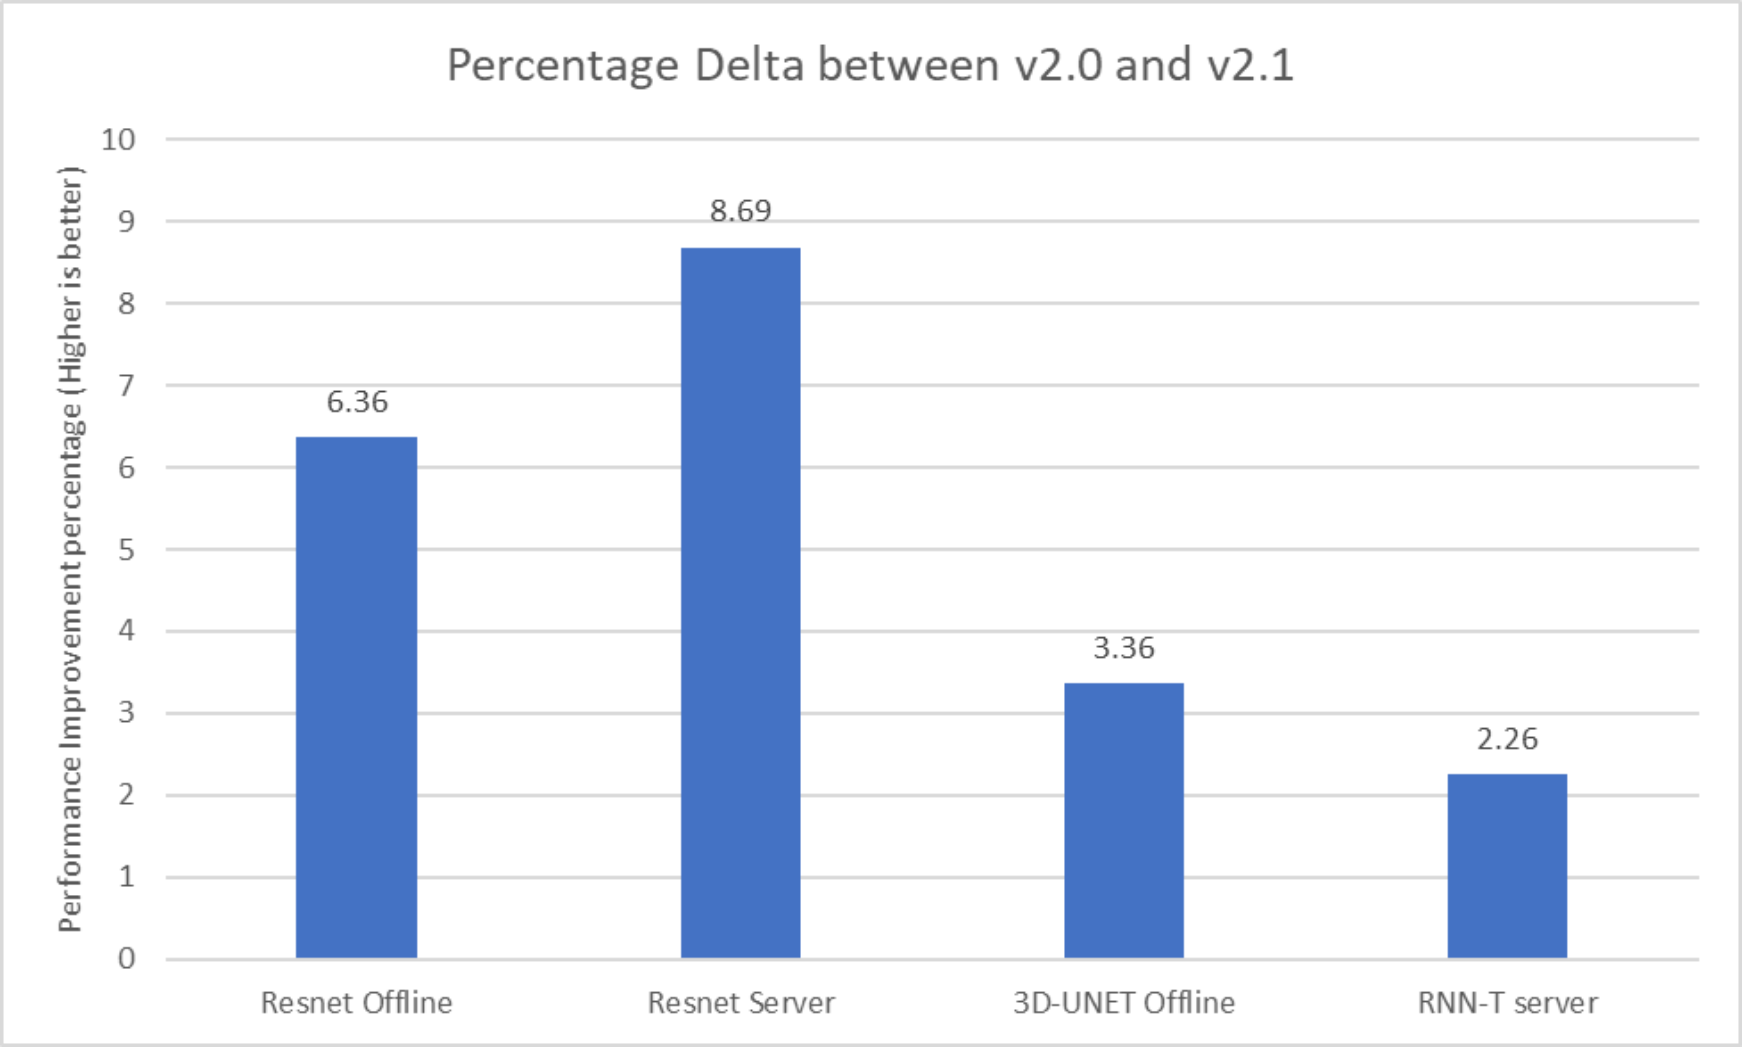
Figure 12. Performance gains on the PowerEdge R750xa server for MLPerf v2.1
These performance gains are primarily due to software improvements. We see that there is an approximate 8.64 percent improvement with the server scenario and 6.36 percent improvement with the offline scenario respectively for the ResNet50 model.
The 3D-UNET model shows an approximate 3.39 percent improvement whereas the RNNT server scenario shows an approximate 2.25 percent improvement.
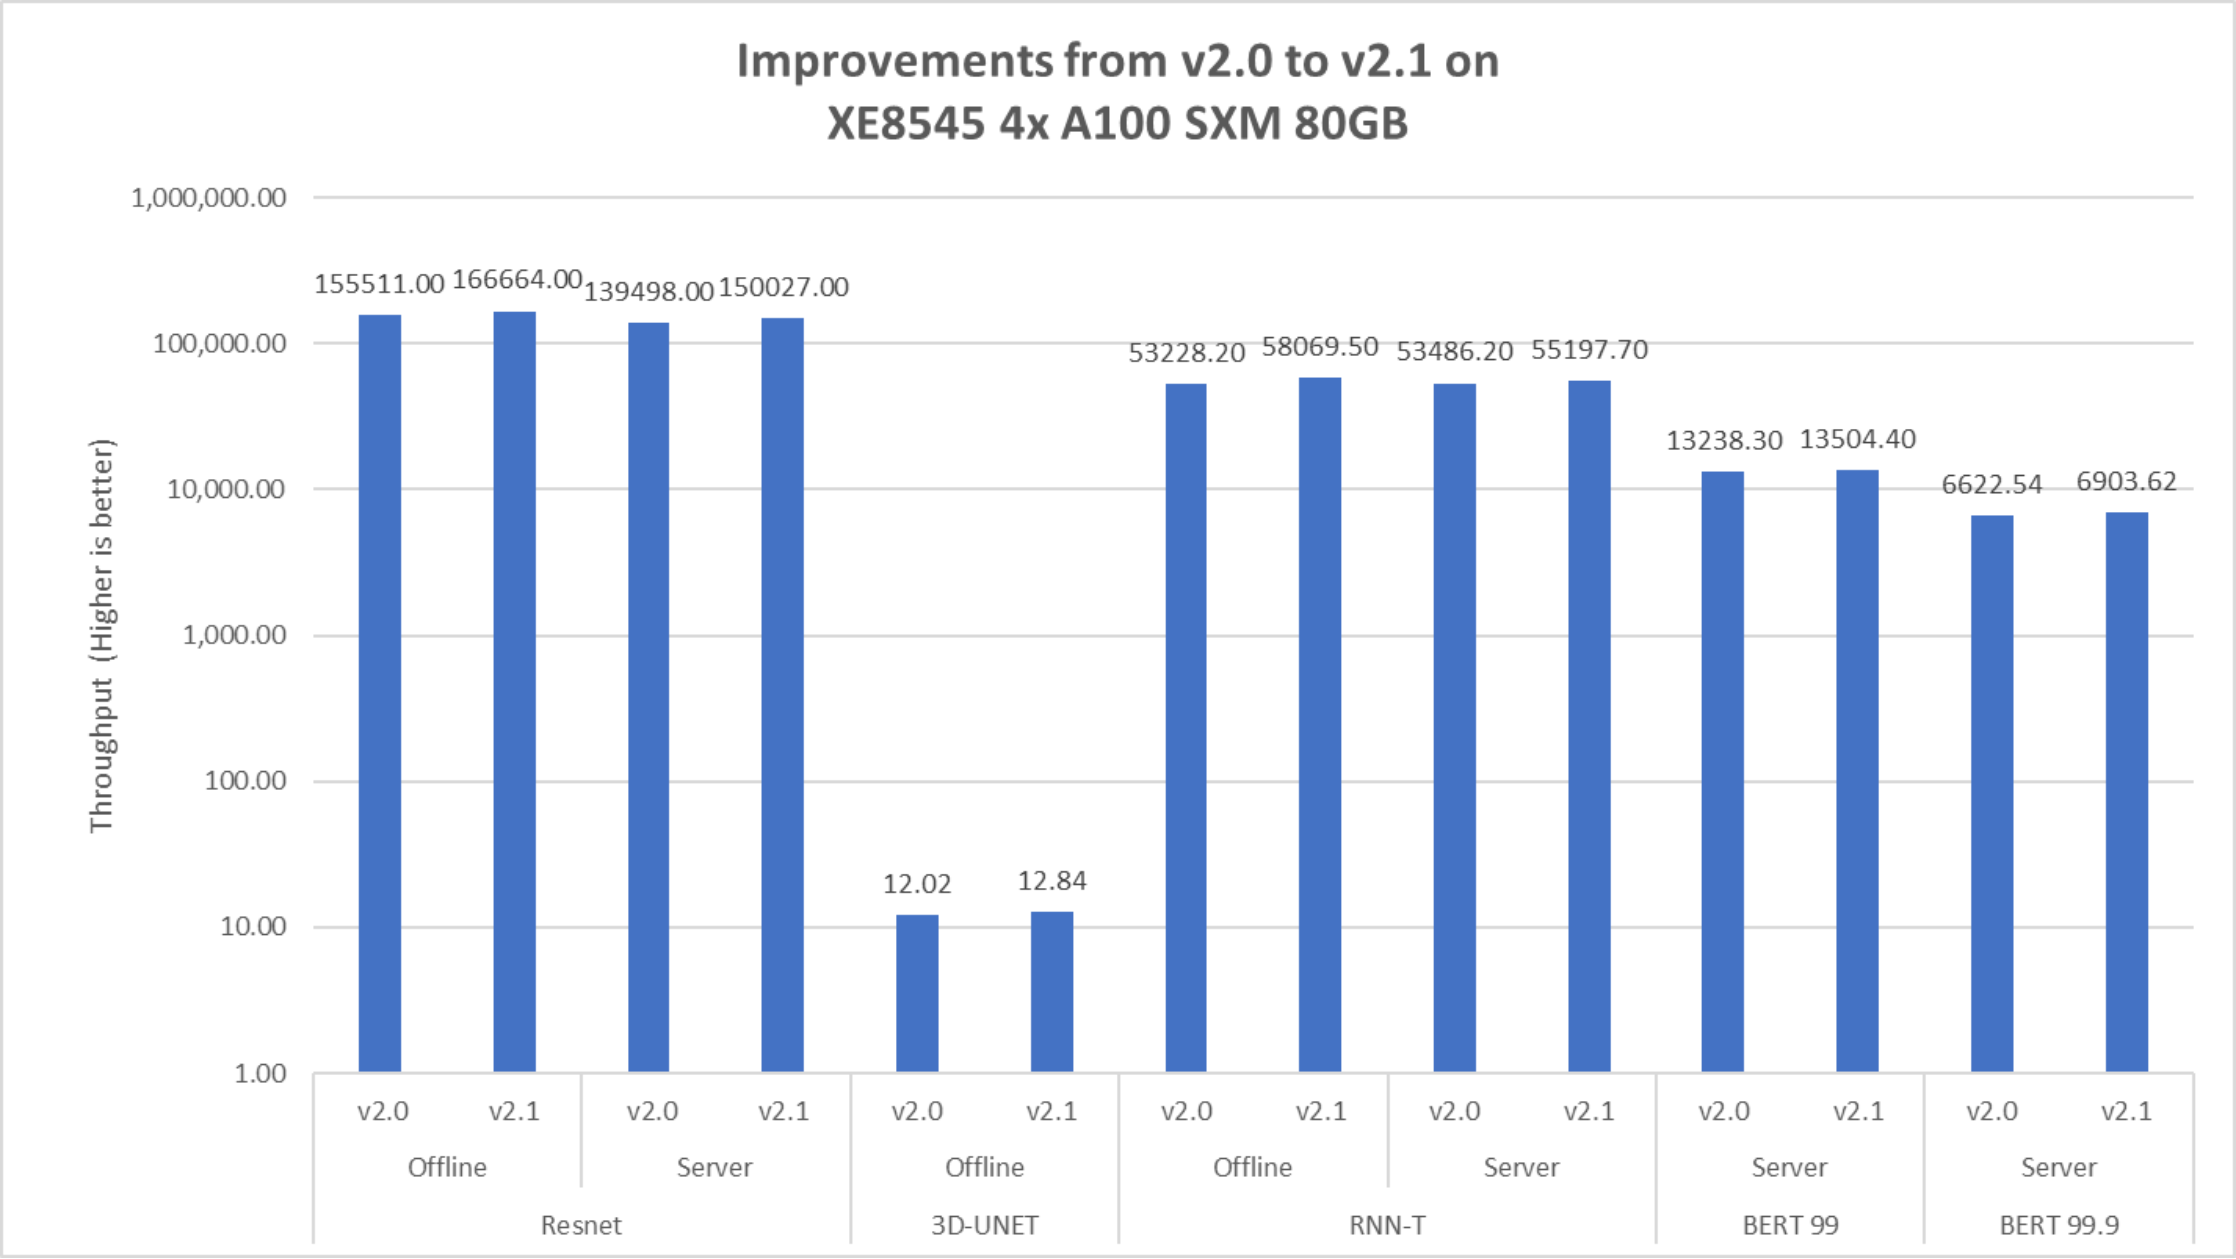
Figure 13. Improvement of performance on the PowerEdge XE8545 server for MLPerf v2.1 on an exponential y axis
The following graph shows the performance improvement percentage of different workloads:
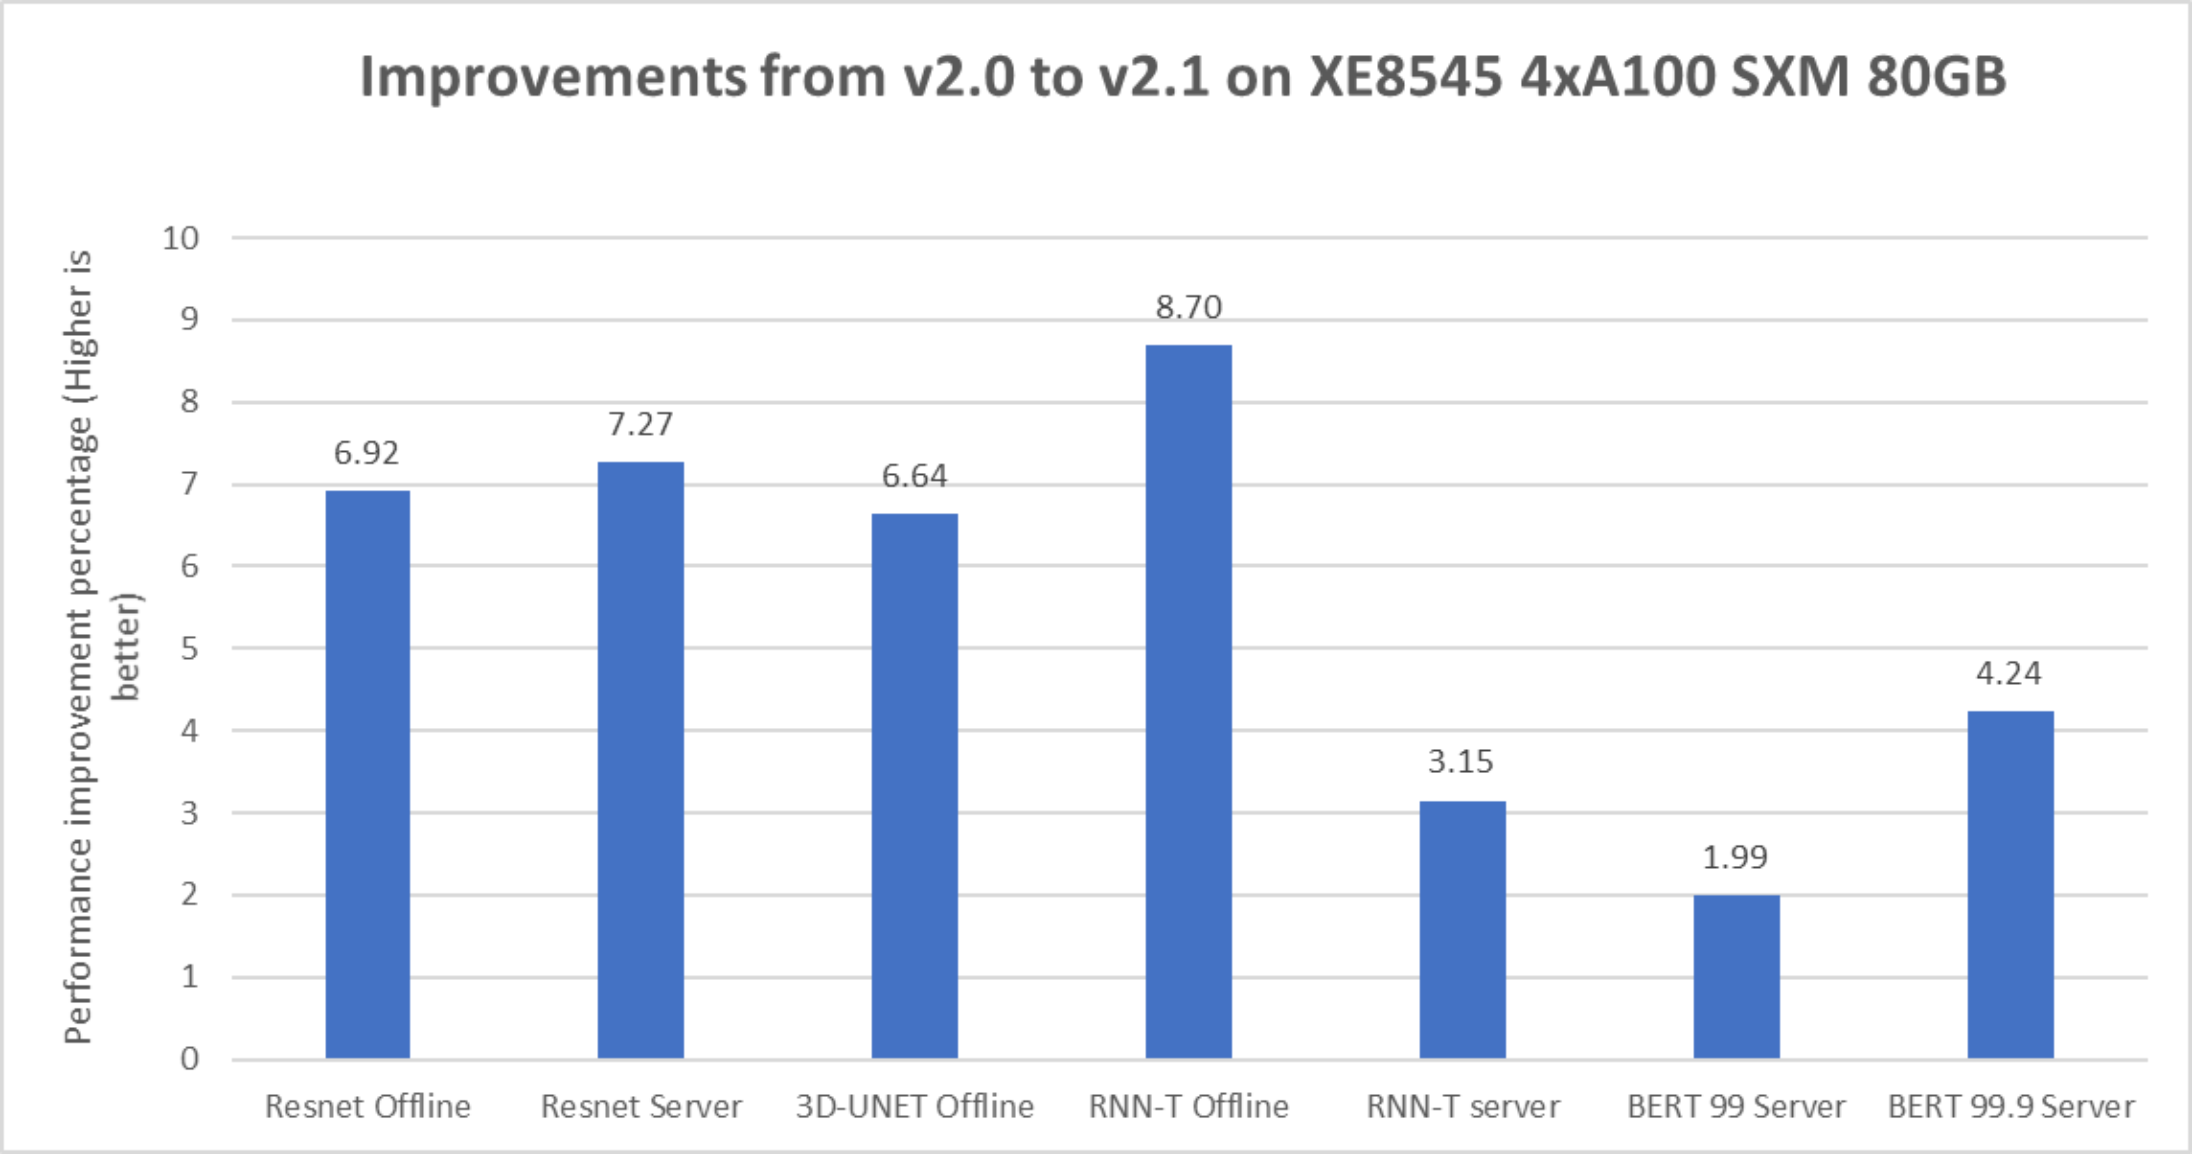
Figure 14. Improvement of performance of different workloads on the PowerEdge XE8545 server for MLPerf v2.1
The preceding graphs show the performance improvement with MLPerf Inference v2.1 compared to MLPerf Inference v2.0. The RNN-T Offline scenario had the most performance improvement with the PowerEdge XE8545 server followed by the ResNet scenario. The PowerEdge XE8545 server delivered considerable performance gains from software improvements. For more information about the software improvements, see NVIDIA’s inference 2.1 blog.
Performance/watt comparison for MLPerf Inference v2.0 and MLPerf Inference v2.1
For some customers, optimizing power efficiency is a primary concern. It becomes more essential in an inference deployment setting, sometimes while simultaneously competing for space and power. We understand the concern and provide performance and power results. This section demonstrates the performance and power improvement that we observed in MLPerf Inference v2.1 over MLPerf Inference v2.0.
In this round of MLPerf Inference v2.1, we made submissions that tune for a higher number of inferences per watt. The major difference between MaxQ and non-MaxQ systems is the power measurement along with performance. You might wonder why the throughput of an identical non-MaxQ system is higher than that of a MaxQ system in our submissions. We made some tradeoffs to suit the system to optimally deliver high performance/watt as opposed to only high performance. We noticed significant improvements in performance/watt that were made in MLPerf Inference v2.1.
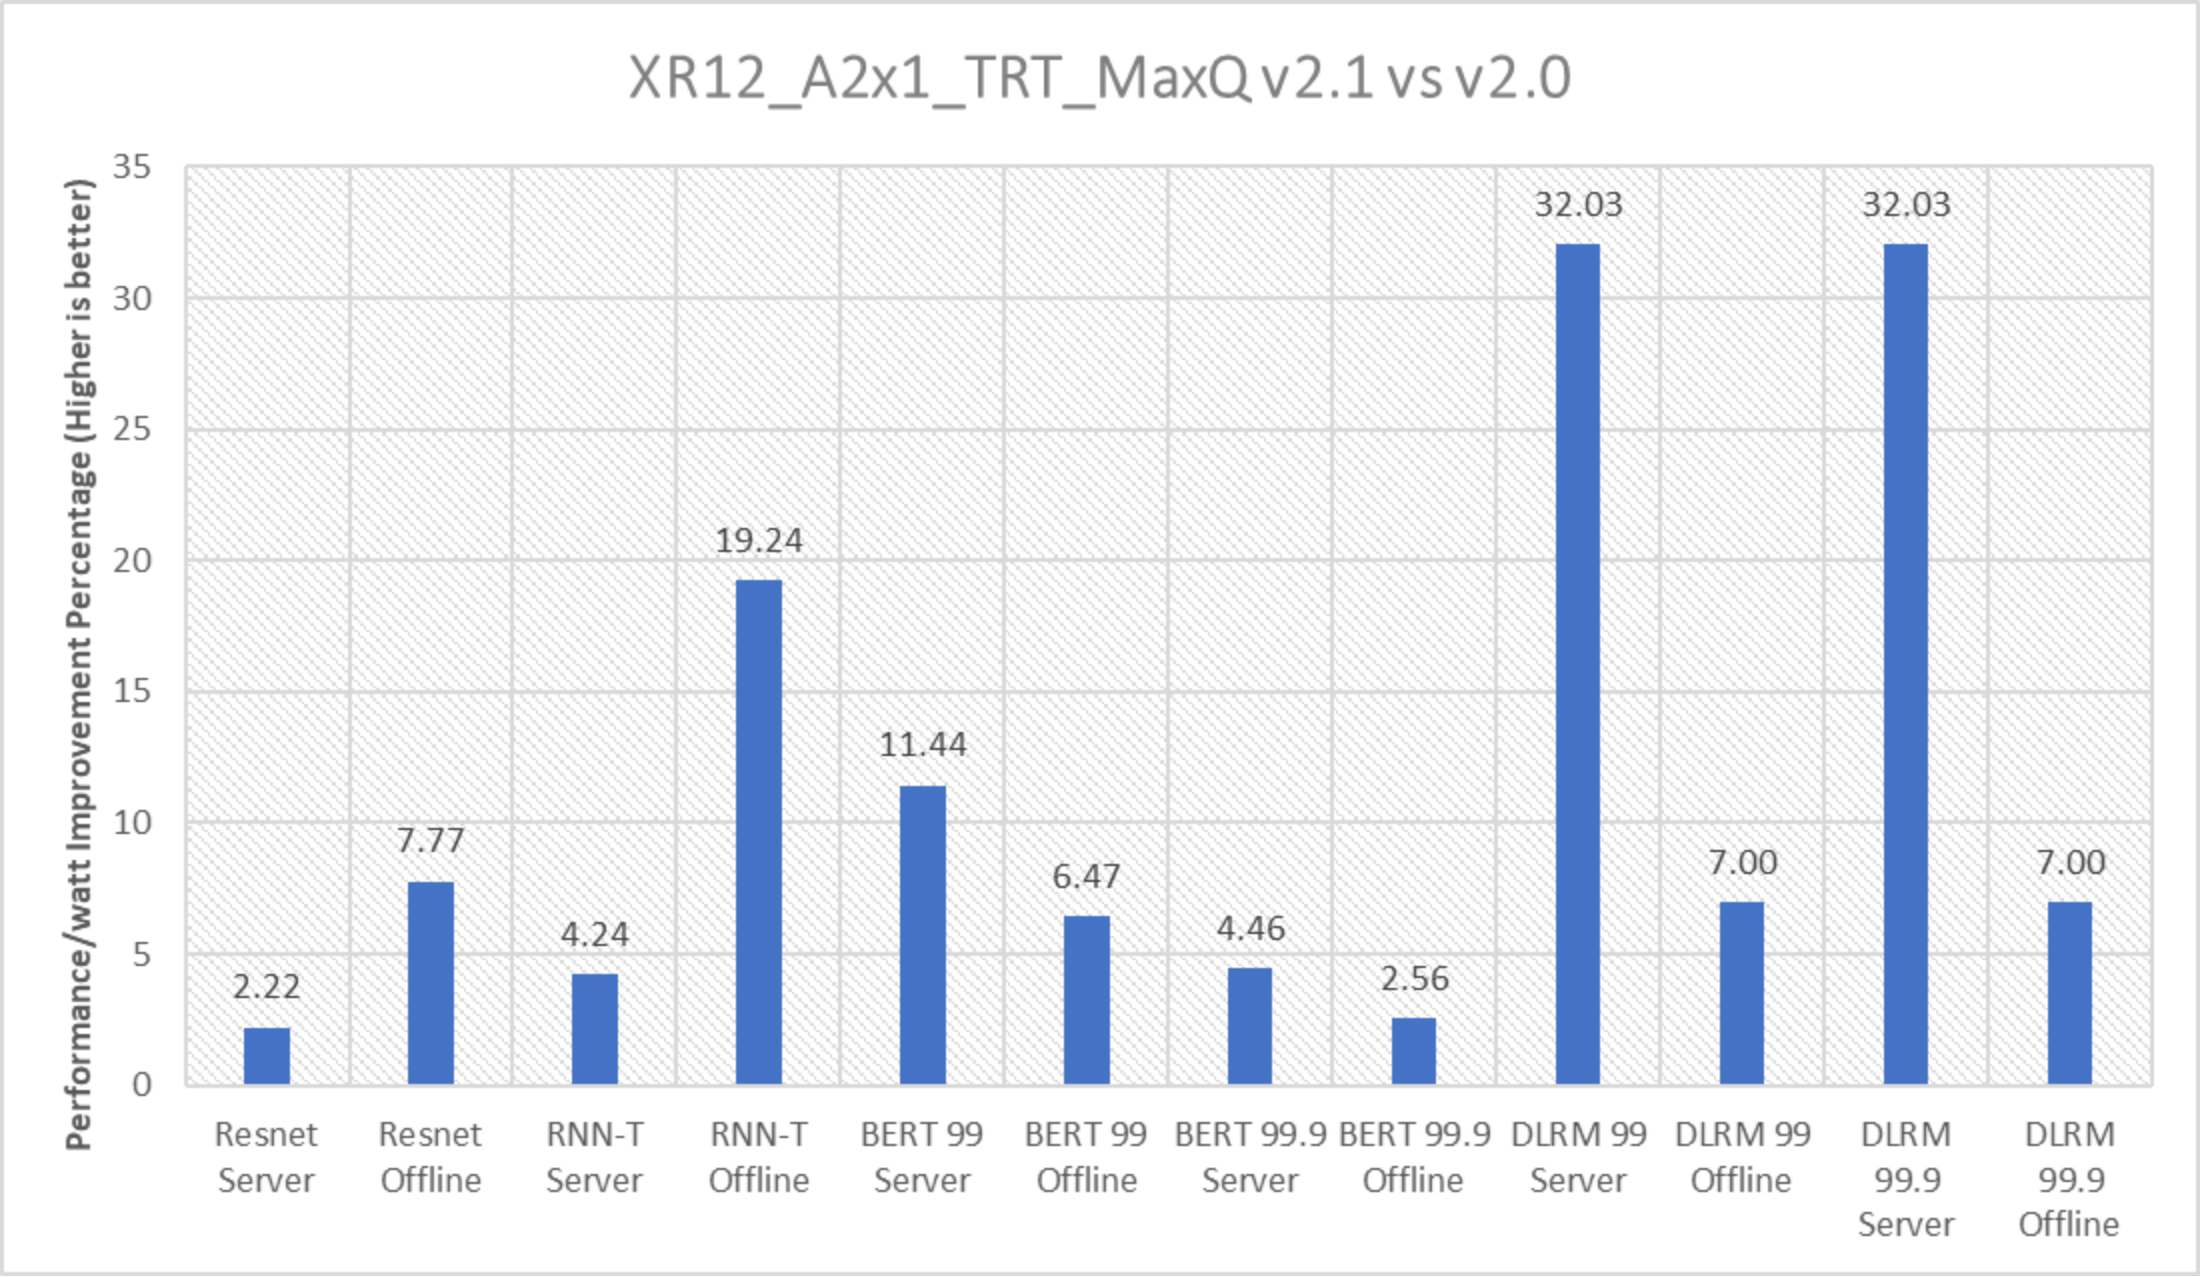
Figure 15. Performance/watt improvement with the PowerEdge XR12 server with one NVIDIA A2 accelerator
For power submissions, we derive a metric to measure the power efficiency of the system. We divide the throughput by the power used during the full run (in watts) and obtain performance/watt also known as inferences per watt.
The y axis in the above figure describes the delta in inferences per watt between inference v2.1 and v2.0 submissions. DLRM Server delivered highest improvement in perf/watt at approximately 32 percent followed by RNN-T Offline.
Performance/watt profile such as DAPC was set in the iDRAC during our runs, it helps to improve the power efficiency of the system.
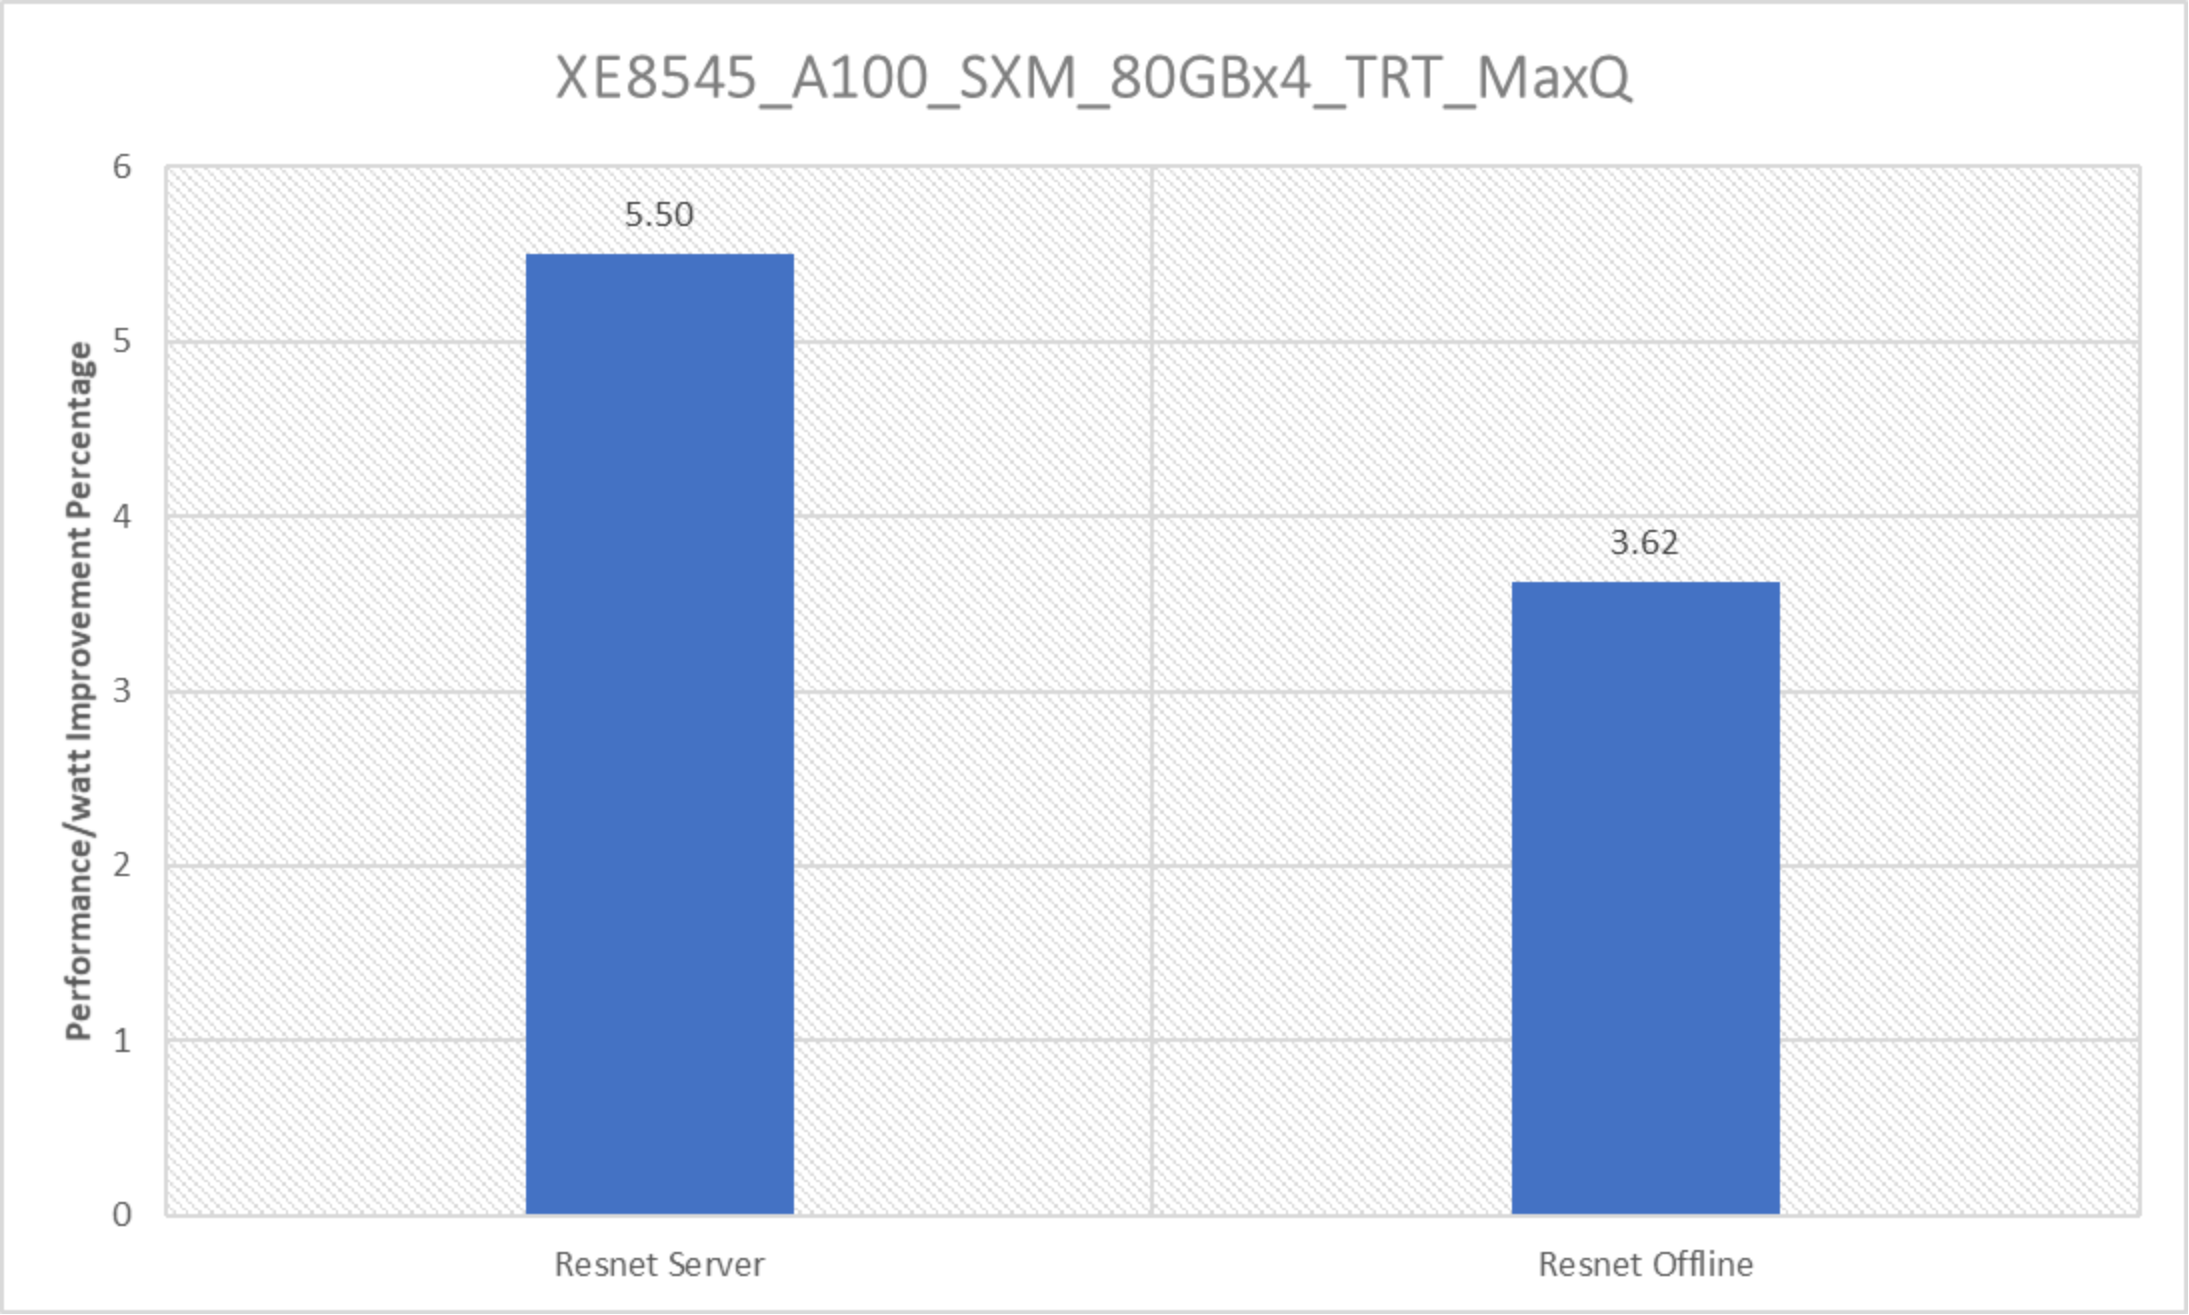
Figure 16. Performance/watt improvement with the PowerEdge XE8545 server with four NVIDIA A100 SXM accelerators with ResNet
The PowerEdge XE8545 server with four A100 SXM GPUs delivered improvements in performance/watt with the ResNet Server. Because there are no references for performance/watt from MLPerf Inference v2.0 to compare for other than ResNet benchmark, the preceding graph only has ResNet benchmarks. However, with MLPerf Inference v2.1, the PowerEdge XE8545 server delivers outstanding performance/watt even with other workloads scores as seen in Figure 3.
