Home > AI Solutions > Artificial Intelligence > White Papers > MLPerf™ Inference v2.1 with NVIDIA GPU-Based Benchmarks on Dell PowerEdge Servers > Summary
Summary
-
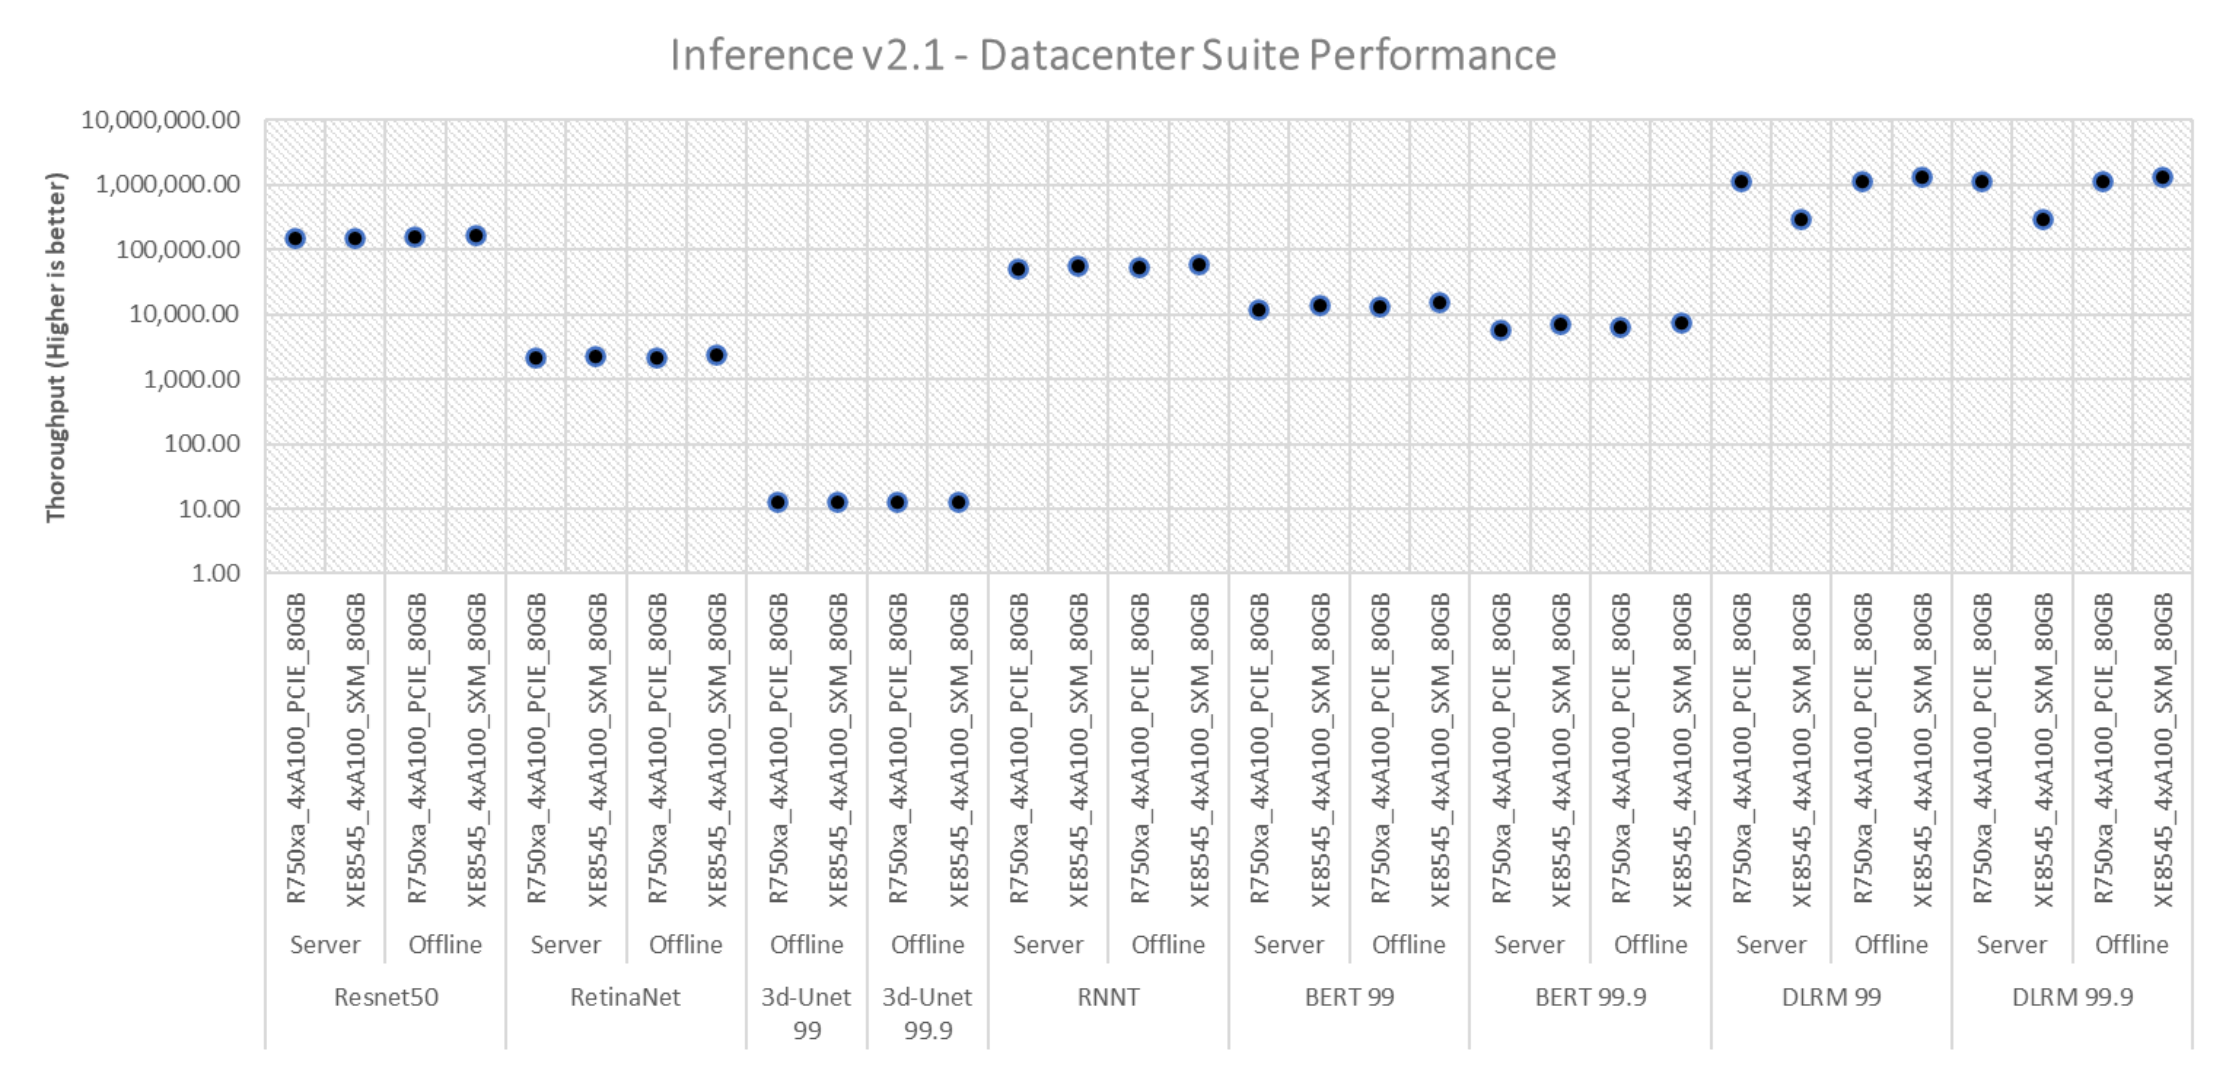
The following figure with exponentially scaled y axis shows the performance delivered in the data center suite for systems involved in performance-only runs. These systems do not include the MaxQ configuration (optimized for power efficiency).

Figure 2. Throughput of systems with performance metric in the data center suite across different areas, tasks, and benchmarks
The graph represents the server’s ability to deliver high throughput across different tasks such as image classification, object detection, image segmentation, speech recognition, natural language processing, and recommender systems. All these results and the results on the following graphs have all been submitted to MLCommons and have passed the compliance tests. Because the benchmarks are in one graph, the minimum and maximum ranges for the throughput vary based on each benchmark. The preceding graph has an exponentially scaled y-axis.
The following table explains the definition of a sample in different benchmarks:
Table 7.
Model
Definition of one sample
Resnet50-v1.5
One image
RetinaNet
One image
3D UNET
One image
RNNT
One raw speech sample up to 15 seconds
BERT
One sequence
DLRM
Up to 700 user-item pairs (more details in FAQ)
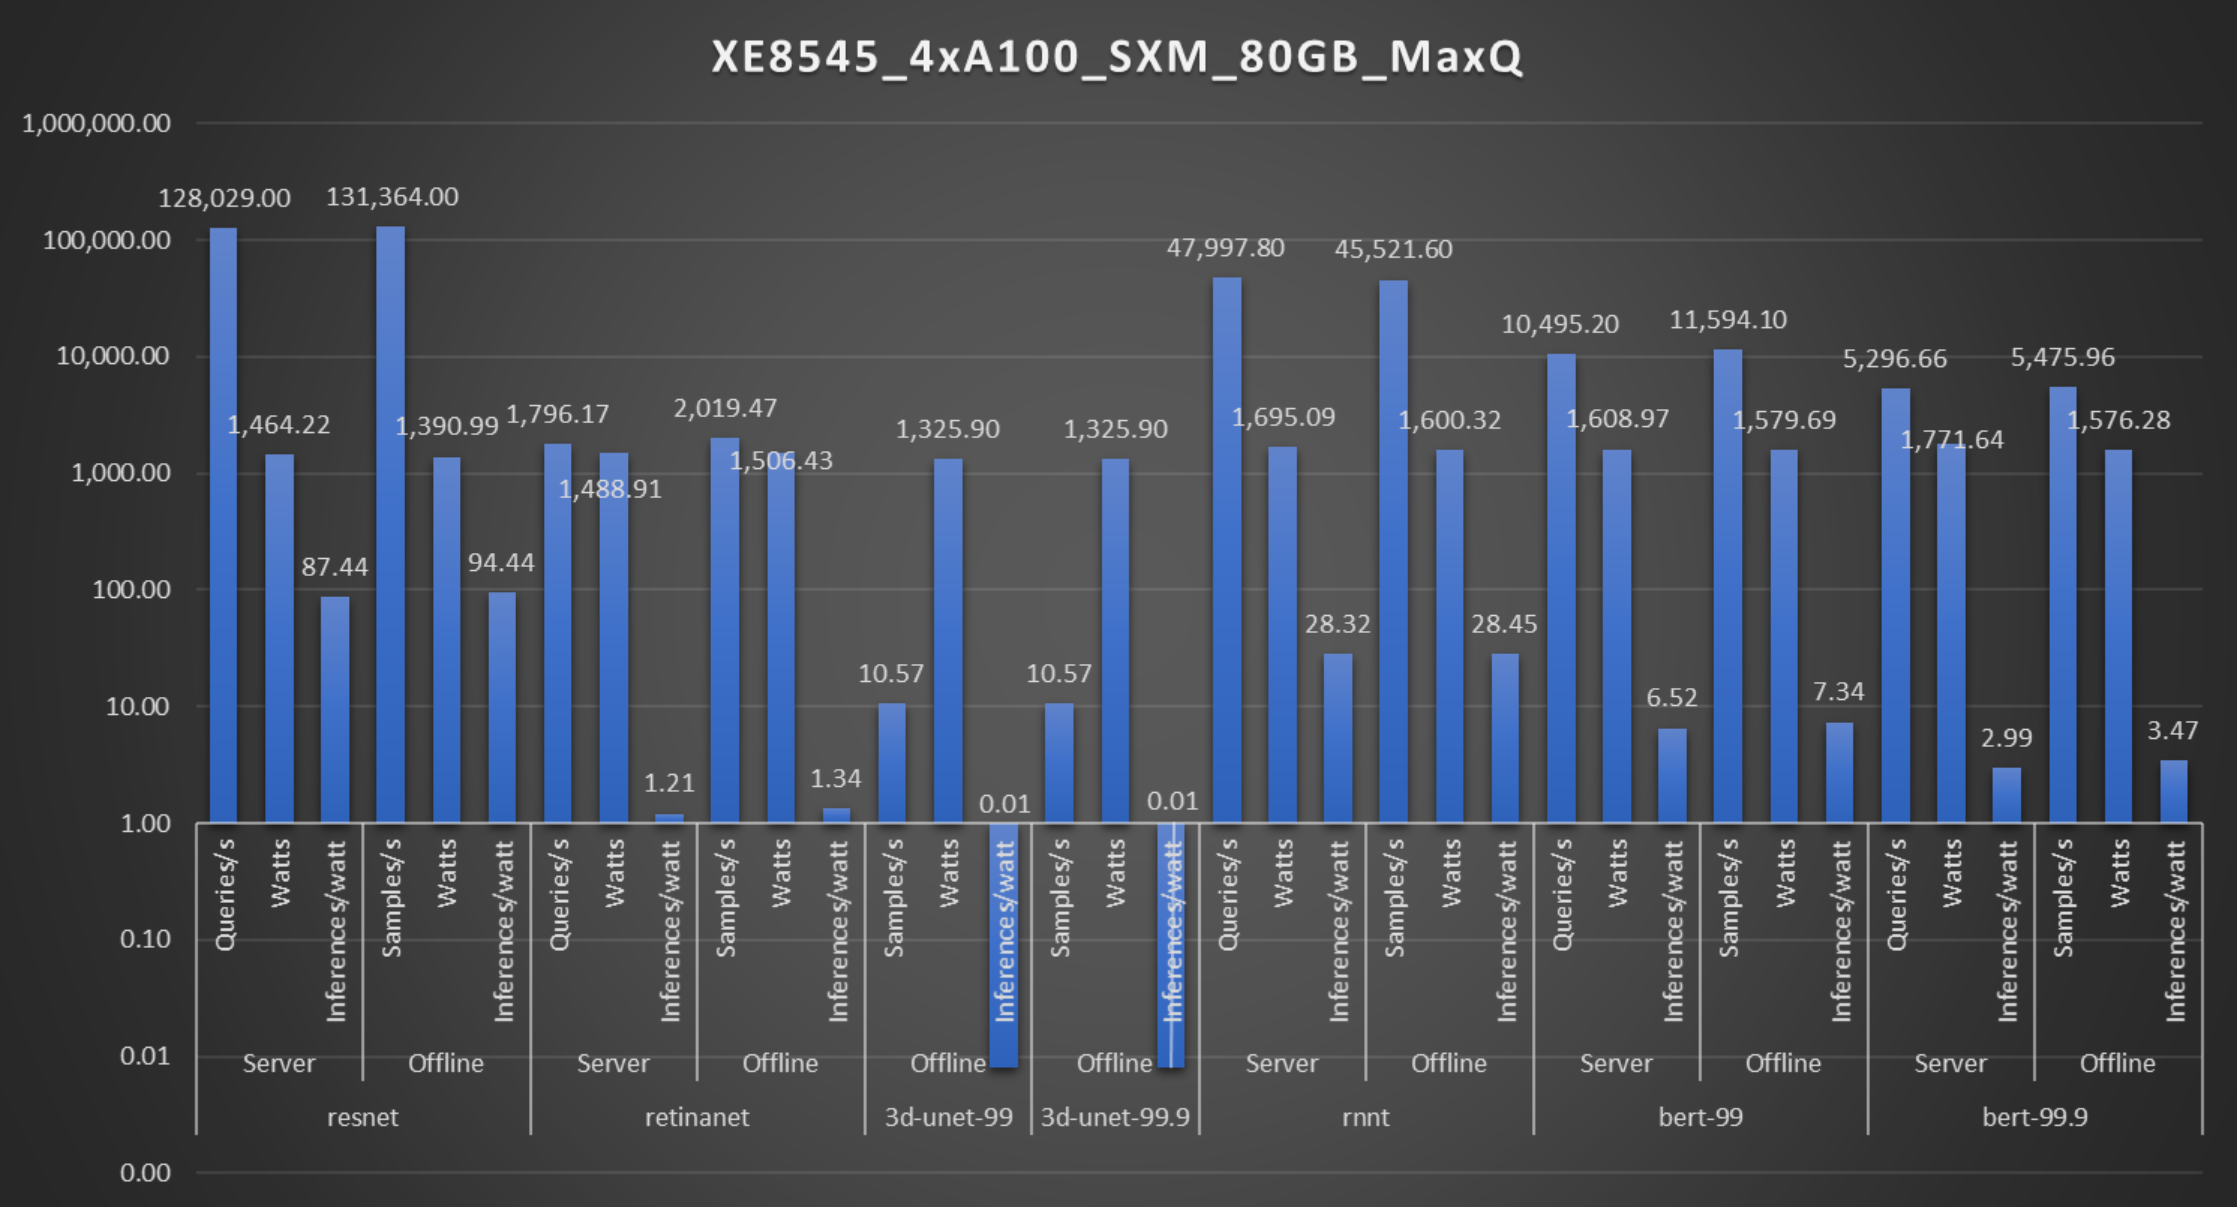
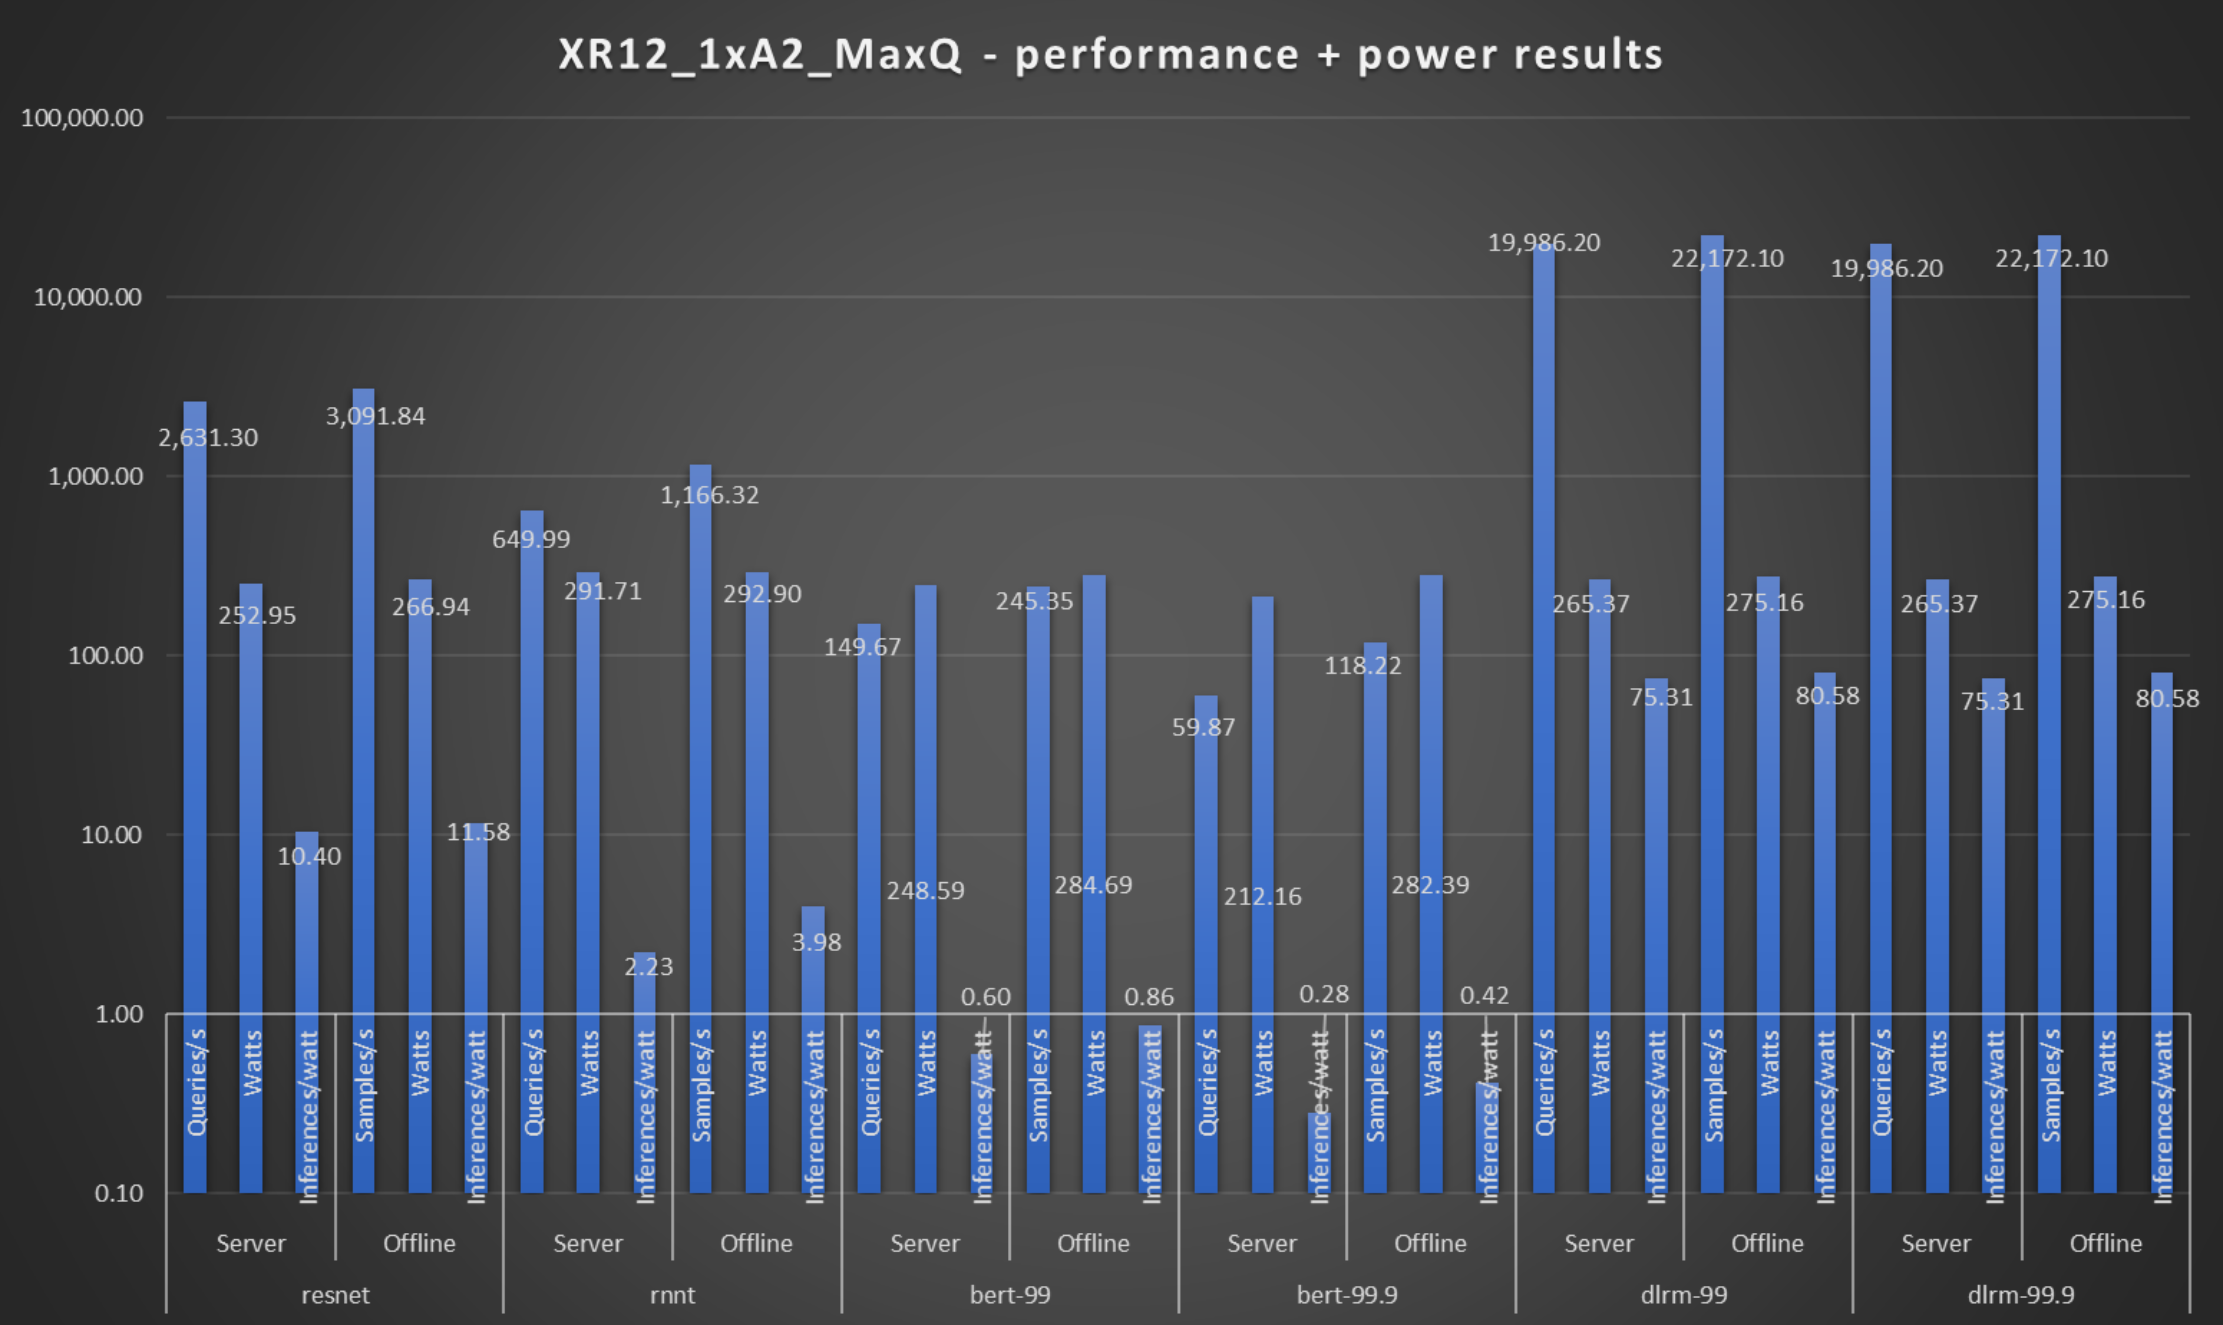
The following figures show the systems with the MaxQ configuration.


Figure 4. Performance and power consumption of a PowerEdge XR12 system with the NVIDIA A2 Accelerator
The preceding figures show the power consumed by the PowerEdge XE8545 server with 4xA100 SXM accelerators and the PowerEdge XR12 system with one NVIDIA A2 accelerator respectively.
The throughput of the system when divided by the power consumed during the benchmark run provides a derived inferences/watt metric in the data center suite. It represents the system’s ability to deliver inferences by consuming a unit watt (1 W) of power.
For example, on the PowerEdge XR12 server with the ResNet model in the offline scenario, 1 W of power can deliver 11.58 image classifications per second while maintaining an accuracy of about 76.42 percent.
On the PowerEdge XE8545 server, 1 W of power can deliver 94.4 images classifications per second while maintaining an accuracy of about 76.42 percent. See Figure 3.

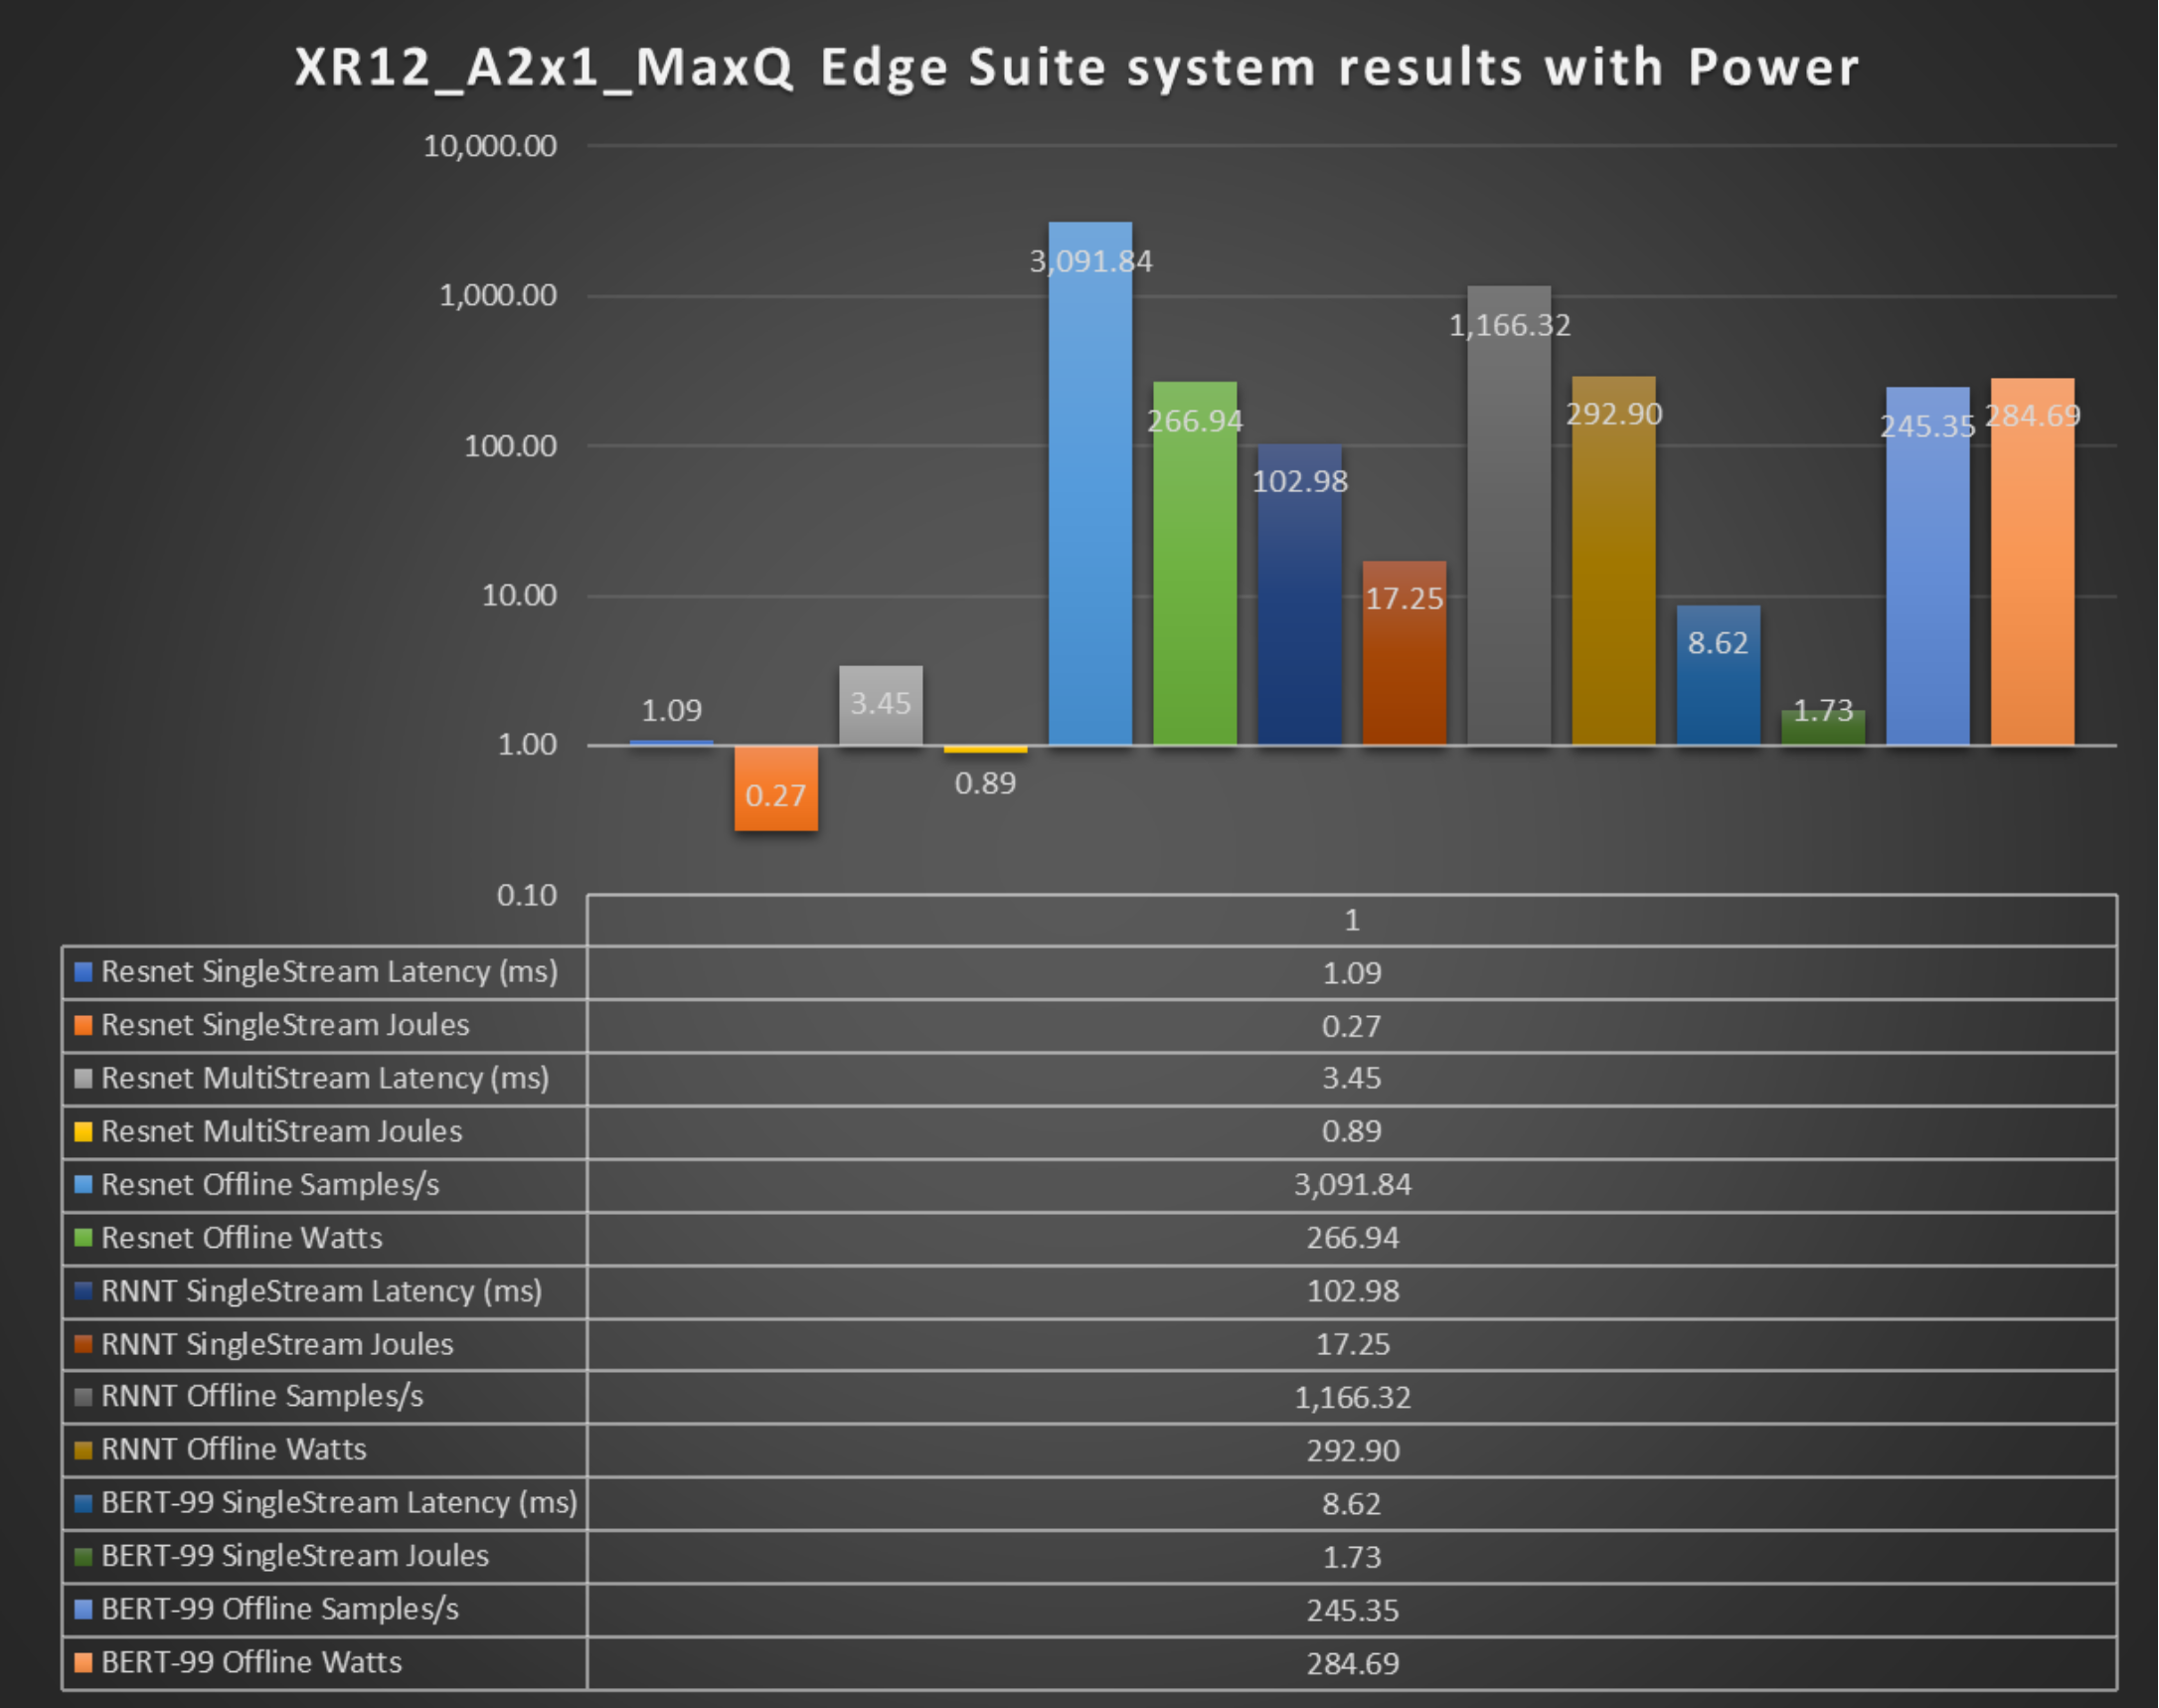
Figure 5. Power results of the PowerEdge XR12 server in the edge suite of MLPerf
The preceding figure shows the performance and power metrics of the edge suite for the ResNet, RNN-T, and BERT benchmarks. The power metrics are:
- System power utilization in the Offline scenario (Watts)
- Energy consumed by the system in the Singlestream and Multistream scenarios (Joules)
SingleStream and MultiStream scenarios measure the latency of the system.
As seen above, the PowerEdge XR12 server with one NVIDIA A2 accelerator performed optimally delivering high performance/watt in edge settings. These results make the PowerEdge XR12 server well suited for edge settings because it can handle different scenarios with a smaller area for deployment and it is also marine-compliant.
The preceding graphs illustrate that these servers can not only run different tasks, but also deliver outstanding performance across different deployment scenarios. These numbers can also serve as a starting point for making data-driven decisions to acquire new hardware or upgrade existing hardware.
