Home > Edge > Manufacturing Edge > Guides > Dell Validated Design for Manufacturing Edge - Design Guide with Litmus > Litmus system design
Litmus system design
-
Overview
The system design combines the architectural components to show an overall unified stack of the industrial edge to enterprise edge. This chapter offers guidance on aspects of the stack such as networking, security, and best practices based on the components within the solution. It introduces considerations for a successful deployment of a Dell PowerEdge and VxRail platform with Litmus Edge, Litmus Edge Manager, and Streaming Data Platform. The following chapters will provide more in-depth explanations for several topics covered here.
Figure 16. Data flow design 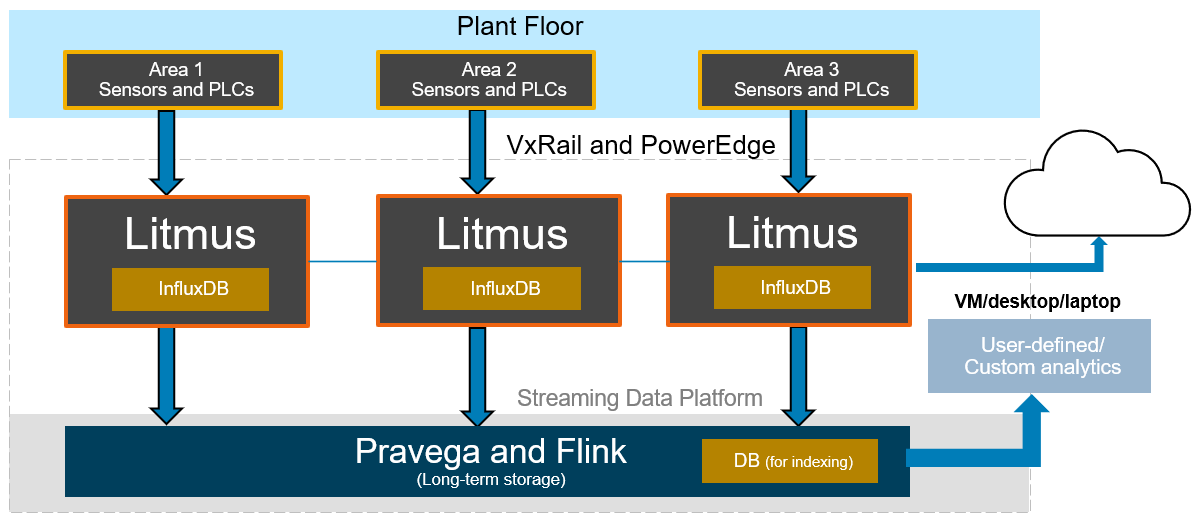
Service level management
VxRail with VMware vSAN, vMotion, DRS, and other data services provide a flexible way to deploy Litmus and SDP applications on VMs. Such deployments can use different storage capacity profiles, CPU, memory and storage resources, and access to storage and compute. They leverage customizable policies to control the resources while being highly available and fault tolerant. VxRail is also a highly consolidated environment, so it can support multi-tier applications ranging from mission critical to mid-tier, and even DEV/QA and reporting applications. Using VM cloning coupled with application-level configuration profiles, it is easy to create and refresh these environments from production applications on demand. In multi-tier environments, design choices for service level management of Dell Edge Solutions on VxRail include the following:
- Identify the performance and storage needs of the Litmus Edge and SDP application stacks and define the service profiles. Consider the following to determine appropriate service levels:
- Interdependencies
- Resource requirements
- Data protection
- High availability requirements
- Number and types of connected users and devices
- Conditions under which the systems operate
- Both Litmus and SDP products use store and forward buffers to handle disconnected scenarios by leveraging local files while data repositories are not available. Depending on the workload profiles of these applications, select appropriate persistent store and forward buffer sizes, as well as VxRail datastores with desired policies to meet latency and throughput requirements for datastores.
- The default VxRail vMotion policies, which often govern live migrations and load balancing based on CPU and memory resource contention, might be suitable for most applications; but host rules customizations are possible for host or VM affinity so that they move together.
Interdependencies
Edge deployments involve multiple plants, factories, fleet, and multitier fleet management. They use a diverse set of devices, automation functions, and capabilities, and they serve different use cases. The sizing section of this solution provides guidance on tag-based deployment for Litmus Edge and Litmus Edge instances ingesting data to SDP on VxRail and PowerEdge systems. There could also be external Litmus Edge instances running on gateway devices that ingest data to Litmus Edge instances on this infrastructure. Data ingest throughput, latencies, and available storage capacity depend on proper resource availability for all these systems. The performance and flexibility available for real-time and historical analytics running on Litmus Edge, and aggregated analytics from SDP persistent store, are also governed by how the solution is deployed and whether interdependent data sets are readily available instead of running complex queries and joins across multiple data sources and providers. User experience for data visualization also improves with properly planned data layout. When deploying this solution, consider the interdependencies of all these components so that the solution can serve an appropriate number of users and devices to ensure that service levels for various fleet and factories can be met.
Resource requirements
This solution relies on multi-data ingest streams, internal data providers like InfluxDB and TimescaleDB, persistent live-cache and long-term store managed by Pravega, and several other software components. Grafana, flows manager, user-defined analytics, and integrations are also supported by the solution. CPU, memory, and storage requirements for all these components are properly configured at the time of deployment, but some long running or ad-hoc operations may impose additional stress on the system. Additional resources beyond those recommended in Litmus sizing and scaling guidance may be necessary to support them. The flexibility and agility provided by VxRail, Litmus, and SDP simplify such resource management.
Data protection and high availability requirements
Multi-tier applications have different data protection and high availability requirements. Consider the frequency of backups, import/export for data and user-defined flows and configurations, scripts and container manifest files, volumes used by containers for persistent storage, and general backup of applications and back-end data stores to ensure that data protection and HA service levels for all these applications are met. The retention period for the ingested data can also be set to balance the resource requirements for mid-tier or low-tier applications, while keeping longer retention for mission-critical applications. Periodic clones of various VMs, external backups, and replication can also be configured at appliance level for improving Recovery Point Objective (RPO) and Recovery Time Objective (RTO) in the event of a disaster and to ensure the highest level of availability and recoverability using surviving or stand-by sites.
Number and types of connected users and devices
The number of users and devices performing data ingest, analytics, and visualization operations on the edge platform vary. Some users and devices remain active 24/7, and their workload profile is generally predictable. Others come alive periodically, and their workload profile depends on the type of processing they are doing and the scale of data they are ingesting or accessing. These users may impose sudden stress on the system with high IOPS or high bandwidth requirements. Systems should be capable of managing such an impetus to minimize the impact on normal operations. Such service levels can be managed by controlling resources available to such processes, or by scheduling such operations during off-peak hours. Virtualized and containerized environments with Litmus and SDP allow rapid creation of short-term environments.
Conditions under which the systems operate
Many edge systems operate under harsh conditions such as sudden temperature changes, frequent network outages, and sudden stress on the system due to long-running or time-sensitive processes. Any solution should be deployed to address worst-case scenarios to the best of its ability. VM-based deployments for Litmus Edge allow for easy provisioning of additional configurations, in case systems become heavily loaded, by using a standard, template-based deployment managed by the user or through Litmus Edge Manager instances. SDP instances can also be easily deployed, in case conditions require additional instances to be brought up for persistent store.
Latencies and throughput
Edge devices that serve manufacturing operations should have very low latencies to address predictive maintenance and operational issues in a timely manner. The Dell Validated Design for Manufacturing Edge is deployed in different layers to address the needs at plant, factory, and fleet levels, and to assign an appropriate set of compute, storage, and network resources to meet latency and throughput requirements.
Industrial gateways have limited resources compared to VMs deployed on VxRail. Also, they may not have access to persistent resources locally, so while they can be used to run some local analytics, more complex and resource-intensive operations should be offloaded to systems running on VxRail. For such complex systems, consider leveraging more CPU cores, higher memory, and high-performance storage tiers for mission-critical deployments, as compared to mid-tier or low-priority workflows.
Latency and throughput varies depending upon sensors and PLCs data, however, the following figure shows that the Dell Validated Design for Manufacturing Edge scales linearly for throughput while keeping the latency low.
Figure 17. Data ingestion rate versus latency 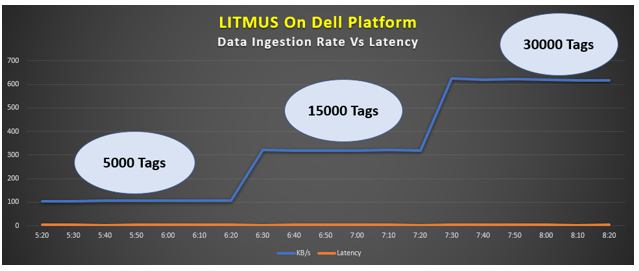
Litmus and SDP network considerations
There are a few factors to consider when deploying either Litmus Edge, Litmus Edge Manager, or Streaming Data Platform as VMs hosted on a VxRail cluster.
- Plan VLAN assignments for Litmus and SDP and map them to port groups accordingly.
- Network services such as DNS and NTP should be reachable to the port groups connected to Ltimus or SDP VMs.
- Verify that the different software components can communicate. For example, Litmus Edge must be able to send data to SDP.
- Reserve the required amount of IP addresses for Litmus and SDP.
Litmus security design
Designing and planning for security before deployment is recommended to build a more effective cybersecurity solution. For more details on security and validation of the DVD components, see the Cybersecurity chapter.
Litmus Edge
Litmus Edge (LE) is the industrial edge computing platform that allows operators to collect, analyze, and act on real-time data at the edge. LE provides out-of-the-box support for any PLC, CNC, sensor, or robotic system, allowing operators to rapidly connect devices. Operators can share normalized data between any edge, big data, cloud, or enterprise system. Litmus Edge deploys an extensive variety of devices in an industrial environment using native drivers. Support is provided for many protocols or buses using an IPC appliance that is connected to the Internet. LE uses normalized data so the raw or processed data from any type of device can be visualized and analyzed at the edge.
An operator or user can access Litmus Edge with a software-defined private network anywhere, no matter where in the world it resides.
Figure 18. Litmus Edge high-level reference architecture 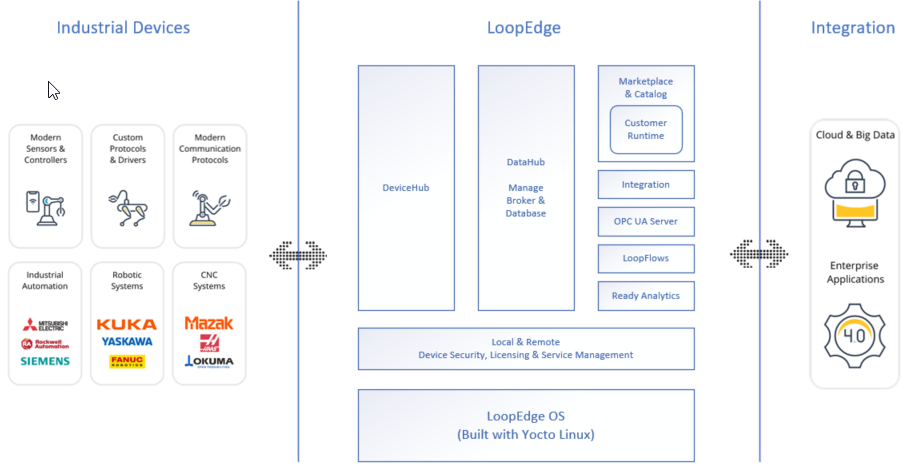
Main functions
Litmus Edge provides the following main functions:
- Enables secure data collection from an industrial device.
- Normalizes data once collected.
- Processes, analyzes, and stores data at the edge.
- Runs container-based applications on top of the data.
- Provides time-series analysis using ready analytics and KPIs.
- Provides flow functionality to use configuration and analytics.
- Integrates edge systems to cloud or enterprise systems.
Features
Litmus Edge is comprised of modules that help operators configure and visualize data from the devices on the network.
Dashboard
The main dashboard shows the CPU, memory, and network usage charts. Dashboard charts contain detailed information about your system.
Figure 19. Example of Litmus Edge dashboard 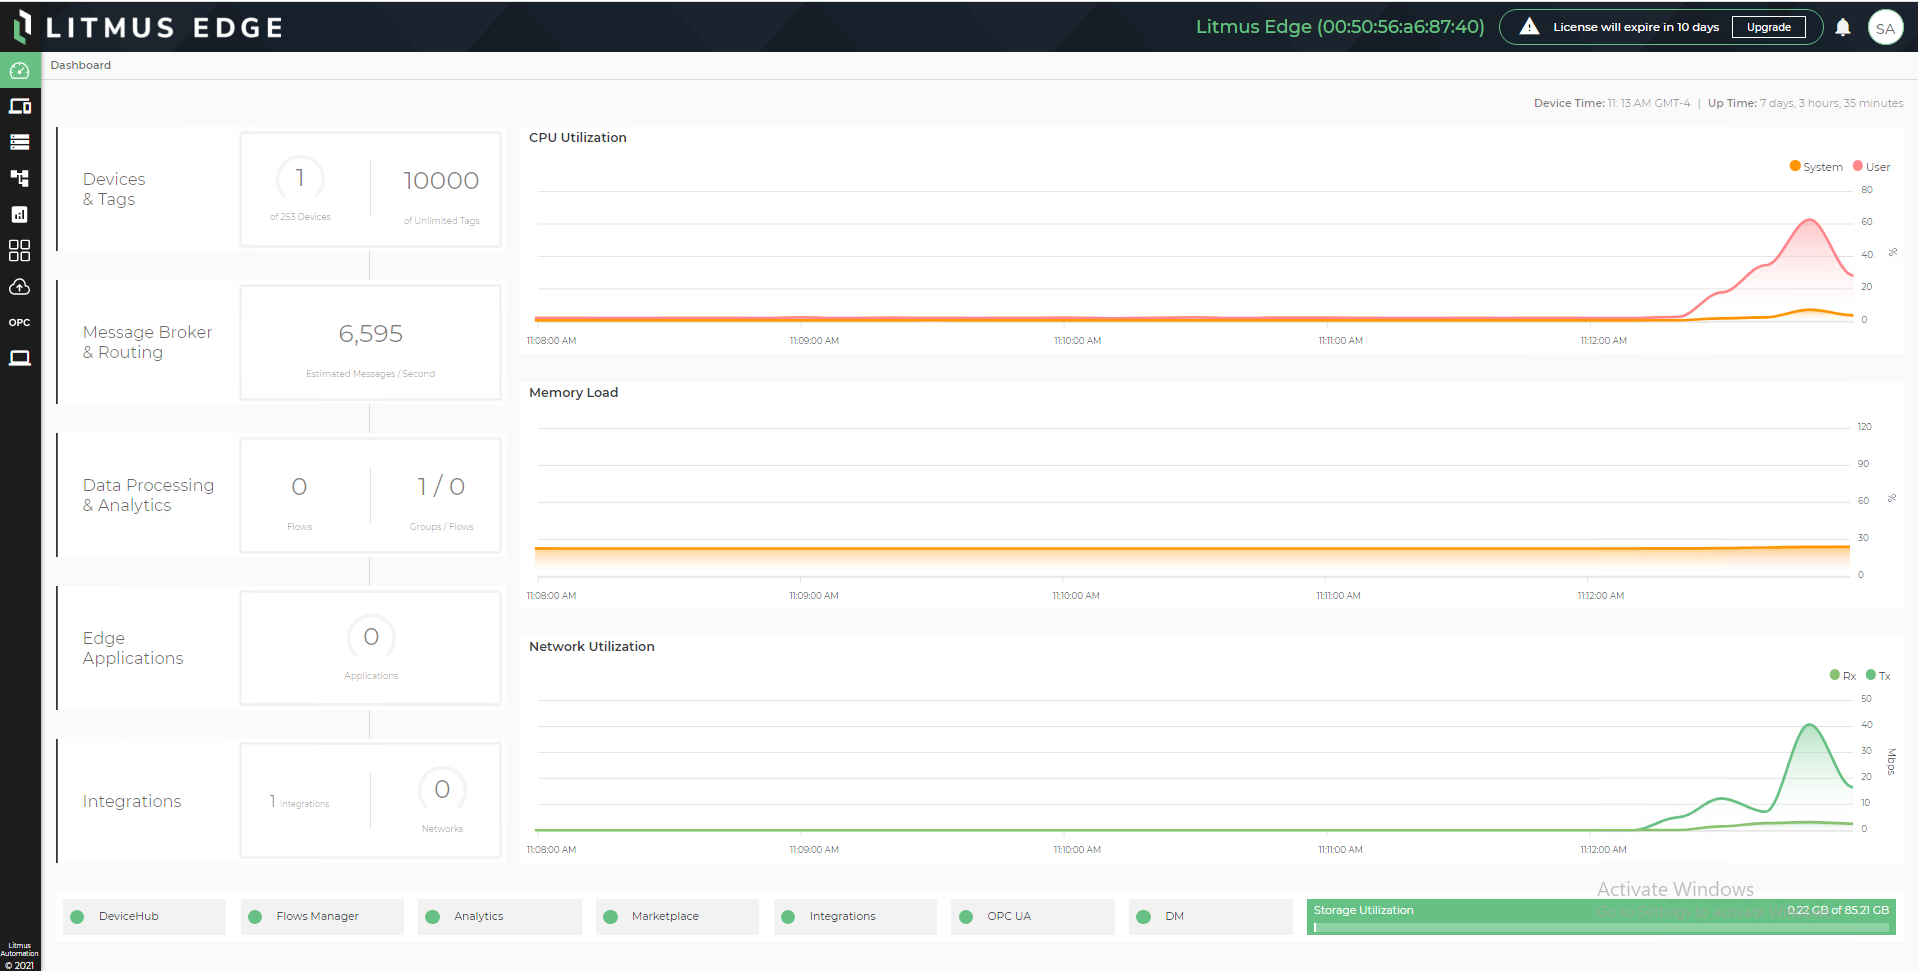
DeviceHub
DeviceHub provides the mechanism for connecting to physical devices, allowing the operator or user to collect data.
- DeviceHub must be configured for southbound connections, including connections to a DCS (Distributed Control System), PLC (Programmable Logic Controller), or sensor.
- DeviceHub includes a myriad of device drivers supported by many PLC manufacturers, such as Siemens, Allen-Bradley, Mitsubishi, Omron, and so on.
- DeviceHub collects data from controllers or sensors, classifies the data by adding OMA (Open Mobile Alliance) tagging, and publishes it to a message broker or NATS client for further distribution.
- Data is collected from physical devices and published to an internal message broker. The data can be sent securely to the cloud or to a database using connectors in integration.
- PLC-level statistics and I/O data can be obtained at the edge using DeviceHub.
Figure 20. Litmus Edge DeviceHub connection example 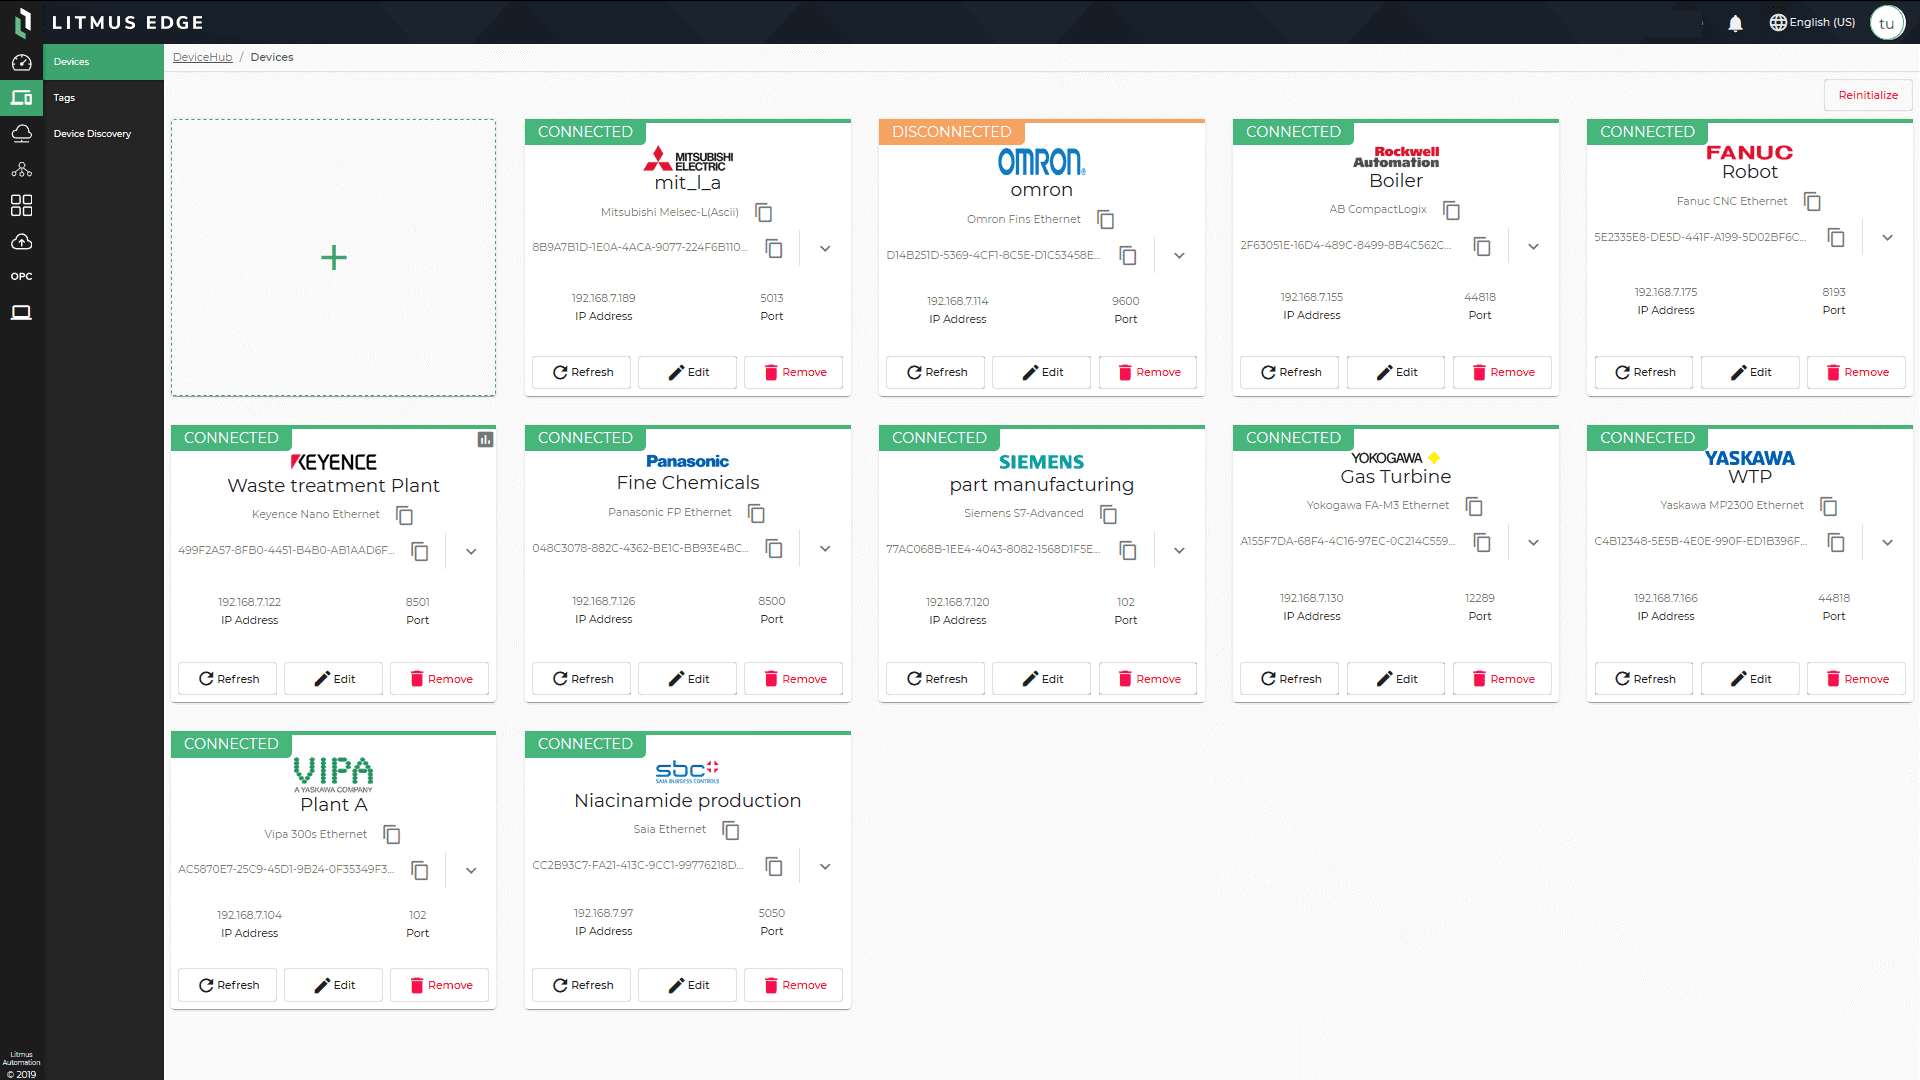
DataHub
DataHub allows operators to store data generated from connected devices that have data storage enabled. Datahub is used to manage the data stored in the NoSQL time-series database that Litmus Edge offers. Users can choose to store data for a specific time period to perform batch analytics on the historic data.
The DataHub module is divided into two sub-modules that allow addressing different functionality for data.
From the DB Management pane, the operator can remove a database, expand a database view to display connected devices that have data storage enabled, and remove specific data storage for a connected device.
Figure 21. Litmus Edge DB Management pane showing different data metrics 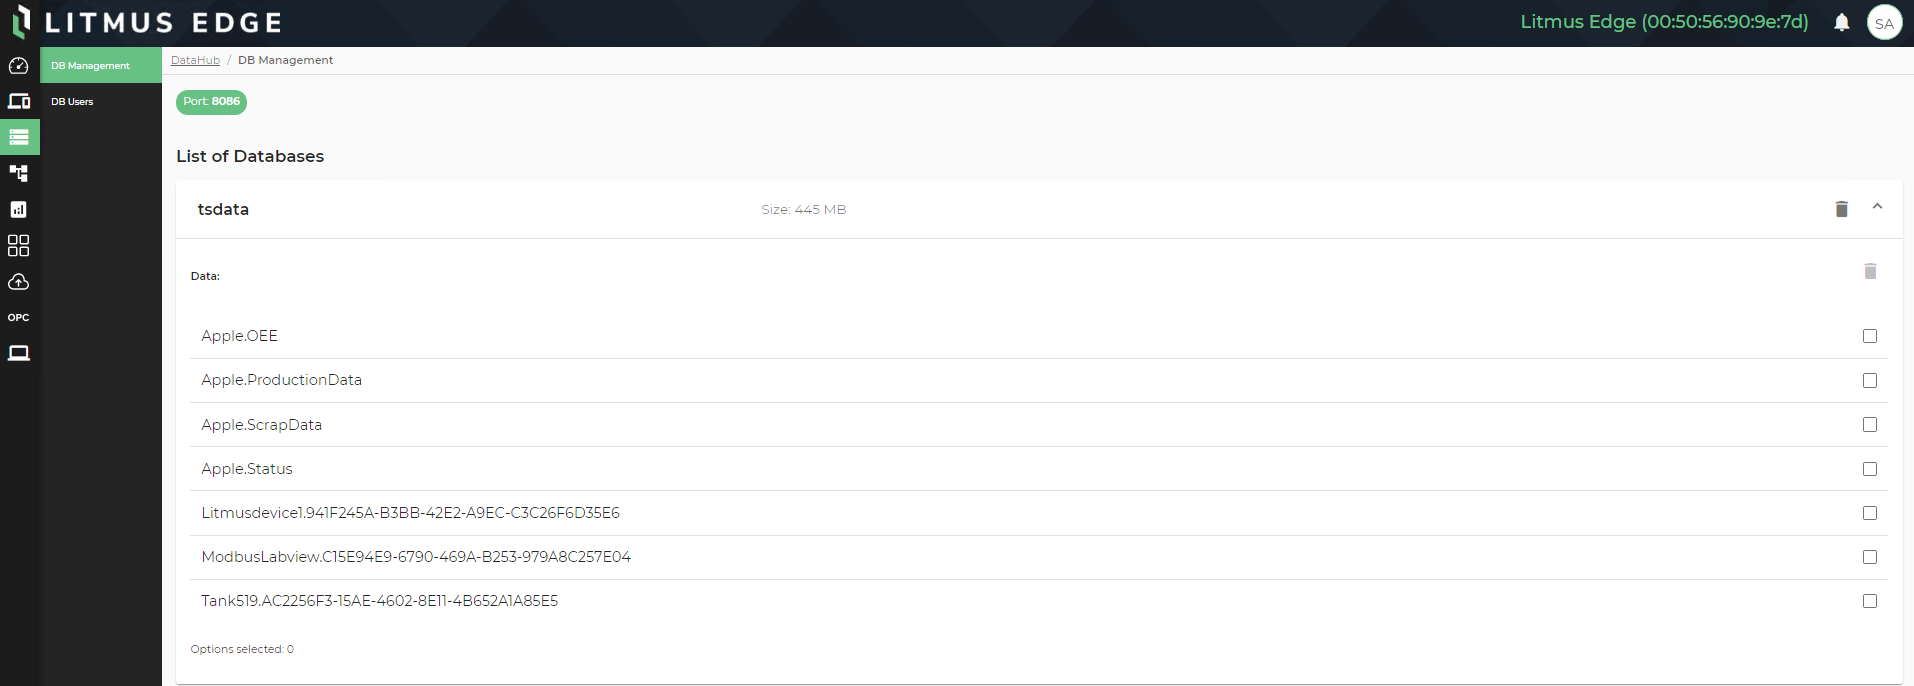
From the DB Users pane, operators can add and delete database users, reset a user's password, and add privileges to a user. Users can filter the user list. The following figure shows a view of DB Users.
Figure 22. Litmus Edge DB Users pane 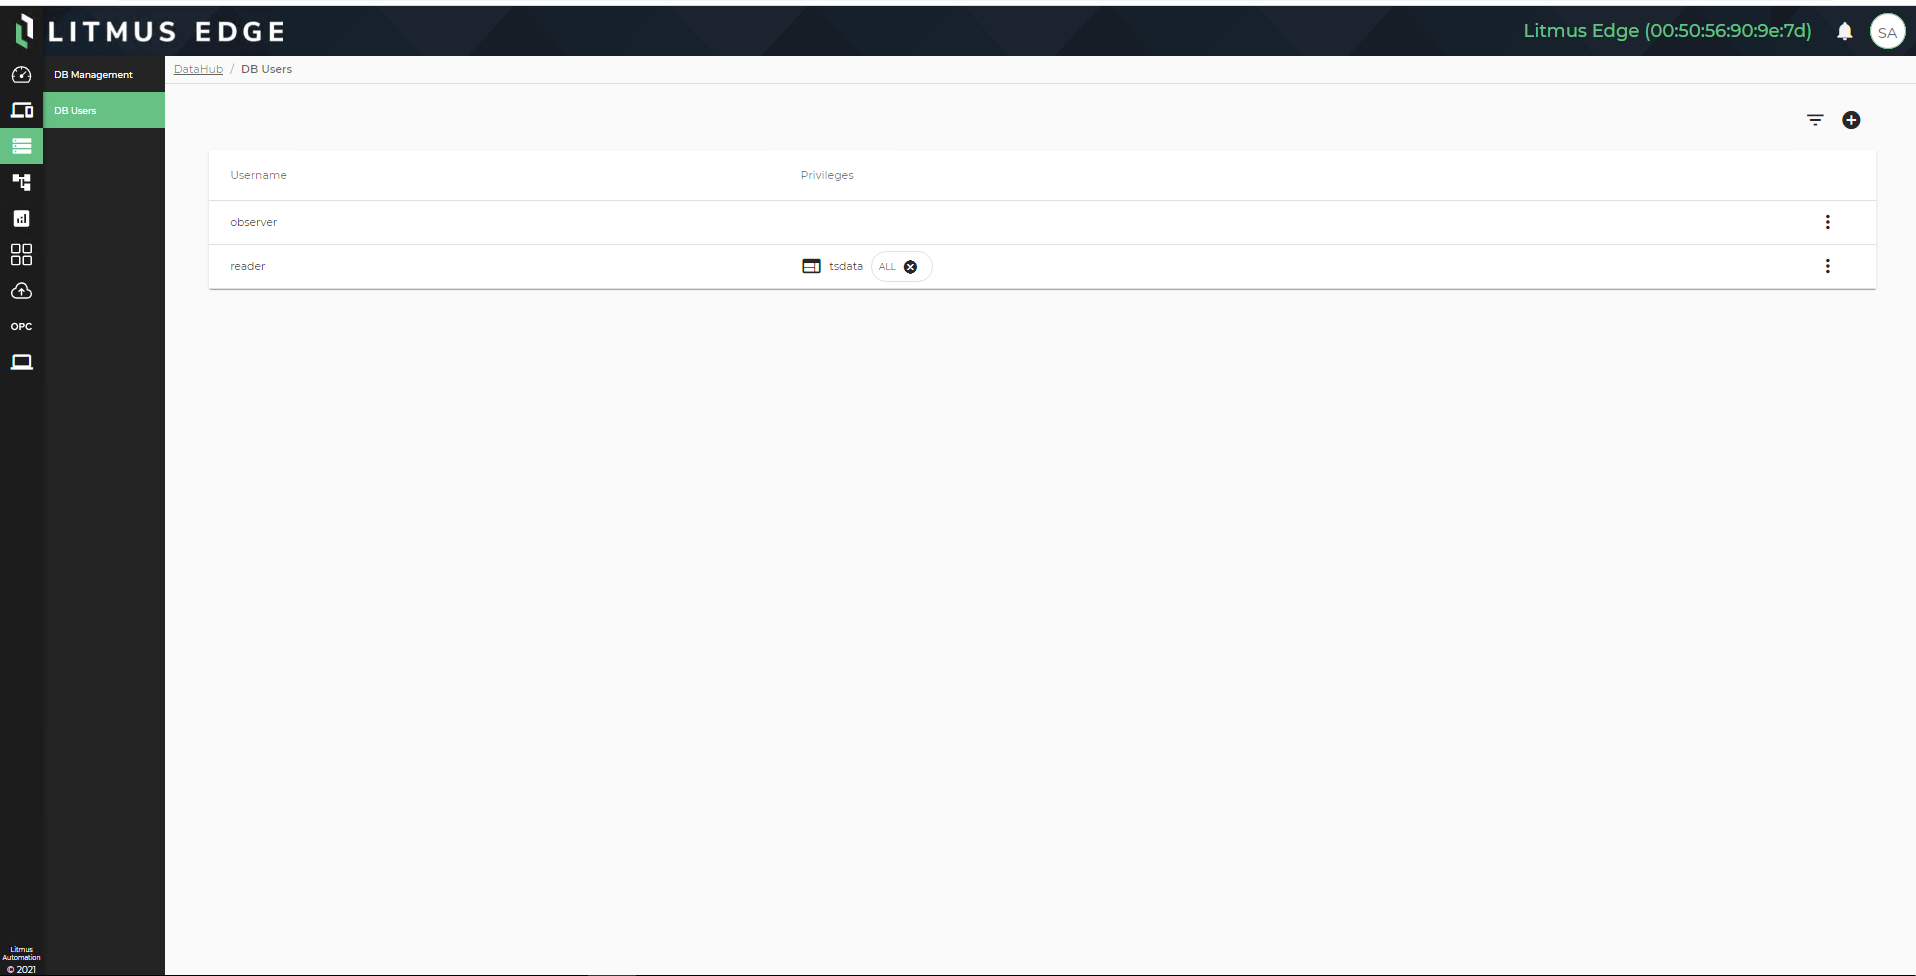
Flows
Litmus Edge enables users to create custom flows of data from devices connected to custom applications. Users create flows using a browser-based drag-and-drop interface, making it easy to connect flows using the wide range of nodes in the palette. Users can connect data from hardware to the Internet, connect to designed APIs, and troubleshoot configurations.
The Flows feature enables visualization of the data flow between nodes, which is especially useful when troubleshooting connectivity. Flows can then be deployed to the run-time software in a single click.
Note: Flows use Node-RED, which is a tool for visual programming. It displays relations and functions visually and allows users to program without having to type in a coding language. Node-RED allows the creation of JavaScript functions.
See https://nodered.org/ for more information.
Analytics
The Analytics feature provides a series of out-of-the-box flows as an alternative to creating flows. These flows can be selected and deployed, but not modified. Analytics provides time series analysis functions and ready-to-go KPIs. Users can feed live data to a user-created ML model from selected flows. Analytics dramatically reduce manual setup and configuration time, accelerating time to value and data intelligence at the edge.
Analytics makes use of Key Performance Indicators (KPIs) and functions to manipulate data, keeping track of many issues that may arise. Users can use machine learning models for prediction, classification, and anomaly detection. Analytics allows users to create and save a model from TensorFlow. A saved model contains a complete TensorFlow program, including weights and computation.
A saved model is a directory containing serialized signatures and the state needed to run them, including variable values and vocabularies. The saved model (saved_model.pb) file stores the TensorFlow model and a set of named signatures, each identifying a function that accepts tensor inputs and produces tensor outputs. A saved model may contain multiple variants of the model.
The Analytics module includes Instances and Models panes. From the Instances pane, the user can:
- Create and manage instances and flows.
- View the Debug panel.
- Organize flows into groups.
- Save maps.
The following figure shows examples of different features for Analytics in Litmus Edge.
Figure 23. Sample of Litmus Edge Analytics pane 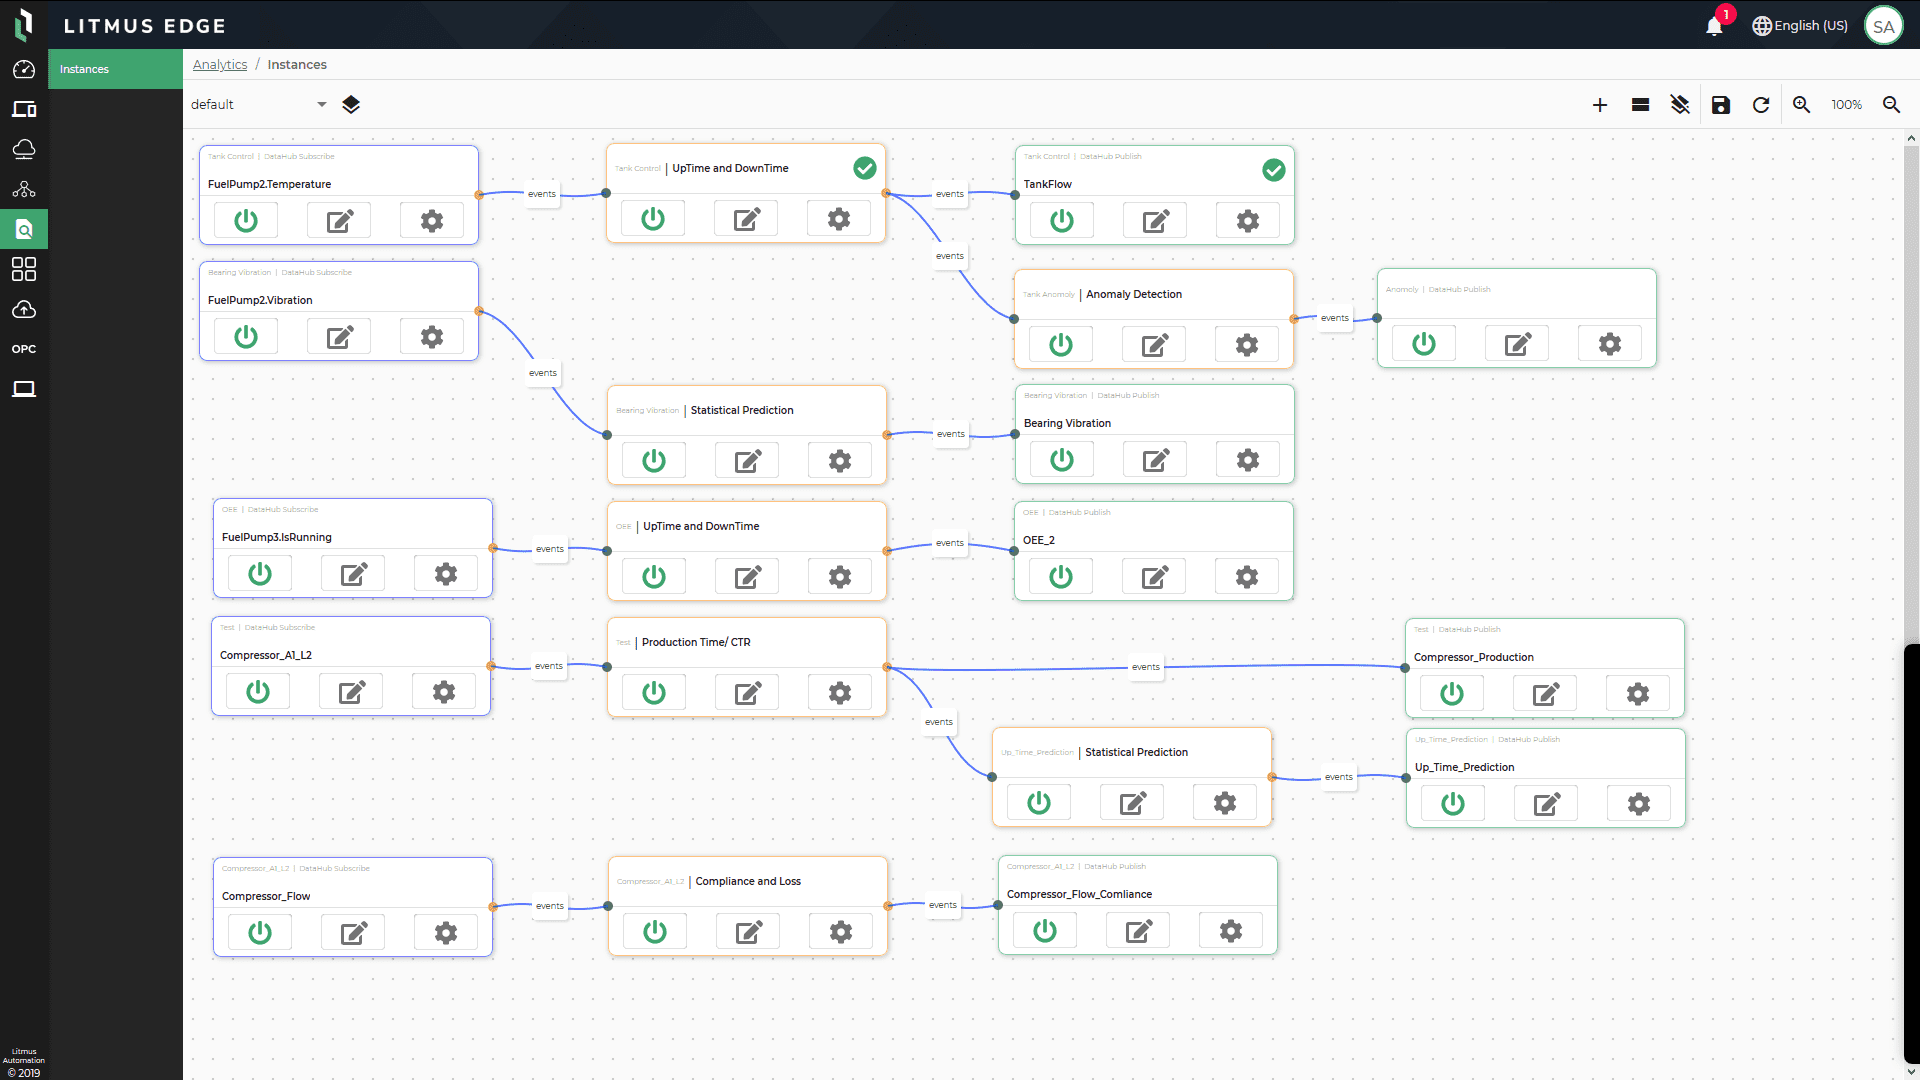
From the Models pane, users can Upload Model, as shown in the following figure.
Figure 24. Sample of Litmus Edge Models pane 
For more examples, see Working with KPIs, Working with Functions, and Working with Machine Learning.
Integration
The integration provides the mechanism to feed collected data into local databases or cloud implementations. Users configure connectors to several third-party cloud services in Litmus Edge. This allows users to publish data from the edge directly to a cloud service provider or a database.
Publish data to integrated third-party applications directly with an integration topic or with flows.
Coud service providers
Litmus Edge lets users add connectors to enable integration with the following cloud service providers:
- AMQP SSL
- AMQP TCP
- Edge Access
- Kafka SSL
- Kafka TCP
- MQTT - Amazon AWS IoT Core over SSL
- MQTT - Azure IoT Hub using Device Certificates
- MQTT - Azure IoT Hub using SAS Key
- MQTT - Generic
- MQTT - Generic over SSL
- MQTT - Google IoT Core over SSL
- MQTT - IBM Watson over SSL
- MQTT - System Protobuf SSL
- MQTT - System Protobuf TCP
- Mindsphere PSK (experimental)
- Splunk
Figure 25. Integration in Litmus Edge using MQTT generic connection 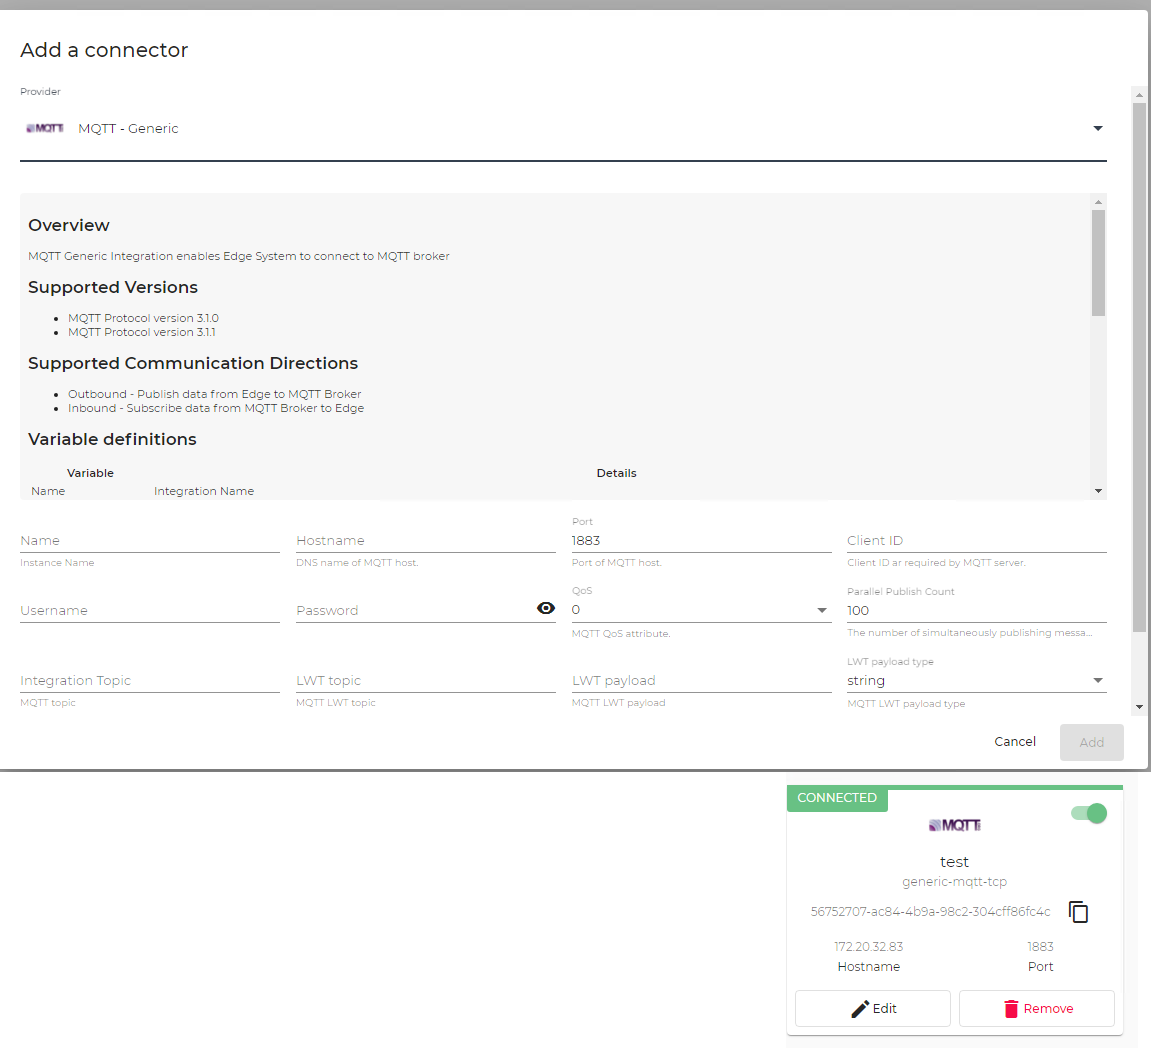
Users can integrate Litmus Edge with databases, and database applications can be enabled in the Applications Marketplace.
See Marketplace MySQL Example for further details.
Database connections allow table names in mixed case.
Supported databases
- Loopback Connector
- DB - InfluxDB SSL (experimental)
- DB - InfluxDB TCP experimental)
- DB - Microsoft SQL Server
- DB - Microsoft Server SSL (experimental)
- DB - MongoDB
- DB - MySQL
- DB - MySQL SSL (experimental)
- DB - Oracle
- DB - PostgreSQL
- DB - PostgreSQL SSL
Note: To use the connector, add topics to it by clicking on the connector. The cloud and database connectors list may vary. Connect to Litmus Support for more information.
Generate data from an edge device, then connect and store the data in the database. Use the steps in the following sections to store data into a database using the InfluxDB TCP connector.
Add the InfluxDB TCP connector
- From the Navigation panel, select Integration (
 ).
). Figure 26. Litmus Edge Integration 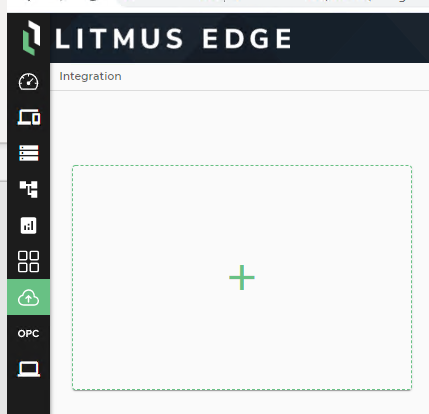
- Click the Add box (plus sign).
Figure 27. Add a connector 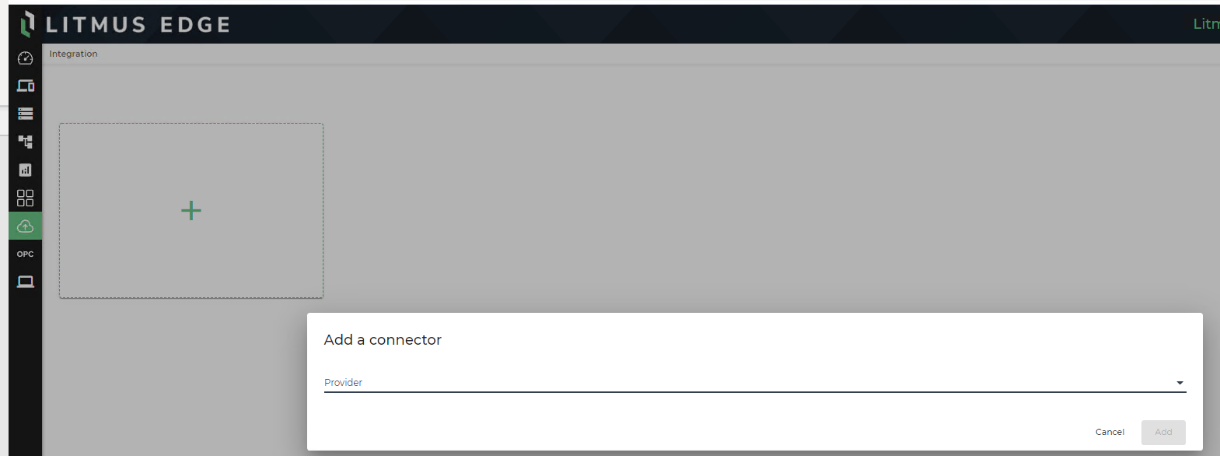
- Select DB - InfluxDB TCP (experimental) from the Provider drop-down list.
Figure 28. DB - InfluxDB TCP (experimental) Provider 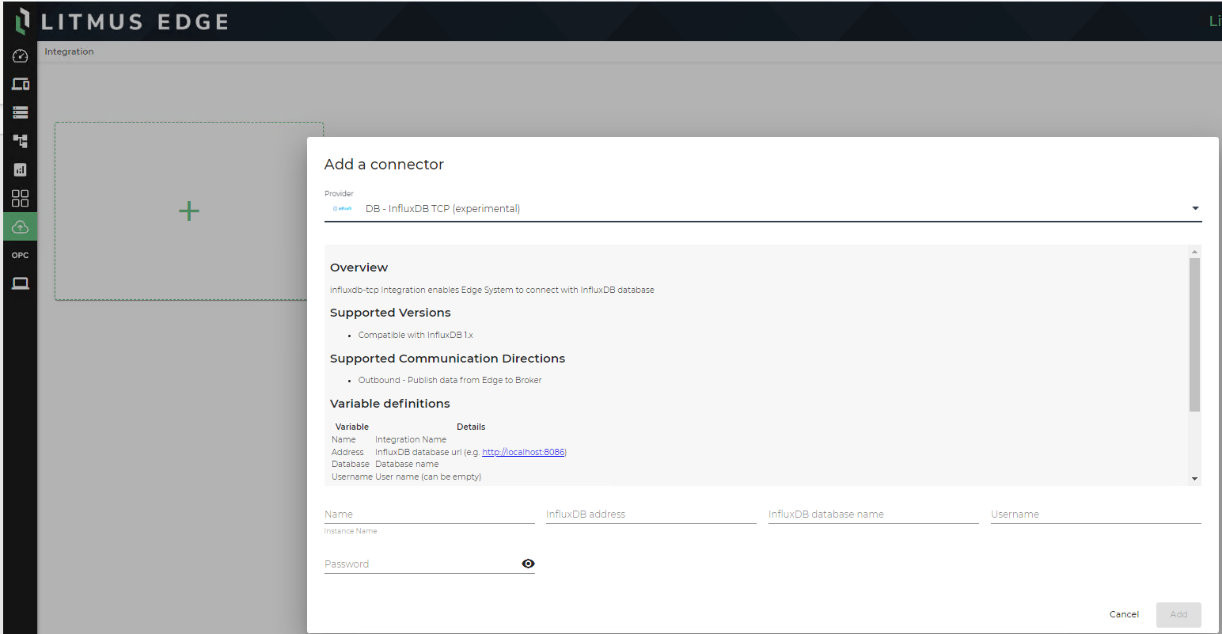
- From theAdd a connector dialog box, perform the following:
- Enter a <Name> in the Name field (for example, InfluxDBConnector).
- Enter the <Litmus Edge URL followed by the port> in the InfluxDB address field (for example, http://172.19.111.153:8086).
- Enter tsdata in the InfluxDB database name field.
- Enter db_user in the Username field.
- Enter the <db_user password> in the Password field.
Figure 29. Connector details 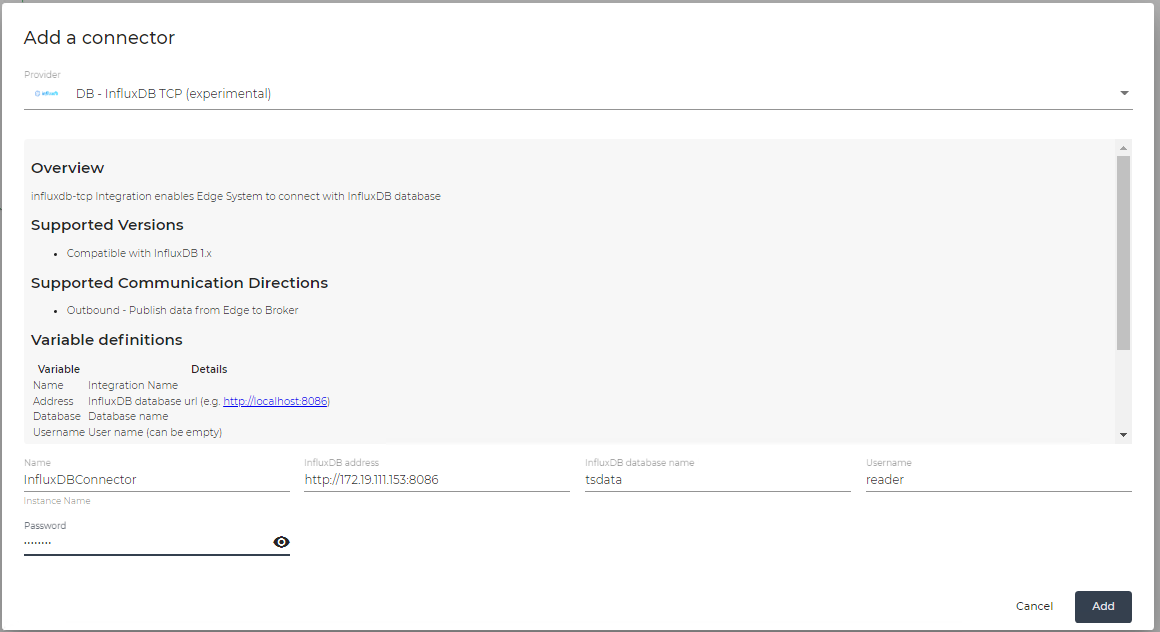
- Click Add (plus sign).
Figure 30. InfluxDB connector appears in the Integration pane 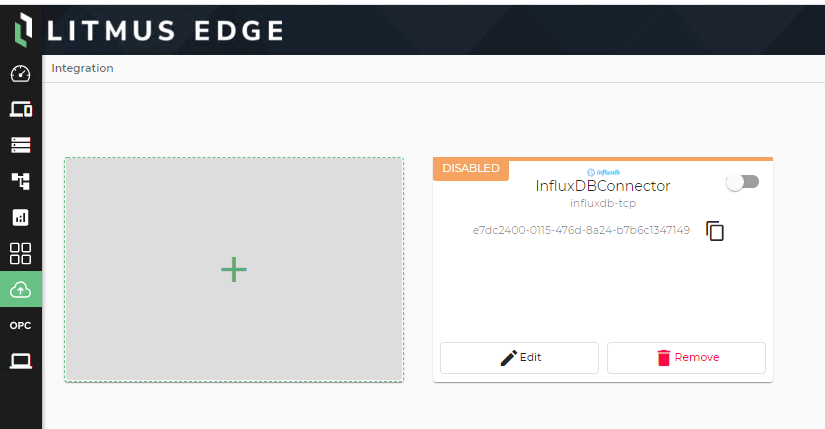
- From the Integration pane, toggle the Communication Connector for the InfluxDB connector.
Figure 31. InfluxDB connector is connected 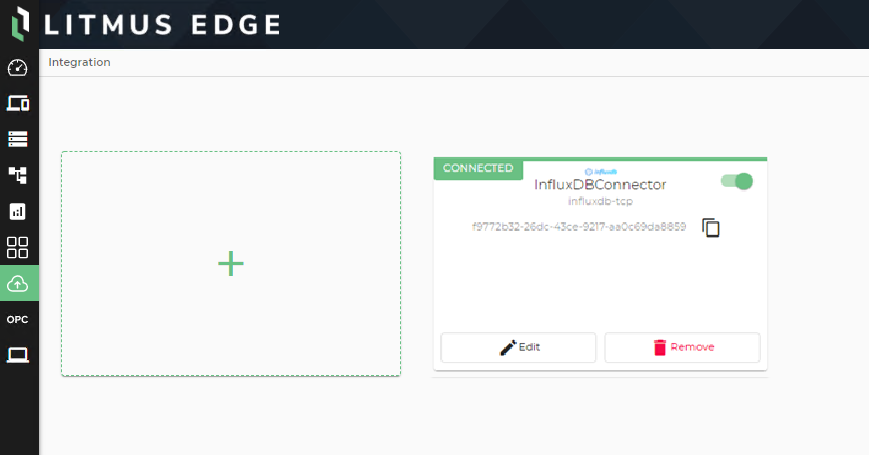
Import tags to the InfluxDB connector
- From the Integration pane, click the InfluxDB connector.
- Select Tags from the left panel.
- Click the Import (
 ) icon.
 The DeviceHub Import dialog box appears.
Figure 32. DeviceHub Import 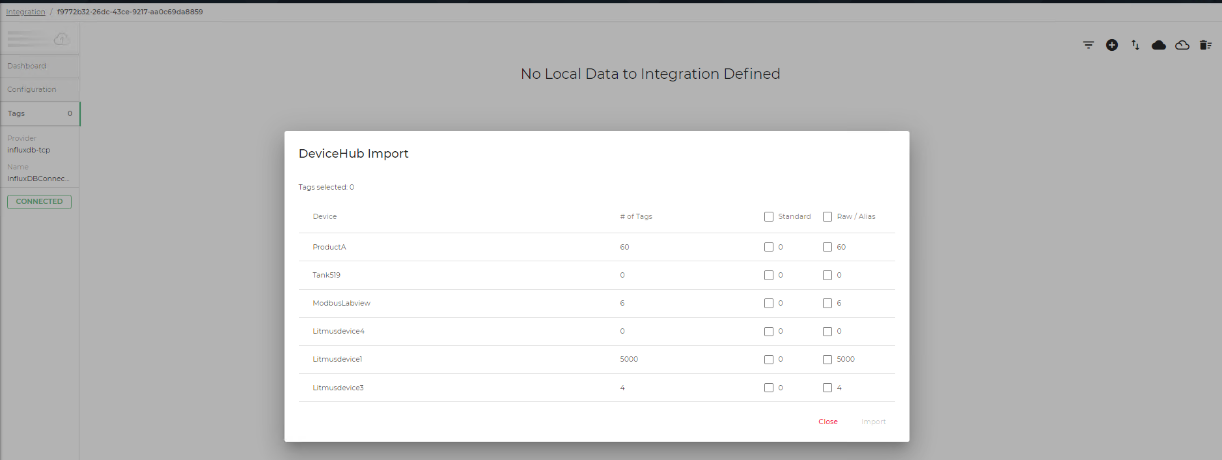
- Select the Standard and Raw/Alias check boxes for ModbusLabview, and then click Import.
Figure 33. ModbusLabview Import settings 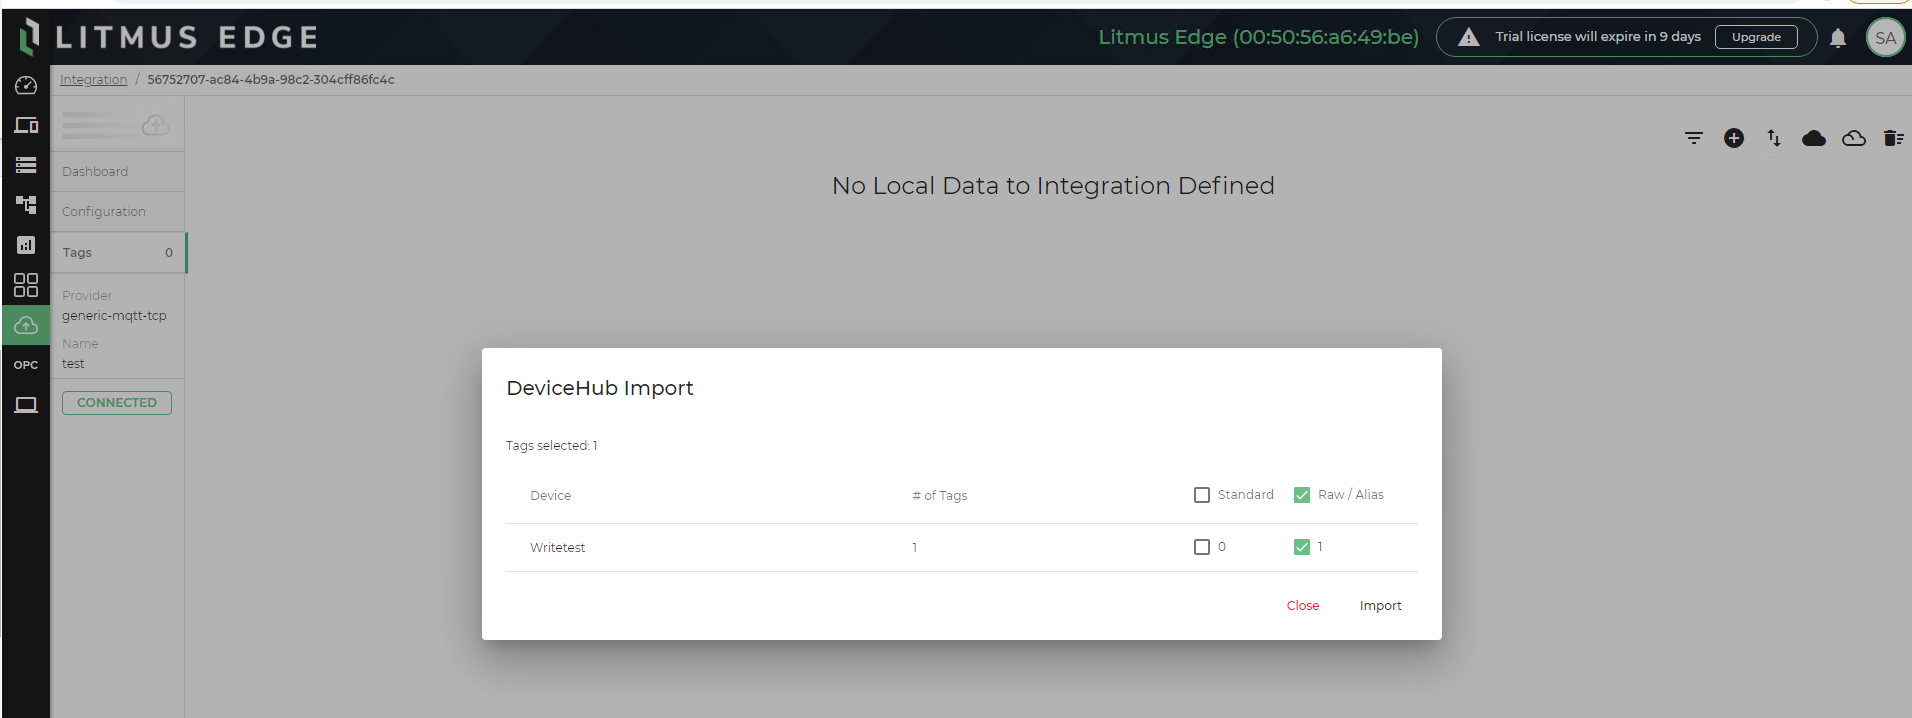
- Click the Enable (
 ) icon.
 Figure 34. Location of Enable icon  The Enable All Topics confirmation dialog box appears.
Figure 35. Enable All Topics confirmation 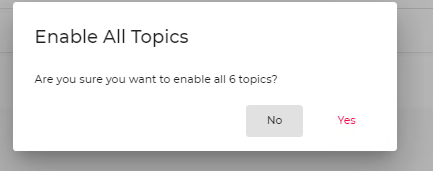
- Click Yes. The topics are enabled on the Topic Details pane.
Figure 36. Topics Details 
For more information, see Integration Use Cases.
Applications
Applications is a local application repository where users can launch applications on-demand, enabling edge-level analytics. Litmus Edge allows users access to the Applications Marketplace as a repository for data-processing applications developed by the user or to locate and download reusable public applications.
Create and deploy private Application Marketplaces, launch any of the preloaded applications in the public Marketplace, or create and deploy your own customized applications.
Applications can contain several subsections, each of which are described in the following sections.
Marketplace
A Marketplace is a catalog repository for specific applications. Before you can access applications in a Marketplace, you must have at least one functional Marketplace. The initial Litmus Edge environment includes a default public Marketplace.
Figure 37. Default public Marketplace 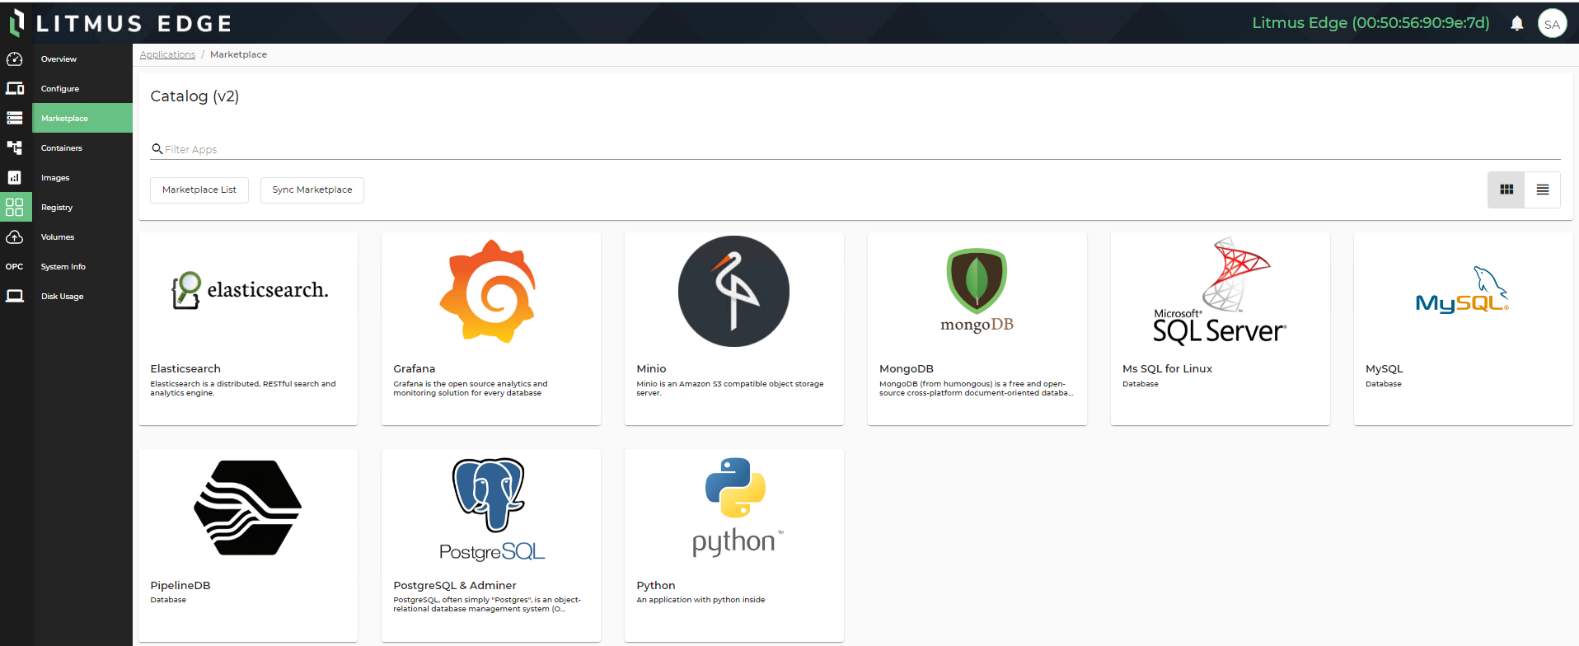
Deploy applications for your public or private catalogs from the Marketplace pane. Once you have added your Marketplaces, you can view specific Marketplace lists, filter the applications found there, add and delete applications, display the applications as a list or tiles, and synchronize the timestamp and data for a specific application.
Applications include two local applications repositories:
- Public Marketplace
- Private Marketplace
You can launch applications on demand by enabling the Marketplace Catalog. Litmus Edge provides a default set of applications in a public Marketplace. Add your own Docker container-based applications in a Private Marketplace. Applications, once installed, can run offline.
Note: Internet connectivity is required to deploy the default Marketplace and to install applications. Once an instance is created, internet access is no longer required to create additional instances of the same application.
For more details about Marketplace, see Applications.
Registry
A registry is a repository of containers for storing and delivering application images. When you deploy a Private Marketplace, you must first create a Docker Registry so you can access the application images. All the registries are available here (for example, Docker and Google Container Registry). You can add, modify, or remove a registry from the Registry pane.
Volumes
A volume is a persistent storage that is attached with every installed application in a container-based environment. You can delete the volume, but this is not recommended. If a container is deleted, the volume is not deleted. In this case, you may want to delete the volume as well.
Applications overview
Litmus Edge can run applications found under the Applications > Overview pane of the navigation panel. It provides status, statistics, and shortcut commands for each installed application. A tile represents each application that is currently installed on Litmus Edge.
Figure 38. Applications > Overview 
Configure
The Configure pane allows you to add a default Public Marketplace, or a Private Marketplace. Additionally, all Marketplaces can be modified or removed.
A Marketplace is a catalog repository for applications that are useful for configuration, data analysis, visualization, programming, or queries. Before a Marketplace is accessible, the user must deploy a catalog. Litmus Edge includes a default Marketplace.
The following figure shows the default setup of the Configure pane.
Figure 39. Applications > Configure default setup 
For more information, see Add a Private Marketplace.
Containers
Containers are a standardized unit of software. When you install an application from the Marketplace, at least one container for the installed applications will appear on the Containers pane. All applications in a private Marketplace run within Docker containers. Each application runs its own dedicated containers to ensure application isolation. Containers are isolated micro-services.
A Docker container is a portable image that is lightweight, standalone, and executable. It includes everything needed to run an application (code, runtime, system tools, system libraries, and settings). Each installed application runs at least one container and can run multiple containers, depending on the configuration.
The state of a container is color coded. A running container displays green, a paused container displays orange, and an exited container displays black.
Figure 40. Applications > Containers example describing three different states 
To add an application to the Marketplace or to create a private Marketplace requires a Docker registry. The Docker registry and credential information are available through Litmus. Litmus provides access so you can control and manage applications you choose to deploy in the private Marketplace.
You can Create a Docker Image and Deploy It to Your Private Repository that is then displayed on the Containers pane in Litmus Edge, allowing you to run or stop it at your discretion.
Images
Litmus Edge uses application images from the Docker registries. These images are needed before you can install an application. When you install an application from the Marketplace, the images are automatically pulled from the Docker registry.
You can pull images from three registries:
- Public Docker Hub
- Elastic public Docker registry
- Hard drive or import using FTP
The following figure shows the method used to pull the image in Litmus Edge:
Figure 41. Applications > Images uploading methods 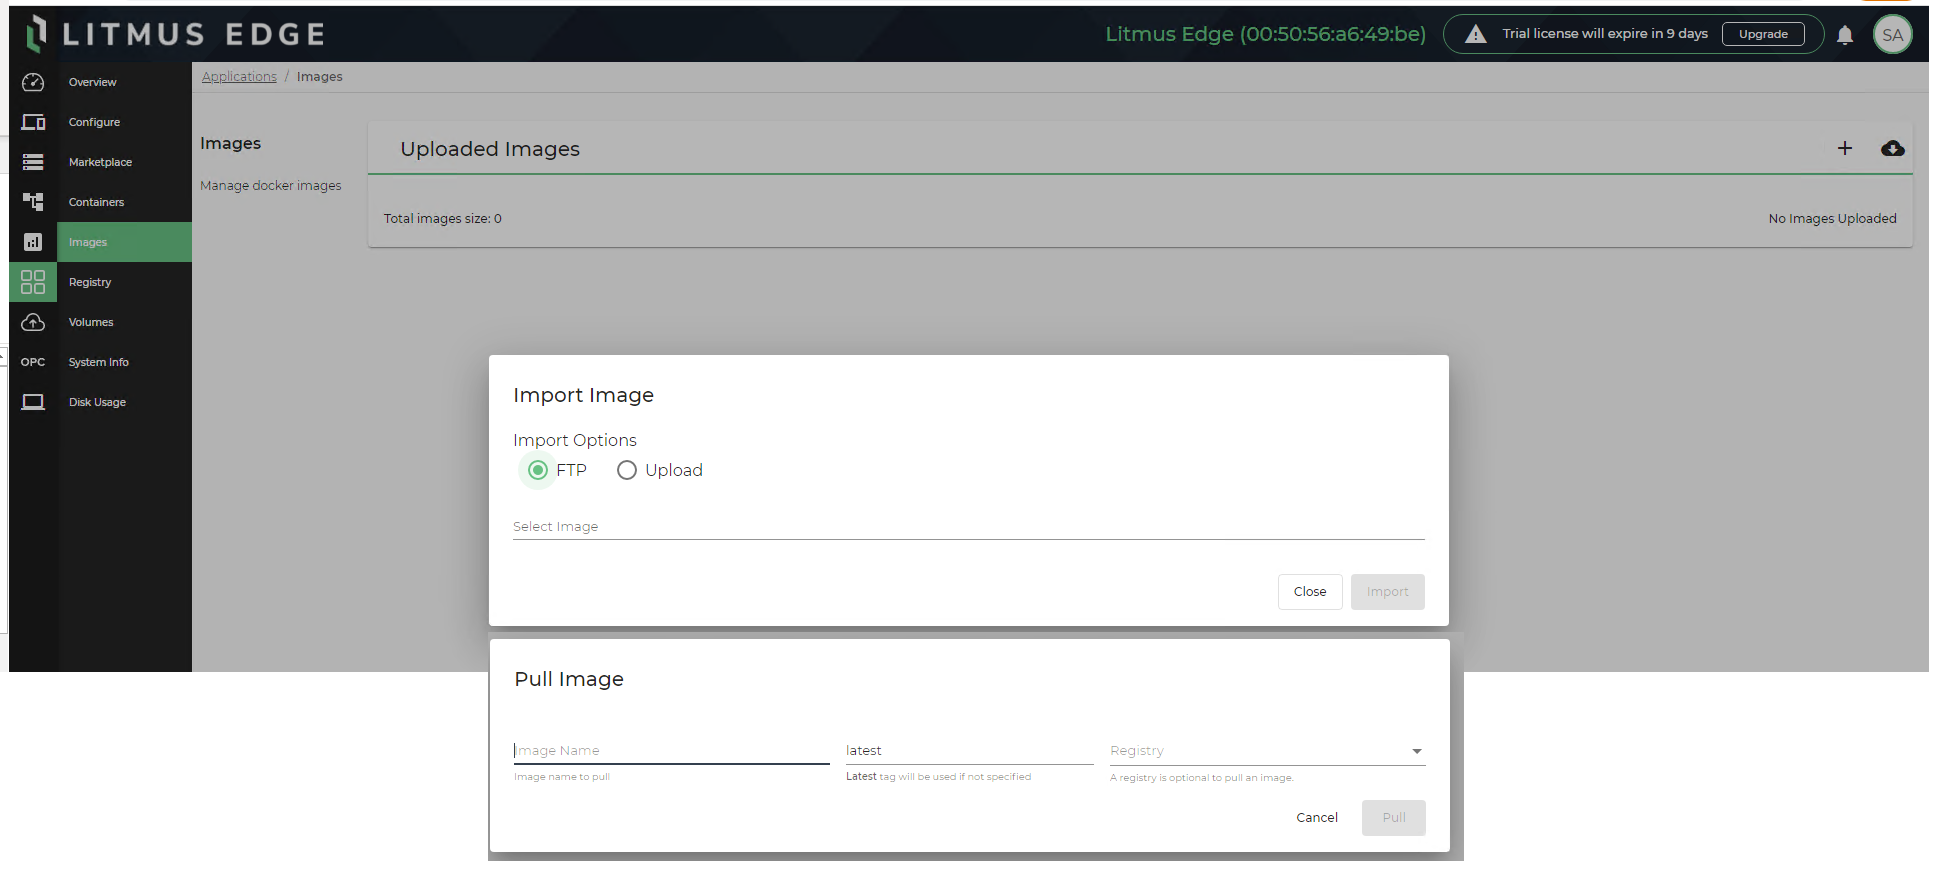
Images can be downloaded from the Docker registry, uploaded from your hard drive, or imported using FTP. You can also view the total image size, view details for an image, copy an image, and remove any images stored on the Images pane.
Applications System Info
System Info in Applications includes a JSON file that contains information about your applications.
View, filter, and refresh Marketplace system information from the System Info pane. The information contained here reveals the Docker status that is available inside the container environment.
Disk Usage
Disk Usage shows the current statistics for the applications. Disk Usage displays the total number, active number, and size of containers, images, and volumes for your current applications. This is useful for diagnostic purposes. You can view the disk usage of an application and refresh application data for containers, images, and volumes from the Disk Usage pane.
OPC UA
The OPC UA (Open Platform Communications Unified Architecture) protocol provides a publish-subscribe client-server technology for reliable data transmission. Its architecture ensures more secure communication than its OPC predecessor, OPC DA. The OPC UA protocol offers a solution for industrial IoT because it interacts with dedicated controllers in sensors, as well as with large enterprise databases and data analysis systems.
Litmus Edge can be configured as either an OPC UA server or as an OPC UA client. When configured as an OPC UA server, other systems can browse to access exposed data tags. When configured as an OPC UA client, it connects to OPC UA servers to obtain data present in the exposed tags on the server.
Figure 42. OPC UA with Litmus Edge 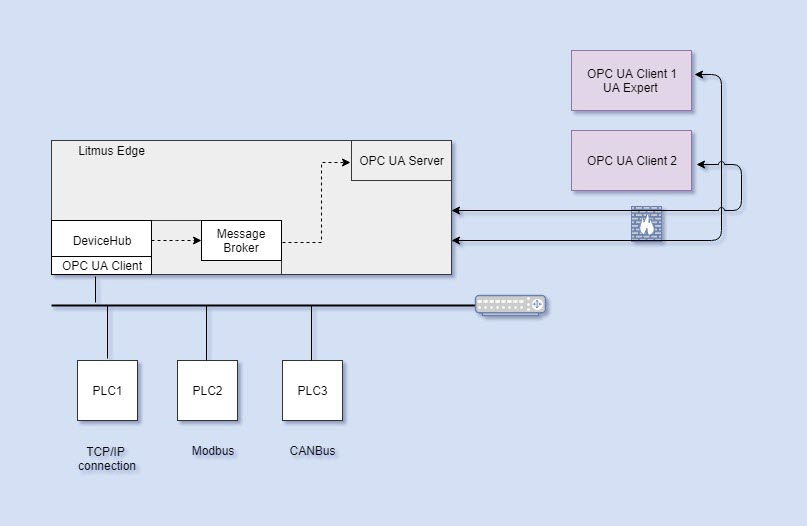
System
The System Administration feature provides information about status and various Litmus Edge device resources, and allows user to configure the system. From the Navigation panel, click System to access the list of system features.
Table 4. Litmus Edge System features System feature Information System Information - General
- CPU
- Data Partition Usage
- Memory
- Network Interfaces
- Serial Interfaces
Certificate Authentication - Add a device certificate
- Add a custom certificate
- Copy device public key
Network Parameters - Modify Host information
- View gateway and modify gateway if Ethernet settings are static
- Modify DNS/NTP
- Configure Ethernet settings
Wi-Fi Capabilities - Select a network for your device to allow connection
- Disconnect any device that appears on the Wi-Fi pane
Remote Access Add remote access Device Management (such as license activation and rebooting the instance) - Add and modify activation for cloud (and for Litmus Edge Manager)
- View management status
- Manage Litmus Edge device
- View object instances
LDAP/Active Directory Authentication Add authentication provider User Setup Manage users API Tokens Create, edit, remove, and validate API keys Services - Start, stop, enable, or disable FTP services
- Add and remove FTP users, enable or disable a user, and reset an FTP user's password
- Start and stop Remote Access and SSH services
External Storage Configuration Add external storage Policy Management - Modify Password Policy
- Modify Disk Space Policy
License Management - Add or upgrade a license
- View current version
- Disable and enable modules
- View number of devices and tags allowed in your plan
Events View a log of live and historical events that have occurred for specified components Create Support Bundles to aid in troubleshooting - View component status
- Generate and download a support bundle
- Download a file and view file information
Backup and Restore - Backup and restore device configuration
- Save the current backup and restore configuration for cloud
Device Management
Device Management allows you to activate or deactivate an edge device for the selected Litmus Edge Manager and manage the edge device from the cloud.
The Device Management pane includes the following sections:
- Cloud Activation allows you to activate or deactivate the edge device for the cloud using an endpoint IP address. You can view the company name, project name, device ID, and status of the device. The endpoint is set or modified here. Cloud Activation creates a connection to communicate with Litmus Edge Manager. Perform the following steps to create connection with Litmus Edge manager:
- Select the Device Management tab.
- Scroll to the Cloud Activation section.
- Edit the endpoint in the Data & Device Management Endpoint field to reflect the Litmus Edge Manager URL to which you are connecting.
- Enter the <activation code> provided from Litmus Edge Manager, and then click Activate.
Figure 43. System > Device Management > Cloud Activation 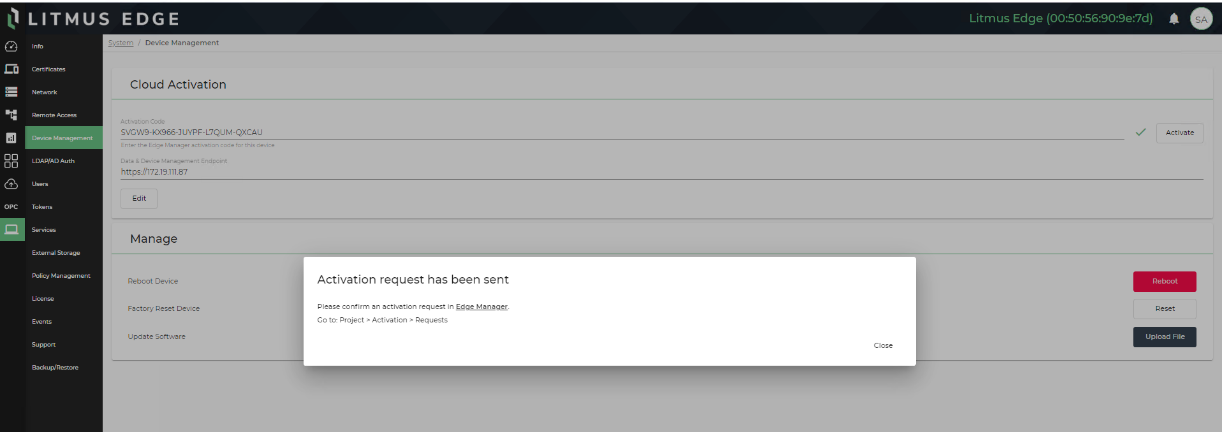
- Return to the Litmus Edge Manager Activation > Requests to complete the process.
Figure 44. Litmus Edge Manager - Device Activation 
- Configures a Litmus Edge device so that users have remote access from anywhere in the world.
- The Manage section allows you to execute the following management functions for the edge device:
- Reboot the edge device
- Factory reset the edge device
- Upload the software for an edge device
Litmus Edge Manager
Litmus Edge Manager provides a single point of control to manage and aggregate data from any number of edge devices, providing users with a complete picture of edge devices, applications, and deployments. Litmus Edge Manager allows users to create, orchestrate, manage, and update any containerized application from the cloud or data center level to Litmus Edge.
Litmus Edge Manager delivers centralized control for any number of Litmus Edge deployments. Manage the device life cycle with flexible application options leading to enterprise-level visibility for intelligence from the edge.
Figure 45. Litmus Edge Manager 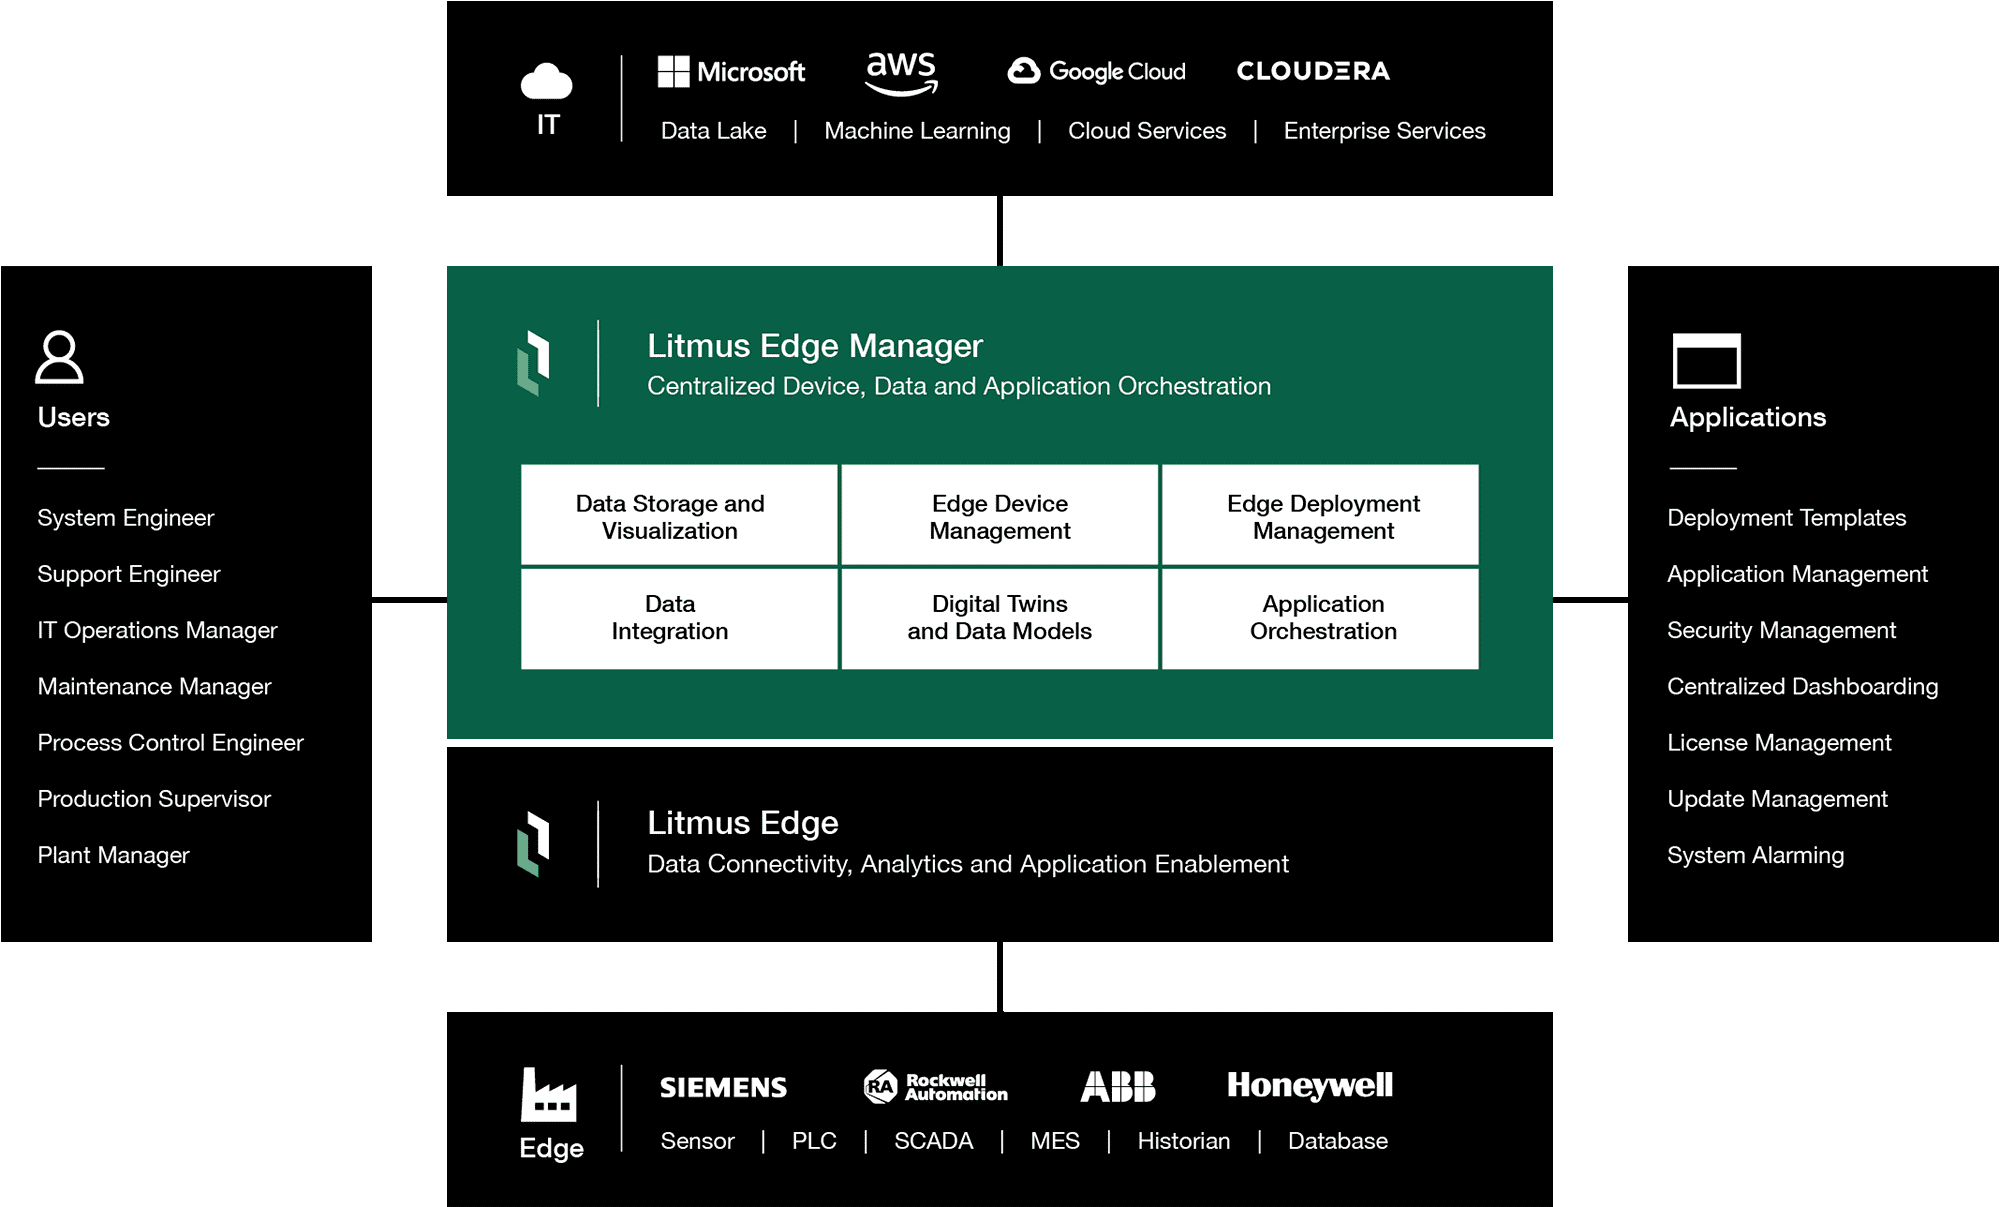
Litmus Edge manager has two different consoles:
- Admin Console
- User Console
Admin Console
The Litmus Edge Manager Admin Console is used to administer Litmus Edge Manager, allowing you to set up and configure Litmus Edge Manager. It shows the number of connected Litmus Edge devices and other statistics such as total messages and other system statistics. Users can adjust settings so that collected data integrates into existing enterprise applications. To access the Admin Console from a browser, enter the host IP address, colon, and then enter port 8446. For example, https://192.168.1.222:8446.
The Litmus Edge Manager Admin Console is comprised of modules to configure and administer Litmus Edge Manager on your network. These modules are described in the following sections.
Dashboard
The Dashboard module shows information about your Companies, Projects, and Devices. It includes tables and charts related to your system. The Dashboard module displays the total number of Companies, Projects, Devices, total database size, and total messages for the Litmus Edge Manager. It includes graphs and statistics for System Overview, CPU, and Disk usage.
Figure 46. Admin Console Dashboard 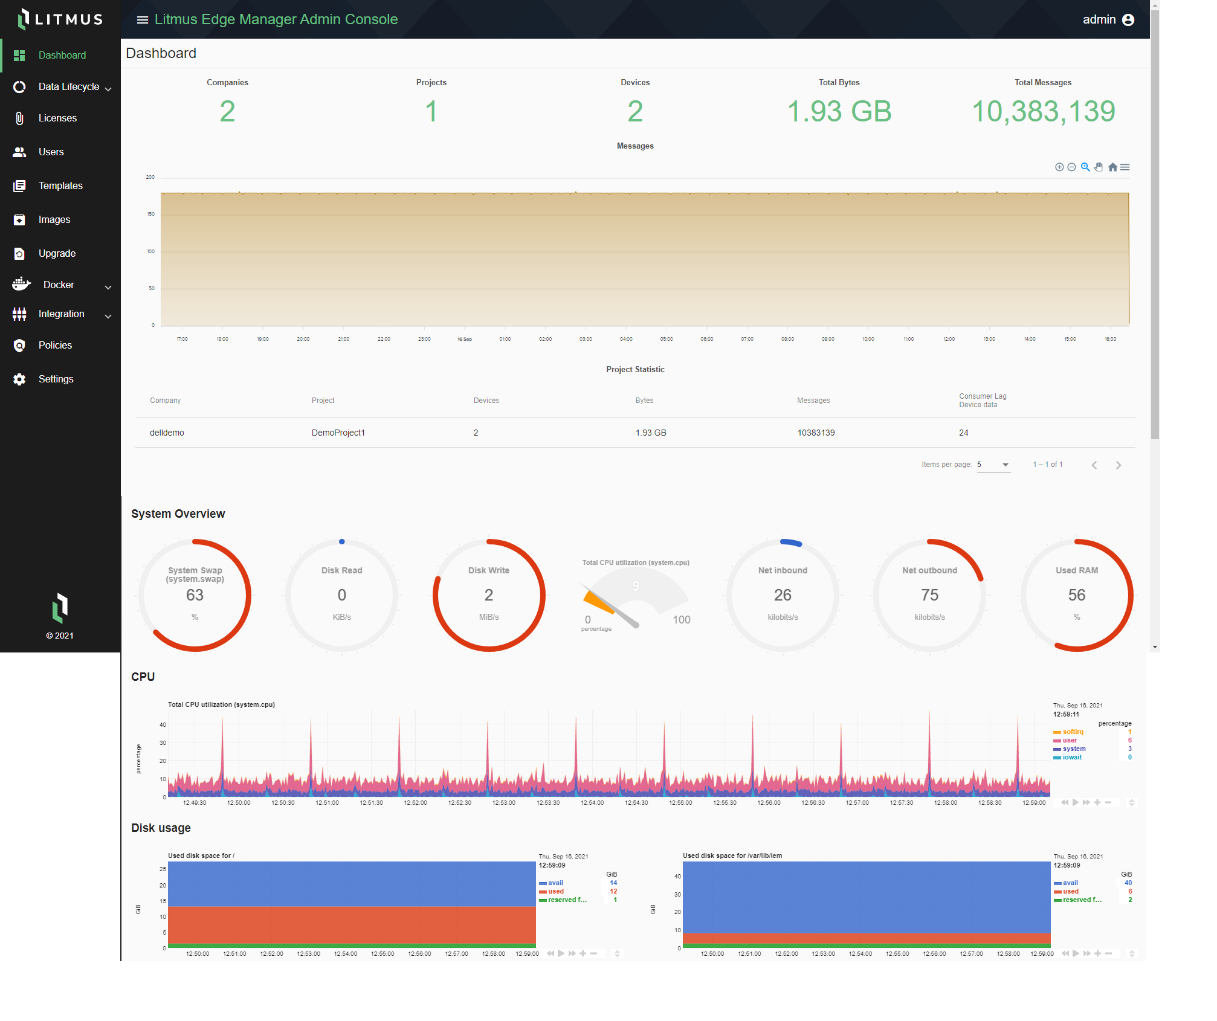
Data LifeCycle
The Data Lifecycle module acts as a toggle revealing the Statistics, Management, and Purge Policies submodules.
- Statistics—Includes the Disk usage, Data Cumulative chart, Top 10 Projects Chart, and Stats by Periods sections. You can view user and archive data, view disk usage by period, view disk usage by projects, and archive and purge data from this submodule.
- Management—Includes the Data Archive list. You can download archived data files and purge the archived data files from this submodule.
- Purge Policies—Includes the Instance Purge Settings and Companies Purge Settings sections. You can add instance and companies purge policies, and filter the instance and companies purge policies list from this submodule.
Licenses
The Licenses module shows information about current licenses, features, and performance of devices. Activate online and offline licenses from here.
The Licenses module includes sections for Available Licenses, Features, Performance, and Online and Offline Activation.
Users
The Users module allows managing the users, company teams, and project teams for Litmus Edge Manager.
The User Management pane has three sections:
- Users
- Company Teams
- Project Teams
Templates
The Templates module allows users to upload and download templates for Companies, Projects, and Instances. Users can access all templates available for different Companies, Projects, or Instances from here.
Templates can be uploaded from a file or created separately and then uploaded. Three scopes are defined for a template:
- Company—The template can be applied to all projects for a company.
- Project—The template can be applied to a device for this project.
- Instance—The template can be applied to all companies and projects for this Litmus Edge Manager.
Software Images
The Software Images module allows you to manage updates and upgrades for the Litmus Edge devices managed by the Litmus Edge Manager.
Upgrade
The Upgrade module allows you to upgrade firmware versions of the Litmus Edge devices that are connected to Litmus Edge Manager. This is helpful when there are multiple deployments of Litmus Edge.
You can upload the .upd file from your hard drive, and then the version can be used to upgrade Litmus Edge devices.
Create groups of devices in the Litmus Edge Manager application, and update them at a specific time, or update them all at once using the firmware upgrade.
Docker
The Docker module acts as a toggle revealing two submodules for Images and Settings related to containers. The Images submodule allows users to upload Docker images from a file or to pull images from any Docker repository (for example, a private DockerHub repository).
Litmus Edge Manager provides a private Docker registry that can be used to host Docker images for the Marketplace.
The Settings submodule allows you to enable or disable the registry, enable or disable authentication, and add users for Docker registry management.
Integration
The Integration module acts as a toggle revealing two submodules for Kafka Settings and Clickhouse Settings. Data integration from the entire Litmus Edge deployment into third-party applications using Kafka is possible.
- Kafka—Includes the Kafka Server, Users, ACL, and Explore sections. You can download a certificate and copy the connection URLs for the Bootstrap Server and Kafka SSL Connection from the Kafka Server section. You can add and remove Kafka users, and change passwords from the Users section.
- Clickhouse—Includes the Clickhouse Server and Users sections. You can edit, enable or disable, and change the port status for each available protocol from the Clickhouse Server section. You can add and remove Clickhouse users, and change passwords from the Users section.
Policies
The Policies module allows you to modify current policies for connected devices and view the usage for which the policy is applied. Default policies are part of the system and are added during installation or upgrade.
Create multiple policies from a default policy, tailored to their environment, by copying a default policy and then modifying the copy. Make copies of any previously saved policy. Policies created in the Litmus Edge Manager Admin Console are available to your connected devices. You cannot delete a default policy.
The Policies pane includes two sections:
- Password Policies
- Policy Usage
Settings
The Settings module includes Current Version, Administrator, Email Settings, Proxy, and Support sections. You can view the details for the current version of Litmus Edge Manager from the Current Version section.
You can change the administrator password from the Administrator section. Enable or disable SMTP, enter host information, and use authentication to send emails from the Email Settings section. Add host information for the HTTP or HTTPS protocols from the Proxy section. Currently, HTTP proxy is used for offline license activation and for alerts, such as Webhook and Slack.
User Console
The Litmus Edge Manager User Console is a flexible device and data management platform that allows users to securely connect and manage edge devices while providing extensive control at scale for all your IoT projects and deployments. To access the User Console from a browser, enter the host IP address (for example, https://192.168.1.222). Litmus Edge Manager opens in the browser. The Dashboard appears by default. Once you are logged in, click NEW to create a Company or click an existing Company.
Figure 47. User Console > initial view 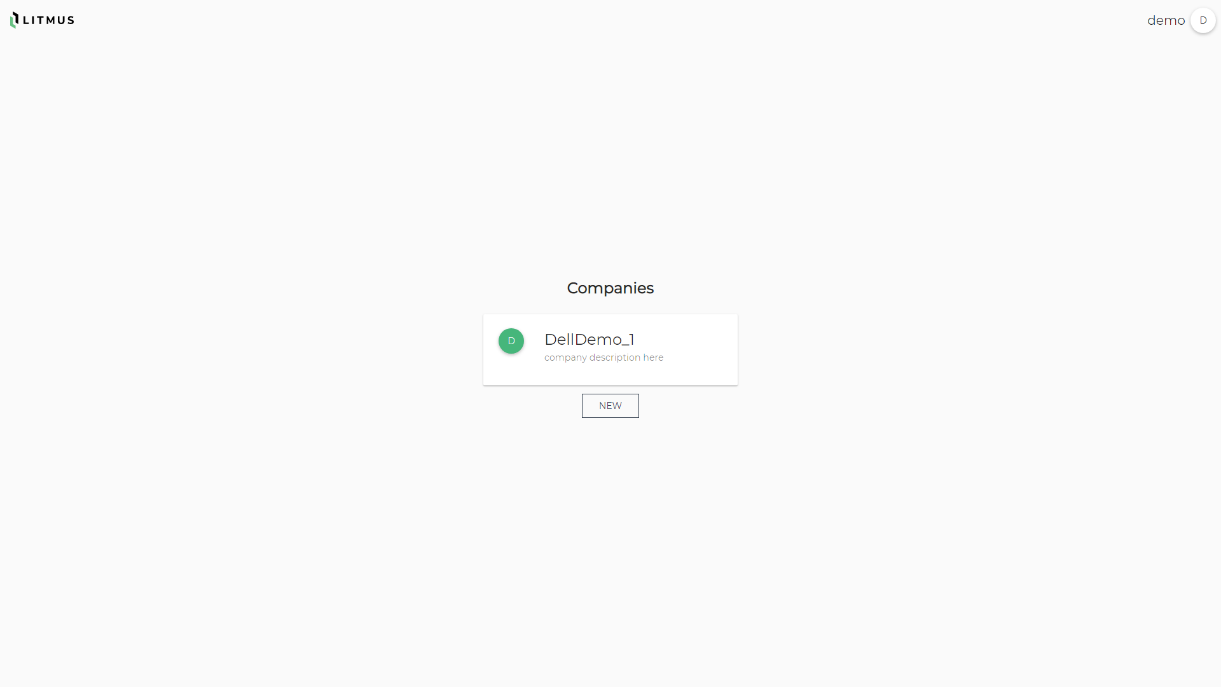
The Litmus Edge Manager environment is based on a hierarchy defined by Companies, Project, Site, and Device.
Companies
Litmus Edge Manager includes a way for you to create a hierarchy to structure how different Litmus Edge devices fit into the IT/OT environment of a company or enterprise. This hierarchy follows the same principles as other devices such as servers, PC-systems, or PLCs/controllers.
It is useful to visualize and organize where a Litmus Edge device fits into the overall architecture. The first level of the hierarchy is called Companies.
Companies are the highest hierarchy level under which everything is structured. Options can be the enterprise, company, or division/subsidiary names. Other valid choices are the name of a country, region, state, or city, as well as the production site. These names are based on how you understand your own hierarchy and how the hierarchy will represent the architecture.
See About Company Settings for more information about how to manage companies.
Project List
The second level of the Hierarchy is called Projects. Projects are used to administer most of the setup of the Litmus environment. Options can be a division, country, region, plant, project, or team. These names are based on the granularity required by the setup or how you understand your own hierarchy.
The Projects pane displays all the projects for the selected company in tile or list format.
Figure 48. Project features view 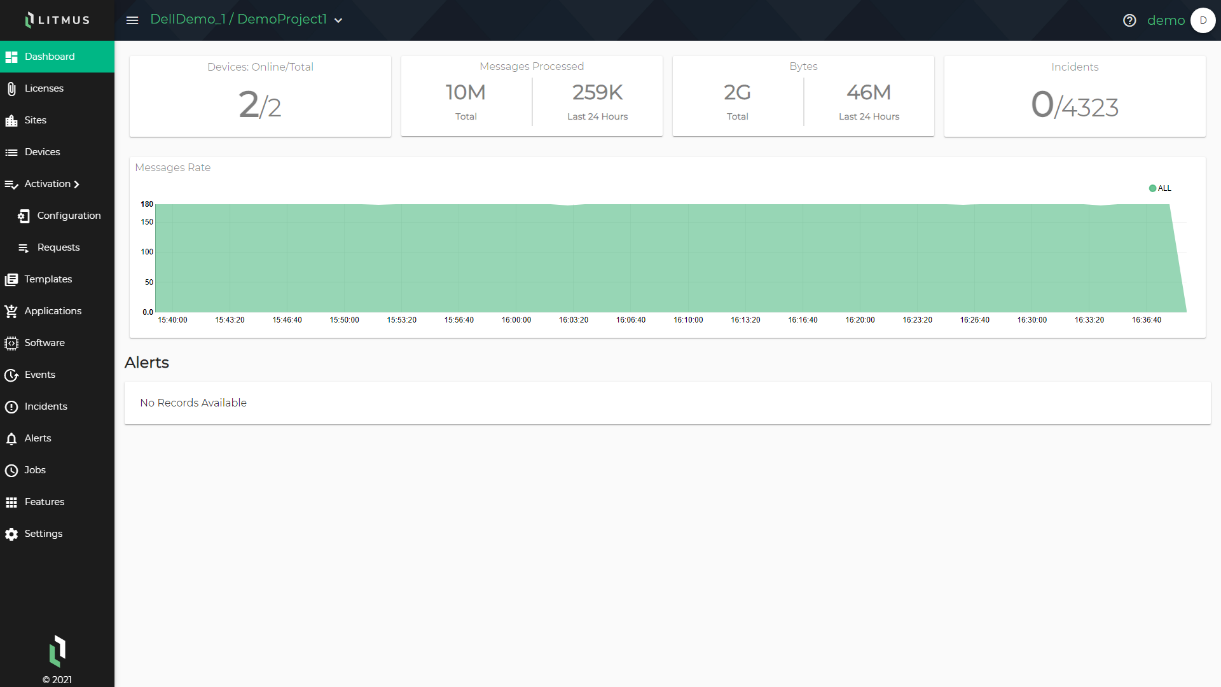
Dashboard
The Dashboard module is specific to a Project. Open a Project for the Dashboard module to appear. It contains statistics about the whole project. This information is on the operational network and is completely offline. From the Dashboard module, you can:
- View the Devices: Online/Total section, which provides the number of connected devices and the total number of devices for your project.
- View the Messages Processed section, which provides the total number of messages processed, and the messages processed in the last 24 hours.
- View the Bytes section, which provides the total amount of data processed and the amount of data processed in the last 24 hours.
- View the Incidents section, which provides the total number of incidents for the project.
- View the Messages Rate section to see message rate details in chart form.
- View the Alerts section, which contains a list of devices for the project that have alerts, the alert description, event time, and status.
Licenses
The Licenses pane allows you to view the License Status for the devices, the Device Status, the number of devices using specific features, a list of Expired Licenses, and a list of licenses expiring within a defined time period.
Figure 49. License Summary 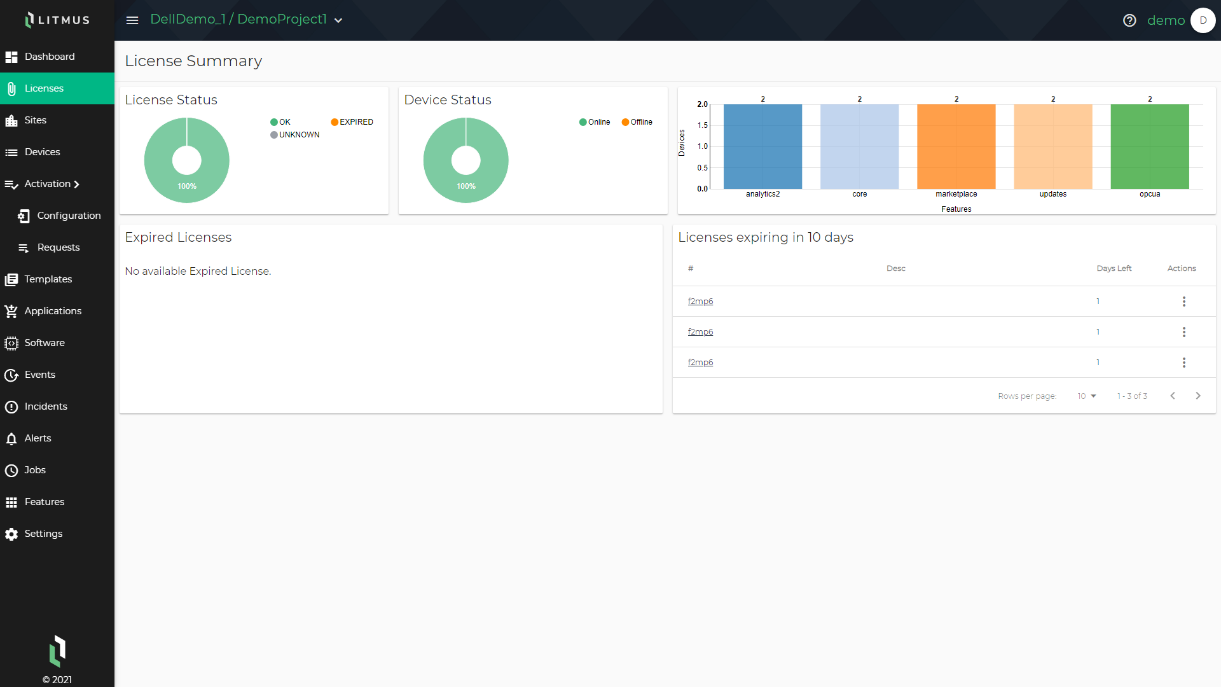
- The License Status section allows you to view the license status of the connected devices.
- The Device Status section allows you to view the number of devices that are online and offline.
- The Features chart allows you to view the number of devices using the available features.
- The Expired Licenses section allows you to view a list of devices with expired licenses.
- The Licenses expiring in 10 days section allows you to view a list of devices with licenses expiring soon. This list includes a countdown to license expiration and allows you to add a license and open the listed device.
Sites
Sites offers a third level of hierarchy to create an additional level of granularity but is not mandatory to use. Options can be Country, Site, plant, or plant area. These names are based on how you understand your own hierarchy.
Devices
Devices have two roles. Primarily, they represent an attached device of a Litmus Edge device to be managed and which is a potential data source. Secondarily, they represent the next level in the hierarchy, which can be a Line, Cell, or individual production asset.
Figure 50. Litmus Edge device details 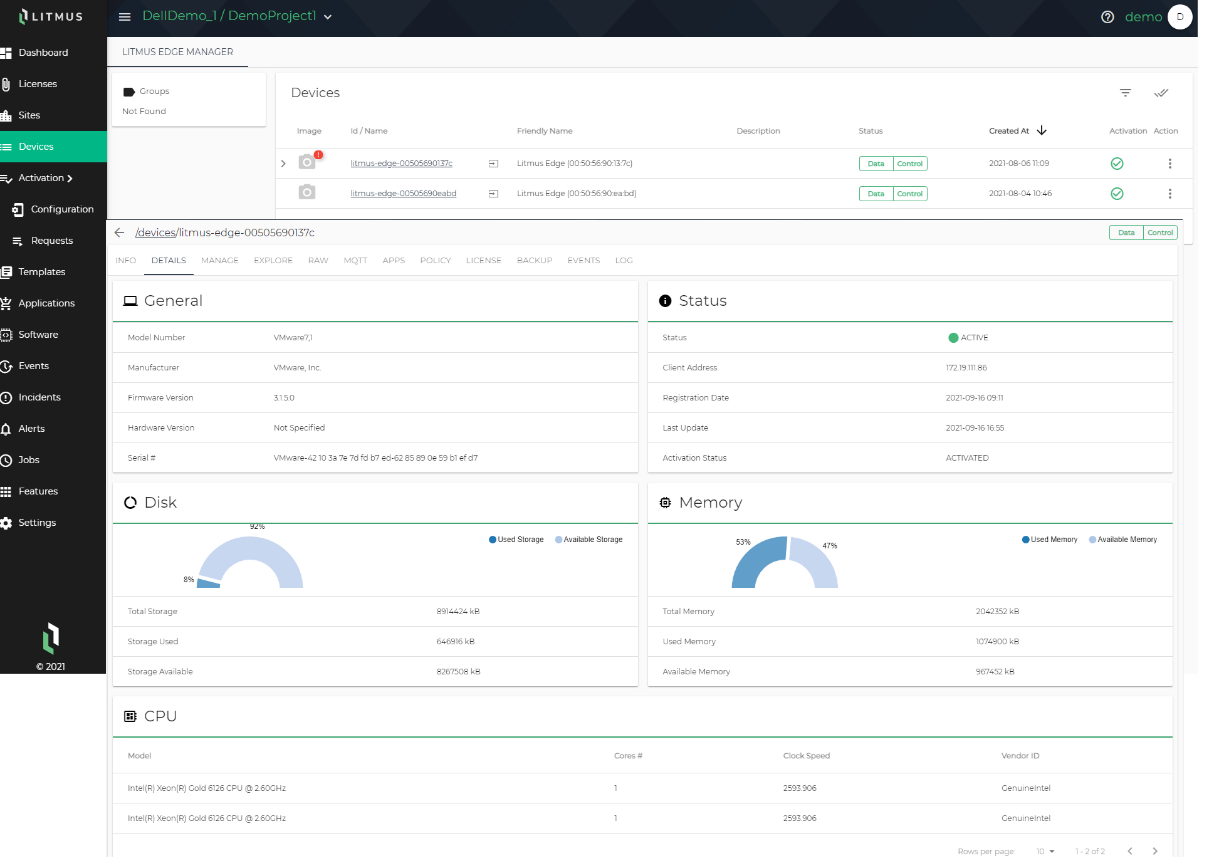
- Info—Information about Manufacturer, Model Number, Serial Number, Software Version, Device Description, and device groups.
- Details—Includes device status, Disk, Memory, CPU, Network Interfaces, and Serial Interfaces information.
- Manage—Start and stop services like Flows, SSH, and Remote Access, and reboot the device from here, once activated.
- Explore—Includes a list of resources. View details for each resource grouping. Enable or disable Actions. Actions are allowed only if the device is online on the LWM2M interface. You can also view data for each resource.
Upon device activation, an MQTT SSL connection is added for data transfer, and an LWM2M connection is added for management of the device.
Data that is sent using the JSON schema is stored in the timeseries database.
- Raw—Any message that is being sent from Litmus Edge can be monitored. This information is used as a debug tab for the raw data.
- MQTT—Data being sent on MQTT can be published, or subscribed to, under this tab.
There are three types of MQTT Topics: Request, Response, and Data. You can send/receive from the MQTT broker.
- Apps—Shows the list of marketplace applications deployed on the device. Start, stop, and delete applications from here.
- License—Upon activation of the Litmus Edge device, all license information is automatically loaded here. The License List, Features included, Performance Packs, Online Activation, and Offline Activation sections are included here.
You can activate a license in online/offline mode.
- Backup—Upon activation of the Litmus Edge device, the backup for the Litmus Edge Manager is automatically stored here. You can make a device backup and restore a backup file for the Litmus Edge device.
- Logs—View Litmus Edge device activity here.
Activation
When you select Activation from the navigation panel, the Configuration and Requests submodules appear. You can perform activation provision (zerotouch) for a Litmus Edge device from these modules. The Configuration submodule allows you to add a license key and choose a template for deployment to a Litmus Edge device. The Requests submodule allows you to approve, reject, or delete an activation configuration.
Templates
You can view the Templates module from a Company or from an open Project. A Litmus Edge Manager device template can be created from Litmus Edge Manager by choosing from the connected devices. You can also upload a template file from Litmus Edge Manager.
You must select a scope when creating a template:
- Instance—The template can be applied to all projects for this Litmus Edge Manager.
- Company—The template can be applied to all projects for this company.
- Project—The template can be applied to only this project's applications.
Applications
After selecting a Project, the Applications module appears. Litmus Edge Manager includes a default Marketplace catalog with applications ready to be deployed. Add your own Marketplace catalog with applications and use it for deployment. Launch an application or view its details from here. A single application can be deployed to multiple Litmus Edge devices connected with Litmus Edge Manager. The applications that are deployed on Litmus Edge can be managed and monitored from here.
Remote Access
You can add a new network ID to remotely access a remote network, including a ZeroTier network. When you add a ZeroTier network, the ZeroTier members for edge devices are added automatically after activation.
Software
After selecting a Project, the Software module appears. This module includes a list of jobs run for Litmus Edge Manager devices. You can run a job or view information about a job.
Single or multiple jobs can be scheduled for Litmus Edge devices. Use user-defined commands that can be scheduled to be executed. You can restart and update Litmus Edge software from here.
Events
You can view the Events module from a Company or from an open Project. The Events module includes a list of events that have occurred for a Company, Team, Team Member, Project, Device, or All Events. You can view logs of each event.
Incidents
After selecting a Project, the Incidents module appears. This module includes a list of devices for which there is an incident. Incidents are generated alerts that are based on triggers. View a device's details by clicking on its device ID, and view a trigger by clicking on the trigger link associated with a device.
Alerts
After selecting a Project, the Alerts module appears, which includes the Action List and Triggers sections. Create, modify, and view actions, such as send an email, from the Actions List section. Create, view, and modify triggers for the actions listed from the Triggers section.
An alert occurrence is registered as an incident and is shown on the Incidents module, then uses an action to create an alert.
Alert options are as follows:
- Webhook
- Slack
- Pagerduty
Jobs
After selecting a Project, the Jobs module appears, which includes a list of Device Jobs with status and record of execution. You can schedule a job to trigger some action on the device. You can add, modify, and remove a Job from the Device Jobs list. You can view a log and define MQTT and LWM2M commands.
Features
After selecting a Project, the Features module appears. This module includes a default Marketplace catalog and Grafana application. Click the default Marketplace catalog to open the Marketplace Catalog in a new browser tab. From there, you can add Marketplace catalogs, and edit or delete the default Marketplace catalog. If you click a Marketplace catalog from this browser tab, the associated applications appear, and you can add new applications to the catalog.
Grafana is a visualization tool. Open the Grafana application in a new browser tab by clicking it. You can then view any of the listed Litmus Edge devices from the Dashboard. You can perform actions and edit the Dashboard from here.
Figure 51. Litmus Edge Manager - Features module 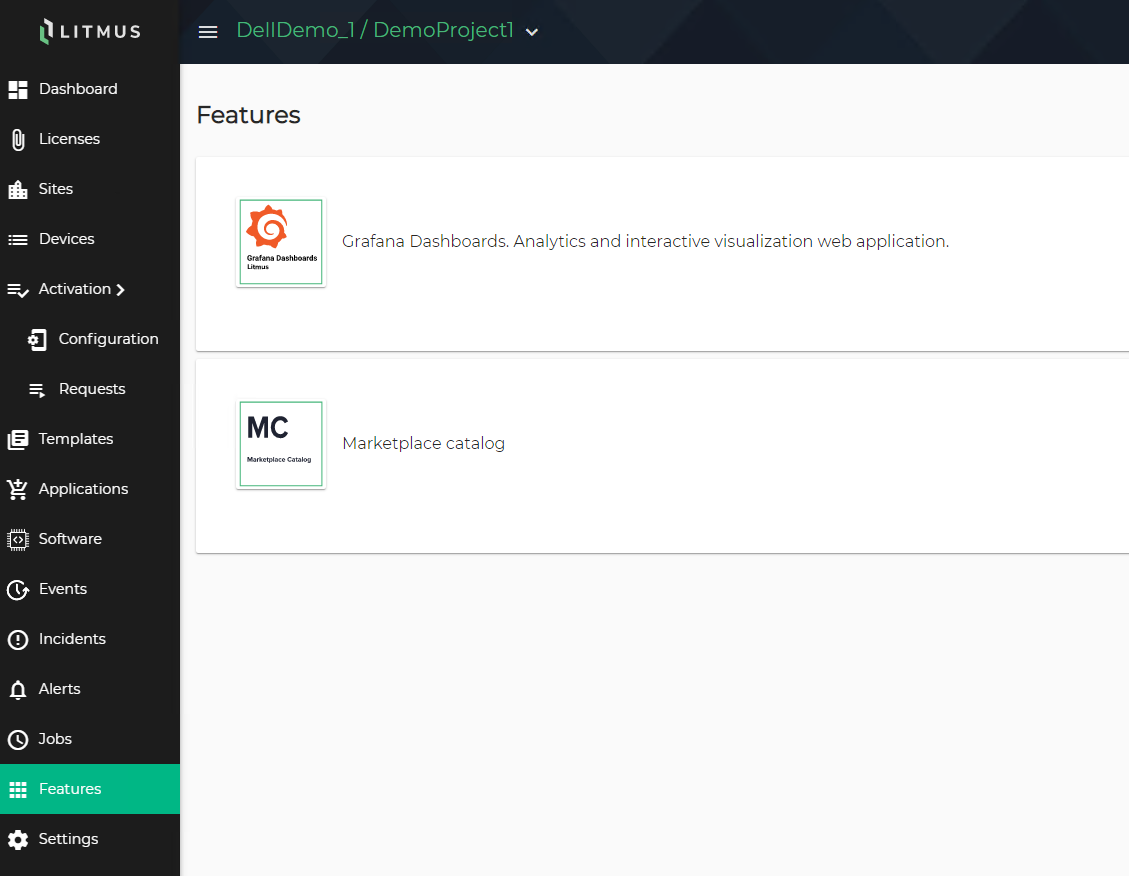
Settings
You can view the Settings module from a Company or an open Project. This module includes four tabs:
- Settings—Includes the Project, Timezone, and Remove Project sections. Modify the project name and description from the Project section. Modify the timezone from the Timezone section. Remove the project from the Remove Project section.
- Members—Includes the Project Teams and Teams sections. Add and remove Company teams from the Teams section. From the Teams section, select from default Teams and Roles when adding a Team. Company Teams define which users are allowed to access the Company Projects. The default Team selection is OWNER. Available Roles are Write and Read. You can add as many teams as you want, and assign any team to any project.
- Credentials—Includes the Connection, SSL Certificate, Credentials, Topics, and ACL sections. Copy protocol URLs for MQTT and view API information for HTTP and HTTPS from the Connection section. Copy the certificate and download the PEM file from the SSL Certificate section. Add a user for custom topics from the Credentials section, and you can copy, add, and remove topics from the Topics section. Create and remove an access control list from the ACL section.
- Message Schema—Includes the Custom Attributes and JSON sections. You can add custom attributes from the Custom Attributes section. You can view the JSON schema of messages from devices that publish to the MQTT data topic from the JSON section. Metadata being sent in the standard topic payload can be added to the message schema.
Cloud
Edge to cloud deployments
A vast majority of companies are standardizing on one of these major cloud platforms – Microsoft Azure, Google Cloud, AWS, or Cloudera.
Litmus Edge can enable your complete edge-to-cloud solution for IIoT.
Litmus to Azure
The Litmus and Azure solution accelerates and enables Azure deployment, consumption, and usage. Litmus Edge can send data directly to the Azure IoT Hub. Litmus collects, normalizes, and sends data from any asset to Azure for advanced analytics and machine learning, and then Azure models can be deployed back to Litmus Edge using the Azure container for continuous process improvement.
Figure 52. Litmus to Azure 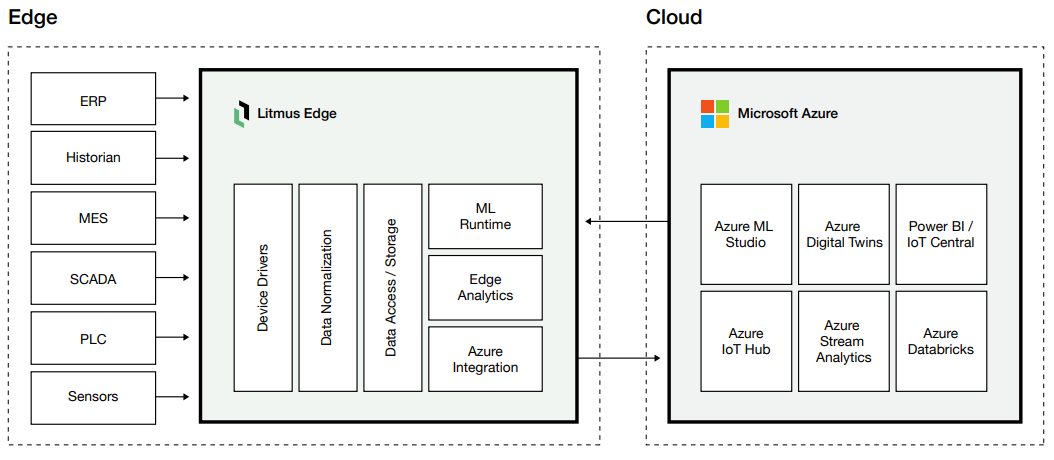
Litmus to Google Cloud Platform
Litmus Edge is integrated with the Google Cloud Platform to allow customers to connect and collect industrial data from any asset and send it directly to the Google Cloud Platform for immediate use. Litmus and Google have partnered together to accelerate application deployment at the network edge, making it easy to deploy an application once and scale it across networks to the edge.
Figure 53. Litmus to Google Cloud Platform 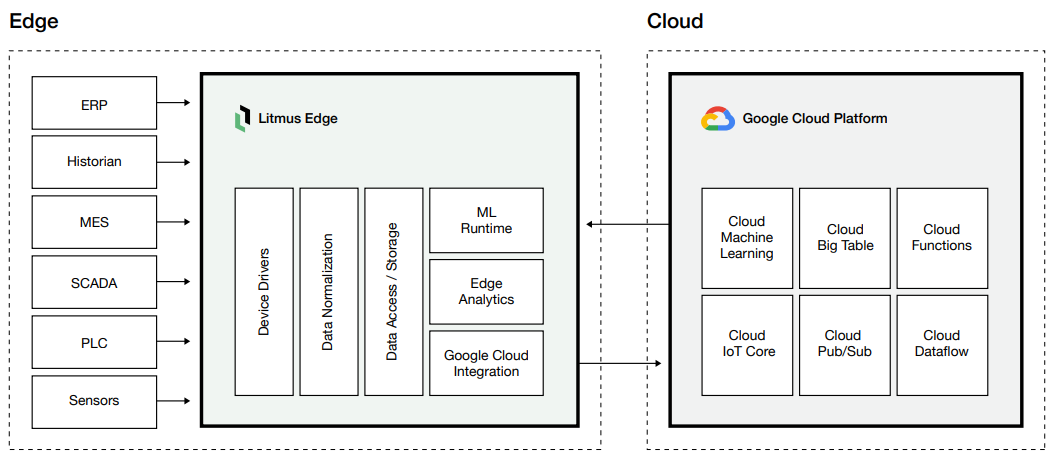
Litmus to AWS
Litmus Edge is flexible enough to collect and send machine data to AWS IoT Greengrass at the edge, or to AWS Web Services in the cloud. Litmus provides pre-built device drivers to connect to any edge data source, has a data collection and normalization engine that structures and stores data into a ready-to-use format for AWS, and has an embedded machine learning runtime that can run any AWS data model at the edge.
Figure 54. Litmus to AWS 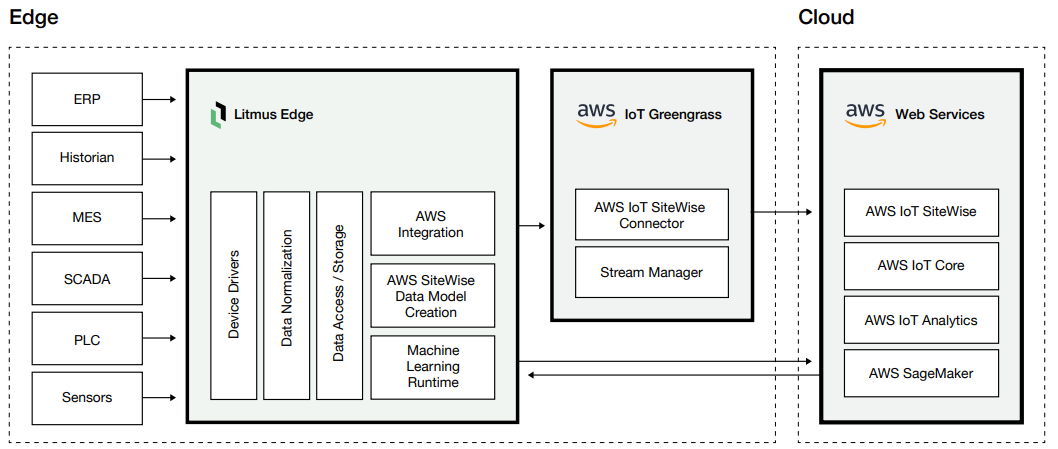
Other integrations
Litmus has pre-built connectors for most enterprise systems and can develop others for customers as needed. Litmus Edge connects via using MQTT, REST API, native Kafka, and native database interface for a flexible, easy to deploy edge-to-cloud solution.
Figure 55. Litmus to enterprise systems 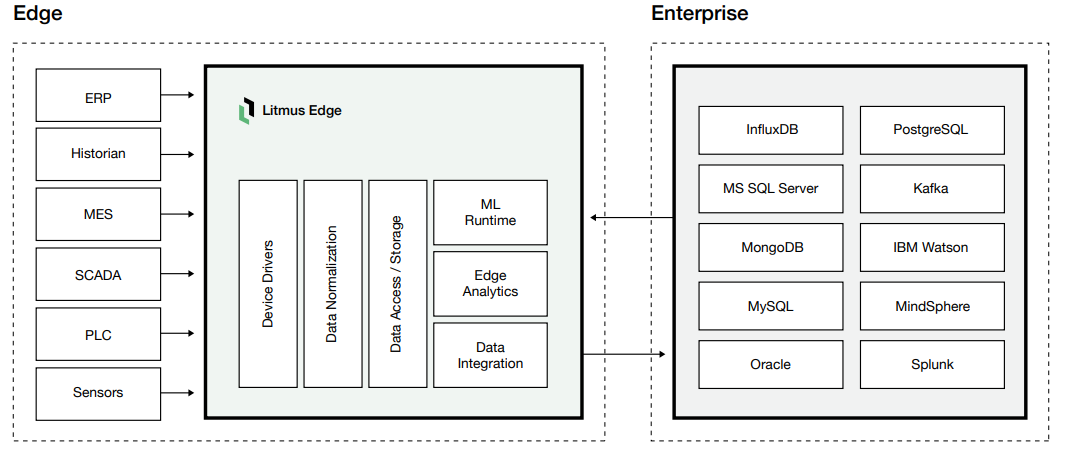
- Identify the performance and storage needs of the Litmus Edge and SDP application stacks and define the service profiles. Consider the following to determine appropriate service levels:
