-
In PowerStoreOS 1.0, performance metrics display the overall backend performance, which includes both file and block workloads. Starting with PowerStoreOS 2.0, the ability to view file-specific performance metrics is also available. The Overall tab displays overall back-end performance metrics, and the File tab displays file metrics.
File metrics are available at the node, appliance, and cluster level:
- Node—20-second granularity
- Node-level SMB metrics—5-second granularity
- Node-level NFS metrics—5-second granularity
- Appliance—20-second granularity
- Cluster—5-second granularity
The available metrics are:
- Read, write, and total IOPS
- Read, write, and total bandwidth
- Read, write, and average latency
- Read, write, and average IO size
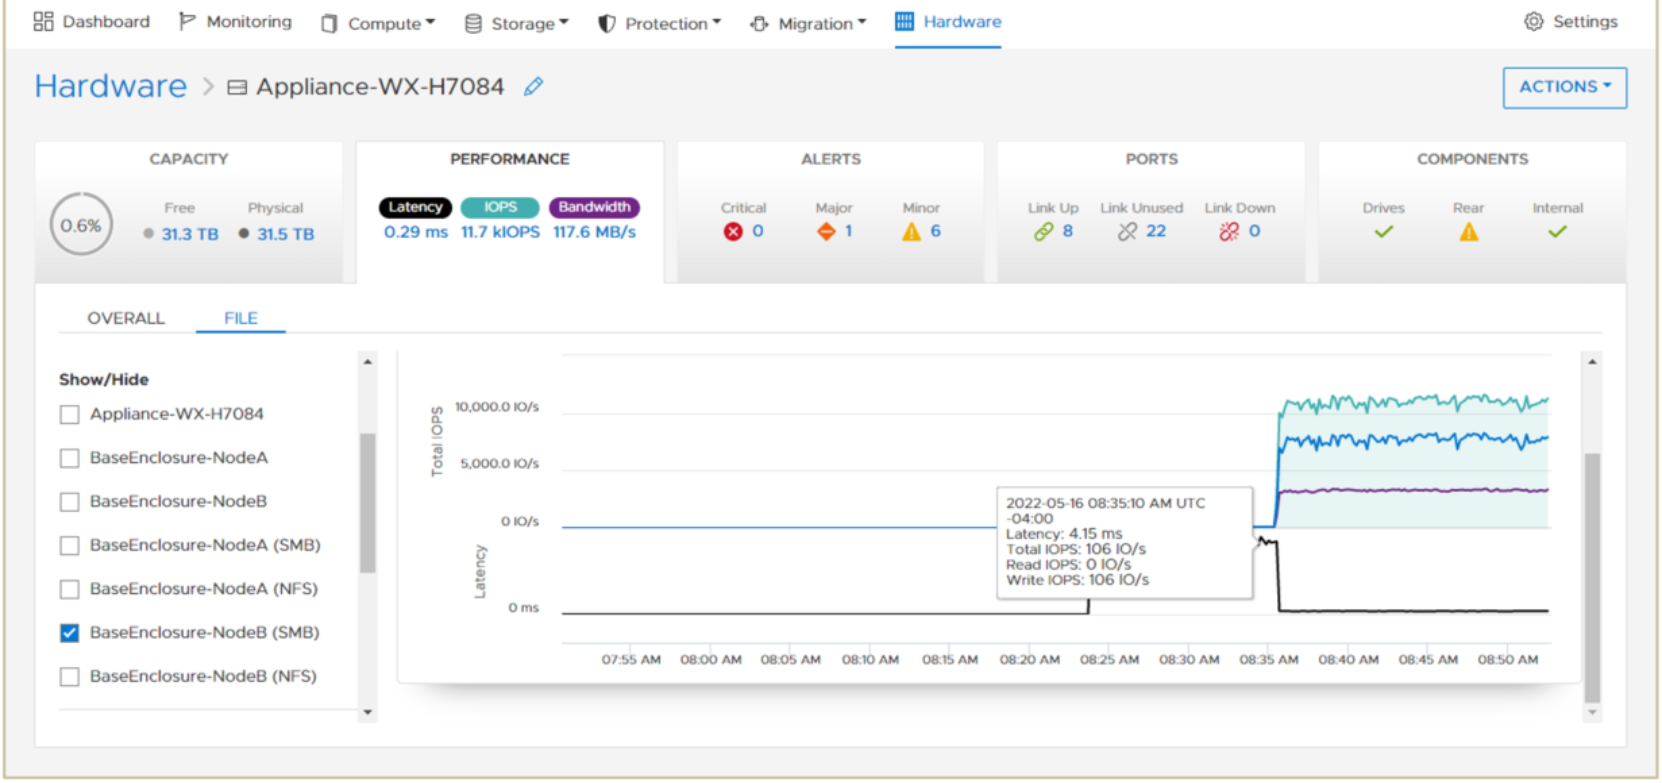
Figure 53 shows the file metrics page, displaying the node-level SMB protocol metrics on Node B.

Figure 53. SMB protocol metrics on Node B
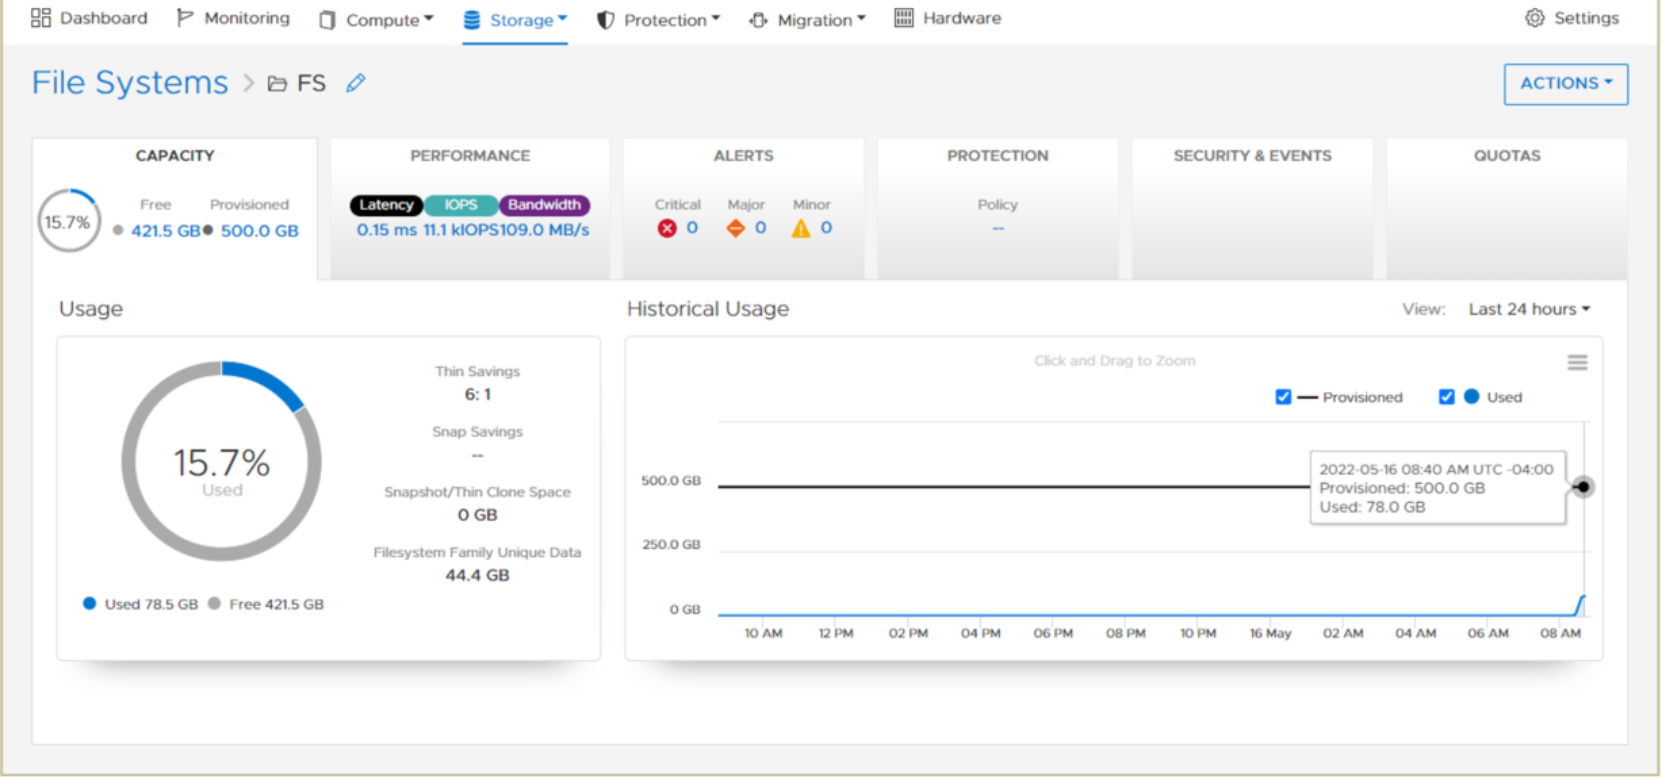
Starting with PowerStoreOS 3.0, additional capacity and performance metrics for file systems and NAS servers are available. As shown in Figure 54, the following file system capacity metrics are available at a 5-minute granularity:
- Thin savings
- Snap savings
- Snap/thin clone space
- File system family unique data

Figure 54. File system capacity metrics
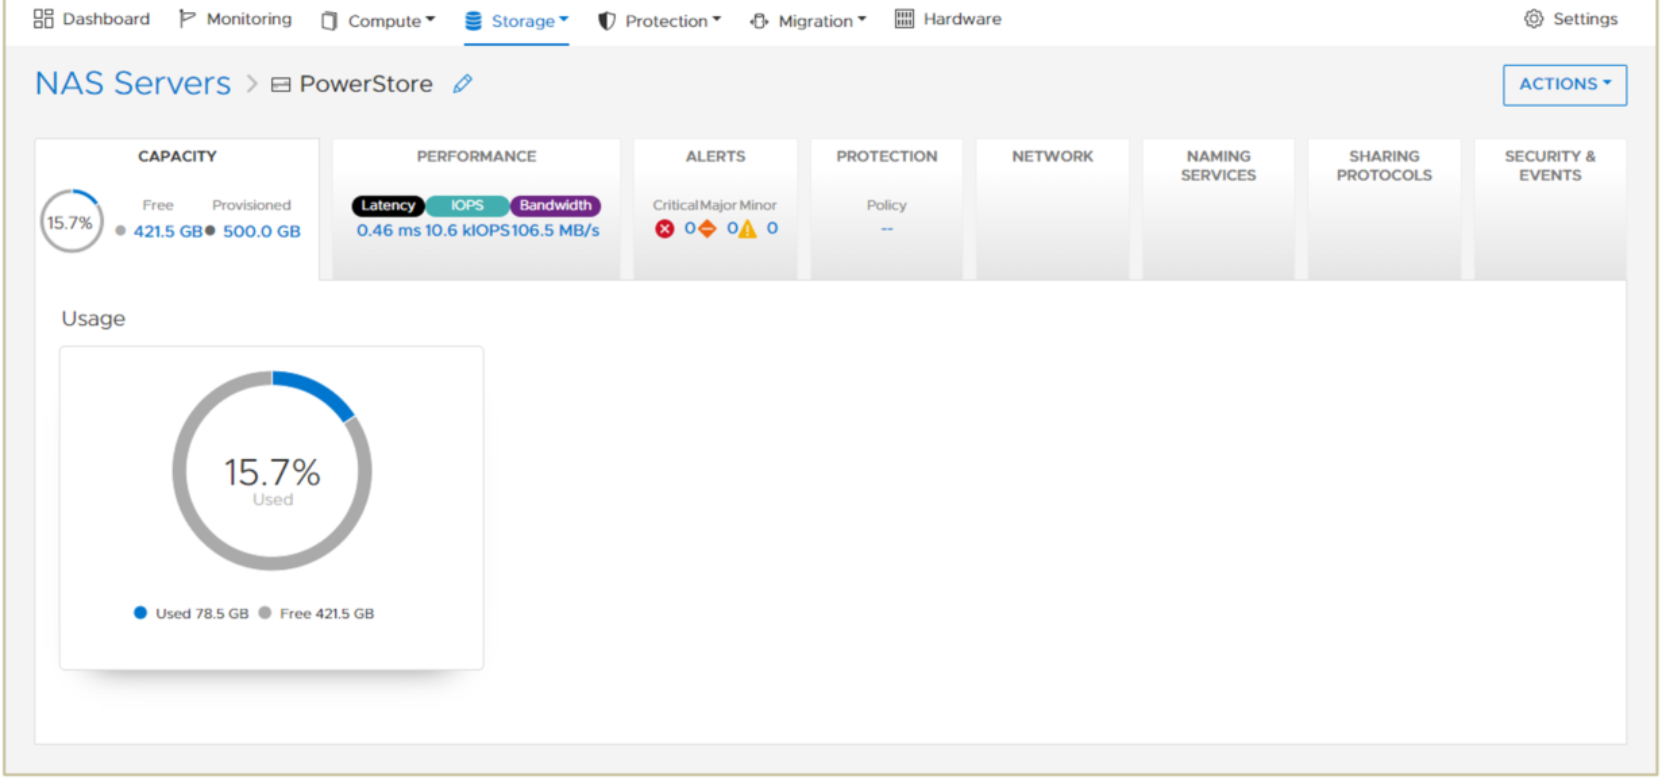
NAS server metrics enable administrators to view aggregated data for all file systems that reside on the NAS server. As shown in Figure 55, the following NAS server capacity metrics are available at a 5-minute granularity:
- Size used
- Size provisioned

Figure 55. NAS server capacity metrics
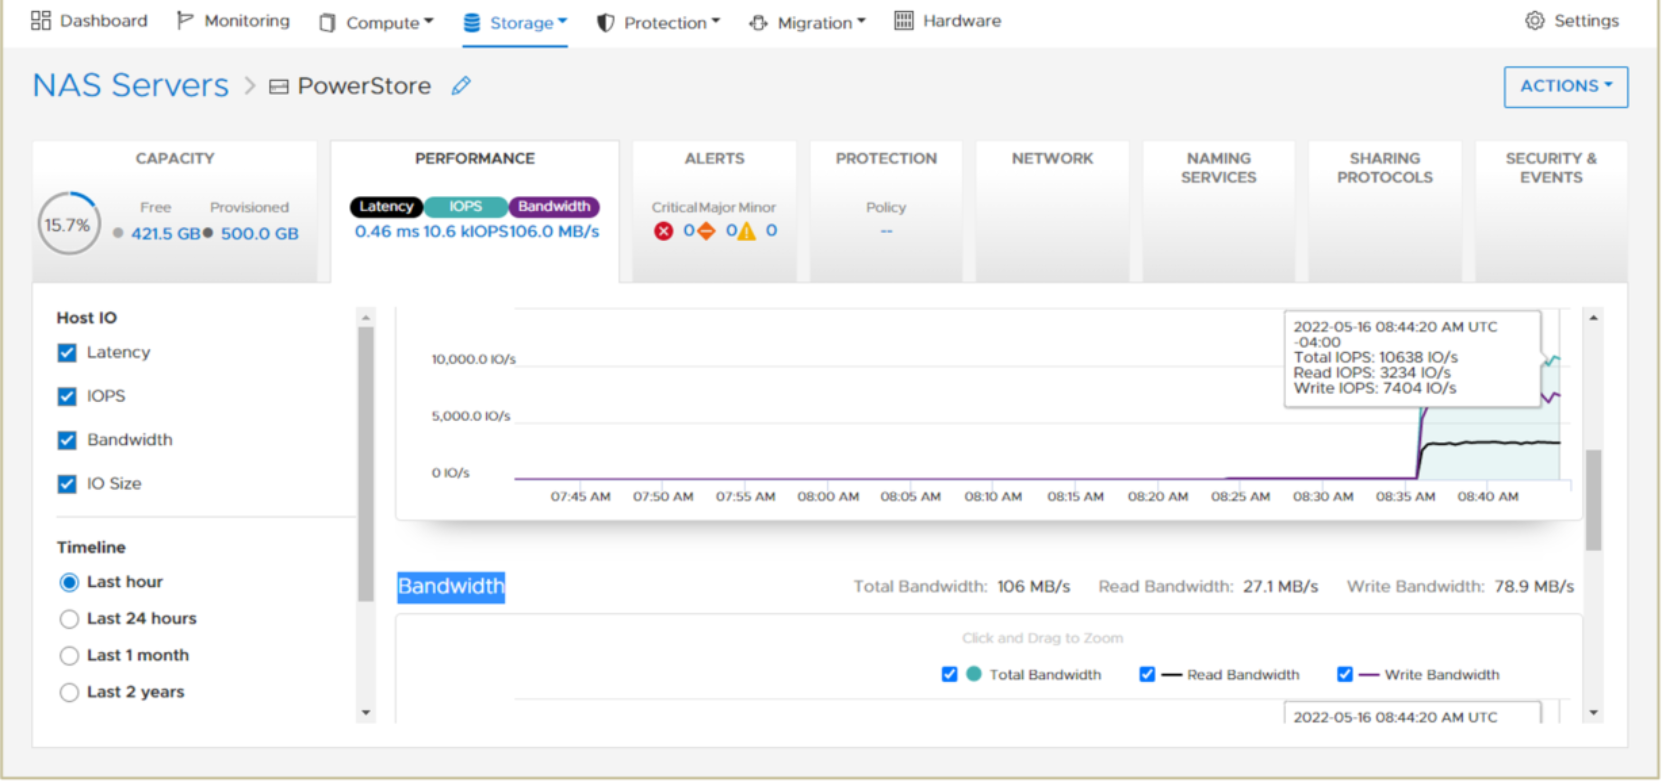
As shown in Figure 56, the following NAS server performance metrics are available at a 20-second granularity:
- Read, write, and average latency
- Read, write, and average IOPS
- Read, write, and average bandwidth
- Read, write, and average IO size

Figure 56. NAS server performance metrics
