
Direct from Development- Tech Notes

Dell PowerEdge C6615 Delivers World Record VMmark Power-Performance Results
Thu, 18 Apr 2024 16:24:02 -0000
|Read Time: 0 minutes
Abstract
The Dell PowerEdge C6615 has set a new VMmark 3 world record. This result is the world’s highest power-performance score achieved on VMmark 3 using vSAN storage. This configuration also achieved the highest 4-node server power-performance score and the highest server-storage power-performance score. All of these records illustrate the sheer efficiency, scalability, and performance-density of the C6615 modular platform.
This document summarizes the VMmark 3 benchmark results for the PowerEdge C6615 published on 1/23/2024. It lists the results, summarizes the major configuration details, and links to the results on the VMmark website.
Benchmark results
- Performance Score: 17.42 @ 16tiles
- Server Power-Performance: 18.2000 @ 16 tiles
- Server Storage Power-Performance: 11.0600 @ 16 tiles
What do these scores mean?
The following world records were achieved:
- highest power-performance score achieved on VMMark 3 using vSAN storage.
- highest 4-node server power-performance score
- highest server-storage power-performance score
The Dell PowerEdge C6615 is a modular server node in the C6600 chassis with the AMD 4th Gen EPYC 8004 series of processors. This configuration allows for four 1-S nodes in a single 2U chassis, enabling high performance density and power efficiency, especially when using local storage for vSAN.
The configuration also leveraged the latest 96GB DDR5 DIMMs that offer exceptional value and capacity for a variety of use cases.
These results showcase the great performance density, power efficiency, and scalability of the Dell PowerEdge C6615 servers for virtualization use cases. VMmark is a benchmark standard for today’s virtualized applications in the datacenter.
Notes
- Results referenced are current as of April 3rd. 2024.
- To view all VMmark 3 results, see VMmark 3.x Results (vmware.com).
- This benchmark was run by Dell in the Dell SPA lab and audited by VMware.
Key configuration details
We used 4x Dell PowerEdge C6615 server nodes in a single C6600 chassis.
Each node had the following configuration:
- 1x AMD EPYC 8534P 64 core processors at 2.3GHz (AMD EPYC 8534P | AMD)
- 6x 96 GB Dual Rank x4 DDR5 4800MT/s RDIMM (576GB total)
- Dell Customized Image of VMware ESXi 8.0 U2, Build 22380479
- VMware vCenter Server 8.0 U2a
- Boot Storage: Dell EC NVMe ISE 7400 RI M.2 960GB
- vSAN Storage:
- 1x Disk Group per Host
- 4x Dell Ent NVMe v2 AGN MU U.2 6.4TB
- Networking:
- 1x Mellanox CX-6 Dx Dual Port 100GbE QSFP56 Adapter
- 1x Broadcom Advanced Dual 25Gb Ethernet Adapter
About the Dell PowerEdge C6615
The Dell PowerEdge C6615 node with AMD EPYC 8004 series of processors is designed to maximize value and minimize TCO for scale-out workloads, using a scalable dense compute infrastructure focused on performance per watt, per dollar.
Some of the key features include:
- AMD 4th Gen EPYC up to 64 cores/CPU
- Single-socket only
- Enables DDR5 at 4800 MT/s memory and PCIe Gen5 with double the speed of previous PCIe Gen4 for faster access and transport of data, to optimize application output
- Fully featured systems management with iDRAC, and OpenManage Enterprise, and CloudIQ
These features allow you to maximize security with the PowerEdge Cyber Resilient Architecture.
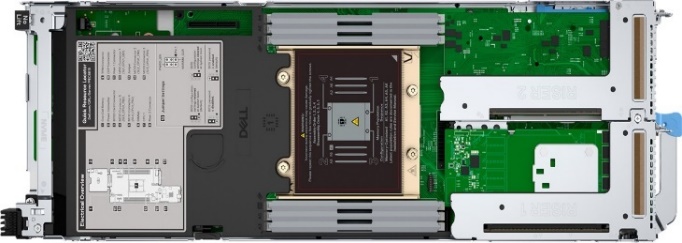
Figure 1. The PowerEdge C6615 sled and the PowerEdge C6600 chassis
What is VMmark 3.0?
VMmark is a free tool used by hardware vendors and others to measure the performance, scalability, and power consumption of virtualization platforms.
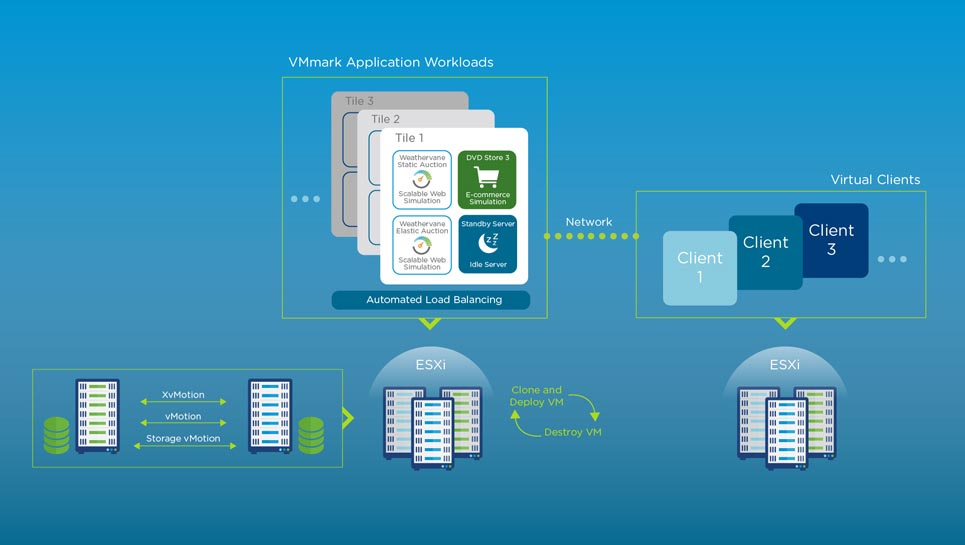
Figure 2. Outline of the VMmark benchmark components
The VMmark benchmark combines commonly-virtualized applications into predefined bundles called "tiles". This version of the benchmark has 19 unique virtual machines per tile. The number of VMmark tiles a virtualization platform can run, as well as the cumulative performance of those tiles and of a variety of platform-level workloads, determine the VMmark 3 score.
References
- For details about VMmark, see VMmark (vmware.com).
- PowerEdge C6615 Server Node

Dell PowerEdge 16G Server BIOS Settings for Optimized Performance: R7625, R6625, R7615, R6615, C6615
Tue, 26 Mar 2024 22:46:05 -0000
|Read Time: 0 minutes
BIOS setting recommendations
The following tables provide the BIOS setting recommendations for the latest generation of PowerEdge servers:
Table 1. BIOS setting recommendations - System profile settings
| System setup screen | Setting | BIOS Defaults | SPEC cpu2017 int rate (General Purpose Performance) | SPEC cpu2017 fp rate | SPEC cpu2017 int speed | SPEC cpu2017 fp speed | Memory Throughput | HPC | Latency |
| System profile setting | System profile | Performance Per Watt | Custom | Custom | Custom | Custom | Custom | Custom | Custom |
| System profile setting[*] | CPU Power Management | OS DBPM | OS DBPM | OS DBPM | OS DBPM | OS DBPM | OS DBPM | Max Performance | Max Performance |
| System profile setting | Memory Frequency | Max Performance | Max Performance | Max Performance | Max Performance | Max Performance | Max Performance | Max Performance | Max Performance |
| System profile setting | Turbo Boost | Enabled | Enabled | Enabled | Enabled | Enabled | Enabled | Enabled | Enabled |
| System profile setting | C-States | Enabled | Enabled | Enabled | Disabled | Disabled | Disabled | Disabled | Disabled |
| System profile setting | Write Data CRC | Disabled | Disabled | Disabled | Disabled | Disabled | Disabled | Enabled | Disabled |
| System profile setting | Memory Patrol Scrub | Standard | Disabled | Disabled | Disabled | Disabled | Disabled | Disabled | Disabled |
| System profile setting | Memory Refresh Rate | 1x | 1x | 1x | 1x | 1x | 1x | 1x | 1x |
| System profile setting | Workload Profile | not configured | not configured | not configured | not configured | not configured | not configured | HPL | not configured |
| System profile setting | PCI ASPM L1 Link Power Management | Enabled | Disabled | Disabled | Disabled | Disabled | Disabled | Disabled | Disabled |
| System profile setting | Determinism Slider | Performance Determinism | Power Determinism | Power Determinism | Power Determinism | Power Determinism | Power Determinism | Power Determinism | Power Determinism |
| System profile setting | Power Profile Select | High Performance Mode | High Performance Mode | High Performance Mode | High Performance Mode | High Performance Mode | High Performance Mode | High Performance Mode | High Performance Mode |
| System profile setting | PCIE Speed PMM Control | Auto | Auto | Auto | Auto | Auto | Auto | Auto | (GEN 5) |
| System profile setting | EQ Bypass To Highest Rate | Disabled | Disabled | Disabled | Disabled | Disabled | Disabled | Disabled | Disabled |
| System profile setting | DF PState Frequency Optimizer | Enabled | Enabled | Enabled | Enabled | Enabled | Enabled | Enabled | Enabled |
| System profile setting | DF PState Latency Optimizer | Enabled | Enabled | Enabled | Enabled | Enabled | Enabled | Enabled | Enabled |
| System profile setting | DF CState | Enabled | Enabled | Enabled | Enabled | Enabled | Enabled | Enabled | Enabled |
| System profile setting | Host System Management Port (HSMP) Support | Enabled | Enabled | Enabled | Enabled | Enabled | Enabled | Enabled | Enabled |
| System profile setting | Boost FMax | 0-Auto | 0-Auto | 0-Auto | 0-Auto | 0-Auto | 0-Auto | 0-Auto | 0-Auto |
| System profile setting | Algorithm Performance Boost Disable (ApbDis) | Disabled | Disabled | Disabled | Enabled | Enabled | Disabled | Disabled | Enabled |
| System profile setting | ApbDis Fixed Socket P-State[2] | P0 | P0 | P0 | |||||
| System profile setting | Dynamic Link Width Management (DLWM) | Unforced | Unforced | Unforced | Unforced | Unforced | Unforced | Unforced | Forced x16 |
[*] For C6615, apply setting from Table 3.
[1] Depends on how system was ordered. Other System Profile defaults are driven by this choice and may be different than the examples listed. Select Performance Profile first, and then select Custom to load optimal profile defaults for further modification.
[2] Pstate field is dependent on Algorithm Performance Boost Disable (ApbDis) and is visible only when it is enabled.
Table 2. BIOS setting recommendations – Memory, processor, and iDRAC settings
| System setup screen | Setting | BIOS Defaults | SPEC cpu2017 int rate (General Purpose Performance) | SPEC cpu2017 fp rate | SPEC cpu2017 int speed | SPEC cpu2017 fp speed | Memory Throughput | HPC | Latency |
| Memory settings | System Memory Testing | Disabled | Disabled | Disabled | Disabled | Disabled | Disabled | Disabled | Disabled |
| Memory settings | DRAM Refresh Delay | Minimum | Performance | Performance | Performance | Performance | Performance | Performance | Performance |
| Memory settings | Correctable memory ECC SMI | Enabled | Disabled | Disabled | Disabled | Disabled | Disabled | Disabled | Disabled |
| Memory settings | Uncorrectable Memory Error (DIMM Self healing on uncorrectable memory) | Enabled | Disabled | Disabled | Disabled | Disabled | Disabled | Disabled | Disabled |
| Memory settings | Correctable Error Logging | Disabled | Disabled | Disabled | Disabled | Disabled | Disabled | Disabled | Disabled |
| Processor settings | Logical Processor | Enabled | Enabled | Disabled[1] | Disabled[1] | Disabled[1] | Disabled[1] | Disabled[1] | Disabled[1] |
| Processor settings | Virtualization Technology | Enabled | Disabled | Disabled | Disabled | Disabled | Disabled | Disabled | Disabled |
| Processor settings | IOMMU Support | Enabled | Enabled | Enabled | Enabled | Enabled | Enabled | Enabled | Enabled |
| Processor settings | Kernel DMA Protection | Disabled | Disabled | Disabled | Disabled | Disabled | Disabled | Disabled | Disabled |
| Processor settings | L1 Stream HW Prefetcher | Enabled | Enabled | Disabled | Enabled | Enabled | Enabled | Enabled | Enabled |
| Processor settings | L2 Stream HW Prefetcher | Enabled | Enabled | Enabled | Enabled | Enabled | Enabled | Enabled | Enabled |
| Processor settings | L1 Stride Prefetcher | Enabled | Enabled | Enabled | Enabled | Enabled | Enabled | Enabled | Enabled |
| Processor settings | L1 Region Prefetcher | Enabled | Enabled | Enabled | Enabled | Enabled | Enabled | Enabled | Enabled |
| Processor settings | L2 Up Down Prefetcher | Enabled | Enabled | Enabled | Enabled | Enabled | Enabled | Enabled | Enabled |
| Processor settings | MADT Core Enumeration | Linear | Linear | Linear | Linear | Linear | Linear | Linear | Linear |
| Processor settings[*] | NUMA Node Per Socket | 1 | 4 | 4 | 4 | 1 | 4 | 4 | 4 |
| Processor settings | L3 cache as NUMA | Disabled | Disabled | Disabled | Disabled | Disabled | Disabled | Disabled | Disabled |
| Processor settings | Secure Memory Encryption | Disabled | Disabled | Disabled | Disabled | Disabled | Disabled | Disabled | Disabled |
| Processor settings | Minimum SEV no-ES ASID | 1 | 1 | 1 | 1 | 1 | 1 | 1 | 1 |
| Processor settings | SNP Memory Coverage | Disabled | Disabled | Disabled | Disabled | Disabled | Disabled | Disabled | Disabled |
| Processor settings | Secure Nested Paging | Disabled | Disabled | Disabled | Disabled | Disabled | Disabled | Disabled | Disabled |
| Processor settings | Transparent Secure Memory Encryption | Disabled | Disabled | Disabled | Disabled | Disabled | Disabled | Disabled | Disabled |
| Processor settings | ACPI CST C2 Latency | 800 | 18 | 18 | 18 | 18 | 800 | 18 | 800 |
| Processor settings | Configurable TDP | Maximum | Maximum | Maximum | Maximum | Maximum | Maximum | Maximum | Maximum |
| Processor settings | x2APIC Mode | Enabled | Enabled | Enabled | Enabled | Enabled | Enabled | Enabled | Enabled |
| Processor settings | Number of CCDs per Processor | All | All | All | All | All | All | All | All |
| Processor settings | Number of Cores per CCD | All | All | All | All | All | All | All | All |
| iDRAC settings | Thermal Profile | Default | Maximum Performance | Maximum Performance | Maximum Performance | Maximum Performance | Maximum Performance | Maximum Performance | Maximum Performance |
[*] For C6615, apply setting from Table 3.
[1] Logical Processor (Hyper Threading) tends to benefit throughput-oriented workloads such as SPEC CPU2017. Many HPC workloads disable this option.
Table 3. BIOS setting recommendations specific to C6615 (apply remaining settings from Table 1 and 2)
System setup screen | Setting | BIOS Defaults | SPEC cpu2017 int rate (General Purpose Performance) | SPEC cpu2017 fp rate | SPEC cpu2017 int speed | SPEC cpu2017 fp speed | Memory Throughput | HPC | Latency |
Processor settings | NUMA Node per Socket | 1 | 1 | 1 | 1 | 1 | 2 | 1 | 2 |
System profile setting | CPU Power Management | OS DBPM | OS DBPM | OS DBPM | OS DBPM | OS DBPM | OS DBPM | OS DBPM | OS DBPM |
iDRAC recommendations
Following are what we would recommend for an iDRAC environment:
- Thermally challenged environments should increase fan speed through iDRAC Thermal Section.
- All Power Capping should be removed in performance-sensitive environments.
Glossary
System profile: (Default="Performance Per Watt")
To assist the average customer in setting each individual power/performance feature for their specific environment, a menu option is provided that can help a customer optimize the system for factors such as minimum power usage/acoustic levels, maximum efficiency, Energy Star optimization, and maximum performance.
Performance Per Watt OS mode optimizes the performance/watt efficiency with a bias towards performance. It is the favored mode for Energy Star. Note that this mode is slightly different than Performance Per Watt DAPC mode. In this mode, no bus speeds are derated, leaving the OS in charge of making those changes.
Custom allows the user to individually modify any of the low-level settings that are preset and unchangeable in any of the other four preset modes.
C-States
C-states reduce CPU idle power. There are three options in this mode: Legacy, Autonomous, and Disable.
Enabled: When “Enabled” is selected, the operating system initiates the C-state transitions. Some OS SW may defeat the ACPI mapping, such as intel_idle driver.
Autonomous: When "Autonomous" is selected, HALT and C1 requests get converted to C6 requests in hardware.
Disable: When "Disable" is selected, only C0 and C1 are used by the OS. C1 gets enabled automatically when an OS autohalts.
CPU Power Management
CPU Power Management allows the selection of CPU power management methodology. Maximum Performance is typically selected for performance-centric workloads where it is acceptable to consume additional power to achieve the highest possible performance for the computing environment. This mode drives processor frequency to the maximum across all cores (although idled cores can still be frequency-reduced by C-States enforcement through BIOS or OS mechanisms if enabled). This mode also offers the lowest latency of the CPU Power Management Mode options, so it is always preferred for latency-sensitive environments. OS DBPM is another Performance Per Watt option that relies on the operating system to dynamically control individual core frequency. Both Windows and Linux can take advantage of this mode to reduce the frequency of idled or underutilized cores in order to save power. This will be Read-only unless System Profile is set to Custom.
Memory Frequency
Memory Frequency governs the BIOS memory frequency. The variables that govern maximum memory frequency include the maximum rated frequency of the DIMMs, the DIMMs per channel population, the processor choice, and this BIOS option. Additional power savings can be achieved by reducing the memory frequency at the expense of reduced performance. This will be Read-only unless System Profile is set to Custom.
Turbo Boost
Turbo Boost governs the Boost Technology. This feature allows the processor cores to be automatically clocked up in frequency beyond the advertised processor speed. The amount of increased frequency (or 'turbo upside') one can expect from an EPYC processor depends on the processor model, thermal limitations of the operating environment, and in some cases power consumption. In general terms, the fewer cores being exercised with work, the higher the potential turbo upside. The potential drawbacks for Boost are mainly centered on increased power consumption and possible frequency jitter that can affect a small minority of latency-sensitive environments. This will be Read-only unless System Profile is set to Custom.
Memory Patrol Scrub
Memory Patrol Scrubbing searches the memory for errors and repairs correctable errors to prevent the accumulation of memory errors. When set to Disabled, no patrol scrubbing will occur. When set to Standard Mode, the entire memory array will be scrubbed once in a 24-hour period. When set to Extended Mode, the entire memory array will be scrubbed more frequently to further increase system reliability. This will be Read-only unless System Profile is set to Custom.
Memory Refresh Rate
The memory controller will periodically refresh the data in memory. The frequency at which memory is normally refreshed is referred to as 1X refresh rate. When memory modules are operating at a higher-than-normal temperature or to further increase system reliability, the refresh rate can be set to 2X, however this may have a negative impact on memory subsystem performance under certain circumstances. This will be Read-only unless System Profile is set to Custom.
PCI ASPM L1 Link Power Management
When enabled, PCIe Advanced State Power Management (ASPM) can reduce overall system power while slightly reducing system performance.
Note: Some devices may not perform properly (they may hang or cause the system to hang) when ASPM is enabled; for this reason, L1 will only be enabled for validated qualified cards.
Determinism Slider
The Determinism Slider controls whether BIOS will enable determinism to control performance.
Performance Determinism: BIOS will enable 100% deterministic performance control.
Power Determinism: BIOS will not enable deterministic performance control.
Power Profile Select
High Performance Mode (default): Favors core performance. All DF P-States are available in this mode, and the default DF P-State and DLWM algorithms are active.
Efficiency Mode: Configures the system for power efficiency. Limits boost frequency available to cores and restricts DF P-States available in the system. Maximum IO.
Performance Mode: Sets up Data Fabric to maximize IO sub-system performance.
Algorithm Performance Boost Disable (ApbDis)
When enabled, a specific hard-fused Data Fabric (SoC) P-state is forced for optimizing workloads sensitive to latency or throughput. For higher performance and power savings, when disabled, P-states will be automatically managed by the Application Power Management, allowing the processor to provide maximum performance while remaining within a specified power-delivery and thermal envelope.
ApbDis Fixed Socket P-State
This value defines the forced P-state when ApbDis is enabled.
Dynamic Link Width Management (DLWM)
DLWM reduces the XGMI link width between sockets from x16 to x8 (default) when no traffic is detected on the link. As with Data Fabric and Memory P-states, this feature is optimized to trade power between core and high IO/memory bandwidth workloads.
Forced: Force link width to x16, x8, or x2.
Unforced: Link width will be managed by DLWM engine.
System Memory Testing
System Memory Testing indicates whether or not the BIOS system memory tests are conducted during POST. When set to Enabled, memory tests are performed.
Note: Enabling this feature will result in a longer boot time. The extent of the increased time depends on the size of the system memory.
Dram Refresh Delay
By enabling the CPU memory controller to delay running the REFRESH commands, you can improve the performance for some workloads. By minimizing the delay time, it is ensured that the memory controller runs the REFRESH command at regular intervals. For Intel-based servers, this setting only affects systems configured with DIMMs which use 8 Gb density DRAMs.
Correctable Memory ECC SMI
Allows the system to log ECC-corrected DRAM errors into the SEL log. Logging these rare errors can help identify marginal components, however the system will pause for a few milliseconds after an error while the log entry is created. Latency-conscious customers may want to disable the feature. Spare Mode and Mirror mode require this feature to be enabled.
DIMM Self Healing (Post Package Repair) on Uncorrectable Memory Error Enable/Disable Post Package Repair (PPR) on Uncorrectable Memory Error.
Correctable Error Logging
Enable/Disable logging of correctable memory threshold error.
Logical Processor
Each processor core supports up to two logical processors. When set to Enabled, the BIOS reports all logical processors. When set to Disabled, the BIOS only reports one logical processor per core. Generally, a higher processor count results in increased performance for most multi-threaded workloads, and the recommendation is to keep this enabled. However, there are some floating point/scientific workloads, including HPC workloads, where disabling this feature may result in higher performance.
Virtualization Technology
When set to Enabled, the BIOS will enable processor Virtualization features and provide the virtualization support to the Operating System (OS) through the DMAR table. In general, only virtualized environments such as VMware(r) ESX(tm), Microsoft Hyper-V(r), Red Hat(r) KVM, and other virtualized operating systems will take advantage of these features. Disabling this feature is not known to significantly alter the performance or power characteristics of the system, so leaving this option Enabled is advised for most cases.
IOMMU Support
Enable or Disable IOMMU support. Required to create IVRS ACPI Table.
Kernel DMA Protection
When set to Enabled, using IOMMU, BIOS & Operating System will enable direct memory access protection for DMA-capable peripheral devices. Enable IOMMU Support to use this option.
L1 Stream HW Prefetcher
When set to Enabled, the processor provides advanced performance tuning by controlling the L1 stream HW prefetcher setting. Use the recommended setting, and this option will allow for optimizing overall workloads.
L2 Stream HW Prefetcher
When set to Enabled, the processor provides advanced performance tuning by controlling the L2 stream HW prefetcher setting. Use the recommended setting, and this option will allow for optimizing overall workloads.
L1 Stride Prefetcher
When set to Enabled, the processor provides additional fetch to the data access for an individual instruction for performance tuning by controlling the L1 stride prefetcher setting. Use the recommended setting, and this option will allow for optimizing overall workloads.
L1 Region Prefetcher
When set to Enabled, the processor provides additional fetch to data along with the data access to the given instruction for performance tuning by controlling the L1 region prefetcher setting. Use the recommended setting, and this option will allow for optimizing overall workloads.
L2 Up Down Prefetcher
When set to Enabled, the processor uses memory access to determine whether to fetch next or previous for all memory accesses for advanced performance tuning by controlling the L2 up/down prefetcher setting. Use the recommended setting, and this option will allow for optimizing overall workloads.
MADT Core Enumeration
This field determines how BIOS enumerates processor cores in the ACPI MADT table. When set to Round Robin, processor cores are enumerated in a Round Robin order to evenly distribute interrupt controllers for the OS across all Sockets and Dies. When set to Linear, processor cores are enumerated across all Dies within a Socket before enumerating additional Sockets for a linear distribution of interrupt controllers for the OS.
NUMA Nodes Per Socket
This field specifies the number of NUMA nodes per socket. The Zero option is for 2 socket configurations.
L3 cache as NUMA Domain
This field specifies that each CCX within the processor will be declared as a NUMA Domain.
Secure Memory Encryption
This field enables or disables AMD secure encryption features such as Secure Memory Encryption (SME) and Secure Encrypted Virtualization (SEV). In addition to enabling this option, SME must be supported and activated by the operating system. Similarly, SEV must be supported and activated by the hypervisor. This option also determines if other secure encryption feature such as TSME and SEV-SNP features can be enabled.
Minimum SEV non-ES ASID
This field determines the number of Secure Encrypted Virtualization (SEV) Encrypted States (ES) and non-ES available Address Space IDs. The number specified is the dividing line between ES and non-ES ASIDs. The register save state area is also encrypted along with the entire guest memory area. The maximum number of ASIDs available depends on installed CPU and memory configuration which can either be 15, 253, or 509. The default value is 1, and the value entered by user means the number of non-ES ASIDs starts from the value entered and ends at the maximum number of ASIDs available. A value of 1 means there are only non-ES ASIDs available. For example, if the maximum number of ASIDs is 15, the default value 1 means there are 15 SEV non-ES ASIDs and 0 SEV ES ASIDs. Alternatively, if the maximum number of ASIDs is 15, the value 4 means there are 12 SEV non-ES ASIDs and 3 SEV ES ASIDs. Further, if the maximum number of ASIDs is 509, the value 40 means there are 470 SEV non-ES ASIDs and 39 SEV ES ASIDs.
Secure Nested Paging
This option enables or disables SEV-SNP, a set of additional security protections.
SNP Memory Coverage
This option selects the operating mode of the Secure Nested Paging (SNP) Memory and the Reverse Map Table (RMP). The RMP is used to ensure a one-to-one mapping between system physical addresses and guest physical addresses.
Transparent Secure Memory Encryption
This field enables or disables Transparent Secure Memory Encryption (TSME). TSME is always-on memory encryption that does not require operating system or hypervisor support. If the operating system supports SME, this field does not need to be enabled. If the hypervisor supports SEV, this field does not need to be enabled. Enabling TSME affects system memory performance.
ACPI CST C2 Latency
Enter in 18 - 1000 microseconds (decimal value). Larger C2 latency values will reduce the number of C2 transitions and reduce C2 residency. Fewer transitions can help when performance is sensitive to the latency of C2 entry and exit. Higher residency can improve performance by allowing higher frequency boost and reduce idle core power. With Linux kernel 6.0 or later, the C2 transition cost is significantly reduced. The best value will be dependent on kernel version, use case, and workload.
Configurable TDP
Configurable TDP allows the reconfiguration of the processor Thermal Design Power (TDP) levels based on the power and thermal delivery capabilities of the system. TDP refers to the maximum amount of power the cooling system is required to dissipate.
Note: This option is only available on certain SKUs of the processors, and the number of alternative levels varies as well.
x2APIC Mode
Enable or Disable x2APIC mode. Compared to the traditional xAPIC architecture, x2APIC extends processor addressability and enhances interrupt delivery performance.
Number of CCDs per Processor
This field enables the number of CCDs per Processor.
Number of Cores per CCD
This field enables the number of Cores per CCD.
Authors: Charan Soppadandi, Chris Cote, Donald Russell, Kavya AR

Accelerating Relational Database Workloads with 16G Dell PowerEdge R6625 Servers Equipped with PCIe 5.0 E3.S

Thu, 08 Feb 2024 02:28:42 -0000
|Read Time: 0 minutes
Summary
The latest 16G Dell PowerEdge R6625 servers support the PCIe 5.0 interface and the Enterprise and Datacenter Standard Form Factor (EDSFF) E3.S form factor. They deliver significant performance benefits and an improved system airflow that enhances heat dissipation. This can lead to less thermal throttling and increased lifespans for system components such as CPUs, memory and storage when compared with prior PCIe generations deployed with 2.5-inch1 form factor SSDs.
The purpose of this tech note is to present a generational server performance and power consumption comparison using PostgreSQL® relational database2 workloads. It compares 16G Dell PowerEdge R6625 PCIe 5.0 E3.S servers deployed with KIOXIA CM7-R Series E3.S enterprise NVMe SSDs with a previous generation system configuration.
The test results indicate that the latest 16G Dell PowerEdge R6625 servers deliver almost twice the relational database transactions using approximately the same amount of power when compared with the previous generation system.
Market positioning
Relational databases are vital to today’s data centers as they store an overwhelming amount of data captured on premises and at the edge of the network. Sales transactions and information relating to customers, vendors, products and financials represent key data.
IT teams need solutions that scale their data center storage platforms to better address large datasets and future growth. As these databases are dependent on fast underlying storage, one way to achieve high performance and scalability is by utilizing servers equipped with enterprise SSDs based on the latest PCIe 5.0 interface and the NVMe 2.0 protocol. The PCIe 5.0 revision can move data through the PCIe interface almost twice as fast when compared with the previous PCIe
4.0 generation. This enables SSDs to deliver input/output (I/O) even faster while requiring fewer servers to achieve the same level of performance.
With the recent availability of EDSFF SSDs, storage performance and total capacity per server can also increase. Servers with EDSFF E3.S slots deployed with E3.S SSDs deliver fast data throughput, fast input/output operations per second (IOPS) performance, low latency, high density and thermally optimized capabilities.
Product Features
Dell PowerEdge 6625 Rack Server (Figure 1)
Specifications: https://www.delltechnologies.com/asset/en-us/products/servers/technical-support/poweredge-r6625-spec- sheet.pdf.
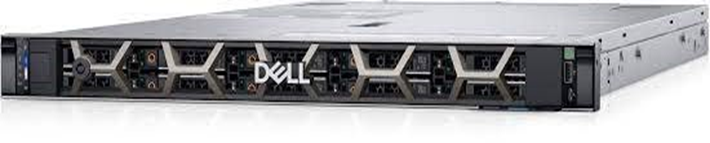
Figure 1: Side angle of Dell PowerEdge 6625 Rack Server3
KIOXIA CM7 Series Enterprise NVMe SSD (Figure 2) Specifications:https://americas.kioxia.com/en-us/business/ssd/enterprise-ssd.html.
Figure 2: Front view of KIOXIA CM7 Series SSD4
PCIe 5.0 and NVMe 2.0 specification compliant; Two configurations: CM7-R Series (read intensive), 1 Drive Write Per Day5 (DWPD), up to 30,720 gigabyte6 (GB) capacities and CM7-V Series (higher endurance mixed use), 3 DWPD, up to 12,800 GB capacities.
Performance specifications: SeqRead = up to 14,000 MB/s; SeqWrite = up to 7,000 MB/s; RanRead = up to 2.7M IOPS; RanWrite = up to 600K IOPS.
Hardware/Software test configuration
The hardware and software equipment used in this virtualization comparison (Figure 3):
Server Information | ||
Server Model | Dell PowerEdge R6625 | Dell PowerEdge R6525 |
No. of Servers | 1 | 1 |
CPU Information | ||
CPU Model | AMD EPYC™ 9334 | AMD EPYC 7352 |
No. of Sockets | 2 | 2 |
No. of Cores | 32 | 24 |
Memory Information | ||
Memory Type | DDR5 | DDR4 |
Memory Speed (in megatransfers per second) | 4,800 MT/s | 3,200 MT/s |
Memory Size (in gigabytes) | 384 GB | 128 GB |
SSD Information | ||
SSD Model | KIOXIA CM7-R Series | KIOXIA CM6-R Series |
SSD Type | Read intensive | Read intensive |
Form Factor | E3.S | 2.5-inch (U.3) |
Interface | PCIe 5.0 x4 | PCIe 4.0 x4 |
Interface Speed (in gigatransfers per second) | 128 GT/s | 64 GT/s |
No. of SSDs | 4 | 4 |
SSD Capacity (in terabytes6) | 3.84 TB | 3.84 TB |
DWPD | 1 | 1 |
Active Power | up to 24 watts | up to 19 watts |
Operating System Information | ||
Operating System (OS) | Ubuntu® | Ubuntu |
OS Version | 22.04.2 | 22.04.2 |
Kernel | 5.15.0-76-generic | 5.15.0-76-generic |
RAID | RAID 57 | RAID 5 |
RAID Version | mdadm 4.2 | mdadm 4.2 |
Test Software Information | ||
Software | HammerDB8 | HammerDB |
Benchmark | TPROC-C9 | TPROC-C |
Version | 4.8 | 4.8 |
No. of Virtual Users | 128 | 128 |
Figure 3: Hardware/software configuration used in the comparison
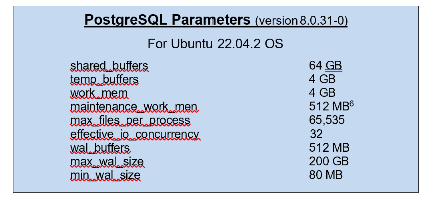
For additional information regarding PostgreSQL relational database parameters and the OS tuning parameters used in this comparison, see Appendix A.
Set-up and test procedures
Set-up #1:
A Dell PowerEdge 6625 Rack Server was set-up with the Ubuntu 22.04.2 operating system.
Additional OS level parameters were adjusted to help increase system performance (to adjust these parameters, refer to Appendix A).
The system was rebooted.
Four 3.84 TB KIOXIA CM7 Series SSDs were placed in a RAID 5 set (via mdadm) to hold the PostgreSQL database in the server.
An XFS® file system was placed on top of the RAID 5 set and was mounted with noatime10 and discard11 flags. PostgreSQL relational database was installed in the server and the service was started.
HammerDB test software was installed on the server for the KIOXIA CM7 Series SSDs, enabling the TPROC-C online transaction processing (OLTP) workloads to run against the PostgreSQL database.
Set-up #2:
A Dell PowerEdge 6525 Rack Server was set-up with the Ubuntu 22.04.2 operating system.
Additional OS level parameters were adjusted to help increase system performance (to adjust these parameters, refer to Appendix A).
The system was rebooted.
Four 3.84 TB KIOXIA CM6 Series SSDs were placed in a RAID 5 set (via mdadm) to hold the PostgreSQL database in the server.
An XFS file system was placed on top of the RAID 5 set and was mounted with noatime and discard flags. PostgreSQL relational database was installed in the server and the service was started.
HammerDB test software was installed on the server for the KIOXIA CM6 Series SSDs, enabling the TPROC-C OLTP workloads to run against the PostgreSQL database.
Test procedures:
The following metrics were recorded when the TPROC-C workload was run against each configuration: Average Database Throughput
Average Drive Read Latency
Average Drive Write Latency Average Server Power Consumption
For each individual metric, three total runs were performed and the average of the three runs were calculated and compared with each configuration.
Test results12
Average Database Throughput (Figure 4).
This test measured how many transactions in the TPROC-C workload were executed per minute. The HammerDB software, executing the TPROC-C transaction profile, randomly performed new order, payment, order status, delivery and stock level transactions. The benchmark simulated an OLTP environment with a large number of users conducting simple and short transactions (that require sub-second response times and return relatively few records). Figure 4 shows the average database throughput from three test runs for each set of drives. The results are in transactions per minute (TPM)
- the higher result is better.
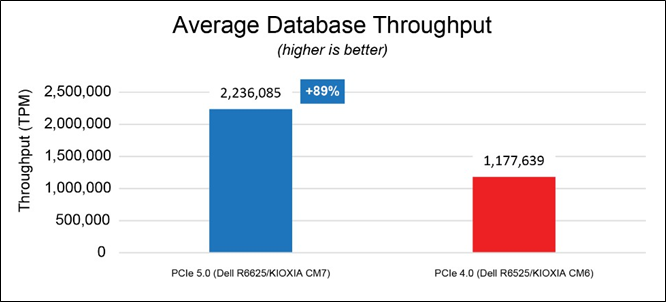
Figure 4: Average database throughput results
Average Read Latency (Figure 5).
This test measured drive read latency in milliseconds (ms) - the time it took to perform a drive read operation and included the time it took to complete the operation and receive a ‘successfully completed’ acknowledgement. These metrics were obtained from the drives while the database workload was running. Figure 5 shows the average read latency from three test runs for each set of drives - the lower result is better.
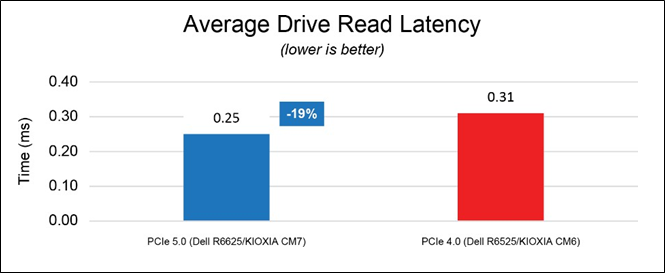
Figure 5: Average read latency results
Average Write Latency (Figure 6).
This test measured drive write latency in milliseconds (ms) - the time it took to perform a drive write operation and included the time it took to complete the operation and receive a ‘successfully completed’ acknowledgement. These metrics were obtained from the drives while the database workload was running. Figure 6 shows the average write latency from three test runs for each set of drives - the lower result is better.
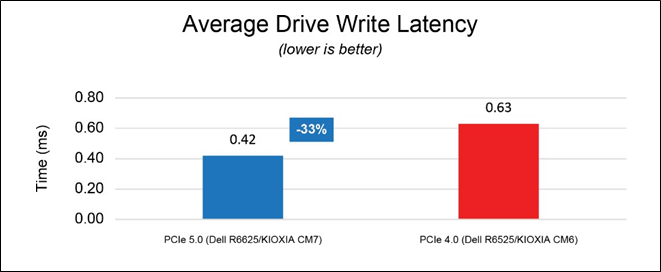
Figure 6: Average write latency results
Average Server Power Consumption (Figure 7).
This test measured the average amount of power drawn by each server system in its entirety including all of the individual components that run from the server’s power supply unit (PSU). This includes the motherboard, CPU, memory, storage and other server components. The following results in Figure 7 were obtained from the Integrated Dell Remote Access Controller (iDRAC) – the results are in watts (W).
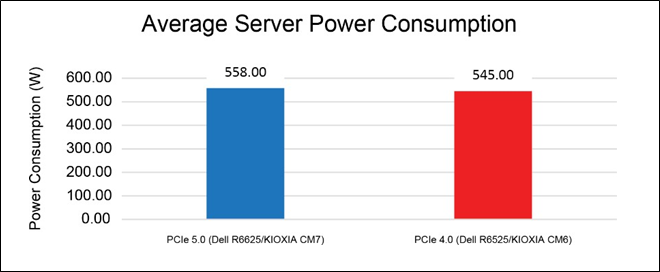
Figure 7: Average server power consumption results
Although the overall system power draw is slightly higher in the PCIe 5.0 configuration, the solution is able to maintain 89% higher database throughput, 19% lower read latency and 33% lower write latency on average.
From the Figure 7 results, database throughput per watt can be easily determined by dividing the average database throughput by the average server consumption as depicted in Figure 8 – the higher result is better.
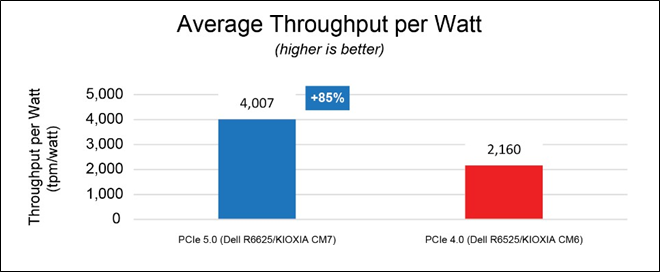
Figure 8: Average throughput per watt results
The PCIe 5.0 configuration was able to deliver 4,007 TPM per watt versus 2,160 TPM per watt delivered by the PCIe 4.0 configuration, nearly doubling database throughput per watt. At the data center level, these results enable administrators to use the same number of servers for nearly double the performance, or converse to this, scale the number of servers to help save on power consumption and total cost of ownership without sacrificing performance.
Final analysis
Next generation Dell PowerEdge 6625 Rack Servers deployed with KIOXIA CM7 Series PCIe 5.0 E3.S SSDs show nearly double the database performance when compared with a previous generation while lowering SSD latency by performing read/write operations faster. This system delivered 89% more transactions per minute enabling higher relational database workload densities while reducing the footprint of servers needed to service these workloads.
The Dell PowerEdge R6625 and KIOXIA CM7 Series SSD test configuration also demonstrated a comparable server power draw when compared with the previous generation test system. Though the active power increased from PCIe 4.0 to PCIe 5.0 by approximately 13 watts, the system was able to process almost twice as many transactions while consuming almost the same amount of power. As such, fewer servers are necessary to achieve the same level of performance without experiencing a power consumption spike.
The test results indicate that the latest 16G Dell PowerEdge 6625 Rack Servers deliver almost twice the relational database transactions using approximately the same amount of power when compared with prior PCIe generations.
Appendix A – PostgreSQL Parameters / OS Tuning Parameters
The PostgreSQL parameters used for this comparison include:
Additional tuning parameters performed on the OS to optimize system performance were made to /etc/sysctl.conf files and
/etc/security/limits.conf files. The /etc/sysctl.conf files override OS default kernel parameter values while the
/etc/security/limits.conf files allow resource limits to be set. These tuning parameters include:
/etc/sysctl.conf file changes:
Parameter | Value |
vm.swappiness | 0 |
kernel.sem | 250 32000 100 128 |
fs.file-max | 6815744 |
net.core.rmem_default | 262144 |
net.core.rmem_max | 4194304 |
net.core.wmem_default | 262144 |
net.core.wmem_max | 1048576 |
fs.aio-max-nr | 1048576 |
vm.nr_hugepages | 35000 |
/etc/security/limits.conf file changes:
User | Values | ||
* | soft | nproc | 65535 |
* | hard | nproc | 65535 |
* | soft | nofile | 65535 |
* | hard | nofile | 65535 |
root | soft | nproc | 65535 |
root | hard | nproc | 65535 |
root | soft | nofile | 65535 |
root | hard | nofile | 65535 |
postgres | soft | memlock | 100000000 |
postgres | hard | memlock | 100000000 |
References
Footnotes
- 2.5-inch indicates the form factor of the SSD and not its physical size.
- PostgreSQL is a powerful, open source object-relational database system with over 35 years of active development and a reputation for reliability, feature robustness and performance.
- The product image shown is a representation of the design model and not an accurate product depiction.
- The product image shown was provided with permission from KIOXIA America, Inc. and is a representation of the design model and not an accurate product depiction.
- Drive Write Per Day (DWPD) means the drive can be written and re-written to full capacity once a day, every day for five years, the stated product warranty period. Actual results may vary due to system configuration, usage and other factors. Read and write speed may vary depending on the host device, read and write conditions and file size.
- Definition of capacity - KIOXIA Corporation defines a megabyte (MB) as 1,000,000 bytes, a gigabyte (GB) as 1,000,000,000 bytes and a terabyte (TB) as 1,000,000,000,000 bytes. A computer operating system, however, reports storage capacity using powers of 2 for the definition of 1Gbit = 230 bits = 1,073,741,824 bits, 1GB = 230 bytes = 1,073,741,824 bytes and 1TB = 240 bytes = 1,099,511,627,776 bytes and therefore shows less storage capacity. Available storage capacity (including examples of various media files) will vary based on file size, formatting, settings, software and operating system, and/or pre-installed software applications, or media content. Actual formatted capacity may vary.
- RAID 5 is a redundant array of independent disks configuration that uses disk striping with parity - Data and parity are striped evenly across all of the disks, so no single disk is a bottleneck.
- HammerDB is benchmarking and load testing software that is used to test popular databases. It simulates the stored workloads of multiple virtual users against specific databases to identify transactional scenarios and derive meaningful information about the data environment, such as performance comparisons.
- TPROC-C is the OLTP workload implemented in HammerDB derived from the TPC-C™ specification with modification to make running HammerDB straightforward and cost-effective on any of the supported database environments. The HammerDB TPROC-C workload is an open source workload derived from the TPC-C Benchmark Standard and as such is not comparable to published TPC-C results, as the results comply with a subset rather than the full TPC-C Benchmark Standard. TPROC-C means Transaction Processing Benchmark derived from the TPC "C" specification.
- The noatime option turns off access time recording so that the file system will ignore access time updates on files. If the file system is used for database workloads, specifying noatime can reduce writes to the file system.
- The discard option allows the file system to inform the underlying block device to issue a TRIM command when blocks are longer used. KIOXIA makes no warranties regarding the test results and performance can vary due to system configuration usage and other factors.
- Read and write speed may vary depending on the host device, read and write conditions and file size.
Trademarks
AMD EPYC and combinations thereof are trademark of Advanced Micro Devices, Inc. Dell and PowerEdge are registered trademarks or trademarks of Dell Inc.
NVMe is a registered or unregistered trademark of NVM Express, Inc. in the United States and other countries. PCIe is a registered trademark of PCI-SIG.
PostgreSQL is a registered trademark of the PostgreSQL Community Association of Canada.
All other company names, product names and service names may be trademarks or registered trademarks of their respective companies.
TPC-C is a trademark of the Transaction Processing Performance Council. All other company names, product names and service names may be trademarks or registered trademarks of their respective companies.
Ubuntu is a registered trademark of Canonical Ltd.
XFS is a registered trademark of Silicon Graphics International Corp. or its subsidiaries in the United States and/or other countries.
All other company names, product names and service names may be trademarks or registered trademarks of their respective companies.
Disclaimers
© 2023 Dell, Inc. All rights reserved. Information in this tech note, including product specifications, tested content, and assessments are current and believed to be accurate as of the date that the document was published and subject to change without prior notice. Technical and application information contained here is subject to the most recent applicable product specifications.

13% Better Performance in Financial Trading with PowerEdge R7615 and AMD EPYC 9374F
Wed, 16 Aug 2023 15:41:36 -0000
|Read Time: 0 minutes
Summary
Dell PowerEdge R7615 with 4th Generation AMD EPYC 9374F provides up to a 13 percent performance gain over Dell PowerEdge R7615 with 4th Generation AMD EPYC 9354P for financial trading benchmarks.[1] This Direct to Development (DfD) document looks at CPU benchmarks for three R7615 32-core based CPU configurations and highlights key features that enable businesses enterprises to host different workloads.
Dell PowerEdge R7615
Dell PowerEdge R7615 is a 2U, single-socket rack server. It is designed to be the best investment per dollar for your data center. This server provides performance, and flexible low-latency storage options in an air or Direct Liquid Cooling (DLC) configuration by using an AMD EPYC 4th generation processor to deliver up to 50% more core count per single socket platform in an innovative air-cooled chassis. It delivers breakthrough innovation for traditional and emerging workloads, including software-defined storage, data analytics, and virtualization, using the latest performance and density.
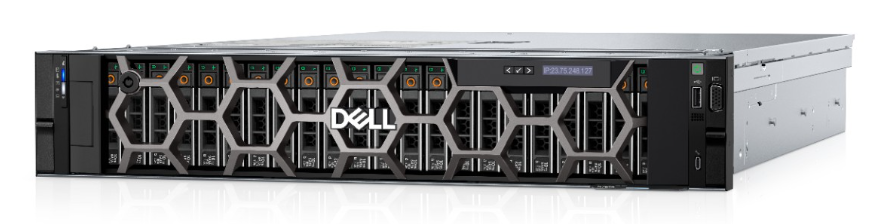
Figure 1. Side angle of the extremely scalable R7615
4th Generation AMD EPYC processors
PowerEdge R7615 is the latest single socket AMD server supporting 4th Generation AMD EPYC 9004 Series processors, the latest generation of the AMD64 System-on-Chip (SoC) processor family. It is based on the Zen 4 microarchitecture introduced in 2022, supporting up to 128 cores (256 threads) and 12 memory channels per socket, a 50% increase over the previous generation. This series includes three different CPU(s) with 32 cores:
Processor | CPU Cores | Threads | Max. Boost Clock | All core boost speed | Base clock | L3 Cache | Default TDP |
AMD EPYC 9374F | 32 | 64 | Up to 4.3GHz | 4.1GHz | 3.85GHz | 256MB | 320W |
AMD EPYC 9354P | 32 | 64 | Up to 3.8GHz | 3.75GHz | 3.25GHz | 256MB | 280W |
AMD EPYC 9334 | 32 | 64 | Up to 3.9GHz | 3.85GHz | 2.7GHz | 128MB | 210W |
The Base Clock, also known as Base Frequency, refers to the minimum operational clock speed of an AMD processor's cores when running under normal conditions. It serves as the foundational clock speed for the processor's overall performance. During tasks that do not require intense processing power, the processor operates at or around this speed, conserving energy and minimizing heat generation.
The Max Boost Clock, often called Max Turbo Frequency or Max Turbo Boost, signifies the upper limit of a processor's clock speed. This clock speed is achieved when specific cores of the AMD processor dynamically increase their frequency to deliver peak performance. The Max Boost Clock is typically applied to a subset of cores and is triggered when the workload demands require a burst of processing power, such as for gaming, video editing, financial trading, and other intensive applications.
The All-Core Boost Speed refers to the clock speed that all cores of an AMD processor can achieve simultaneously when under load. Unlike the Max Boost Clock, which is applicable to only a select number of cores, the All-Core Boost Speed ensures that all cores are operating at an elevated clock speed for optimized multi-threaded performance. This feature is particularly advantageous for tasks that rely heavily on parallel processing, such as rendering, simulations, and content creation.
AMD EPYC 9374F is the frequency/core optimized offering which provides up to a 13 percent increase in all core boost speed over AMD EPYC 9354P, the basic 32 core 1-socket offering. The series also includes AMD EPYC 9334 which has half the L3 Cache but offers over 52 percent drop in Default TDP over AMD EPYC 9374F, making it the most energy efficient of the three CPUs.
Performance data
We captured four benchmarks:
- Sockperf is a network benchmarking tool designed to measure network latency and throughput performance using the Socket Direct Protocol (SDP) for high-performance computing clusters and data centers.
- The QuantLib benchmark is a software library used in quantitative finance and derivatives pricing for modeling and analyzing financial instruments, providing tools for pricing, risk management, and quantitative research. It is widely used by financial professionals and institutions for accurate and efficient financial calculations.
- High Performance Conjugate Gradient measures the computational efficiency of solving a sparse linear system using conjugate gradient methods, providing insights into HPC system performance and optimization. It complements the traditional HPL benchmark, reflecting real-world application characteristics.
- The dav1d benchmark is a performance testing tool used to assess the decoding speed and efficiency of the AV1 video codec, helping to evaluate its real-time playback capabilities and effectiveness in video streaming applications. It aids in optimizing AV1 codec implementations for improved video compression and playback performance.
To compare performance across three R7615 4th Generation AMD EPYC processors, let us first consider the Sockperf benchmark. This benchmark reports throughput in terms of messages per second, the speed at which queries are processed and data is retrieved or stored. It also reports latency overload in usec, measuring the system's response time (latency) under different load conditions.
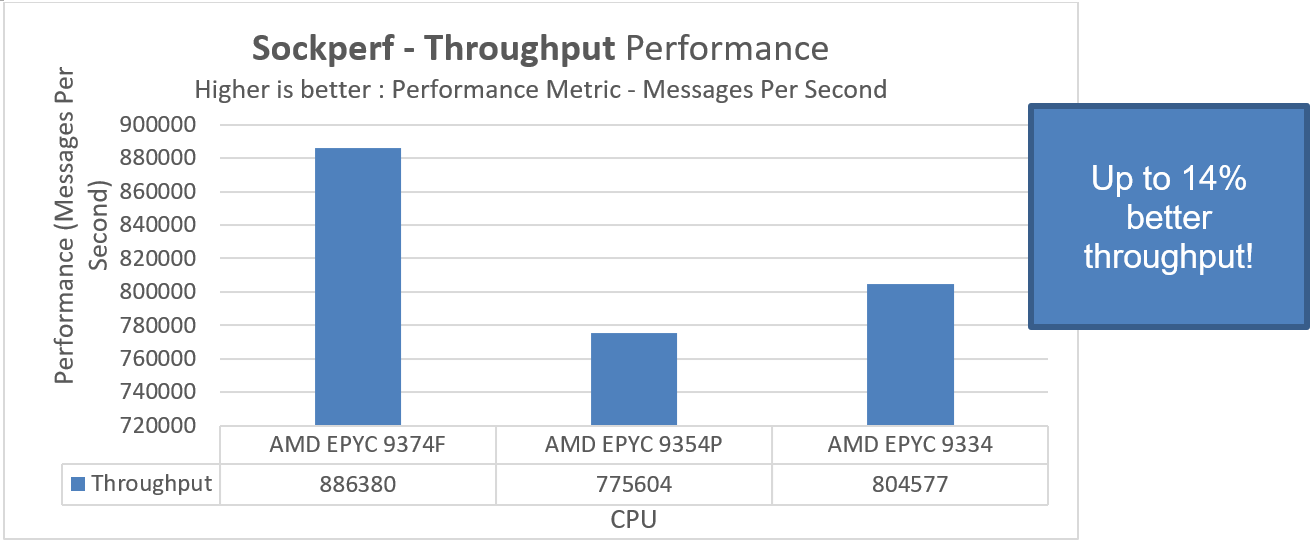
Figure 1. Three CPU comparison demonstrating Throughput performance using the Sockperf benchmark
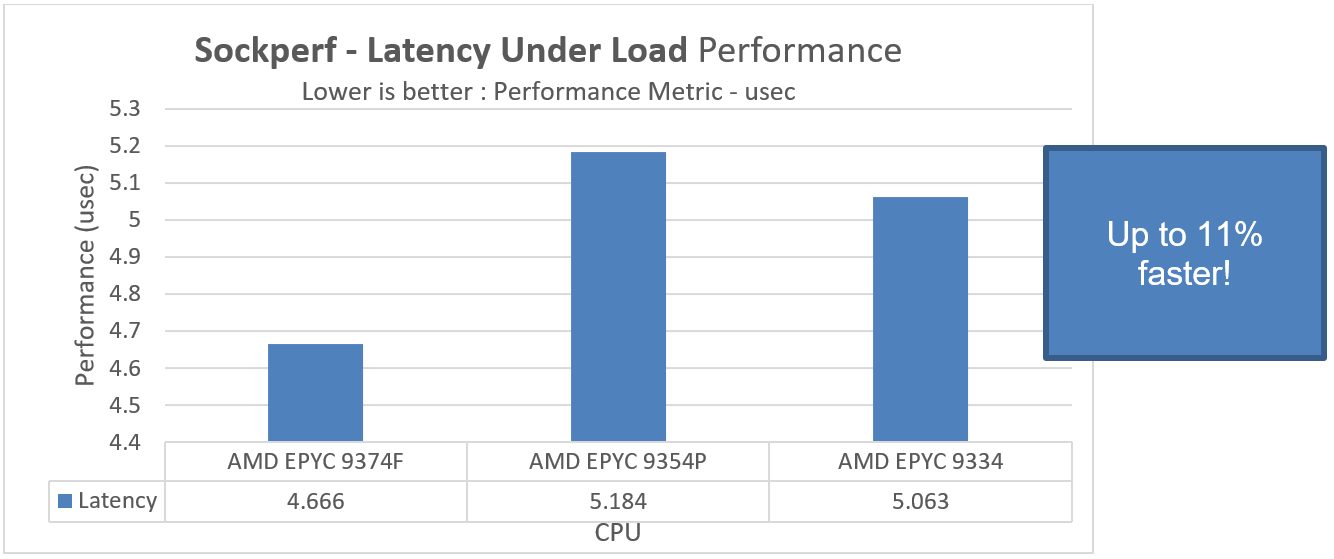
Figure 2. CPU comparison showing Latency under Load performance using the Sockperf benchmark
In PowerEdge R7615 with AMD EPYC 9374F, we see up to 14 percent better throughput performance and an 11 percent drop-in time taken for the Latency Under Load subtest to complete using the Sockperf benchmark over AMD EPYC 9354P.
We also report dav1d results in Frames per second. This test measures the time taken to decode AV1 video content and QuantLib results in MFLOPS, a benchmark for quantitative finance for modeling, trading, and risk management scenarios.
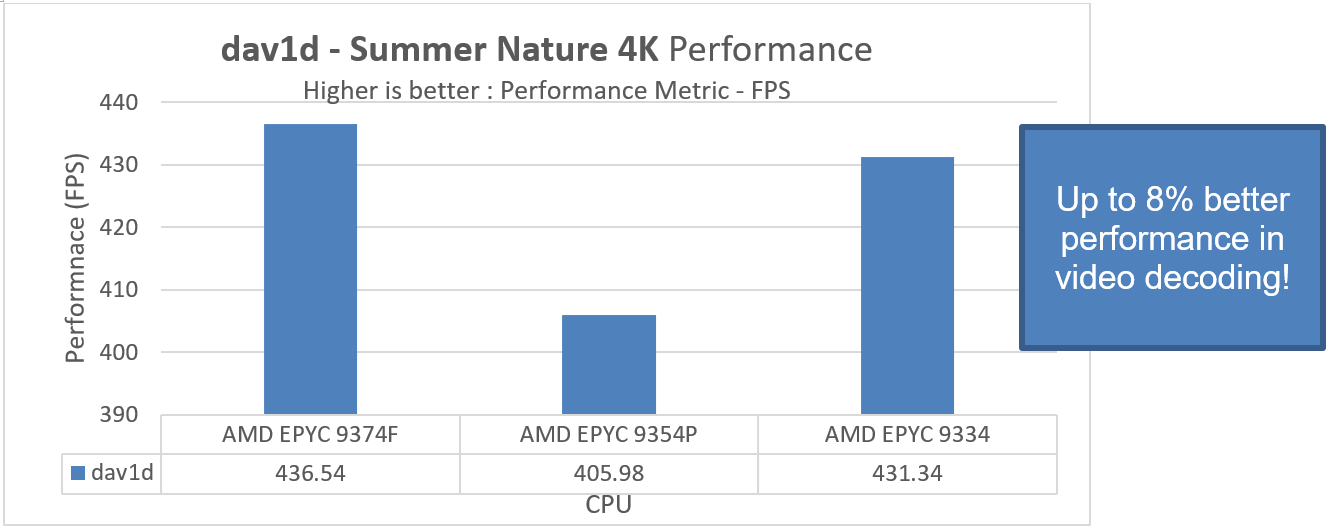
Figure 3. A three CPU comparison demonstrating dav1d performance
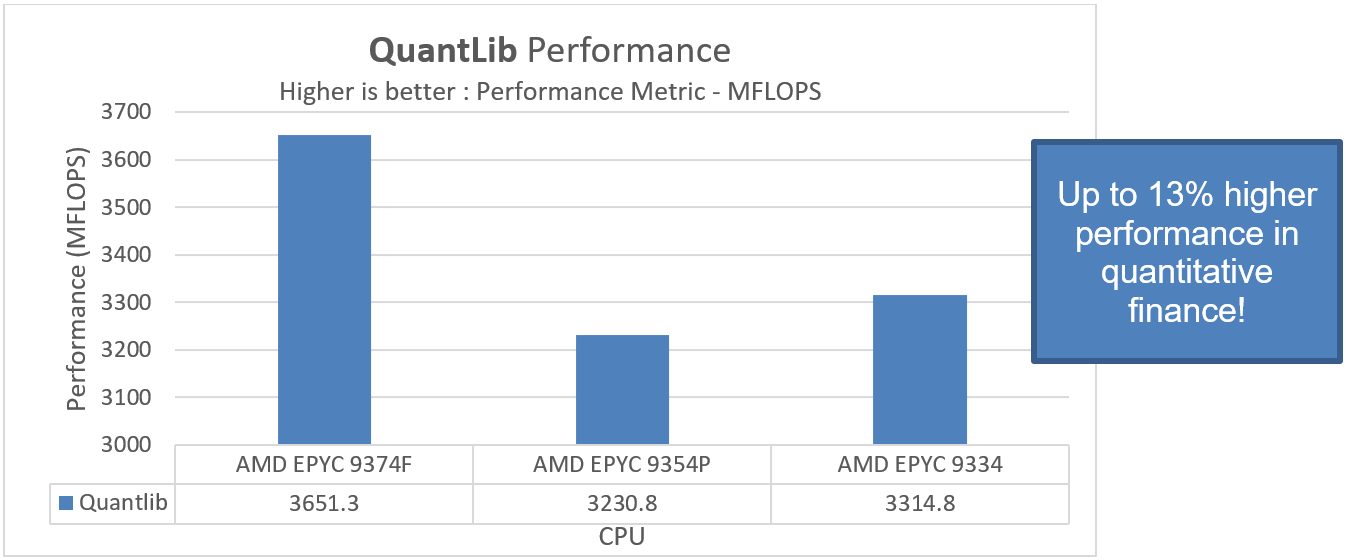
Figure 4. A three CPU comparison demonstrating performance using the QuantLib benchmark
Performance in PowerEdge R7615 with AMD EPYC 9374F is better for the dav1d and QuantLib benchmarks than for the other tested configurations. We find an up to 8 percent performance uptake for video decoding and an additional 13 percent better performance for financial modelling and trading workloads in Dell Technologies PowerEdge R7615 with the frequency optimized AMD EPYC 9374F.
Conclusion
Some workloads benefit from more cores and some benefit from higher frequency. Here we have shown examples of workloads that take advantage of the higher boost frequencies.
Like most industries, the financial trading industry continues to evolve. Firms are pushing workloads harder and with larger datasets, all while expecting immediate or real-time results. These organizations must be confident that they are investing in the right platforms to support computational requirements. With PowerEdge R7615 with AMD EPYC 9374F, Dell Technologies delivers the systems to address the current and expanding needs for high-performance quantitative trading modelling and risk management scenarios.
References
- Dell PowerEdge R7615 Spec Sheet
- AMD EPYC™ 9374F Processors | AMD
- DDR5 Memory Bandwidth for Next-Generation PowerEdge Servers Featuring 4th Gen AMD EPYC Processors | Dell Technologies Info Hub
[1] Tests were performed in August 2023 at the Solutions and Performance Analysis Lab at Dell Technologies.

Save Time, Rack Space, and Money—5:1 Server Consolidation Made Possible with the Latest AMD EPYC Processors
Thu, 20 Apr 2023 17:41:37 -0000
|Read Time: 0 minutes
Summary
The latest Dell PowerEdge servers with AMD EPYC 4th Generation processors, each with up to 96 cores, deliver exceptional value to our customers. The large number of cores coupled with the high-speed DDR5 memory and very high-speed PCIe Gen5 devices makes for servers that can run almost any workload with ease. These servers are especially well suited for virtualization workloads. These unprecedented performance enhancements enabled Dell Technologies to achieve multiple virtualization world records. The cluster-level benchmarks for virtualized workloads are an excellent example of the performance and power-performance world record gains that are achievable.
Running a mixture of architectures in your data center can be cause for some concern—especially if you are looking to upgrade to the latest AMD servers and you are currently running the workloads on legacy Intel® based servers. Even with the greatest level of planning, there is always the fear that some unexpected variable might turn everything upside down during the migration process. Now, there is a new tool for your toolbox to make such migrations easier. The VMware Architecture Migration Tool1 is a PowerShell script that uses VMware PowerCLI to eliminate the guesswork and complexity involved in migrating a virtual machine from one hardware architecture to another.
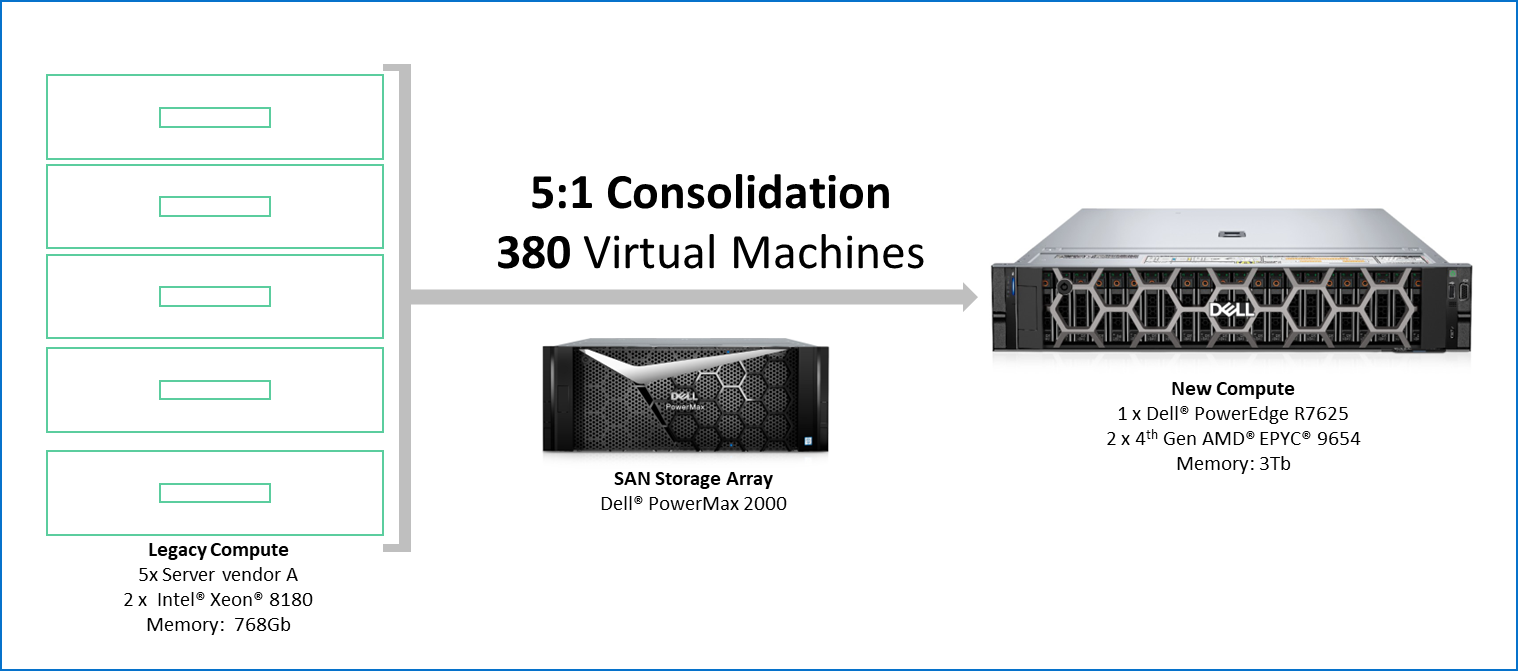
To fully test the tool, Dell ran a full migration scenario. We were able to consolidate 380 VMs running on five legacy Intel platform servers into one Dell PowerEdge R7625 with AMD EPYC 4th Gen processors. We describe our testing in more detail later in this paper.
Why migrate?
In today’s IT departments, workloads are always evolving. There is increasing pressure to support new workloads while keeping existing workloads to support existing business needs—all while also trying to reduce costs and meet corporate goals.
The latest technology tends to bring multiple advantages, driving the need to upgrade. Some of these advantages are:
- Higher performance
The latest Dell PowerEdge servers with 4th Gen AMD EPYC processors have class-leading performance with up to 121 percent higher scores than prior generations.2
- Better efficiency
The Dell PowerEdge servers with 4th Gen AMD EPYC processors are some of the first to achieve the EPEAT silver rating, indicating the highest level of environmental responsibility and efficiency. Dell has achieved 159 percent higher performance per kilowatt on the VMmark benchmark with the R7625 compared to the prior-generation model server.3
- More security
With Dell’s Cyber Resilient Architecture and AMD’s Infinity Guard, the PowerEdge servers with 4th Gen AMD EPYC processors offer top-class security to ensure that your data and infrastructure are protected.4
- Workload optimizations
The 4th Generation AMD EPYC processors have several optimizations, such as support for AVX-512, INT8, and BFLOAT16. The processors can deliver exceptional performance for workloads that can take advantage of such optimizations.
VMware Architecture Migration Tool
The VMware Architecture Migration Tool (VAMT) was developed jointly by AMD and VMware to automate the migration of legacy VMs from Intel architecture to AMD architecture, with the goal of delivering a better user experience and better business value. Freely available on GitHub, VAMT offers several key features:
- Architecture agnostic and open source
- Fully automated cold migration
- VM success validation
- Process throttling
- Change window support
- Email and syslog support
- Audit trail
- Rollback
The tool streamlines and simplifies the migration process in a trustworthy fashion.
Benchmarking
Dell leveraged the VAMT tool and the VMmark benchmark to achieve some remarkable consolidation on the PowerEdge R7625.
The VMmark benchmark allowed us to set up a workload in the form of tiles within each hardware cluster. Each tile consisted of 19 different VMs running a workload internally. The benchmark was deployed across five legacy Intel based servers and eventually migrated to a single AMD based PowerEdge server. A Dell PowerMax 2000 SAN was used for data storage. The following table shows the configuration details:
Table 1. Configuration of source and target servers
| Component/specification | Source | Target |
|---|---|---|
Number of servers | 5 | 1 |
Processor | Intel 8180 | AMD EPYC 9654 |
Cores per server | 56 | 192 |
Memory | 768 GB | 3 TB |
Tiles | 4 | 20 |
VMs per server | 76 | 380 |
Server | Server vendor A | Dell PowerEdge R7625 |
Storage | PowerMax 2000; 30 TB spread across 6 LUNs | |
Network | 32 GB FC network for storage, 25 GbE for data network on VMs through a 4-way splitter, 100 Gb switch | |
We were able to run four tiles per legacy server for a total of 380 VMs. The VAMT was then used to migrate the VMs across to the target PowerEdge server.
The tool completed a cold migration of all 380 VMs to the target server in 57 minutes!
Achieving value
The Dell PowerEdge R7625 with 4th Gen AMD EPYC processors delivers significant technology advancements that can deliver value in any virtualized deployment. Consolidating from five servers to a single server is an example of the extent of savings possible. This kind of consolidation allows for significant license cost savings and fewer hours on system management. Decommissioning the five legacy systems also reduces power draw and operational costs by as much 64 percent,5 even while also running workloads on the latest architecture with security features like Secure Memory Encryption (SME) and Secure Encrypted Virtualization (SEV). AMD SEV helps safeguard privacy and integrity by encrypting each virtual machine.
1 https://github.com/vmware-samples/vmware-architecture-migration-tool
2 Based on Dell analysis of submitted SPECFPRate score of 1410 achieved on a Dell PowerEdge R7625 with AMD EPYC 9654s compared to the previous high score of 636 on a Dell PowerEdge R7525 with AMD EPYC 7763 processors as of 11/3/2022. Actual performance might vary.
3 Based on Dell analysis of published VMmark Server Power-Performance score of 21.0179@21 tiles achieved on a Dell PowerEdge R7615 cluster with AMD EPYC 9654P processors compared to the score of 8.1263@12 tiles achieved on a Dell PowerEdge R7515 cluster with the AMD EPYC 7763 processors as of 4/13/2023. Actual performance might vary.
5 Based on Dell internal analysis comparing the total CPU TDP of 2,050 W from five dual-socket servers with the Intel Xeon 8180 processors compared to the total CPU TDP of 720 W from a single dual-socket Dell PowerEdge server with AMD EPYC 9654 processors as of 4/13/2023. Actual performance might vary.

VDI on Dell PowerEdge Infrastructure with 4th Generation AMD EPYC Processors
Fri, 14 Apr 2023 15:17:26 -0000
|Read Time: 0 minutes
Summary
Dell PowerEdge server improvements for VDI
The all-new Dell PowerEdge R7625 with AMD EPYC 4th Gen processors delivers up to 50 percent higher CPU density in terms of cores per server. This platform is based on the latest technology from AMD to provide better performance and improved scalability for a variety of workloads, including VDI.
Some of the platform enhancements that are especially relevant to VDI workloads are:
- CPU—Up to 50 percent more cores with up to 96 cores per socket, allowing VDI virtual machine (VM) per-node density increases and better VDI VM performance.
- Memory—33 percent more memory channels with 50 percent faster memory, allowing greater memory capacity and performance to support richer VDI desktop VM configurations for applications that require increased memory.
- I/O—PCIe Gen5 with twice the bandwidth, allowing for high-speed and low-latency NVMe drives, NICs, and GPU accelerators.
- Smart Cooling Technology—Advanced thermal designs and options, such as streamlined airflow pathways within the server, liquid cooling options, and so on, to keep CPUs, high-performance NICs, and GPUs cool and performing optimally.
- Boot Optimized Storage—The 3rd generation Boot Optimized Storage Solution (BOSS-N1), which has been enhanced with full hot-plug support for enterprise class M.2 NVMe SSDs. Additionally, the design is integrated into the server, eliminating the need to dedicate a PCIe slot and giving customers more flexibility with their choice of I/O slots and peripherals.
Benchmarking for VDI
Login VSI by Login Consultants is the industry-standard tool for testing VDI environments and server-based computing (RDSH environments). It installs a standard collection of desktop application software (for example, Microsoft Office, Adobe Acrobat Reader) on each VDI desktop. It then uses launcher systems to connect a specified number of users to available desktops within the environment. Once each user is connected, the workload is started through a login script, which starts the test script once the user environment is configured by the login script. Each launcher system can launch connections to several ‘target’ machines (VDI desktops).
When designing a desktop virtualization solution, understanding user workloads and profiles is key to understanding the density numbers that the solution can support. At Dell Technologies, we use several Login VSI workload/profile levels, each of which is bound by specific metrics and capabilities, with two targeted at graphics-intensive use cases.
To understand the improvements that we can expect to see with the latest generation of servers compared with the prior-generation servers, we ran the same Login VSI benchmark against both servers. We used a Knowledge Worker profile consisting of 5 to 9 applications and 360p video. The following table shows the user VM configuration:
Table 1. Login VSI Knowledge Worker profile
Workload | VM profiles | ||||
vCPUs | RAM | RAM reserved | Desktop video resolution | Operating system | |
Knowledge Worker | 2 | 4 GB | 2 GB | 1920 x 1080 | Windows 10 Enterprise 64-bit |
The following table outlines the test configuration of the hardware and software components:
Table 2. Hardware and software configuration
Component | Configuration |
Compute host hardware |
|
Management host hardware |
|
Storage | PERC with 6x mixed use SSDs (RAID 10) |
Network | Dell S5248-ON switch |
Broker | VMware Horizon 8 2209 |
Hypervisor | VMware ESXi 8.0.0 |
SQL | Microsoft SQL Server 2019 |
Desktop operating system | Microsoft Windows 10 Enterprise 64-bit, 22h2 version |
Office | Microsoft Office 365 |
Profile management | FSLogix |
Management operating system | Windows Server 2022 |
Login VSI | Version 4.1.40.1 |
Results summary—R7525 compared with R7625
Comparing the 32 core processors of the 4th Gen AMD EPYC to the 3rd Gen AMD EPYC using Login VSI showed approximately 30 percent improvement in VM density. At the same time, we observed approximately 11 percent improvement in response time.
The following table outlines the test results:
Table 3. Key results of Login VSI testing
Server | Density per host (higher is better) | User experience—VSI base (lower is better) |
PowerEdge R7525 | 265 VMs | 896 milliseconds |
PowerEdge R7625 | 345 VMs | 794 milliseconds |
Conclusion
With up to 96 cores per socket and significant increases in memory bandwidth, Dell PowerEdge servers with 4th Gen AMD EPYC processors continue to provide best-in-class features and specifications to satisfy the most demanding workloads. For VDI workloads, with the same number of cores, we observed a 30 percent increase in density with more than 11 percent reduction in response time.

DDR5 Memory Bandwidth for Next-Generation PowerEdge Servers Featuring 4th Gen AMD EPYC Processors
Wed, 03 May 2023 15:49:23 -0000
|Read Time: 0 minutes
Summary
Dell Technologies has announced some exciting new servers featuring the latest 4th Gen AMD EPYC processors. These servers come in 1- and 2-socket versions in 1U and 2U form factors. Each socket supports up to 12 DIMMs at speeds of up to 4,800 MT/s. This document compares the memory bandwidth readings observed with these new servers against previous-generation servers running 3rd Gen AMD EPYC processors.
4th Gen AMD EPYC memory architecture
The 4th Gen AMD EPYC processors are the first AMD x86 server processors to support DDR5 memory. The CPUs themselves still have a chiplet design with a central I/O chiplet surrounded by compute chiplets. The memory runs at speeds of up to 4,800 MT/s, which is 50 percent faster than the 3,200 MT/s that the previous 3rd Gen AMD EPYC processors supported.
One other significant difference is in the number of populated slots. The 3rd Gen AMD EPYC processors supported up to 16 DIMMs per socket in a 2 DIMMs per channel configuration or 8 DIMMs per socket in a 1 DIMM per channel configuration. The 2 DIMMs per channel configuration supported a maximum speed of 2,933 MT/s.
Memory bandwidth test
To quantify the impact of this increase in memory support, we performed two studies.1 The first study (see Figure 1) measured memory bandwidth determined by the number of DIMMs per CPU populated. To measure the memory bandwidth, we used the STREAM Triad benchmark. STREAM Triad is a synthetic benchmark that is designed to measure sustainable memory bandwidth (in MB/s) and a corresponding computation rate for four simple vector kernels. Of all the vector kernels, Triad is the most complex scenario. We ran the benchmark on the following systems:
- Previous-generation Dell PowerEdge R7525 powered by AMD’s 3rd Gen EPYC CPUs populated with up to 16 DDR4 3,200 MT/s DIMMs per channel
- Latest-generation Dell PowerEdge R7625 powered by AMD’s 3rd Gen EPYC CPUs populated with up to 12 DDR5 4,800 MT/s DIMMs per socket
We used default BIOS configurations for this test.
The following figures show the system aggregate memory bandwidth across two CPUs:
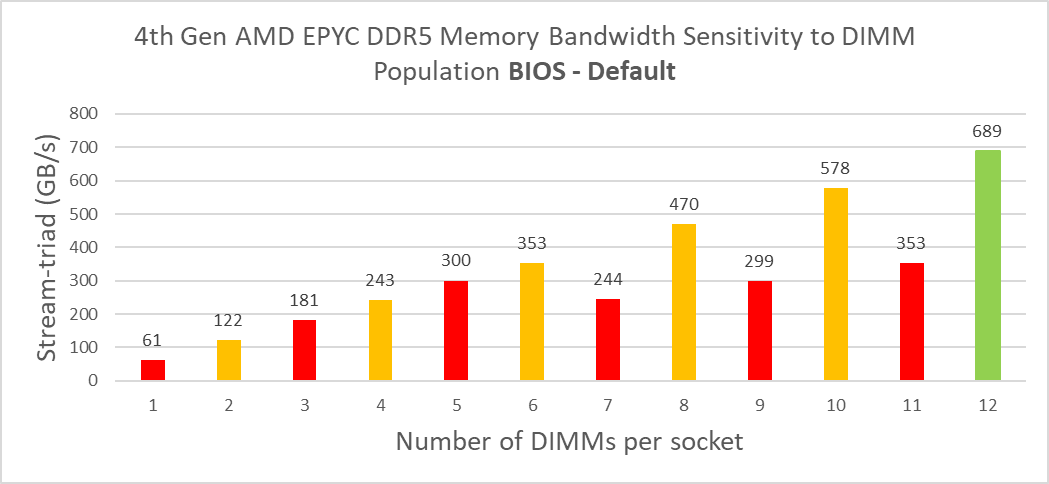
Figure 1. System aggregate memory bandwidth trends with DIMM population for 4th Gen AMD EPYC processor-based PowerEdge servers with default BIOS settings
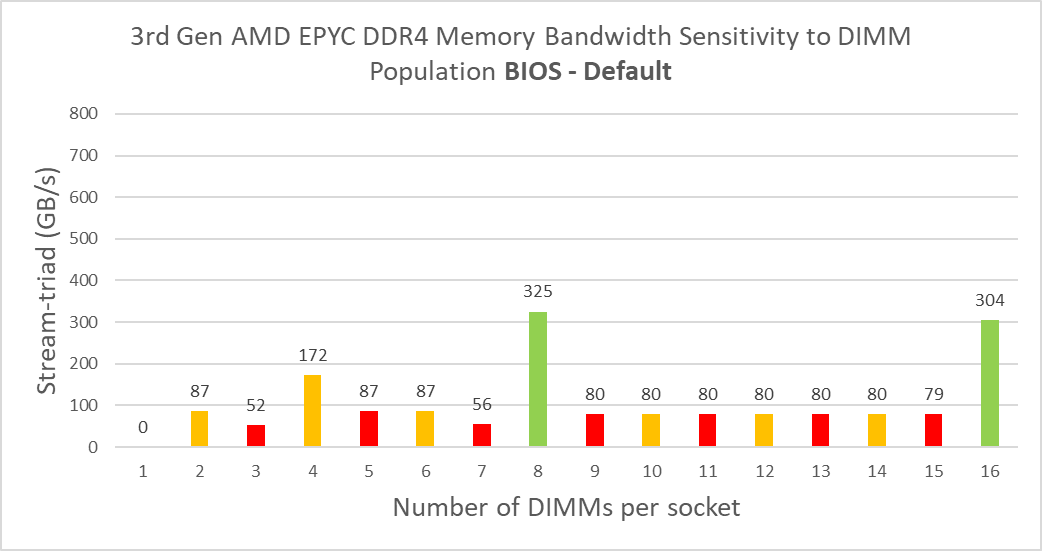
Figure 2. System aggregate memory bandwidth trends with DIMM population for 3rd Gen AMD EPYC processor-based PowerEdge servers with default BIOS settings
Consider that a fully balanced configuration requires all DIMM channels to be populated—that is 8 DIMMs for the 3rd Gen and 12 DIMMs for the 4th Gen. Given these differences, it is challenging to do a direct comparison. However, if we compare the numbers for a balanced configuration with 1 DIMM per channel, we see a 112 percent increase in bandwidth. With just 8 channels populated in both cases, we see a 45 percent increase in bandwidth. Despite this not being a balanced configuration, we still see a significant performance increase at this point.
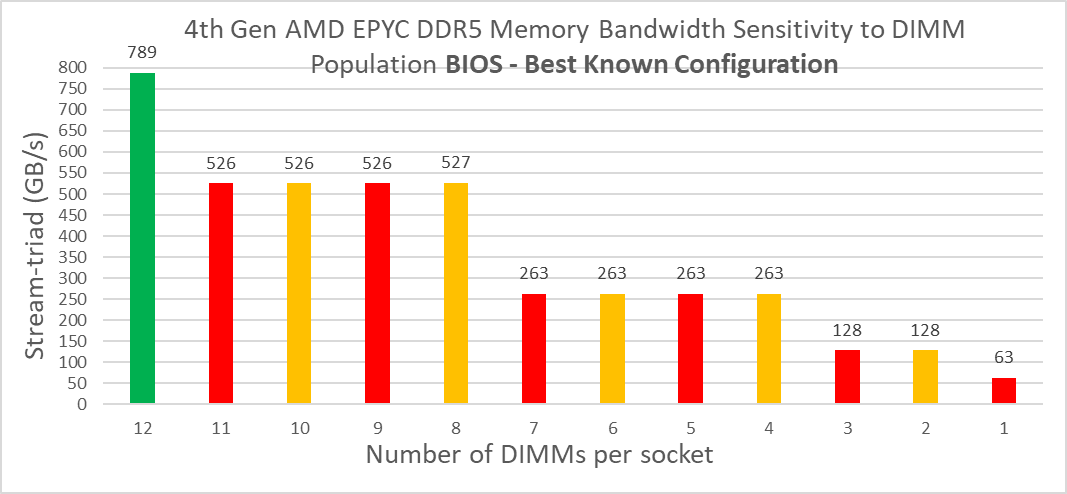
Figure 3. System aggregate memory bandwidth trends with DIMM population for 4th Gen AMD EPYC processor-based PowerEdge servers with tuned BIOS settings
We collected a second series of datapoints on the R7625 with BIOS settings adjusted for best memory performance. This included setting the NPS setting to NPS4 and disabling CCX as NUMA. With these settings, we see that the maximum bandwidth of the R7625 further increases by another 14.5 percent to a class-leading 789 GB/s.
Conclusion
With up to 96 cores per socket and significant increases in memory bandwidth, Dell PowerEdge servers with 4th Gen AMD EPYC processors continue to provide best-in-class features and specifications to satisfy the most demanding workloads.
1 Tests were performed in January 2023 at the Solutions and Performance Analysis Lab at Dell Technologies.

Understanding the Value of AMDs Socket to Socket Infinity Fabric
Tue, 17 Jan 2023 00:43:22 -0000
|Read Time: 0 minutes
Summary
AMD socket-to-socket Infinity Fabric increases CPU-to-CPU transactional speeds by allowing multiple sockets to communicate directly to one another through these dedicated lanes. This DfD will explain what the socket-to-socket Infinity Fabric interconnect is, how it functions and provides value, as well as how users can gain additional value by dedicating one of the x16 lanes to be used as a PCIe bus for NVMe or GPU use.
Introduction
Prior to socket-to-socket Infinity Fabric (IF) interconnect, CPU-to-CPU communications generally took place on the HyperTransport (HT) bus for AMD platforms. Using this pathway for multi-socket servers worked well during the lifespan of HT, but developing technologies pushed for the development of a solution that would increase data transfer speeds, as well as allow for combo links.
AMD released socket-to-socket Infinity Fabric (also known as xGMI) to resolve these bottlenecks. Having dedicated IF links for direct CPU-to- CPU communications allowed for greater data-transfer speeds, so multi-socket server users could do more work in the same amount of time as before.
How Socket-to-Socket Infinity Fabric Works
IF is the external socket-to-socket interface for 2-socket servers. The architecture used for IF links is a combo of serializer/deserializer (SERDES) that can be both PCIe and xGMI, allowing for sixteen lanes per link and a lot of platform flexibility. xGMI2 is the current generation available and it has speeds that reach up to 18Gbps; which is faster than the PCIe Gen4 speed of 16Gbps. Two CPUs can be supported by these IF links. Each IF lane connects from one CPU IO die to the next, and they are interwoven in a similar fashion, directly connecting the CPUs to one- another. Most dual-socket servers have three to four IF links dedicated for CPU connections. Figure 1 depicts a high- level illustration of how socket to socket IF links connect across CPUs.
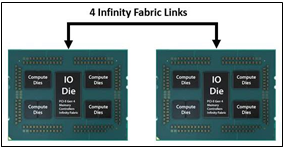
Figure 1 – 4 socket to socket IF links connect two CPUs
The Value of Infinity Fabric Interconnect
Socket to socket IF interconnect creates several advantages for PowerEdge customers:
- Dedicated IF lanes are routed directly from one CPU to the other CPU, ensuring inter-socket communications travel the shortest distance possible
- xGMI2 speeds (18Gbps) exceed the speeds of PCIe Gen4, allowing for extremely fast inter-socket data transfer speeds
Furthermore, if customers require additional PCIe lanes for peripheral components, such as NVMe or GPU drives, one of the four IF links are a cable with a connector that can be repurposed as a PCIe lane. AMD’s highly optimized and flexible link topologies enable sixteen lanes per socket of Infinity Fabric to be repurposed. This means that 2S AMD servers, such as the PowerEdge R7525, have thirty-two additional lanes giving a total of 160 PCIe lanes for peripherals. Figure 2 below illustrates what this would look like:
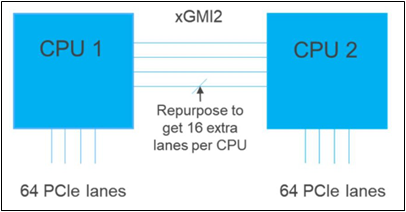
Figure 2 – Diagram showing additional PCIe lanes available in a 2S configuration
Conclusion
AMDs socket-to-socket Infinity Fabric interconnect replaced the former HyperTransport interconnect in order to allow massive amounts of data to travel fast enough to avoid speed bottlenecks. Furthermore, customers needing additional PCIe lanes can repurpose one of the four IF links for peripheral support. These advantages allow AMD PowerEdge servers, such as the R7525, to meet our server customer needs.

Understanding Confidential Computing with Trusted Execution Environments and Trusted Computing Base models
Tue, 17 Jan 2023 00:35:08 -0000
|Read Time: 0 minutes
Summary
As the value of data increases, it becomes essential to protect data in- use from unauthorized access. Confidential Computing provides various levels of protection options to mitigate different kinds of threat vectors.
Introduction
Data is the new oil. As the value of data increases, it becomes increasingly important to protect data in-use to perform computations. Data in use is often stored in the clear in memory (DRAM) and accessed via unencrypted memory buses. Whether data in use is a machine learning data set or relates to keeping a secret in memory, data in-use can be vulnerable to threats vectors that can snoop on the contents of memory or the access bus. Data- in-use protection is necessary to secure computations that are increasingly operating on large data sets in memory. Additionally, code executing on the data must be trusted, tamper-free with facilities to separate trusted and non-trusted code execution environments with respect to data in-use.
Trusted Execution Environments and Trusted Computing Base models
With per country regulation requirements on data confidentiality increasing, data generators and users need secure TEEs (Trusted Executions Environments) to satisfy data privacy and protection regulations. Hosting and Infrastructure providers must enable trusted execution environment to guarantee data confidentiality of client data. This requires that entities outside the trust boundary should not be able to access the data in-use
To mitigate against increasing threat vectors combined with usage models that range from multi-tenant environments to edge deployments, trust boundaries need to shrink. Data owners and clients should prefer to keep a small TCB (Trusted Computing Base) to minimize attack coordinates and data misuse by untrusted elements. They should look closely at what TCB levels they can trust for their usage model. A TCB level informs the code footprint that can be trusted
While a reduced TCB can be achieved using software techniques, silicon-aided features can greatly aid the creation, separation and protection of TEEs with reduced TCBs. Silicon features are needed to minimize TCB to a Trusted Host Execution Environment, Trusted Virtual Machine Execution environment, and a Trusted Application Execution Environment for new and emerging deployments
Picking an appropriate TCB footprint level
To consider an appropriate TCB footprint level, one should determine if the entity hosting the code and data execution environment can be trusted and has the facility to separate trusted and non- trusted components. For e.g., a data center level TCB can imply a data center administrator is a trusted operator for the data in use. This means the entire data center execution environment is trusted and applications users can employ a data center wide application/workload deployment policy. A Platform/Host level TCB requirement can imply a system administrator is a trusted operator for the data and the code running on the platform and can deploy a trusted Host execution environment for the workloads. A VM level TCB footprint requirement implies a trusted guest machine user for data in use running in a trusted Guest Execution Environment. An App level TCB footprint requirement can imply only the App owner is trusted with data in use access. See Figure 1 for a representation of various TCB footprint levels. If you observe carefully, as TCB footprint shrinks, the application owner has fewer layers of trusted software.
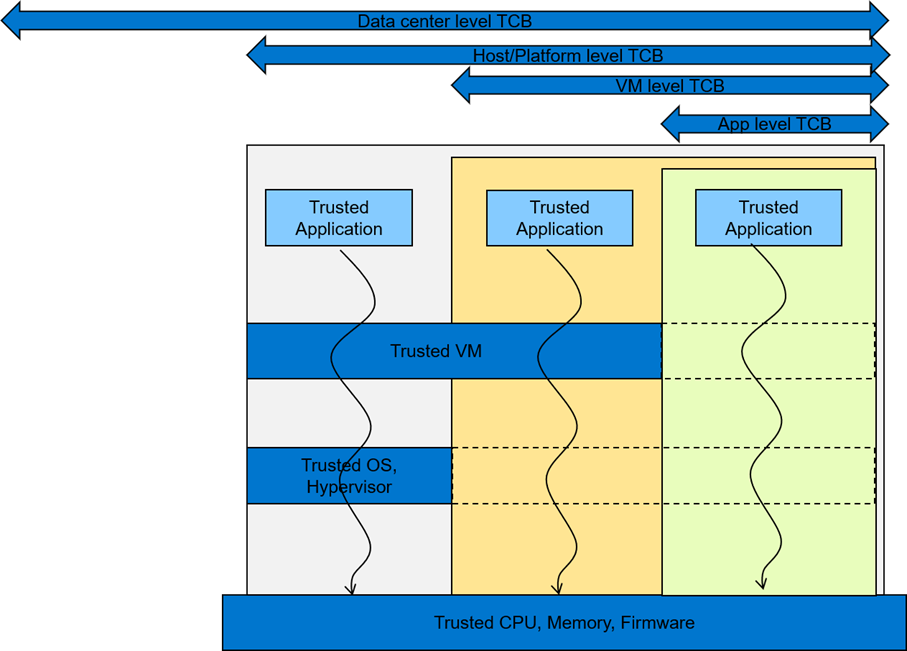
Figure 1 A view of various TCB footprint levels
These levels come with varying degree of usability to application deployments. They have unique advantages and tradeoffs when it comes performance, application mobility, trust granularity and integration with management stacks.
In general, to enable these TEEs, silicon enables memory encryption such that trusted, differentiated and secure memory access is possible for data in use. Data/app owners must be able to independently attest to the integrity of the platform and the TCB levels supported by the underlying infrastructure.
Dell believes in the power of choice when it comes to offering a trusted execution environment with a level of TCB needed to run your applications. Dell’s breadth of technologies including the enhanced cyber resilient architecture that is part of the latest generations of PowerEdge servers enables usages at the edge, core and the cloud.
Conclusion
To maximize protection of data in-use, consideration should be given to the TCB footprint that is appropriate for the use case. Dell EMC PowerEdge servers are loaded with top notch security features to provide maximum protection for your data. In addition, Dell Technologies is pleased to partner with key vendors to support features like SME, SEV-ES, and SGX, etc. with various levels of confidential computing usage models that cater to various Trusted Execution Environments

Efficient Machine Learning Inference on Dell EMC PowerEdge R7525 and R7515 Servers using NVIDIA GPUs
Tue, 17 Jan 2023 00:28:16 -0000
|Read Time: 0 minutes
Summary
Dell EMC™ participated in the MLPerf™ Consortium v0.7 result submissions for machine learning. This DfD presents results for two AMD PowerEdge™ server platforms - the R7515 and R7525. The results show that Dell EMC with AMD processor-based servers when paired with various NVIDIA GPUs offer industry-leading inference performance capability and flexibility required to match the compute requirements for AI workloads.
MLPerf Inference Benchmarks
The MLPerf (https://mlperf.org) Inference is a benchmark suite for measuring how fast Machine Learning (ML) and Deep Learning (DL) systems can process inputs and produce results using a trained model. The benchmarks belong to a very diversified set of ML use cases that are popular in the industry and provide a need for competitive hardware to perform ML-specific tasks. Hence, good performance under these benchmarks signifies a hardware setup that is well optimized for real world ML inferencing use cases. The second iteration of the suite (v0.7) has evolved to represent relevant industry use cases in the datacenter and edge. Users can compare overall system performance in AI use cases of natural language processing, medical imaging, recommendation systems and speech recognition as well as different use cases in computer vision.
MLPerf Inference v0.7
The MLPerf inference benchmark measures how fast a system can perform ML inference using a trained model with new data in a variety of deployment scenarios, see below Table 1 with the list of seven mature models included in the official v0.7 release:
Model | Reference Application | Dataset |
resnet50-v1.5 | vision / classification and detection | ImageNet (224x224) |
ssd-mobilenet 300x300 | vision / classification and detection | COCO (300x300) |
ssd-resnet34 1200x1200 | vision / classification and detection | COCO (1200x1200) |
bert | language | squad-1.1 |
dlrm | recommendation | Criteo Terabyte |
3d-unet | vision/medical imaging | BraTS 2019 |
rnnt | speech recognition | OpenSLR LibriSpeech Corpus |
The above models serve in a variety of critical inference applications or use cases known as “scenarios”. Each scenario requires different metrics, demonstrating production environment performance in real practice. MLPerf Inference consists of four evaluation scenarios: single-stream, multi-stream, server, and offline. See Table 2 below:
Scenario | Sample Use Case | Metrics |
SingleStream | Cell phone augmented reality | Latency in milliseconds |
MultiStream | Multiple camera driving assistance | Number of streams |
Server | Translation site | QPS |
Offline | Photo sorting | Inputs/second |
Executing Inference Workloads on Dell EMC PowerEdge
The PowerEdge™ R7515 and R7525 coupled with NVIDIA GPus were chosen for inference performance benchmarking because they support the precisions and capabilities required for demanding nference workloads.
Dell EMC PowerEdge™ R7515
The Dell EMC PowerEdge R7515 is a 2U, AMD-powered server that supports a single 2nd generation AMD EPYC (ROME) processor with up to 64 cores in a single socket. With 8x memory channels, it also features 16x memory module slots for a potential of 2TB using 128GB memory modules in all 16 slots. Also supported are 3-Dimensional Stack DIMMs, or 3-DS DIMMs.
SATA, SAS and NVMe drives are supported on this chassis. There are some storage options to choose from depending on the workload. Chassis configurations include:
- 8 x 3.5-inch hot plug SATA/SAS drives (HDD)
- 12 x 3.5-inch hot plug SATA/SAS drives (HDD)
- 24 x 2.5-inch hot plug SATA/SAS/NVMe drives
The R7515 is a general-purpose platform capable of handling demanding workloads and applications, such as data warehouses, ecommerce, databases, and high-performance computing (HPC). Also, the server provides extraordinary storage capacity options, making it well-suited for data-intensive applications without sacrificing I/O performance. The R7515 benchmark configuration used in testing can be seen in Table 3.
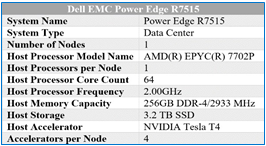
Table 3 – R7515 benchmarking configuration
Dell EMC PowerEdge™ R7525
The The Dell EMC PowerEdge R7525 is a 2-socket, 2U rack-based server that is designed to run complex workloads using highly scalable memory, I/O capacity, and network options. The system is based on the 2nd Gen AMD EPYC processor (up to 64 cores), has up to 32 DIMMs, PCI Express (PCIe) 4.0-enabled expansion slots, and supports up to three double wide 300W or six single wide 75W accelerators.
SATA, SAS and NVMe drives are supported on this chassis. There are some storage options to choose from depending on the workload. Storage configurations include:
- Front Bays
- Up to 24 x 2.5” NVMe
- Up to 16 x 2.5” SAS/SATA (SSD/HDD) and NVMe
- Up to 12 x 3.5” SAS/SATA (HDD)
- Up to 2 x 2.5” SAS/SATA/NVMe (HDD/SSD)
- Rear Bays
- Up to 2 x 2.5” SAS/SATA/NVMe (HDD/SSD)
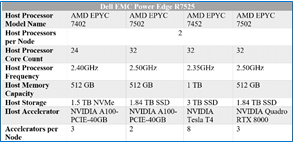
Table 4 – R7525 benchmarking configuration
The R7525 is a highly adaptable and powerful platform capable of handling a variety of demanding workloads while also providing flexibility. The R7525 benchmark configuration used in testing can be seen in Table 4.
NVIDIA Technologies Used for Efficient Inference
NVIDIA® Tesla T4
The NVIDIA Tesla T4, based on NVIDIA’s Turing™ architecture is one of the most widely used AI inference accelerators. The Tesla T4 features NVIDIA Turing Tensor cores which enables it to accelerate all types of neural networks for images, speech, translation, and recommender systems, to name a few. Tesla T4 is supported by a wide variety of precisions and accelerates all major DL & ML frameworks, including TensorFlow, PyTorch, MXNet, Chainer, and Caffe2.
For more details on NVIDIA Tesla T4, please refer to https://www.nvidia.com/en-us/data-center/tesla-t4/
NVIDIA® Quadro RTX8000
NVIDIA® Quadro® RTX™ 8000, powered by the NVIDIA Turing™ architecture and the NVIDIA RTX platform, combines unparalleled performance and memory capacity to deliver the world’s most powerful graphics card solution for professional workflows. With 48 GB of GDDR6 memory, the NVIDIA Quadro RTX 8000 is designed to work with memory intensive workloads that create complex models, build massive architectural datasets and visualize immense data science workloads.
For more details on NVIDIA® Quadro® RTX™ 8000, please refer to https://www.nvidia.com/en-us/design- visualization/quadro/rtx-8000/
NVIDIA® A100-PCIE
The NVIDIA A100 Tensor Core GPU is the flagship product of the NVIDIA data center platform for deep learning, HPC, and data analytics. The platform accelerates over 700 HPC applications and every major deep learning framework. It’s available everywhere, from desktops to servers to cloud services, delivering both dramatic performance gains and cost-saving opportunities.
For more details, please refer to https://www.nvidia.com/en-us/data-center/a100/
NVIDIA Inference Software Stack for GPUs
At its core, NVIDIA TensorRTTM is a C++ library designed to optimize deep learning inference performance on systems which contains NVIDIA GPUs, and supports models that are trained in most of the major deep learning frameworks including, but not limited to, TensorFlow, Caffe, PyTorch, MXNet. After the neural network is trained, TensorRT enables the network to be compressed, optimized and deployed as a runtime without the overhead of a framework. It supports FP32, FP16 and INT8 precisions. To optimize the model, TensorRT builds an inference engine out of the trained model by analyzing the layers of the model and eliminating layers whose output is not used, or combining operations to perform faster calculations. The result of all these optimizations is improved latency, throughput and efficiency. TensorRT is available on NVIDIA NGC.
MLPerf v0.7 Performance Results and Key Takeaways
Figures 1 and 2 below show the inference capabilities of the PowerEdge R7515 and PowerEdge R7525 configured with different NVIDIA GPUs. Each bar graph indicates the relative performance of inference operations completed meeting certain latency constraints. Therefore, the higher the bar graph is, the higher the inference capability of the platform. Details on the different scenarios used in MLPerf inference tests (server and offline) are available at the MLPerf website. Offline scenario represents use cases where inference is done as a batch job (using AI for photo sorting), while server scenario represents an interactive inference operation (translation app). The relative performance of the different servers are plotted below to show the inference capabilities and flexibility that can be achieved using these platforms:
Offline Performance
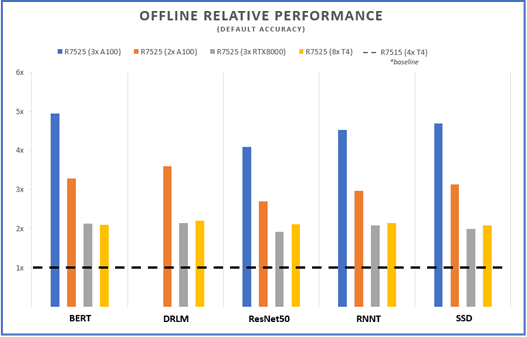
Figure 1 – Offline scenario relative performance for five different benchmarks and four different server configs, using the R7515 (4 xT4) as a baseline
Server Performance
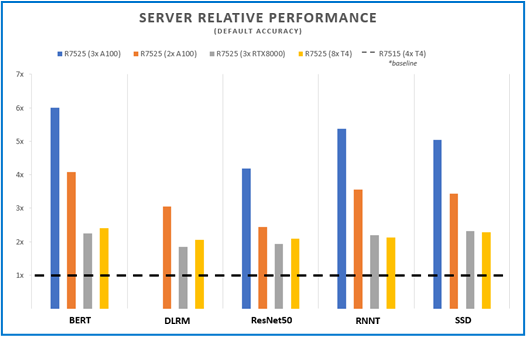
Figure 2 – Server scenario relative performance for five different benchmarks and four different server configs, using the R7515 (4 xT4) as a baseline
The R7515 and R7525 offers configuration flexibility to address inference performance and datacenter requirements around power and costs. Inference applications can be deployed on AMD single socket system without compromising accelerator support, storage and I/O capacities or on double socket systems with configurations that support higher capabilities. Both platforms support PCIe Gen4 links for latest GPU offerings like the A100 and also upcoming Radeon Instinct MI100 GPUs from AMD that are PCIe Gen 4 capable.
The Dell PowerEdge platforms offer a variety of PCIe riser options that enable support for multiple low- profile (up to 8 T4) or up to 3 full height double wide GPU accelerators (RTX or A100). Customers can choose the GPU model and number of GPUs based on the workload requirements and to fit their datacenter power and density needs. Figure 3 shows a relative compare of the GPUs used in the MLPerf study from a performance, power, price and memory point of view. The specs for the different GPUs supported on Dell platforms and server recommendations are covered in previous DfDs (link to the 2 papers)
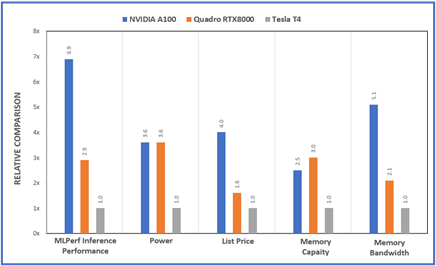
Figure 3 – Relative comparisons between the A100, RTX800 and T4 GPUs for various metrics
Conclusion
As demonstrated by MLPerf performance, Inference workloads executed on Dell EMC PowerEdge R7515 and Dell EMC PowerEdge R7525 performed well in a wide range of benchmark scenarios. . These results can server a guide to help identify the configuration that matches your inference requirements.

Dell Next Generation PowerEdge Servers: Designed for PCIe Gen4 to Deliver Future Ready Bandwidth
Tue, 17 Jan 2023 00:18:59 -0000
|Read Time: 0 minutes
Summary
PCIe is the primary interface for connecting various peripherals in a server. The Next Generation of Dell PowerEdge servers have been designed keeping PCIe Gen4 in mind. PCIe Gen4 effectively doubles the throughput available per lane compared to PCIe Gen3.
The PCIe Interface
PCIe (Peripheral Component Interconnect Express) is a high- speed bus standard interface for connecting various peripherals to the CPU. This standard is maintained and developed by the PCI- SIG (PCI-Special Interest Group), a group of more than 900 companies. In today’s world of servers, PCIe is primary interface for connecting peripherals. It has numerous advantages over the earlier standards, being faster, more robust and very flexible. These advantages have cemented the importance of PCIe.
PCIe Gen 3 was the third major iteration of this standard. Dell PowerEdge 14G systems were designed keeping PCIe Gen 3 in min PCIe Gen3 can carry a bit rate of 8 Gigatransfers per second (GT/s). After considering the overhead of the encoding scheme, this works out to an effective delivery of 985 MB/s per lane, in each direction. A PCIe Gen3 slot with 8 lanes (x8) can have a total bandwidth of 7.8 GB/s.
PCIe Gen 4 is the fourth major iteration of the PCIe standard. This generation doubles the throughput per lane to 16 GT/s. This works out to an effective throughput of 1.97 GB/s per lane in each direction, and 15.75GB/s for a x8 PCIe Gen4 slot.
Designing for PCIe Gen4
The Next Generation of Dell PowerEdge servers were designed with a new PSU Layout. One of the key reasons this was done was to simplify enabling PCIe Gen4. A key element in PCIe performance is the length of PCIe traces. With the new system layout, a main goal was to shorten the overall PCIe trace lengths in the topology, including traces in the motherboard. By positioning PSU’s at both edges, the I/O traces to connectors can be shortened for both processors. This is the optimal physical layout for PCIe Gen 4 and will enable even faster speeds for future platforms. The shorter PCIe traces translate into better system costs and improved Signal Integrity for more reliable performance across a broad variety of customer applications. Another advantage of the split PSU is the balanced airflow that results. The split PSU layout helps to balance the system airflow, reduce PSU operating temperatures, and allows for PCIe Gen4 card support and thus an overall more optimal system design layout.
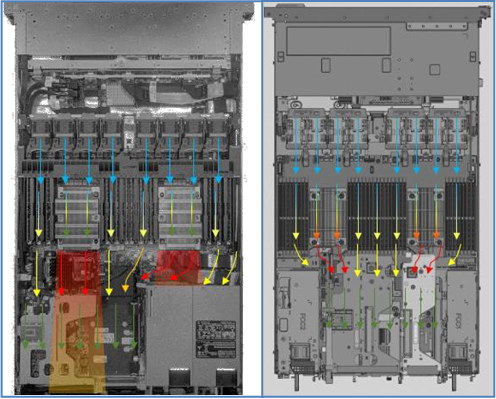
Figure 1 - Figures showing the 14G server layout to the left and the balanced airflow of the next gen Dell PowerEdge platforms to the right.
2nd and 3rd Gen AMD EPYC™ Processors
Next Generation Dell PowerEdge servers with AMD processors are designed for PCIe Gen4. The 2nd and 3rd Generation AMD EPYC processors support the PCIe Gen4 standard allowing for the maximum utilization of this available bandwidth. A single socket 2nd or 3rd Gen AMD EPYC processors have 128 available PCIe Gen4 lanes for use. This allows for great flexibility in design. 128 lanes also give plenty of bandwidth for many peripherals to take advantage of the high core count CPUs.
The dual socket platform offers an additional level of flexibility to system designers. In the standard configuration, 128 PCIe Gen4 lanes are available for peripherals. The rest of the lanes are used for inter-socket communication. Some of these inter-socket xGMI2 lanes can be repurposed to add an additional 32 lanes. This gives a total of 160 PCIe Gen4 lanes for peripherals (Figure 2). This flexibility allows for a wide variety of configurations and maximum CPU-peripheral bandwidth.
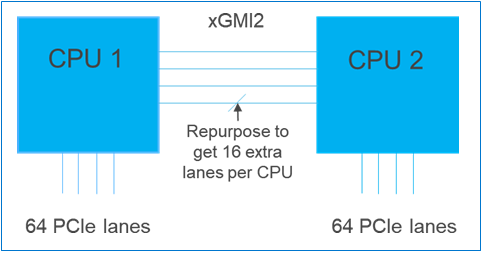
Figure 2 - Diagram showing PCIe lanes in a 2-socket configuration
3rd Gen Intel® Xeon® Scalable Processors
Intel highlighted that the next generation of processors will deliver performance-optimized features for a range of key workloads. Increased memory bandwidth, a new high-performance Sunny Cove core architecture, increased processor core count and support for PCIe Gen4 will enhance performance across different disciplines, including life sciences, material science and weather modeling. These processors will be available throughout the Intel products found within the PowerEdge portfolio of servers.
Conclusion
PowerEdge servers continue to deliver best-in-class features. The new PowerEdge servers have support for the higher speed PCIe Gen4, with innovative designs to improve signal integrity and chassis airflow.

Defense in-depth: Comprehensive Security on PowerEdge AMD EPYC Generation 2 (Rome) Servers
Tue, 17 Jan 2023 00:11:16 -0000
|Read Time: 0 minutes
Summary
Security in servers is no longer an afterthought – it is a key consideration in the choice of a server provider and platform. Dell EMC approaches security in multiple layers to best protect customer assets and data. This includes not just security built into the system and components, but also to manufacturing processes and ensuring a secure supply chain.
Introduction
In the wake of Spectre and Meltdown and endless other side-channel issues, and with predictive indicators showing that new forms of attack are likely – security is a critical requirement for servers. And it is important to ensure that server security is at layers within the systems so that malicious activity can be mitigated in numerous ways. PowerEdge servers with AMD Rome processors use a multi-layer, end-to-end approach of security to help ensure that users’ data and assets are protected, see Figure 1.
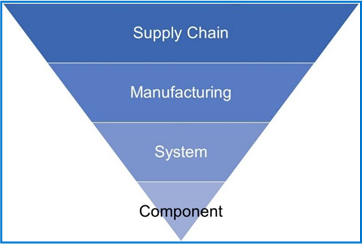
Figure 1: Layers of security in PowerEdge AMD Rome-based servers
Layer 1: AMD EPYC-based System Security for Processor, Memory and VMs on PowerEdge
The first generation of the AMD EPYC processors have the AMD Secure Processor – an independent processor core integrated in the CPU package alongside the main CPU cores. On system power-on or reset, the AMD Secure Processor executes its firmware while the main CPU cores are held in reset. One of the AMD Secure Processor’s tasks is to provide a secure hardware root-of-trust by authenticating the initial PowerEdge BIOS firmware. If the initial PowerEdge BIOS is corrupted or compromised, the AMD Secure Processor will halt the system and prevent OS boot. If no corruption, the AMD Secure Processor starts the main CPU cores, and initial BIOS execution begins.
The very first time a CPU is powered on (typically in the Dell EMC factory) the AMD Secure Processor permanently stores a unique Dell EMC ID inside the CPU. This is also the case when a new off-the-shelf CPU is installed in a Dell EMC server. The unique Dell EMC ID inside the CPU binds the CPU to the Dell EMC server. Consequently, the AMD Secure Processor may not allow a PowerEdge server to boot if a CPU is transferred from a non-Dell EMC server (and CPU transferred from a Dell EMC server to a non-Dell EMC server may not boot).
AMD EPYC Generation 2 processors also offer the AMD Secure Processor --- for cryptographic functionality for secure key generation and key management. This provides full stack encryption without any overhead for the processor. In addition, for hardware-accelerated memory encryption for data-in-use protection, the security components in Rome processors include the AES-128 encryption engine, which is embedded in the memory controller and automatically encrypts and decrypts data in main memory with an appropriate key.
The AMD EPYC processors also include these two unique security features:
Secure Memory Encryption (SME):
SME uses a single key to encrypt system memory, which is generated by the AMD Secure Processor at boot. SME requires enablement in the system BIOS or operating system; when enabled in the BIOS, memory encryption is transparent and can be run with any operating system
Secure Encrypted Virtualization (SEV):
In addition to what SME capabilities, SEV provides Virtual Machine (VM) level encryption, which protects against hypervisor corruption with hardware protection – a more robust solution than software protection. The EPYC Generation 2 (Rome) processors also offer 509 keys per hypervisor for SEV, versus 16 in EPYC (Naples)-based servers
Secure Encrypted Virtualization – Encrypted State (SEV ES):
Encrypts all CPU register contents when a VM stops running, preventing leakage of information in CPU registers to components like the hypervisor, and it can detect malicious modifications to a CPU register state. Some technical details:
- Guest register state is encrypted with guest encryption key and integrity protected
- Only the guest can modify its register state
- Guest must explicitly share register state with the hypervisor
- Guest-Hypervisor Communication Block (GHCB)
- Protects the guest register state from the hypervisor
- Adds additional protection against VM state related attacks (exfiltration, control flow, rollback)
For more information, see this technical brief on EPYC first generation security: AMD CPU Security Features in PowerEdge 14G Servers.
Layer 2: PowerEdge Systems Security
All Dell EMC PowerEdge servers offer built-in security that supports customers with compliance, preventive security, and fast means to recover in the event of errors or breaches. This includes FIPs/Common Criteria Compliance, immutable silicon root of trust (PowerEdge CPUs have a Dell signature: once it is used in a Dell system if cannot be used in another server), digitally signed firmware updates, automatic BIOS recovery, firmware rollback, and more.
In addition, Dell EMC offers differentiated security features in every PowerEdge system:
- Dell EMC OpenManage Secure Enterprise Key Manager –embedded in Dell EMC PowerEdge servers and works in conjunction with leading Key Management Servers for enabling keys at scale
- System Lockdown – Locks down the configuration and firmware, protecting the server(s) from inadvertent or malicious changes, and is enabled or disabled by the IT Administrator… and prevents system/firmware “drift”
- System erase of all user drives, including NVMe – through a process that is not only fast, but enables the drives to be reused and meets NIST recommendations for data erasure
- Rapid OS Recovery – Allows users to boot a trusted backup OS image from a hidden boot device
- Enhanced UEFI secure boot with custom certificates – with UEFI Secure Boot, each component in the chain is validated and authorized against a specific certificate before it is allowed to load or run
- Dynamically-enabled USB ports
- This feature allows administrators to disable all USB ports and then enable them dynamically to allow local crash cart usage (to let a local technician have temporary access)
- The USB ports can be dynamically enabled and disabled without rebooting the server; normally changing the USB port state requires a reboot and takes down the workloads
- Intrusion-switch included – detection of chassis intrusion at no extra expense
- Domain Isolation - an important feature for multi-tenant hosting environments, hosting providers may want to block any re-configuration by tenants. Domain isolation is a configuration option that ensures that management applications in the host OS have no access to the out-of-band iDRAC or to Intel chipset functions
For more information, see this technical brief: Security in Server Design
And this video for further information:
Server Security – Dell EMC PowerEdge Servers
Layer 3: Dell Technologies Factory Security
Factories where Dell products are built must meet specified Transported Asset Protection Association (TAPA) facility security requirements, including the use of closed-circuit cameras in key areas, access controls, and continuously guarded entries and exits. Additional controls are applied at Dell and supplier- managed facilities and for air, rail, and ocean shipments to address the variety of risks faced across transportation modes and regions. Some of these protections include tamper-evident packaging, security reviews of shipping lanes, locks or hardware meeting required specifications, and container integrity requirements. GPS tracking devices may also be placed on any container and monitored 24x7 until confirmation of delivery.
Dell also maintains certification with the United States Customs and Border Patrol’s Customs-Trade Partnership Against Terrorist (C-TPAT). This logistics security program is recognized as compatible with similar programs around the world, including the Authorized Economic Operator (AEO), Canada’s Supply Chain Assurance v4.0 | Dell Inc., 2018 4 Partners in Protection, and Singapore’s Secure Trade Partnership programs. While the primary focus of these programs is to prevent contraband, the required protections also guard against tampering with products being imported.
Layer 4: Dell Technologies Supply Chain Security
The goal of Dell’s supply chain security processes is to provide continuous security risk assessment and improvement. Dell’s Supply Chain Risk Management framework mirrors that of the comprehensive risk management framework of the National Infrastructure Protection Plan (NIPP), which outlines how government and the private sector can work together to mitigate risks and meet security objectives. Dell’s framework incorporates an open feedback loop (see Figure 2) that allows for continuous improvement.
Risk mitigation plans are prioritized and implemented as appropriate throughout the entire solution life cycle.
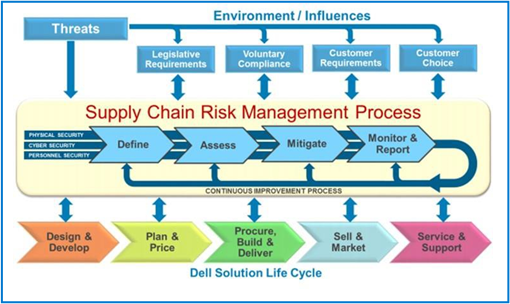
Figure 2 Managing the supply chain for Dell Technologies products
The process includes these safeguards by Dell Technologies for the supply chain:
- Supplier governance by Dell
- Audits
- Global Inventory Control Policy
- Measure suppliers’ security practices against industry best practices for physical security and for mitigating counterfeit components, tainted software and firmware, and intellectual property theft
- Quarterly Reviews
- Supply Chain Security
- Physical (factory/manufacturing) – factories where Dell products are built must meet specified Transported Asset Protection Association (TAPA) facility security requirements. Dell also maintains certification with the United States Customs and Border Patrol’s Customs-Trade Partnership Against Terrorist (C-TPAT).
- Personnel – Dell policy requires employees throughout the supply chain, including those at contract suppliers, to go through a pre-employment suitability screening process.
- Information – Dell collects and uses sensitive information about products, solutions, customers, suppliers and partners throughout the supply chain lifecycle. Dell uses numerous measures to guard this sensitive information against exposure and exploitation.
- Supply Chain Integrity
Dell has developed baseline specifications that are securely preserved and later used as a reference to verify that no unauthorized modifications have been made to hardware or software. The goal is to ensure that the products received by customers are the products customers expected and will operate as intended.
For hardware, this includes processes to minimize the opportunity for counterfeit components to infiltrate our supply chain. For software, Industry software engineering best practices include security throughout the development process for any code, including operating systems, applications, firmware, and device drivers. Dell reduces opportunities for the exploitation of software security flaws by incorporating Secure Development Lifecycle (SDL) measures throughout the development process. These measures are tightly aligned with Software Assurance Forum for Excellence in Code (SAFECode) guidelines and ISO 27034.
- Stronger together
Dell participates in supply chain risk management activities with trusted industry groups and public/private partnerships. Dell has been actively engaged in the Open Group Trusted Technology Forum (O-TTPF), the Software and Supply Chain Assurance Forum, SAFECode, the Supply Chain Risk Leadership Council, the Internet Security Alliance, and the IT Sector Coordinating Council. Dell is also an active member of the Government Information Data Exchange Program (GIDEP). Dell has participated in the development of numerous standards and best-practice guidelines related to supply chain integrity including the Open Group Trusted Technology Provider Standard (O-TTPS) which is also recognized as ISO 20243, SAFECode, ISO 27036, and National Institute of Science and Supply Chain Assurance v4.0 | Dell Inc., 2018 6 Technology (NIST) Interagency Report (IR) 7622, NIST Special Publication (SP) 800-161, NIST SP800-53, and the NIST Cybersecurity Framework. To address customer concerns about product tampering and supply chain assurance, Dell continues to monitor and influence the development and potential impact of legislation, regulations, voluntary standards, and contract language
For more details on Dell supply chain security please refer to this white paper: https://i.dell.com/sites/csdocuments/CorpComm_Docs/en/supply-chain-assurance.pdf?newtab=true
In Conclusion
Security must be designed within the architecture of the server to effectively withstand sophisticated cyber - crime: phishing attacks that harvest credentials, advanced persistent threats (taking control of firmware), data exfiltration (stealing data). Yet it’s not just the server features that need to support customer security – it is also necessary to provide protection against the possibility of corruption in manufacturing and within the server supply chain. These layers of security must be considered as critical criteria for user decisions on integrating technical equipment into their environments.
As Dell EMC designs products, it will always be to protect, protect, and protect customer data and assets – and in consideration of worst-case scenarios, ensure that users of Dell EMC solutions can recover quickly, and resume production with as little disruption as possible. With these goals, Dell EMC is constantly evaluating new ways within each security layer to protect customers.

Bringing AMD to the Datacenter
Mon, 16 Jan 2023 23:56:53 -0000
|Read Time: 0 minutes
Summary
IT administrators are excited to reap the benefits of these high core count processors but are unsure of how to best incorporate a second x86 architecture in their datacenter. This Direct from Development tech note discusses compatibility between Intel and AMD processors, workload migrations and scheduler support for heterogenous environments.
Introduction
Today we have more capabilities than ever before coming from our IT departments. They operate datacenters and manage workloads that provide collaboration, insight and enable operations. As customers look to expand these services, they often ask about the 2nd generation of AMD EPYC processors (Rome), how their workload will perform, and what it means to operate a datacenter where two different x86 vendors are present. In this Direct from Development tech note we briefly cover the AMD EPYC 7002 series of processors before going over best practices and key considerations operating two x86 instruction sets in your datacenter.
AMD EPYC 7002 series
AMD EPYC 7002 series processors have the highest core density currently offered in the x86 market with the AMD EPYC 7742 containing 64 cores. In addition to this extreme core count, the EPYC CPU lineup also offers several SKUs that have configurations optimized for a specific workload such as the recently announced 7Fxx series which support up to 32 cores at boost frequencies of 3.9Ghz, a half gigahertz increase over what is offered by other EPYC CPUs. The 7Fxx lineup of CPUs is targeted at hyper converged infrastructure, high performance computing and relational database management systems such as SQL.
Deploying and Managing EPYC in the Data Center
Introducing new hardware in the datacenter requires careful consideration. IT operations teams will likely want to first test and validate several workloads as a prototype before deploying into the production environment, and tooling + procedures will need to be put in place to manage the lifecycle of these servers. For Dell EMC customers this is a relatively seamless process – both the Intel and AMD line of 14G PowerEdge servers contain iDRAC9. This enables operations teams to use the same familiar interface to deploy, manage and secure all PowerEdge servers. Customers who use OpenManage Enterprise will find that it puts all of the systems in a single pane of glass for management and updates and provides granularity to support different firmware baselines.
Even with a universal management framework through iDRAC9 there are other considerations for how to cluster these systems, the impact on workload scheduling and how to migrate workloads. Before discussing that, a bit on iDRAC telemetry. As you deploy new systems and manage a diverse set of applications it becomes increasingly difficult to monitor the performance and health of these workloads. With the iDRAC9 Data Center edition you can stream telemetry information into databases such as Graphana or Prometheus. With all systems streaming telemetry into a single database you can better understand the health of workloads in your datacenter and respond to issues quicker. As you make decisions about which applications to deploy on AMD systems, this data can be used to compare metrics that are relevant to application performance and allow you to make data driven decisions on where to deploy.
Mixed CPU Cluster Compatibility
Most customers who are purchasing their first AMD system have an existing footprint of x86 processors. This drives concerns and questions from our customers about the compatibility of their clusters across the two different x86 instruction sets. Services that operate in a clustered fashion are generally a homogenous configuration for ease of management and to provide consistent performance. As we move to a world that consists of not just the core datacenter but also the cloud and edge, it is becoming increasingly common for services to operate a collection of clusters, the configuration of which will be optimized for both site (edge, core, cloud) and function.
There are several reasons IT administrators may want to avoid a mixture of processor generations and vendors in a clustered system. One is that migration tools such as vMotion Live Migration do not work due to differences in the instruction set architecture between x86 vendors. This doesn’t apply to generations of processors from the same vendor if supported by Enhanced vMotion Compatibility (EVC) mode but enabling this has a performance cost [1]. Another reason is that maintenance windows will be hard to keep up with when you have BIOS and microcode updates coming from two different vendors. Multiple generations of processors can make updates difficult because of the additional effort that is needed to complete increased amount of testing that must be done, which is at least one for each generation of processor.
IT leaders now have more options for x86 processors and should evaluate each new system deployment and consider if Intel or AMD processors would be optimal for the workload and environment. For example, a large network service provider has deployed AMD due to the benefits they saw in the large L3 cache present on AMD EPYC processors. Conversely a major retail customer of Dell EMC looking to deploy AI services at 400 edge locations selected Intel Xeon Cascade Lake processors for their support of DLBoost, a technology that allows twice as many AI inference operations at 8-bit precision.
Workload Migration
IT administrators move workloads between systems and clusters for a variety of reasons, some planned and some unplanned. As touched on earlier, some workload migration techniques such as VMware vMotion Live Migration are not compatible between Intel and AMD systems. This is an important limitation that must be accounted for when considering high availability, fault capacity and how you conduct general day to day activities such as cluster balancing and planned maintenance.
In the event it is necessary to migrate a workload between Intel and AMD processor-based systems, there are a few options. For VMware environments, while vMotion Live Migration does not work, you can do a cold migration after shutting down the virtual machine. In other cases, you can use application specific migration techniques. Most applications support backup/restore functionality that can be used in conjunction with tools like load balancers to allow migration with little or no downtime.
Heterogenous Scheduling
Workload schedulers such as Slurm, kube-scheduler and Hadoop all support various methods of gaining awareness and preference when determining which CPU to schedule a workload. With Slurm, nodes are divided into partitions and it is trivial to separate Intel and AMD systems into different partitions. Hadoop 3 and kube-scheduler support a variety of features that enable exposing CPU information and grouping similar systems using labels, namespaces and roles.
For now, schedulers still require explicit definition of whether to run a workload AMD or another processor if you want consistent performance, though policy-based rules can provide default definitions. Capacity planning is also challenging when attempting to do heterogenous scheduling, and because of this complexity it is a good idea to avoid heterogenous scheduling for real time applications and instead only use this for non-real-time applications such as data processing and batch workloads.
In Conclusion
Dell EMC offers several PowerEdge servers that support AMD EPYC 7002 series processors. The PowerEdge R6515 and R7515 support a single 7002-series processor and the PowerEdge C6525, R6525 and R7525 support two processors. The C6525 for those unfamiliar with it is a 2U server with 4 compute sleds. Configured with two 64-core AMD processors per sled this chassis can provide 512 CPU cores in a 2U footprint. All the PowerEdge models listed also have support for PCIe 4.0, though the number of expansion slots varies by model.
To effectively make use of these systems’ capacity, administrators should use homogenous configurations for clustered services and ensure they have a tested procedure to migrate their workloads. Heterogenous collections of systems are best suited for batch workloads. Finally, customers can optimize the performance of their workload by using processor SKUs that have specific features and capabilities for enhanced performance.
https://www.vmware.com/content/dam/digitalmarketing/vmware/en/pdf/techpaper/vmware-vsphere-evc- performance-white-paper.pdf

Boosting Storage Performance and Resilience with the Dell PERC H755N NVMe RAID Controller
Mon, 16 Jan 2023 23:47:32 -0000
|Read Time: 0 minutes
Summary
Hardware RAID technology adds an extra level of resilience to a server’s storage capability. RAID levels like 1, 5, and 6 allow seamless recovery from drive failures. With the Dell PERC H755N, Next Gen Dell PowerEdge servers now support hardware RAID with NVMe drives. This adds an extra level of resilience to the fantastic performance of NVMe.
Introduction
RAID (Redundant Array of Inexpensive Disks) has been around for many years. It allows for increased resilience and reliability for critical storage applications. RAID levels of 1, 5, 6, 10, 50 and 60 offer different levels of redundancy. Depending on the application requirements and business limitations, a specific RAID level could be chosen.
With the advent of NVMe SSDs, storage performance got a tremendous boost. Hardware RAID solutions of the time were not capable of keeping up with the NVMe interface. Software RAID was a potential solution, but it lacked some key HW RAID advantages like low CPU overhead and battery backup for data in flight.
The new Dell PERC H755N changes that limitation. Sitting in a x8 PCIe Gen4 slot, each H755N RAID Controller supports up to 8 NVMe drives, connected with a x2 PCIe Gen4 interface. This ensures that the RAID Controller can keep up with the sheer bandwidth supported by NVMe drives.
The TPCx-V Benchmark
The TPCx-V Benchmark measures the performance of a virtualized server platform under a demanding database workload. It stresses CPU and memory hardware, storage, networking, hypervisor, and the guest operating system. The workload is database-centric and models many properties of cloud services, such as multiple VMs running at different load demand levels1.
This benchmark is a great real-world benchmark for a very common customer use case. It runs a variety of database workloads, and even varies the workload depending on the size of the virtual machine. One of the requirements of TPCx-V is to ensure redundancy in the system under test. This means that the system should be able to recover from hardware failures of field replaceable items including drives and/or storage controllers.
TPCx-V and the Dell PowerEdge R7525
The Dell PowerEdge R7525 is a very versatile server that can be used for a variety of applications. It can be configured with up to 2 redundant H755N NVMe RAID Controllers, and 2 of the AMD Epyc 3rd Generation of processors. The AMD Epyc 3rd Generation of processors offers up to 64 cores per socket, for a total of up to 128 cores. They also support 8 channels of DDR3200 memory per socket with up to two DIMMs per channel. This totals up to 4TB of RAM if 128GB DIMMs are used. It also features up to 160 lanes of PCie Gen4 connectivity for maximum versatility.
All of the above means that the Dell PowerEdge R7525 is a strong candidate for the TPCx-V benchmark. The number of cores and the support for high speed memory is very suited for virtualization use cases. The AMD Epyc 3rd Generation of processors has also been found to be great for database kind of workloads. The available redundant NVMe RAID Controllers ensures that the storage would be able to withstand failures while also providing exceptional NVMe type performance.
Results
The TPCx-V benchmark was run on a Dell PowerEdge R7525 with dual H755N RAID Controllers, and the AMD Epyc 7713 processors. This is 64 core processor from the AMD Epyc 3rd generation of CPUs. The system was configured with 6 NVMe drives per controller.
The output was a benchmark score of 2800 TpsV, which is 22.8% higher than the previous world record score. The previous world record was run on a platform with 2 64 core AMD Epyc 2nd generation of processors and 10 SATA SSDs per controller. The ability of the configuration to achieve the much higher score with almost half the number of drives highlights the performance advantages of the NVMe RAID Controller over a configuration with SATA SSDs
Conclusion
The Dell PowerEdge R7525 running AMD Epyc 3rd Generation of processors and leveraging the Dell PERC H755N NVMe RAID Controllers is shown to be a leading performer for database kind of workloads running in virtualized environments.

Benchmark Performance of AMD EPYC™ Processors
Mon, 16 Jan 2023 23:40:30 -0000
|Read Time: 0 minutes
Summary
The Dell PowerEdge portfolio of servers with AMD EPYC processors have achieved several world record benchmark scores including VMMark, TPCx-HS and SAP-SD. These scores demonstrate the advantage of these servers for key business workloads.
AMD 3rd Generation AMD EPYC™ Processors
The 3rd Generation of AMD EPYC™ Processors builds on the AMD Infinity Architecture to provide full features and functionality for both one-socket and two-socket x86 server options. The processor retains the chiplet design from the 2nd generation, with a 12nm based IO die surrounded by 7nm based compute dies and is a drop-in replacement option. With a range of options, from 8 cores all the way to 64 cores, and TDPs of up to 280W, these processors can target a wide variety of workloads. Configurations support up to 160 lanes of PCIe Gen4 allowing for options like 24x direct attach NVMe drives and dual port 100Gbps NICs that can run at line rate.
Key New Features
The AMD 3rd Generation of processors builds on the previous generation but adds a few key optimizations that deliver significant performance improvements. The L3 cache in each CCD is now shared across all 8 cores instead of just 4. Thus, each core has up to 32MB of L3 cache allowing for flexibility, lower inter-core latency, and improved cache performance. The DDR memory latency has been further reduced along with a new 6-channel memory interleaving option. The IO memory management unit has been optimized to better handle 200Gbps line rate. There is improved support for Hot Plug surprise remove following PCIe-SIGs new implementation guideline. New features like SEV-SNP (Secure Nested Paging) provide enhanced virtualization security. There are a few other enhancements and optimizations targeting workloads around HPC, etc.
What does this mean?
Technical specifications can only explain part of the story. Key workload-based benchmarks can explain some of the real-world applicability and real-world performance. Dell has worked to publish multiple key benchmarks to help customers gauge the real-world performance of the various Dell PowerEdge servers with AMD EPYC Processors
Key Benchmarks
Some of the key benchmarks that are relevant to typical use cases are listed below:
VMMark:
VMMark is a benchmark from VMWare that highlights virtualization. The VMMark benchmark runs multiple tiles on the system under test. Each tile consists of 19 different virtual machines, with each running a typical workload. This benchmark is great at identifying the capabilities for a typical IT server where the workloads are virtualized, and multiple workloads are running on a single server.
For AMD, EPYC, the large number of cores, the high speed memory, the high speed PCIe Gen4 for networking, and, when used, storage, all contribute towards a very positive result.
As of 3/15/2021, Dell has top scores on 4-node vSAN configurations with the R7515, the R6525 and the C6525. The R7515 and R6525 are 1 and 2-Socket servers with scores of 15.18@16 tiles and 24.08@28 tiles respectively. The C6525 is a modular server with 4-nodes in a single 2-U system with a score of 13.74@16 tiles and highlights the sheer density of compute possible in 2U of rack space.
Dell also has a leading score for a matched pair 2-socket configuration connected to a Dell EMC PowerMax. This configuration managed a score of 19.4@22 tiles from just 2 servers, achieving the maximum VM density for such a configuration. This score highlights the advantages of leveraging an excellent external storage array like the Dell EMC PowerMax to maximize reliability and performance.
Reference: https://www.vmware.com/products/vmmark/results3x.html
TPCx-HS
The TPCx-HS benchmark is built to showcase the performance of a Hadoop cluster doing data analytics. In today’s world, where data is critical, the ability to analyze and manage this data becomes very important. The benchmark can do batch processing with MapReduce or data analytics on Spark
As of 3/15/2021, Dell PowerEdge servers with AMD EPYC 3rd generation of processors have multiple world record scores for TPCx-HS at both the 1TB and 3TB database sizes. These include performance improvements of as much as 60% over the previous world records with as much as 40% lower $/HSph.
Reference: http://tpc.org/tpcx-hs/results/tpcxhs_perf_results5.asp?version=2
SAP-SD
SAP-Sales and Distribution is a core functional module in SAP ERP Central Component that allows organizations to store and manage customer and product related data. The ability to access and manage this data at high speed, and with minimal latency is a very critical requirement of the business architecture.
For this benchmark, Dell PowerEdge servers have world record scores on Windows and Linux for both 1-S and 2-S platforms. The 2-S Linux configuration score of 75000 benchmark users is higher than even the best 4-S score for this benchmark, highlighting the significant advantage of this architecture for database use cases.
Reference: https://www.sap.com/dmc/exp/2018-benchmark-directory/#/sd
Conclusion
Dell PowerEdge servers with AMD EPYC processors have industry leading performance numbers. Benchmarks like VMMark, TPCx-HS and SAP-SD show that these platforms are excellent for the most common workloads and provide excellent business value.

Analyzing How Gen4 NVMe Drive Performance Scales on the PowerEdge R7525
Mon, 16 Jan 2023 23:31:22 -0000
|Read Time: 0 minutes
Summary
Gen4 NVMe drives double the PCIe speeds of Gen3 from 1GB/s to 2GB/s per lane, effectively increasing the performance capability by two times. However, users also need to understand how Gen4 NVMe performance scales when more than one drive is loaded into a populated server running workloads. This DfD will analyze how various IO profiles scale when more than one Gen4 NVMe drive is loaded into a PowerEdge R7525.
PCIe 4.0 History and Gen4 NVMe Scaling
PCIe 4.0 was released in 2019, following its predecessor with double the bandwidth (up to 64GB/s), bit rate (up to 16GT/s) and frequency (up to 16GHz). AMD released the first motherboards to support PCIe 4.0 in early 2020, while Intel motherboards with PCIe 4.0 support are scheduled to begin releasing by the end of 2020. Gen4 NVMe drives were introduced shortly after the release of PCIe 4.0 to capitalize on its specification improvements; allowing performance metrics to double (if the same number of lanes are used). Although these numbers look enticing at first glance, very little data has been gathered around how Gen4 NVMe drives perform when scaled in a datacenter server running workloads. What is the sweet spot? When does the performance curve begin to plateau? The Dell Technologies engineering team constructed an in-house test setup to obtain data points that will help users understand IOPS and bandwidth trends when scaling Gen4 NVMe drives.
Figure 1 - Samsung PM1733 Gen4 NVMe
Test Setup
The PowerEdge R7525 was used as the host server, as it is one of the first Dell EMC servers to support PCIe 4.0. The Samsung PM1733 Gen4 NVMe drive was connected using CPU direct attach and then scaled. Measurements were taken for 1, 2, 4, 8, 12 and 24 drives. The IOmeter benchmark was used to simulate data center workloads running on NVMe drives to achieve the maximum raw performance data. FIO was used as a supplemental benchmark as well. *Note that these benchmark results are not directly applicable to file systems or application workloads.
Random reads (RR) and writes (RW) were measured in Input/Output operations per second (IOPS). Online Transaction Processing (OLTP), useful for measuring database workloads, is also measured in IOPS. Sequential reads (SR) and writes (SW) were measured in mebibyte per second (MiBPs).
Test Results
Figure 2 – Gen4 NVMe RR perf scaling for up to 24 drives Figure 3 –Gen4 NVMe RW perf scaling for up to 24 drives Figure 4 – Gen4 NVMe OLTP perf scaling per drive for up to 24 drives
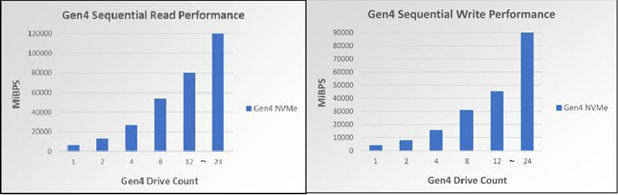
Figure 5 –Gen4 NVMe SR perf scaling for up to 24 drives Figure 6 –Gen4 NVMe SW perf scaling for up to 24 drives
As seen in Figures 2-6, the Gen4 NVMe drives have remarkable performance. One Gen3 NVMe drive commonly has 4K RR performance in the triple-digit KIOPS, but one Gen4 NVMe drive is within the quad-digit KIOPS for 4K RR. Scaling to 12 Gen4 NVMe drives shows 17M 4KiB RR IOPS, allowing for extraordinary amounts of data to be read randomly from the disk at one time. Scaling to 12 Gen4 NVMe drives also has a notable 80.41GiBs at 128KiB, a number very close to the theoretical maximum line rate of 94.5 128K SR GBPS. Lastly, 4K OLTP benchmark speeds are also nearly 2 times faster than Gen3 NVMe drives.
Furthermore, these bar graphs demonstrate that each profile scales linearly for up to 12 drives. The benchmarked synthetic workloads received linear performance improvements with up to 12 NVMe drives scaled, and each performance readout also scaled very closely to its theoretical maximum. However, once the jump from 12 to 24 drives is made, two of the IO profiles (in particular, the RR and SR profiles) stop scaling linearly and become less optimized. When accounting for the fact CPU utilization is at 90%, it is to be expected that scaling beyond 12 drives will not give linear performance increases for all IO profiles.
Conclusion
Customers seeking to scale their Gen4 NVMe drives will be pleased to know that all IO Profile performance readings scaled linearly for up to 12 drives, while only some of the IO Profiles did for up to 24 drives. Servers and systems running workloads like data analytics, AI, ML, DL and databases can greatly benefit from this increase in IOPS and throughput when scaling Gen4 NVMe devices for up to 12 drives.

Accelerating Intra-Host Data Movement with VMware PVRDMA on a Dell AMD PowerEdge Server
Mon, 16 Jan 2023 23:18:32 -0000
|Read Time: 0 minutes
Summary
PVRDMA is an innovative new technology to help accelerate intra-host data movement (i.e. data between VMs on a host). The ESXi driver takes advantage of DMA engines in the AMD Epyc 2nd and 3rd Generation of processors to provide significant performance improvements for this use case. Please contact Dell if you need more information.
Introduction
As CPU cores scale, the usage and demand for ever larger data exchanges within a host scale. It scales among kernels, applications, VMs, and I/O devices. At the same time, VM density is on the rise. Hyperconverged Storage appliances are enabling new workloads on server class systems where Data locality is important. Each intra-host exchange can comprise multiple memory buffer copies (or transformations) and are generally implemented with layers of software stacks. While Kernel-to-I/O can leverage I/O- specific hardware memory copy, SW-to-SW usually relies on per- core synchronous software (CPU-only) memory copies
Intra-host SW memory copy and transformation needs are not keeping up with scaling of cores & workloads. It is difficult for complex processors to ensure a single-core attains full processor- to memory-bandwidth and therefore, noticeable core utilization is needed to satisfy synchronous copy needs. Further, I/O intensive workloads can take away compute CPU cycles available. Network and Storage workloads can take compute cycles for Data Movement, Encryption, Decryption, Compression etc.
Hypervisors want a well-defined capability to quiesce, suspend, and resume the architectural state of a per-address-space data mover that is independent of the actual hardware-offload and the various accelerations that it can perform. This allows “live” workload (VM migration) between different servers with different HW-offload implementations of standard data-movement operations
What is PVRDMA
PVRDMA is one such well-architected, virtualizable interface to workload VMs. The interface is now standard in ESXi and is implemented across CPUs, Platforms, and NICs. Acceleration can occur transparent to the workload. PVRDMA emulation uses RDMA or TCP/IP NICs for inter-host VM-to-VM transfers. However, PVRDMA uses SW Memory Copy for intra-host VM-to-VM transfers if no RDMA NIC and this is ideal for a DMA engine.
Using the AMD EPYC 7002 or 7003 Processors with built-in PTDMA DMA Engines and an AMD ESXi PTDMA PVSP1 Driver, Dell AMD PowerEdge Servers can accelerate Intra-host VM-to-VM Data Movement. PTDMA engines can perform memory copies without CPU intervention
Fig.1 shows the results of PVRDMA testing with SW memory copies for a copy size of 8KiB to 256KiB and PTDMA engine memory copies from 256KiB to 64M.
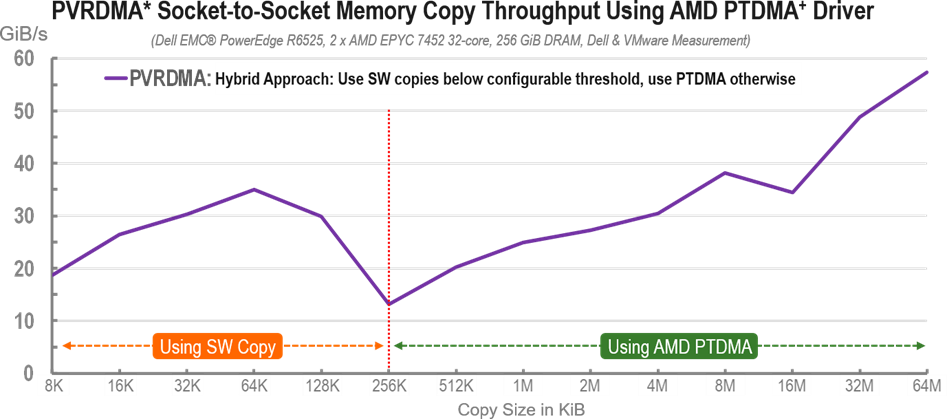
Fig.1 PVRDMA* Socket-to-Socket Memory Copy Throughput Using AMD PTDMA+ Driver
We observe that SW copy performance is good for small copy sizes. However, as copy sizes fall out of the L1 cache(2*32KiB), SW copy performance drops yet continues to outperform PTDMA copy performance before it falls out of the L2 cache (1/2 * 512KiB). At this L2 cache threshold, PTDMA copies become more performant and outperform SW copy performance. We tested it upto 8M and we expect that the performance will vary with different workloads and application cache interaction
PVRDMA in vSphere 7.0 u1 can now use this PVSP1 DMA compliant driver to perform intra-host copy. PVRDMA and the prototype AMD PTDMA (PVSP) driver support a hybrid approach. By default, the threshold is 256 KiB and can be adjusted for various application tunings.
Next Steps
A PVRDMA technology demo is available on demand from Dell using Dell PowerEdge Servers with this technology. Interested customers can contact their Dell account executive to schedule an engagement request with a Dell Customer Solution Center 2
Also, a VMworld presentation titled “Accelerated, Virtualized, and Standardized Intra-host Data Movement” is available on demand here3 that provides more info on this technology and Dell’s vision into the future in this space.
References
- Partner Verified and Supported Program
- https://www.delltechnologies.com/en-us/what-we-do/customer-engagement- programs/customer_solution_centers.htm
- https://www.vmworld.com/en/video-library/search.html#text=%22OCTO2592%22&year=2020

Using NVMe Namespaces to Increase Performance in a Dell PowerEdge R7525 Server
Mon, 16 Jan 2023 23:10:15 -0000
|Read Time: 0 minutes
Summary
This document summarizes how NVMe namespaces can be used to increase performance in Dell PowerEdge R7525 servers using KIOXIA CM6 Series NVMe enterprise SSDs.
All performance and characteristics discussed are based on performance testing conducted in KIOXIA America, Inc. application labs.
Results are accurate as of September 1, 2022
Introduction
A key goal of IT administrators is to deliver fast storage device performance to end- users in support of the many applications and workloads they require. With this objective, many data center infrastructures have either transitioned to, or are transitioning to, NVMe storage devices, given the very fast read and write capabilities they possess. Selecting the right NVMe SSD for a specific application workload or for many application workloads is not always a simple process because user requirements can vary depending on the virtual machines (VMs) and containers for which they are deployed. User needs can also dynamically change due to workload complexities and other aspects of evolving application requirements. Given these volatilities, it can be very expensive to replace NVMe SSDs to meet the varied application workload requirements.
To achieve even higher write performance from already speedy PCIe® 4.0 enterprise SSDs, using NVMe namespaces is a viable solution. Using namespaces can also deliver additional benefits such as better utilization of a drive’s unused capacity and increased performance of random write workloads. The mantra, ‘don’t let stranded, unused capacity go to waste when random performance can be maximized,’ is a focus of this performance brief.
Random write SSD performance effect on I/O blender workloads
The term ‘I/O blender’ refers to a mix of different workloads originating from a single application or multiple applications on a physical server within bare-metal systems or virtualized / containerized environments. VMs and containers are typically the originators of I/O blender workloads.
When an abundance of applications run simultaneously in VMs or containers, both sequential and random data input/output (I/O) streams are sent to SSDs. Any sequential I/O that exists at that point is typically mixed in with all of the other I/O streams and essentially becomes random read/write workloads. As multiple servers and applications process these workloads and move data at the same time, the SSD activity changes from just sequential or random read/write workloads into a large mix of random read/write I/Os - the I/O blender effect.
As almost all workloads become random mixed, an increase in random write performance can have a large impact on the I/O blender effect in virtualized and containerized environments.
The I/O blender effect can come into play at any time where multiple VMs and/or containers run on a system. Even if a server is deployed for a single application, the I/O written to the drive can still be highly mixed with respect to I/O size and randomness. Today’s workload paradigm is to use servers for multiple applications, not just for a single application. This is why most modern servers are deployed for virtualized or containerized environments. It is in these modern infrastructures where the mix of virtualized and containerized workloads creates the I/O blender effect, and is therefore applicable to almost every server that ships today. Supporting details include a description of the test criteria, the set-up and associated test procedures, a visual representation of the test results, and a test analysis.
Addressing the I/O blender effect
Under mixed workloads, some I/O processes that typically would have been sequential in isolation become random. This can increase SSD read/write activity, as well as latency (or the ability to access stored data). One method used to address the I/O blender effect involves allocating more SSD capacity for overprovisioning (OP).
Overprovisioning
Overprovisioning means that an SSD has more flash memory than its specified user capacity, also known as the OP pool. The SSD controller uses the additional capacity to perform various background functions (transparent to the host) such as flash translation layer (FTL) management, wear leveling, and garbage collection (GC). GC, in particular, reclaims unused storage space which is very important for large write operations.
The OP pool is also very important for random write operations. The more random the data patterns are, the more it allows the extra OP to provide space for the controller to place new data for proper wear leveling and reduce write amplification (while handling data deletions and clean up in the background). In a data center, SSDs are rarely used for only one workload pattern. Even if the server is dedicated to a single application, other types of data can be written to a drive, such as logs or peripheral data that may be contrary to the server’s application workload. As a result, almost all SSDs perform random workloads. The more write-intensive the workload is, the more OP is needed on the SSD to maintain maximum performance and efficiency
Namespaces
Namespaces divide an NVMe SSD into logically separate and individually addressable storage spaces where each namespace has its own I/O queue. Namespaces appear as a separate SSD to the connected host that interacts with them as it would with local or shared NVMe targets. They function similarly to a partition, but at the hardware level as a separate device. Namespaces are developed at the controller level and have the included benefit of dedicated I/O queues that may provide improved Quality of Service (QoS) at a more granular level.
With the latest firmware release of KIOXIA CM6 Series PCIe 4.0 enterprise NVMe SSDs, flash memory that is not provisioned for a namespace is added back into the OP pool, which in turn, enables higher write performance for mixed workloads. To validate this methodology, testing was performed using a CM6 Series 3.84 terabyte1 (TB), 1 Drive Write Per Day2 (DWPD) SSD, provisioned with smaller namespaces (equivalent to a CM6 Series 3.2TB 3DWPD model). As large OP pools impact performance, CM6 Series SSDs can be set to a specific performance or capacity metric desired by the end user. By using namespaces and reducing capacity, a 1DWPD CM6 Series SSD can perform comparably in write performance to a 3DWPD CM6 Series SSD, as demonstrated by the test results.
1 Definition of capacity - KIOXIA Corporation defines a kilobyte (KB) as 1,000 bytes, a megabyte (MB) as 1,000,000 bytes, a gigabyte (GB) as 1,000,000,000 bytes and a terabyte (TB) as 1,000,000,000,000 bytes. A computer operating system, however, reports storage capacity using powers of 2 for the definition of 1Gbit = 230 bits = 1,073,741,824 bits, 1GB = 230 bytes = 1,073,741,824 bytes and 1TB = 240 bytes = 1,099,511,627,776 bytes and therefore shows less storage capacity. Available storage capacity (including examples of various media files) will vary based on file size, formatting, settings, software and operating system, and/or pre-installed software applications, or media content. Actual formatted capacity may vary.
2 Drive Write(s) per Day: One full drive write per day means the drive can be written and re-written to full capacity once a day, every day, for the specified lifetime. Actual results may vary due to system configuration, usage, and other factors.
Testing Methodology
To validate the performance comparison, benchmark tests were conducted by KIOXIA in a lab environment that compared the performance of three CM6 Series SSD configurations in a PowerEdge server with namespace sizes across the classic four-corner performance tests and three random mixed-use tests. This included a CM6 Series SSD with
3.84TB capacity, 1DWPD and 3.84TB namespace size, a CM6 Series SSD with 3.84TB capacity, 1DWPD and a namespace adjustment to a smaller 3.20TB size, and a CM6 Series SSD with 3.20TB capacity, 3DWPD and 3.20TB namespace size to which to compare the smaller namespace adjustment.
The seven performance tests were run through Flexible I/O (FIO) software3 which is a tool that provides a broad spectrum of workload tests with results that deliver the actual raw performance of the drive itself. This included 100% sequential read/write throughput tests, 100% random read/write IOPS tests, and three mixed random IOPS tests (70%/30%, 50%/50% and 30%/70% read/write ratios). These ratios were selected as follows:
- 70%R / 30%W: represents a typical VM workload
- 50%R / 50%W: represents a common database workload
- 30%R / 70%W: represents a write-intensive workload (common with log servers)
In addition to these seven tests, 100% random write IOPS tests were performed on varying namespace capacity sizes to illustrate the random write performance gain that extra capacity in the OP pool provides. The additional namespace capacities tested included a CM6 Series SSD with 3.84TB capacity, 1DWPD and two namespace adjustments (2.56TB and 3.52TB).
A description of the test criteria, set-up, execution procedures, results and analysis are presented. The test results represent the probable outcomes that three different namespace sizes and associated capacity reductions have on four- corner performance and read/write mixes (70%/30%, 50%/50% and 30%/70%). There are additional 100% random write test results of four different namespace sizes when running raw FIO workloads with a CM6 Series 3.84TB, 1DWPD SSD and equipment as outlined below.
Test Criteria:
The hardware and software equipment used for the seven performance tests included:
- Dell PowerEdge R7525 Server: One (1) dual socket server with two (2) AMD EPYC 7552 processors, featuring 48 processing cores, 2.2 GHz frequency, and 256 gigabytes1 (GB) of DDR4
- Operating System: CentOS v8.4.2105 (Kernel 4.18.0-305.12.1.el8_4.x86_64)
- Application: FIO v3.19
- Test Software: Synthetic tests run through FIO v3.19 test software
- Storage Devices (Table 1):
- One (1) KIOXIA CM6 Series PCIe 4.0 enterprise NVMe SSD with 3.84 TB capacity (1DWPD)
- One (1) KIOXIA CM6 Series PCIe 4.0 enterprise NVMe SSD with 3.2 TB capacity (3DWPD)
3 Flexible I/O (FIO) is a free and open source disk I/O tool used both for benchmark and stress/hardware verification. The software displays a variety of I/O performance results, including complete I/O latencies and percentiles.
Set-up & Test Procedures
Set-up: The test system was configured using the hardware and software equipment outlined above. The server was configured with a CentOS v8.4 operating system and FIO v3.19 test software.
Tests Conducted
Test | Measurement | Block Size |
100% Sequential Read | Throughput | 128 kilobytes1 (KB) |
100% Sequential Write | Throughput | 128KB |
100% Random Read | IOPS | 4KB |
100% Random Write | IOPS | 4KB |
70%R/30%W Random | IOPS | 4KB |
50%R/50%W Random | IOPS | 4KB |
30%R/70%W Random | IOPS | 4KB |
Test Configurations
Product | Focus | SSD Type | Capacity Size | Namespace Size |
CM6 Series | Read-intensive | Sanitize Instant Erase4 (SIE) | 3.84TB | 3.84TB |
CM6 Series | Read-intensive | SIE | 3.84TB | 3.52TB |
CM6 Series | Read-intensive | SIE | 3.84TB | 3.20TB |
CM6 Series | Read-intensive | SIE | 3.84TB | 2.56TB |
CM6 Series | Mixed-use | SIE | 3.20TB | 3.20TB |
Note: The SIE drives used for testing have no performance differences versus CM6 Series Self-Encrypting Drives5 (SEDs) or those without encryption, and their selection was based on test equipment availability at the time of testing.
Utilizing FIO software, the first set of seven tests were run on a CM6 Series SSD with 3.84TB capacity, 1DWPD and
3.84TB namespace size. The results were recorded.
The second set of seven FIO tests were then run on the same CM6 Series SSD, except that the namespace size was changed to 3.2TB to represent the namespace size of the third SSD to be tested against - the 3DWPD CM6 Series SSD with 3.2TB capacity, 3DWPD and 3.2TB namespace size. The results for these tests were recorded.
The third set of seven FIO tests were then run on the CM6 Series SSD with 3.2TB capacity, 3DWPD and 3.2TB namespace size, and the performance that the CM6 Series SSD (3.84TB capacity, 1DWPD, 3.84TB namespace size) is trying to achieve. The results for these tests were recorded.
4 Sanitize Instant Erase (SIE) drives are compatible with the Sanitize device feature set, which is the standard prescribed by NVM Express, Inc. It was first introduced in the NVMe v1.3 specification and improved in the NVMe v1.4 specification, and by the T10 (SAS) and T13 (SATA) committees of the American National Standards Institute (ANSI).
5 Self-Encrypting Drives (SEDs) encrypt/decrypt data written to and retrieved from them via a password-protected alphanumeric key (continuously encrypting and decrypting data).
Additionally, a 100% random write FIO test was run on the CM6 Series SSD, except that the namespace size was changed to 2.56TB. The results for this test were recorded. A second 100% random write FIO test was run on the CM6 Series SSD with the namespace size changed to 3.52TB. The results for this test were also recorded.
The steps and commands used to change the respective namespace sizes include:
Step 1: Delete the namespace that currently resides on the SSD:
(1) sudo nvme detach-ns /dev/nvme1 –n 1 ; (2) sudo nvme delete-ns /dev/nvme1 –n 1
Step 2: Create a 3.84 TB namespace and attach it sudo nvme create-ns /dev/nvme1
-s 7501476528
-c 7501476528 -b 512
sudo nvme attach-ns /dev/nvme1 -n1 -c1 | Create a 3.52 TB namespace and attach it* sudo nvme create-ns /dev/nvme1
-s 6875000000
-c 6875000000 -b 512
sudo nvme attach-ns /dev/nvme1 -n1 -c1 | Create a 3.2 TB namespace and attach it* sudo nvme create-ns /dev/nvme1
-s 6251233968
-c 6251233968 -b 512
sudo nvme attach-ns /dev/nvme1 -n1 -c1 | Create a 2.56 TB namespace and attach it* sudo nvme create-ns /dev/nvme1
-s 5000000000
-c 5000000000 -b 512
sudo nvme attach-ns /dev/nvme1 -n1 -c1 |
*The additional namespaces were tested by repeating Steps 1 and 2, but replacing the namespace parameter value so that the sectors match the desired namespace capacity6.
Test Results
The objective of these seven FIO tests was to demonstrate that a 1DWPD CM6 Series SSD can perform comparably in write performance to a 3DWPD CM6 Series SSD by using NVMe namespaces and reducing capacity. The throughput (in megabytes per second or MB/s) and random performance (in input/output operations per second or IOPS) were recorded.
Sequential Read/Write Operations: Read and write data of a specific size that is ordered one after the other from a Logical Block Address (LBA).
Random Read/Write/Mixed Operations: Read and write data of a specific size that is ordered randomly from an LBA.
Snapshot of Results:
Performance Test | 1st Test Run: 3.84TB Capacity 3.84TB Namespace Size | 2nd Test Run: 3.84TB Capacity 3.20TB Namespace Size | 3rd Test Run: 3.20TB Capacity 3.20TB Namespace Size |
100% Sequential Read Sustained, 128KB, QD16 | 6,971 MB/s | 6,952 MB/s | 6,972 MB/s |
100% Sequential Write Sustained, 128KB, QD16 | 4,246 MB/s | 4,246 MB/s | 4,245 MB/s |
100% Random Read Sustained, 4KB, QD32 | 1,549,202 IOPS | 1,548,940 IOPS | 1,549,470 IOPS |
6 To determine the number of sectors required for any size namespace, divide the required namespace size by the logical sector size. Using 2.56 TB as an example, 2.56 TB = 2.56 x 10^12B. Because many SSDs typically have a 512B logical sector size, divide (2.56 x 10^12B) by 512B, which equals 5,000,000,000 sectors.
100% Random Write Sustained, 4KB, QD32 | 173,067 IOPS | 337,920 IOPS | 354,666 IOPS |
70%/30% Random Mixed Sustained, 4KB, QD32 | 386,789 IOPS (R) +165,783 IOPS (W) 552,572 IOPS | 555,810 IOPS (R) +238,225 IOPS (W) 794,035 IOPS | 561,352 IOPS (R) +240,528 IOPS (W) 801,880 IOPS |
50%/50% Random Mixed Sustained, 4KB, QD32 | 170,515 IOPS (R) +170,448 IOPS (W) 340,963 IOPS | 321,712 IOPS (R) +321,757 IOPS (W) 643,469 IOPS | 325,993 IOPS (R) +325,987 IOPS (W) 651,980 IOPS |
30%/70% Random Mixed Sustained, 4KB, QD32 | 73,596 IOPS (R) +171,719 IOPS (W) 245,315 IOPS | 142,434 IOPS (R) +332,412 IOPS (W) 474,846 IOPS | 149,938 IOPS (R) +349,826 IOPS (W) 499,764 IOPS |
Tests 1 & 2: 100% Sequential Read / Write
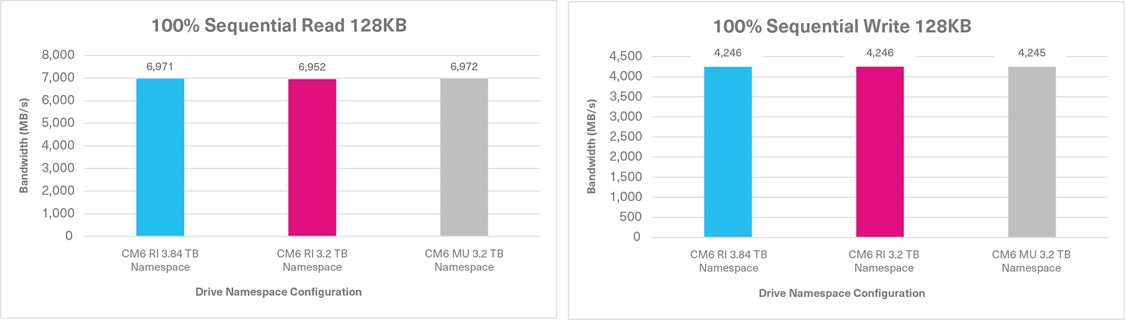
Tests 3 & 4: 100% Random Read / Write
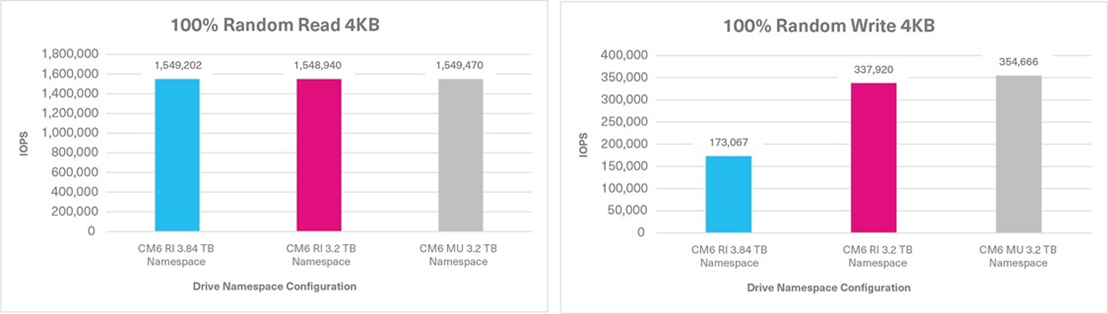
Test 5: Mixed Random - 70% Read / 30% Write
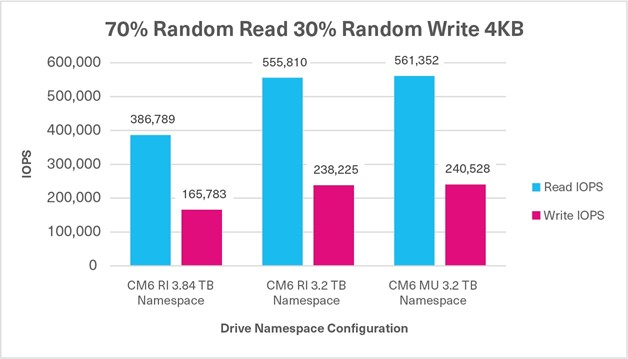
Test 6: Mixed Random - 50% Read / 50% Write
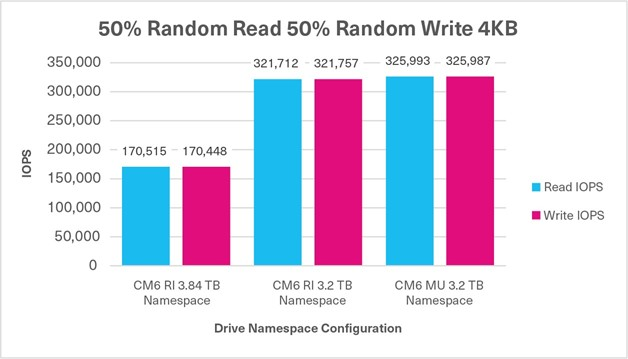
Test 7: Mixed Random - 30% Read / 70% Write
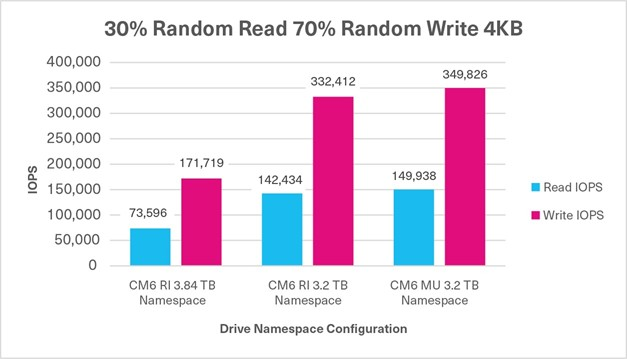
Additional Test: 100% Random Write Using 4 Namespace Sizes
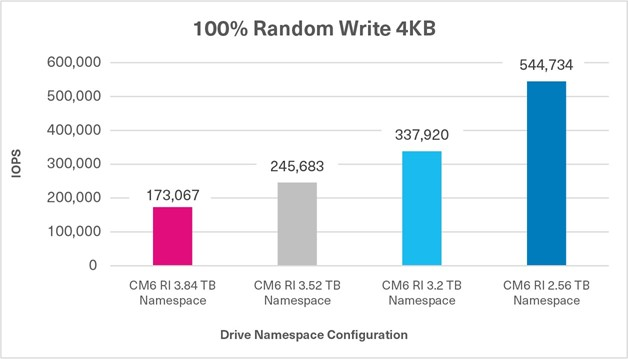
The objective of these 100% random write FIO tests was to demonstrate the increase in random write performance when using NVMe namespaces of different sizes, and reducing capacity. The random performance was recorded in IOPS.
Test Analysis
When a read or write operation is either 100% sequential or random, the performance differences between the three CM6 Series configurations were negligible based on the four FIO tests. However, when the three mixed FIO workloads were tested, the CM6 Series enabled the flash memory that was not provisioned for a namespace to be added back into the OP pool, and demonstrated higher write performance. Therefore, when provisioned with smaller namespaces, in conjunction with reducing the capacity requirements, the 3.84TB capacity, 1DWPD drive performed comparably to a 3.2TB capacity, 3DWPD drive as demonstrated by the test results. Though the 3.84TB capacity / 3.84TB CM6 Series SSD did not perform exactly to the CM6 Series 3.2TB capacity / 3.2TB namespace size SSD, the performance results were very close.
Also evident is a significant increase in the random write performance based on the allocated capacity given to a namespace, with the remaining unallocated capacity going into the OP pool courtesy of KIOXIA firmware. This enables users to have finer control over the capacity allocation for each application in conjunction with the write performance required from that presented storage namespace to the application.
ASSESSMENT: If a user requires higher write performance from their CM6 Series PCIe 4.0 enterprise NVMe SSD, using NVMe namespaces can achieve this objective.
Summary
Namespaces can be used to manage NVMe SSDs by setting the random write performance level to the desired requirement, as long as IT administration (or the user) is willing to give up some capacity. With the reality that today’s workloads are very mixed, the ability to adjust the random performance means that these mixed and I/O blender effect workloads can get maximum performance simply by giving up already unused capacity. Don’t let stranded, unused capacity go to waste when the random performance workload can be maximized!
If longer drive life is the desired objective, then using smaller namespaces to increase the OP pool is a very effective method to manage drives. Enabling these drives to be available for other applications and workloads maximizes the use of the resource as well as its life. However, the use of smaller namespaces to increase drive performance of 100% random write operations and mixed random workloads will show substantial benefit.
Additional CM6 Series SSD information is available here.
Trademarks
AMD EPYC is a trademark of Advanced Micro Devices, Inc. CentOS is a trademark of Red Hat, Inc. in the United States and other countries. Dell, Dell and PowerEdge are either registered trademarks or trademarks of Dell Inc. NVMe is a registered trademark of NVM Express, Inc. PCIe is a registered trademark of PCI-SIG. All other company names, product names and service names may be trademarks or registered trademarks of their respective companies.
Disclaimers
Information in this performance brief, including product specifications, tested content, and assessments are current and believed to be accurate as of the date that the document was published, but is subject to change without prior notice.
Technical and application information contained here is subject to the most recent applicable product specifications.