Accelerating Relational Database Workloads with 16G Dell PowerEdge R6625 Servers Equipped with PCIe 5.0 E3.S
Download PDFThu, 08 Feb 2024 02:28:42 -0000
|Read Time: 0 minutes
Summary
The latest 16G Dell PowerEdge R6625 servers support the PCIe 5.0 interface and the Enterprise and Datacenter Standard Form Factor (EDSFF) E3.S form factor. They deliver significant performance benefits and an improved system airflow that enhances heat dissipation. This can lead to less thermal throttling and increased lifespans for system components such as CPUs, memory and storage when compared with prior PCIe generations deployed with 2.5-inch1 form factor SSDs.
The purpose of this tech note is to present a generational server performance and power consumption comparison using PostgreSQL® relational database2 workloads. It compares 16G Dell PowerEdge R6625 PCIe 5.0 E3.S servers deployed with KIOXIA CM7-R Series E3.S enterprise NVMe SSDs with a previous generation system configuration.
The test results indicate that the latest 16G Dell PowerEdge R6625 servers deliver almost twice the relational database transactions using approximately the same amount of power when compared with the previous generation system.
Market positioning
Relational databases are vital to today’s data centers as they store an overwhelming amount of data captured on premises and at the edge of the network. Sales transactions and information relating to customers, vendors, products and financials represent key data.
IT teams need solutions that scale their data center storage platforms to better address large datasets and future growth. As these databases are dependent on fast underlying storage, one way to achieve high performance and scalability is by utilizing servers equipped with enterprise SSDs based on the latest PCIe 5.0 interface and the NVMe 2.0 protocol. The PCIe 5.0 revision can move data through the PCIe interface almost twice as fast when compared with the previous PCIe
4.0 generation. This enables SSDs to deliver input/output (I/O) even faster while requiring fewer servers to achieve the same level of performance.
With the recent availability of EDSFF SSDs, storage performance and total capacity per server can also increase. Servers with EDSFF E3.S slots deployed with E3.S SSDs deliver fast data throughput, fast input/output operations per second (IOPS) performance, low latency, high density and thermally optimized capabilities.
Product Features
Dell PowerEdge 6625 Rack Server (Figure 1)
Specifications: https://www.delltechnologies.com/asset/en-us/products/servers/technical-support/poweredge-r6625-spec- sheet.pdf.
Figure 1: Side angle of Dell PowerEdge 6625 Rack Server3
KIOXIA CM7 Series Enterprise NVMe SSD (Figure 2) Specifications:https://americas.kioxia.com/en-us/business/ssd/enterprise-ssd.html.
Figure 2: Front view of KIOXIA CM7 Series SSD4
PCIe 5.0 and NVMe 2.0 specification compliant; Two configurations: CM7-R Series (read intensive), 1 Drive Write Per Day5 (DWPD), up to 30,720 gigabyte6 (GB) capacities and CM7-V Series (higher endurance mixed use), 3 DWPD, up to 12,800 GB capacities.
Performance specifications: SeqRead = up to 14,000 MB/s; SeqWrite = up to 7,000 MB/s; RanRead = up to 2.7M IOPS; RanWrite = up to 600K IOPS.
Hardware/Software test configuration
The hardware and software equipment used in this virtualization comparison (Figure 3):
Server Information | ||
Server Model | Dell PowerEdge R6625 | Dell PowerEdge R6525 |
No. of Servers | 1 | 1 |
CPU Information | ||
CPU Model | AMD EPYC™ 9334 | AMD EPYC 7352 |
No. of Sockets | 2 | 2 |
No. of Cores | 32 | 24 |
Memory Information | ||
Memory Type | DDR5 | DDR4 |
Memory Speed (in megatransfers per second) | 4,800 MT/s | 3,200 MT/s |
Memory Size (in gigabytes) | 384 GB | 128 GB |
SSD Information | ||
SSD Model | KIOXIA CM7-R Series | KIOXIA CM6-R Series |
SSD Type | Read intensive | Read intensive |
Form Factor | E3.S | 2.5-inch (U.3) |
Interface | PCIe 5.0 x4 | PCIe 4.0 x4 |
Interface Speed (in gigatransfers per second) | 128 GT/s | 64 GT/s |
No. of SSDs | 4 | 4 |
SSD Capacity (in terabytes6) | 3.84 TB | 3.84 TB |
DWPD | 1 | 1 |
Active Power | up to 24 watts | up to 19 watts |
Operating System Information | ||
Operating System (OS) | Ubuntu® | Ubuntu |
OS Version | 22.04.2 | 22.04.2 |
Kernel | 5.15.0-76-generic | 5.15.0-76-generic |
RAID | RAID 57 | RAID 5 |
RAID Version | mdadm 4.2 | mdadm 4.2 |
Test Software Information | ||
Software | HammerDB8 | HammerDB |
Benchmark | TPROC-C9 | TPROC-C |
Version | 4.8 | 4.8 |
No. of Virtual Users | 128 | 128 |
Figure 3: Hardware/software configuration used in the comparison
For additional information regarding PostgreSQL relational database parameters and the OS tuning parameters used in this comparison, see Appendix A.
Set-up and test procedures
Set-up #1:
A Dell PowerEdge 6625 Rack Server was set-up with the Ubuntu 22.04.2 operating system.
Additional OS level parameters were adjusted to help increase system performance (to adjust these parameters, refer to Appendix A).
The system was rebooted.
Four 3.84 TB KIOXIA CM7 Series SSDs were placed in a RAID 5 set (via mdadm) to hold the PostgreSQL database in the server.
An XFS® file system was placed on top of the RAID 5 set and was mounted with noatime10 and discard11 flags. PostgreSQL relational database was installed in the server and the service was started.
HammerDB test software was installed on the server for the KIOXIA CM7 Series SSDs, enabling the TPROC-C online transaction processing (OLTP) workloads to run against the PostgreSQL database.
Set-up #2:
A Dell PowerEdge 6525 Rack Server was set-up with the Ubuntu 22.04.2 operating system.
Additional OS level parameters were adjusted to help increase system performance (to adjust these parameters, refer to Appendix A).
The system was rebooted.
Four 3.84 TB KIOXIA CM6 Series SSDs were placed in a RAID 5 set (via mdadm) to hold the PostgreSQL database in the server.
An XFS file system was placed on top of the RAID 5 set and was mounted with noatime and discard flags. PostgreSQL relational database was installed in the server and the service was started.
HammerDB test software was installed on the server for the KIOXIA CM6 Series SSDs, enabling the TPROC-C OLTP workloads to run against the PostgreSQL database.
Test procedures:
The following metrics were recorded when the TPROC-C workload was run against each configuration: Average Database Throughput
Average Drive Read Latency
Average Drive Write Latency Average Server Power Consumption
For each individual metric, three total runs were performed and the average of the three runs were calculated and compared with each configuration.
Test results12
Average Database Throughput (Figure 4).
This test measured how many transactions in the TPROC-C workload were executed per minute. The HammerDB software, executing the TPROC-C transaction profile, randomly performed new order, payment, order status, delivery and stock level transactions. The benchmark simulated an OLTP environment with a large number of users conducting simple and short transactions (that require sub-second response times and return relatively few records). Figure 4 shows the average database throughput from three test runs for each set of drives. The results are in transactions per minute (TPM)
- the higher result is better.
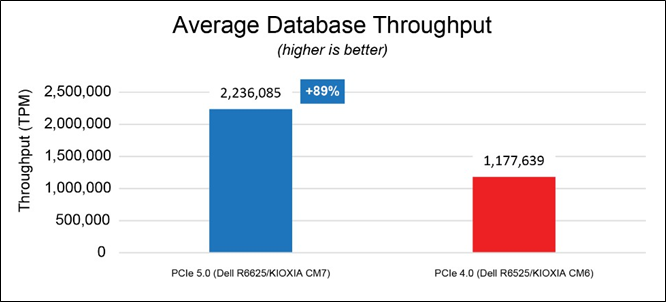
Figure 4: Average database throughput results
Average Read Latency (Figure 5).
This test measured drive read latency in milliseconds (ms) - the time it took to perform a drive read operation and included the time it took to complete the operation and receive a ‘successfully completed’ acknowledgement. These metrics were obtained from the drives while the database workload was running. Figure 5 shows the average read latency from three test runs for each set of drives - the lower result is better.
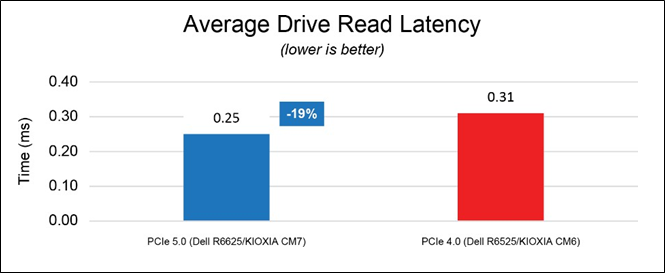
Figure 5: Average read latency results
Average Write Latency (Figure 6).
This test measured drive write latency in milliseconds (ms) - the time it took to perform a drive write operation and included the time it took to complete the operation and receive a ‘successfully completed’ acknowledgement. These metrics were obtained from the drives while the database workload was running. Figure 6 shows the average write latency from three test runs for each set of drives - the lower result is better.
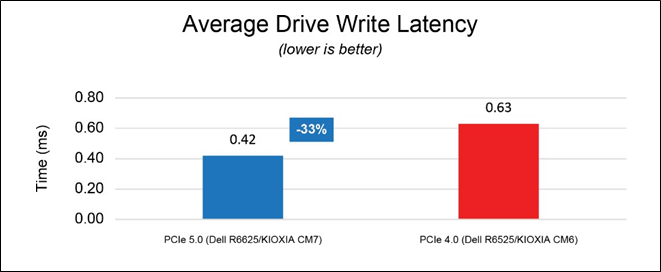
Figure 6: Average write latency results
Average Server Power Consumption (Figure 7).
This test measured the average amount of power drawn by each server system in its entirety including all of the individual components that run from the server’s power supply unit (PSU). This includes the motherboard, CPU, memory, storage and other server components. The following results in Figure 7 were obtained from the Integrated Dell Remote Access Controller (iDRAC) – the results are in watts (W).
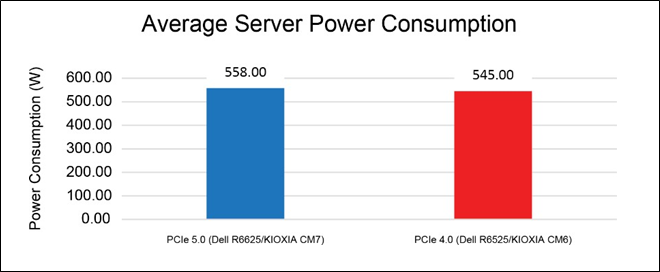
Figure 7: Average server power consumption results
Although the overall system power draw is slightly higher in the PCIe 5.0 configuration, the solution is able to maintain 89% higher database throughput, 19% lower read latency and 33% lower write latency on average.
From the Figure 7 results, database throughput per watt can be easily determined by dividing the average database throughput by the average server consumption as depicted in Figure 8 – the higher result is better.
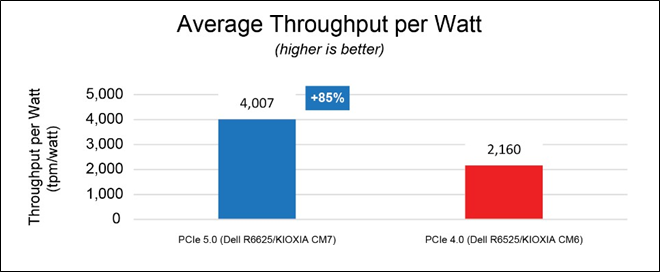
Figure 8: Average throughput per watt results
The PCIe 5.0 configuration was able to deliver 4,007 TPM per watt versus 2,160 TPM per watt delivered by the PCIe 4.0 configuration, nearly doubling database throughput per watt. At the data center level, these results enable administrators to use the same number of servers for nearly double the performance, or converse to this, scale the number of servers to help save on power consumption and total cost of ownership without sacrificing performance.
Final analysis
Next generation Dell PowerEdge 6625 Rack Servers deployed with KIOXIA CM7 Series PCIe 5.0 E3.S SSDs show nearly double the database performance when compared with a previous generation while lowering SSD latency by performing read/write operations faster. This system delivered 89% more transactions per minute enabling higher relational database workload densities while reducing the footprint of servers needed to service these workloads.
The Dell PowerEdge R6625 and KIOXIA CM7 Series SSD test configuration also demonstrated a comparable server power draw when compared with the previous generation test system. Though the active power increased from PCIe 4.0 to PCIe 5.0 by approximately 13 watts, the system was able to process almost twice as many transactions while consuming almost the same amount of power. As such, fewer servers are necessary to achieve the same level of performance without experiencing a power consumption spike.
The test results indicate that the latest 16G Dell PowerEdge 6625 Rack Servers deliver almost twice the relational database transactions using approximately the same amount of power when compared with prior PCIe generations.
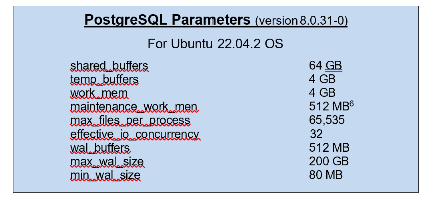
Appendix A – PostgreSQL Parameters / OS Tuning Parameters
The PostgreSQL parameters used for this comparison include:
Additional tuning parameters performed on the OS to optimize system performance were made to /etc/sysctl.conf files and
/etc/security/limits.conf files. The /etc/sysctl.conf files override OS default kernel parameter values while the
/etc/security/limits.conf files allow resource limits to be set. These tuning parameters include:
/etc/sysctl.conf file changes:
Parameter | Value |
vm.swappiness | 0 |
kernel.sem | 250 32000 100 128 |
fs.file-max | 6815744 |
net.core.rmem_default | 262144 |
net.core.rmem_max | 4194304 |
net.core.wmem_default | 262144 |
net.core.wmem_max | 1048576 |
fs.aio-max-nr | 1048576 |
vm.nr_hugepages | 35000 |
/etc/security/limits.conf file changes:
User | Values | ||
* | soft | nproc | 65535 |
* | hard | nproc | 65535 |
* | soft | nofile | 65535 |
* | hard | nofile | 65535 |
root | soft | nproc | 65535 |
root | hard | nproc | 65535 |
root | soft | nofile | 65535 |
root | hard | nofile | 65535 |
postgres | soft | memlock | 100000000 |
postgres | hard | memlock | 100000000 |
References
Footnotes
- 2.5-inch indicates the form factor of the SSD and not its physical size.
- PostgreSQL is a powerful, open source object-relational database system with over 35 years of active development and a reputation for reliability, feature robustness and performance.
- The product image shown is a representation of the design model and not an accurate product depiction.
- The product image shown was provided with permission from KIOXIA America, Inc. and is a representation of the design model and not an accurate product depiction.
- Drive Write Per Day (DWPD) means the drive can be written and re-written to full capacity once a day, every day for five years, the stated product warranty period. Actual results may vary due to system configuration, usage and other factors. Read and write speed may vary depending on the host device, read and write conditions and file size.
- Definition of capacity - KIOXIA Corporation defines a megabyte (MB) as 1,000,000 bytes, a gigabyte (GB) as 1,000,000,000 bytes and a terabyte (TB) as 1,000,000,000,000 bytes. A computer operating system, however, reports storage capacity using powers of 2 for the definition of 1Gbit = 230 bits = 1,073,741,824 bits, 1GB = 230 bytes = 1,073,741,824 bytes and 1TB = 240 bytes = 1,099,511,627,776 bytes and therefore shows less storage capacity. Available storage capacity (including examples of various media files) will vary based on file size, formatting, settings, software and operating system, and/or pre-installed software applications, or media content. Actual formatted capacity may vary.
- RAID 5 is a redundant array of independent disks configuration that uses disk striping with parity - Data and parity are striped evenly across all of the disks, so no single disk is a bottleneck.
- HammerDB is benchmarking and load testing software that is used to test popular databases. It simulates the stored workloads of multiple virtual users against specific databases to identify transactional scenarios and derive meaningful information about the data environment, such as performance comparisons.
- TPROC-C is the OLTP workload implemented in HammerDB derived from the TPC-C™ specification with modification to make running HammerDB straightforward and cost-effective on any of the supported database environments. The HammerDB TPROC-C workload is an open source workload derived from the TPC-C Benchmark Standard and as such is not comparable to published TPC-C results, as the results comply with a subset rather than the full TPC-C Benchmark Standard. TPROC-C means Transaction Processing Benchmark derived from the TPC "C" specification.
- The noatime option turns off access time recording so that the file system will ignore access time updates on files. If the file system is used for database workloads, specifying noatime can reduce writes to the file system.
- The discard option allows the file system to inform the underlying block device to issue a TRIM command when blocks are longer used. KIOXIA makes no warranties regarding the test results and performance can vary due to system configuration usage and other factors.
- Read and write speed may vary depending on the host device, read and write conditions and file size.
Trademarks
AMD EPYC and combinations thereof are trademark of Advanced Micro Devices, Inc. Dell and PowerEdge are registered trademarks or trademarks of Dell Inc.
NVMe is a registered or unregistered trademark of NVM Express, Inc. in the United States and other countries. PCIe is a registered trademark of PCI-SIG.
PostgreSQL is a registered trademark of the PostgreSQL Community Association of Canada.
All other company names, product names and service names may be trademarks or registered trademarks of their respective companies.
TPC-C is a trademark of the Transaction Processing Performance Council. All other company names, product names and service names may be trademarks or registered trademarks of their respective companies.
Ubuntu is a registered trademark of Canonical Ltd.
XFS is a registered trademark of Silicon Graphics International Corp. or its subsidiaries in the United States and/or other countries.
All other company names, product names and service names may be trademarks or registered trademarks of their respective companies.
Disclaimers
© 2023 Dell, Inc. All rights reserved. Information in this tech note, including product specifications, tested content, and assessments are current and believed to be accurate as of the date that the document was published and subject to change without prior notice. Technical and application information contained here is subject to the most recent applicable product specifications.
Related Documents
Dell Next Generation PowerEdge Servers: Designed for PCIe Gen4 to Deliver Future Ready Bandwidth
Tue, 17 Jan 2023 00:18:59 -0000
|Read Time: 0 minutes
Summary
PCIe is the primary interface for connecting various peripherals in a server. The Next Generation of Dell PowerEdge servers have been designed keeping PCIe Gen4 in mind. PCIe Gen4 effectively doubles the throughput available per lane compared to PCIe Gen3.
The PCIe Interface
PCIe (Peripheral Component Interconnect Express) is a high- speed bus standard interface for connecting various peripherals to the CPU. This standard is maintained and developed by the PCI- SIG (PCI-Special Interest Group), a group of more than 900 companies. In today’s world of servers, PCIe is primary interface for connecting peripherals. It has numerous advantages over the earlier standards, being faster, more robust and very flexible. These advantages have cemented the importance of PCIe.
PCIe Gen 3 was the third major iteration of this standard. Dell PowerEdge 14G systems were designed keeping PCIe Gen 3 in min PCIe Gen3 can carry a bit rate of 8 Gigatransfers per second (GT/s). After considering the overhead of the encoding scheme, this works out to an effective delivery of 985 MB/s per lane, in each direction. A PCIe Gen3 slot with 8 lanes (x8) can have a total bandwidth of 7.8 GB/s.
PCIe Gen 4 is the fourth major iteration of the PCIe standard. This generation doubles the throughput per lane to 16 GT/s. This works out to an effective throughput of 1.97 GB/s per lane in each direction, and 15.75GB/s for a x8 PCIe Gen4 slot.
Designing for PCIe Gen4
The Next Generation of Dell PowerEdge servers were designed with a new PSU Layout. One of the key reasons this was done was to simplify enabling PCIe Gen4. A key element in PCIe performance is the length of PCIe traces. With the new system layout, a main goal was to shorten the overall PCIe trace lengths in the topology, including traces in the motherboard. By positioning PSU’s at both edges, the I/O traces to connectors can be shortened for both processors. This is the optimal physical layout for PCIe Gen 4 and will enable even faster speeds for future platforms. The shorter PCIe traces translate into better system costs and improved Signal Integrity for more reliable performance across a broad variety of customer applications. Another advantage of the split PSU is the balanced airflow that results. The split PSU layout helps to balance the system airflow, reduce PSU operating temperatures, and allows for PCIe Gen4 card support and thus an overall more optimal system design layout.
Figure 1 - Figures showing the 14G server layout to the left and the balanced airflow of the next gen Dell PowerEdge platforms to the right.
2nd and 3rd Gen AMD EPYC™ Processors
Next Generation Dell PowerEdge servers with AMD processors are designed for PCIe Gen4. The 2nd and 3rd Generation AMD EPYC processors support the PCIe Gen4 standard allowing for the maximum utilization of this available bandwidth. A single socket 2nd or 3rd Gen AMD EPYC processors have 128 available PCIe Gen4 lanes for use. This allows for great flexibility in design. 128 lanes also give plenty of bandwidth for many peripherals to take advantage of the high core count CPUs.
The dual socket platform offers an additional level of flexibility to system designers. In the standard configuration, 128 PCIe Gen4 lanes are available for peripherals. The rest of the lanes are used for inter-socket communication. Some of these inter-socket xGMI2 lanes can be repurposed to add an additional 32 lanes. This gives a total of 160 PCIe Gen4 lanes for peripherals (Figure 2). This flexibility allows for a wide variety of configurations and maximum CPU-peripheral bandwidth.
Figure 2 - Diagram showing PCIe lanes in a 2-socket configuration
3rd Gen Intel® Xeon® Scalable Processors
Intel highlighted that the next generation of processors will deliver performance-optimized features for a range of key workloads. Increased memory bandwidth, a new high-performance Sunny Cove core architecture, increased processor core count and support for PCIe Gen4 will enhance performance across different disciplines, including life sciences, material science and weather modeling. These processors will be available throughout the Intel products found within the PowerEdge portfolio of servers.
Conclusion
PowerEdge servers continue to deliver best-in-class features. The new PowerEdge servers have support for the higher speed PCIe Gen4, with innovative designs to improve signal integrity and chassis airflow.
Using NVMe Namespaces to Increase Performance in a Dell PowerEdge R7525 Server
Mon, 16 Jan 2023 23:10:15 -0000
|Read Time: 0 minutes
Summary
This document summarizes how NVMe namespaces can be used to increase performance in Dell PowerEdge R7525 servers using KIOXIA CM6 Series NVMe enterprise SSDs.
All performance and characteristics discussed are based on performance testing conducted in KIOXIA America, Inc. application labs.
Results are accurate as of September 1, 2022
Introduction
A key goal of IT administrators is to deliver fast storage device performance to end- users in support of the many applications and workloads they require. With this objective, many data center infrastructures have either transitioned to, or are transitioning to, NVMe storage devices, given the very fast read and write capabilities they possess. Selecting the right NVMe SSD for a specific application workload or for many application workloads is not always a simple process because user requirements can vary depending on the virtual machines (VMs) and containers for which they are deployed. User needs can also dynamically change due to workload complexities and other aspects of evolving application requirements. Given these volatilities, it can be very expensive to replace NVMe SSDs to meet the varied application workload requirements.
To achieve even higher write performance from already speedy PCIe® 4.0 enterprise SSDs, using NVMe namespaces is a viable solution. Using namespaces can also deliver additional benefits such as better utilization of a drive’s unused capacity and increased performance of random write workloads. The mantra, ‘don’t let stranded, unused capacity go to waste when random performance can be maximized,’ is a focus of this performance brief.
Random write SSD performance effect on I/O blender workloads
The term ‘I/O blender’ refers to a mix of different workloads originating from a single application or multiple applications on a physical server within bare-metal systems or virtualized / containerized environments. VMs and containers are typically the originators of I/O blender workloads.
When an abundance of applications run simultaneously in VMs or containers, both sequential and random data input/output (I/O) streams are sent to SSDs. Any sequential I/O that exists at that point is typically mixed in with all of the other I/O streams and essentially becomes random read/write workloads. As multiple servers and applications process these workloads and move data at the same time, the SSD activity changes from just sequential or random read/write workloads into a large mix of random read/write I/Os - the I/O blender effect.
As almost all workloads become random mixed, an increase in random write performance can have a large impact on the I/O blender effect in virtualized and containerized environments.
The I/O blender effect can come into play at any time where multiple VMs and/or containers run on a system. Even if a server is deployed for a single application, the I/O written to the drive can still be highly mixed with respect to I/O size and randomness. Today’s workload paradigm is to use servers for multiple applications, not just for a single application. This is why most modern servers are deployed for virtualized or containerized environments. It is in these modern infrastructures where the mix of virtualized and containerized workloads creates the I/O blender effect, and is therefore applicable to almost every server that ships today. Supporting details include a description of the test criteria, the set-up and associated test procedures, a visual representation of the test results, and a test analysis.
Addressing the I/O blender effect
Under mixed workloads, some I/O processes that typically would have been sequential in isolation become random. This can increase SSD read/write activity, as well as latency (or the ability to access stored data). One method used to address the I/O blender effect involves allocating more SSD capacity for overprovisioning (OP).
Overprovisioning
Overprovisioning means that an SSD has more flash memory than its specified user capacity, also known as the OP pool. The SSD controller uses the additional capacity to perform various background functions (transparent to the host) such as flash translation layer (FTL) management, wear leveling, and garbage collection (GC). GC, in particular, reclaims unused storage space which is very important for large write operations.
The OP pool is also very important for random write operations. The more random the data patterns are, the more it allows the extra OP to provide space for the controller to place new data for proper wear leveling and reduce write amplification (while handling data deletions and clean up in the background). In a data center, SSDs are rarely used for only one workload pattern. Even if the server is dedicated to a single application, other types of data can be written to a drive, such as logs or peripheral data that may be contrary to the server’s application workload. As a result, almost all SSDs perform random workloads. The more write-intensive the workload is, the more OP is needed on the SSD to maintain maximum performance and efficiency
Namespaces
Namespaces divide an NVMe SSD into logically separate and individually addressable storage spaces where each namespace has its own I/O queue. Namespaces appear as a separate SSD to the connected host that interacts with them as it would with local or shared NVMe targets. They function similarly to a partition, but at the hardware level as a separate device. Namespaces are developed at the controller level and have the included benefit of dedicated I/O queues that may provide improved Quality of Service (QoS) at a more granular level.
With the latest firmware release of KIOXIA CM6 Series PCIe 4.0 enterprise NVMe SSDs, flash memory that is not provisioned for a namespace is added back into the OP pool, which in turn, enables higher write performance for mixed workloads. To validate this methodology, testing was performed using a CM6 Series 3.84 terabyte1 (TB), 1 Drive Write Per Day2 (DWPD) SSD, provisioned with smaller namespaces (equivalent to a CM6 Series 3.2TB 3DWPD model). As large OP pools impact performance, CM6 Series SSDs can be set to a specific performance or capacity metric desired by the end user. By using namespaces and reducing capacity, a 1DWPD CM6 Series SSD can perform comparably in write performance to a 3DWPD CM6 Series SSD, as demonstrated by the test results.
1 Definition of capacity - KIOXIA Corporation defines a kilobyte (KB) as 1,000 bytes, a megabyte (MB) as 1,000,000 bytes, a gigabyte (GB) as 1,000,000,000 bytes and a terabyte (TB) as 1,000,000,000,000 bytes. A computer operating system, however, reports storage capacity using powers of 2 for the definition of 1Gbit = 230 bits = 1,073,741,824 bits, 1GB = 230 bytes = 1,073,741,824 bytes and 1TB = 240 bytes = 1,099,511,627,776 bytes and therefore shows less storage capacity. Available storage capacity (including examples of various media files) will vary based on file size, formatting, settings, software and operating system, and/or pre-installed software applications, or media content. Actual formatted capacity may vary.
2 Drive Write(s) per Day: One full drive write per day means the drive can be written and re-written to full capacity once a day, every day, for the specified lifetime. Actual results may vary due to system configuration, usage, and other factors.
Testing Methodology
To validate the performance comparison, benchmark tests were conducted by KIOXIA in a lab environment that compared the performance of three CM6 Series SSD configurations in a PowerEdge server with namespace sizes across the classic four-corner performance tests and three random mixed-use tests. This included a CM6 Series SSD with
3.84TB capacity, 1DWPD and 3.84TB namespace size, a CM6 Series SSD with 3.84TB capacity, 1DWPD and a namespace adjustment to a smaller 3.20TB size, and a CM6 Series SSD with 3.20TB capacity, 3DWPD and 3.20TB namespace size to which to compare the smaller namespace adjustment.
The seven performance tests were run through Flexible I/O (FIO) software3 which is a tool that provides a broad spectrum of workload tests with results that deliver the actual raw performance of the drive itself. This included 100% sequential read/write throughput tests, 100% random read/write IOPS tests, and three mixed random IOPS tests (70%/30%, 50%/50% and 30%/70% read/write ratios). These ratios were selected as follows:
- 70%R / 30%W: represents a typical VM workload
- 50%R / 50%W: represents a common database workload
- 30%R / 70%W: represents a write-intensive workload (common with log servers)
In addition to these seven tests, 100% random write IOPS tests were performed on varying namespace capacity sizes to illustrate the random write performance gain that extra capacity in the OP pool provides. The additional namespace capacities tested included a CM6 Series SSD with 3.84TB capacity, 1DWPD and two namespace adjustments (2.56TB and 3.52TB).
A description of the test criteria, set-up, execution procedures, results and analysis are presented. The test results represent the probable outcomes that three different namespace sizes and associated capacity reductions have on four- corner performance and read/write mixes (70%/30%, 50%/50% and 30%/70%). There are additional 100% random write test results of four different namespace sizes when running raw FIO workloads with a CM6 Series 3.84TB, 1DWPD SSD and equipment as outlined below.
Test Criteria:
The hardware and software equipment used for the seven performance tests included:
- Dell PowerEdge R7525 Server: One (1) dual socket server with two (2) AMD EPYC 7552 processors, featuring 48 processing cores, 2.2 GHz frequency, and 256 gigabytes1 (GB) of DDR4
- Operating System: CentOS v8.4.2105 (Kernel 4.18.0-305.12.1.el8_4.x86_64)
- Application: FIO v3.19
- Test Software: Synthetic tests run through FIO v3.19 test software
- Storage Devices (Table 1):
- One (1) KIOXIA CM6 Series PCIe 4.0 enterprise NVMe SSD with 3.84 TB capacity (1DWPD)
- One (1) KIOXIA CM6 Series PCIe 4.0 enterprise NVMe SSD with 3.2 TB capacity (3DWPD)
3 Flexible I/O (FIO) is a free and open source disk I/O tool used both for benchmark and stress/hardware verification. The software displays a variety of I/O performance results, including complete I/O latencies and percentiles.
Set-up & Test Procedures
Set-up: The test system was configured using the hardware and software equipment outlined above. The server was configured with a CentOS v8.4 operating system and FIO v3.19 test software.
Tests Conducted
Test | Measurement | Block Size |
100% Sequential Read | Throughput | 128 kilobytes1 (KB) |
100% Sequential Write | Throughput | 128KB |
100% Random Read | IOPS | 4KB |
100% Random Write | IOPS | 4KB |
70%R/30%W Random | IOPS | 4KB |
50%R/50%W Random | IOPS | 4KB |
30%R/70%W Random | IOPS | 4KB |
Test Configurations
Product | Focus | SSD Type | Capacity Size | Namespace Size |
CM6 Series | Read-intensive | Sanitize Instant Erase4 (SIE) | 3.84TB | 3.84TB |
CM6 Series | Read-intensive | SIE | 3.84TB | 3.52TB |
CM6 Series | Read-intensive | SIE | 3.84TB | 3.20TB |
CM6 Series | Read-intensive | SIE | 3.84TB | 2.56TB |
CM6 Series | Mixed-use | SIE | 3.20TB | 3.20TB |
Note: The SIE drives used for testing have no performance differences versus CM6 Series Self-Encrypting Drives5 (SEDs) or those without encryption, and their selection was based on test equipment availability at the time of testing.
Utilizing FIO software, the first set of seven tests were run on a CM6 Series SSD with 3.84TB capacity, 1DWPD and
3.84TB namespace size. The results were recorded.
The second set of seven FIO tests were then run on the same CM6 Series SSD, except that the namespace size was changed to 3.2TB to represent the namespace size of the third SSD to be tested against - the 3DWPD CM6 Series SSD with 3.2TB capacity, 3DWPD and 3.2TB namespace size. The results for these tests were recorded.
The third set of seven FIO tests were then run on the CM6 Series SSD with 3.2TB capacity, 3DWPD and 3.2TB namespace size, and the performance that the CM6 Series SSD (3.84TB capacity, 1DWPD, 3.84TB namespace size) is trying to achieve. The results for these tests were recorded.
4 Sanitize Instant Erase (SIE) drives are compatible with the Sanitize device feature set, which is the standard prescribed by NVM Express, Inc. It was first introduced in the NVMe v1.3 specification and improved in the NVMe v1.4 specification, and by the T10 (SAS) and T13 (SATA) committees of the American National Standards Institute (ANSI).
5 Self-Encrypting Drives (SEDs) encrypt/decrypt data written to and retrieved from them via a password-protected alphanumeric key (continuously encrypting and decrypting data).
Additionally, a 100% random write FIO test was run on the CM6 Series SSD, except that the namespace size was changed to 2.56TB. The results for this test were recorded. A second 100% random write FIO test was run on the CM6 Series SSD with the namespace size changed to 3.52TB. The results for this test were also recorded.
The steps and commands used to change the respective namespace sizes include:
Step 1: Delete the namespace that currently resides on the SSD:
(1) sudo nvme detach-ns /dev/nvme1 –n 1 ; (2) sudo nvme delete-ns /dev/nvme1 –n 1
Step 2: Create a 3.84 TB namespace and attach it sudo nvme create-ns /dev/nvme1
-s 7501476528
-c 7501476528 -b 512
sudo nvme attach-ns /dev/nvme1 -n1 -c1 | Create a 3.52 TB namespace and attach it* sudo nvme create-ns /dev/nvme1
-s 6875000000
-c 6875000000 -b 512
sudo nvme attach-ns /dev/nvme1 -n1 -c1 | Create a 3.2 TB namespace and attach it* sudo nvme create-ns /dev/nvme1
-s 6251233968
-c 6251233968 -b 512
sudo nvme attach-ns /dev/nvme1 -n1 -c1 | Create a 2.56 TB namespace and attach it* sudo nvme create-ns /dev/nvme1
-s 5000000000
-c 5000000000 -b 512
sudo nvme attach-ns /dev/nvme1 -n1 -c1 |
*The additional namespaces were tested by repeating Steps 1 and 2, but replacing the namespace parameter value so that the sectors match the desired namespace capacity6.
Test Results
The objective of these seven FIO tests was to demonstrate that a 1DWPD CM6 Series SSD can perform comparably in write performance to a 3DWPD CM6 Series SSD by using NVMe namespaces and reducing capacity. The throughput (in megabytes per second or MB/s) and random performance (in input/output operations per second or IOPS) were recorded.
Sequential Read/Write Operations: Read and write data of a specific size that is ordered one after the other from a Logical Block Address (LBA).
Random Read/Write/Mixed Operations: Read and write data of a specific size that is ordered randomly from an LBA.
Snapshot of Results:
Performance Test | 1st Test Run: 3.84TB Capacity 3.84TB Namespace Size | 2nd Test Run: 3.84TB Capacity 3.20TB Namespace Size | 3rd Test Run: 3.20TB Capacity 3.20TB Namespace Size |
100% Sequential Read Sustained, 128KB, QD16 | 6,971 MB/s | 6,952 MB/s | 6,972 MB/s |
100% Sequential Write Sustained, 128KB, QD16 | 4,246 MB/s | 4,246 MB/s | 4,245 MB/s |
100% Random Read Sustained, 4KB, QD32 | 1,549,202 IOPS | 1,548,940 IOPS | 1,549,470 IOPS |
6 To determine the number of sectors required for any size namespace, divide the required namespace size by the logical sector size. Using 2.56 TB as an example, 2.56 TB = 2.56 x 10^12B. Because many SSDs typically have a 512B logical sector size, divide (2.56 x 10^12B) by 512B, which equals 5,000,000,000 sectors.
100% Random Write Sustained, 4KB, QD32 | 173,067 IOPS | 337,920 IOPS | 354,666 IOPS |
70%/30% Random Mixed Sustained, 4KB, QD32 | 386,789 IOPS (R) +165,783 IOPS (W) 552,572 IOPS | 555,810 IOPS (R) +238,225 IOPS (W) 794,035 IOPS | 561,352 IOPS (R) +240,528 IOPS (W) 801,880 IOPS |
50%/50% Random Mixed Sustained, 4KB, QD32 | 170,515 IOPS (R) +170,448 IOPS (W) 340,963 IOPS | 321,712 IOPS (R) +321,757 IOPS (W) 643,469 IOPS | 325,993 IOPS (R) +325,987 IOPS (W) 651,980 IOPS |
30%/70% Random Mixed Sustained, 4KB, QD32 | 73,596 IOPS (R) +171,719 IOPS (W) 245,315 IOPS | 142,434 IOPS (R) +332,412 IOPS (W) 474,846 IOPS | 149,938 IOPS (R) +349,826 IOPS (W) 499,764 IOPS |
Tests 1 & 2: 100% Sequential Read / Write
Tests 3 & 4: 100% Random Read / Write
Test 5: Mixed Random - 70% Read / 30% Write
Test 6: Mixed Random - 50% Read / 50% Write
Test 7: Mixed Random - 30% Read / 70% Write
Additional Test: 100% Random Write Using 4 Namespace Sizes
The objective of these 100% random write FIO tests was to demonstrate the increase in random write performance when using NVMe namespaces of different sizes, and reducing capacity. The random performance was recorded in IOPS.
Test Analysis
When a read or write operation is either 100% sequential or random, the performance differences between the three CM6 Series configurations were negligible based on the four FIO tests. However, when the three mixed FIO workloads were tested, the CM6 Series enabled the flash memory that was not provisioned for a namespace to be added back into the OP pool, and demonstrated higher write performance. Therefore, when provisioned with smaller namespaces, in conjunction with reducing the capacity requirements, the 3.84TB capacity, 1DWPD drive performed comparably to a 3.2TB capacity, 3DWPD drive as demonstrated by the test results. Though the 3.84TB capacity / 3.84TB CM6 Series SSD did not perform exactly to the CM6 Series 3.2TB capacity / 3.2TB namespace size SSD, the performance results were very close.
Also evident is a significant increase in the random write performance based on the allocated capacity given to a namespace, with the remaining unallocated capacity going into the OP pool courtesy of KIOXIA firmware. This enables users to have finer control over the capacity allocation for each application in conjunction with the write performance required from that presented storage namespace to the application.
ASSESSMENT: If a user requires higher write performance from their CM6 Series PCIe 4.0 enterprise NVMe SSD, using NVMe namespaces can achieve this objective.
Summary
Namespaces can be used to manage NVMe SSDs by setting the random write performance level to the desired requirement, as long as IT administration (or the user) is willing to give up some capacity. With the reality that today’s workloads are very mixed, the ability to adjust the random performance means that these mixed and I/O blender effect workloads can get maximum performance simply by giving up already unused capacity. Don’t let stranded, unused capacity go to waste when the random performance workload can be maximized!
If longer drive life is the desired objective, then using smaller namespaces to increase the OP pool is a very effective method to manage drives. Enabling these drives to be available for other applications and workloads maximizes the use of the resource as well as its life. However, the use of smaller namespaces to increase drive performance of 100% random write operations and mixed random workloads will show substantial benefit.
Additional CM6 Series SSD information is available here.
Trademarks
AMD EPYC is a trademark of Advanced Micro Devices, Inc. CentOS is a trademark of Red Hat, Inc. in the United States and other countries. Dell, Dell and PowerEdge are either registered trademarks or trademarks of Dell Inc. NVMe is a registered trademark of NVM Express, Inc. PCIe is a registered trademark of PCI-SIG. All other company names, product names and service names may be trademarks or registered trademarks of their respective companies.
Disclaimers
Information in this performance brief, including product specifications, tested content, and assessments are current and believed to be accurate as of the date that the document was published, but is subject to change without prior notice.
Technical and application information contained here is subject to the most recent applicable product specifications.