


OneFS Diagnostics

In addition to the /usr/bin/isi_gather_info tool, OneFS also provides both a GUI and a common ‘isi’ CLI version of the tool – albeit with slightly reduced functionality. This means that a OneFS log gather can be initiated either from the WebUI, or by using the ‘isi diagnostics’ CLI command set with the following syntax:
# isi diagnostics gather start
The diagnostics gather status can also be queried as follows:
# isi diagnostics gather status
Gather is running.
When the command has completed, the gather tarfile can be found under /ifs/data/Isilon_Support.
You can also view and modify the ‘isi diagnostics’ configuration as follows:
# isi diagnostics gather settings view
                Upload: Yes
                  ESRS: Yes
         Supportassist: Yes
           Gather Mode: full
  HTTP Insecure Upload: No
      HTTP Upload Host:
      HTTP Upload Path:
     HTTP Upload Proxy:
HTTP Upload Proxy Port: -
            Ftp Upload: Yes
       Ftp Upload Host: ftp.isilon.com
       Ftp Upload Path: /incoming
      Ftp Upload Proxy:
 Ftp Upload Proxy Port: -
       Ftp Upload User: anonymous
   Ftp Upload Ssl Cert:
   Ftp Upload Insecure: No
The configuration options for the ‘isi diagnostics gather’ CLI command include:
Option | Description |
–upload <boolean> | Enable gather upload. |
–esrs <boolean> | Use ESRS for gather upload. |
–gather-mode (incremental | full) | Type of gather: incremental, or full. |
–http-insecure-upload <boolean> | Enable insecure HTTP upload on completed gather. |
–http-upload-host <string> | HTTP Host to use for HTTP upload. |
–http-upload-path <string> | Path on HTTP server to use for HTTP upload. |
–http-upload-proxy <string> | Proxy server to use for HTTP upload. |
–http-upload-proxy-port <integer> | Proxy server port to use for HTTP upload. |
–clear-http-upload-proxy-port | Clear proxy server port to use for HTTP upload. |
–ftp-upload <boolean> | Enable FTP upload on completed gather. |
–ftp-upload-host <string> | FTP host to use for FTP upload. |
–ftp-upload-path <string> | Path on FTP server to use for FTP upload. |
–ftp-upload-proxy <string> | Proxy server to use for FTP upload. |
–ftp-upload-proxy-port <integer> | Proxy server port to use for FTP upload. |
–clear-ftp-upload-proxy-port | Clear proxy server port to use for FTP upload. |
–ftp-upload-user <string> | FTP user to use for FTP upload. |
–ftp-upload-ssl-cert <string> | Specifies the SSL certificate to use in FTPS connection. |
–ftp-upload-insecure <boolean> | Whether to attempt a plain text FTP upload. |
–ftp-upload-pass <string> | FTP user to use for FTP upload password. |
–set-ftp-upload-pass | Specify the FTP upload password interactively. |
As mentioned above, ‘isi diagnostics gather’ does not present quite as broad an array of features as the isi_gather_info utility. This is primarily for security purposes, because ‘isi diagnostics’ does not require root privileges to run. Instead, a user account with the ‘ISI_PRIV_SYS_SUPPORT’ RBAC privilege is needed in order to run a gather from either the WebUI or ‘isi diagnostics gather’ CLI interface.
When a gather is running, a second instance cannot be started from any other node until that instance finishes. Typically, a warning similar to the following appears:
"It appears that another instance of gather is running on the cluster somewhere. If you would like to force gather to run anyways, use the --force-multiple-igi flag. If you believe this message is in error, you may delete the lock file here: /ifs/.ifsvar/run/gather.node."
You can remove this lock as follows:
# rm -f /ifs/.ifsvar/run/gather.node
You can also initiate a log gather from the OneFS WebUI by navigating to Cluster management > Diagnostics > Gather:
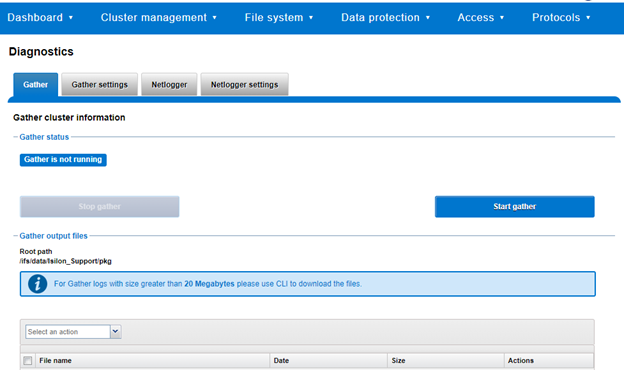
The WebUI also uses the ‘isi diagnostics’ platform API handler and so, like the CLI command, also offers a subset of the full isi_gather_info functionality.
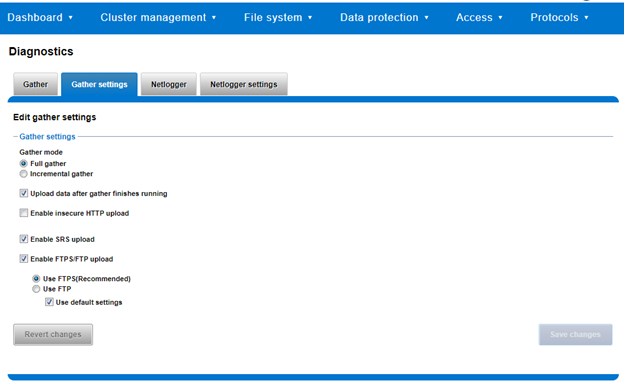
A limited menu of configuration options is also available in the WebUI, under Cluster management > Diagnostics > Gather settings:
Also contained within the OneFS diagnostics command set is the ‘isi diagnostics netlogger’ utility. Netlogger captures IP traffic over a period of time for network and protocol analysis.
Under the hood, netlogger is a Python wrapper around the ubiquitous tcpdump utility, and can be run either from the OneFS command line or WebUI.
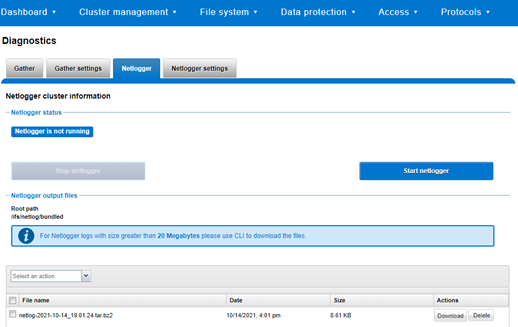
For example, from the WebUI, browse to Cluster management > Diagnostics > Netlogger:
Alternatively, from the OneFS CLI, the isi_netlogger command captures traffic on the interface (‘–interfaces’) over a timeout period of minutes (‘–duration’), and stores a specified number of log files (‘–count’).
Here’s the basic syntax of the CLI utility:
 # isi diagnostics netlogger start
        [--interfaces <str>]
        [--count <integer>]
        [--duration <duration>]
        [--snaplength <integer>]
        [--nodelist <str>]
        [--clients <str>]
        [--ports <str>]
        [--protocols (ip | ip6 | arp | tcp | udp)]
        [{--help | -h}]
Note that using the ‘-b’ bpf buffer size option will temporarily change the default buffer size while netlogger is running.
To display help text for netlogger command options, specify 'isi diagnostics netlogger start -h'. The command options include:
Netlogger Option | Description |
–interfaces <str> | Limit packet collection to specified network interfaces. |
–count <integer> | The number of packet capture files to keep after they reach the duration limit. Defaults to the latest 3 files. 0 is infinite. |
–duration <duration> | How long to run the capture before rotating the capture file. Default is 10 minutes. |
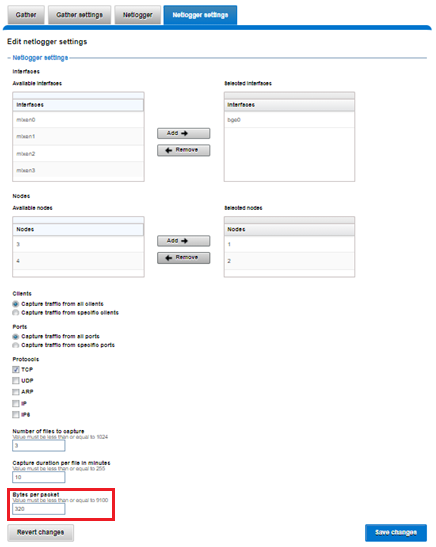
–snaplength <integer> | The maximum amount of data for each packet that is captured. Default is 320 bytes. Valid range is 64 to 9100 bytes. |
–nodelist <str> | List of nodes specified by LNN on which to run the capture. |
–clients <str> | Limit packet collection to specified Client hostname / IP addresses. |
–ports <str> | Limit packet collection to specified TCP or UDP ports. |
–protocols (ip | ip6 | arp | tcp | udp) | Limit packet collection to specified protocols. |
Netlogger’s log files are stored by default under /ifs/netlog/<node_name>.
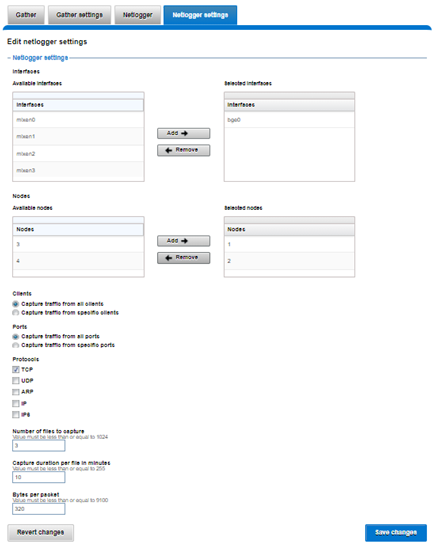
You can also use the WebUI to configure the netlogger parameters under Cluster management > Diagnostics > Netlogger settings:
Be aware that specifying ‘isi diagnostics netlogger’ can consume significant cluster resources. When running the tool on a production cluster, be aware of the effect on the system.
When the command has completed, the capture file(s) are stored under:
# /ifs/netlog/[nodename]
You can also use the following command to incorporate netlogger output files into a gather_info bundle:
# isi_gather_info -n [node#] -f /ifs/netlog
To capture on multiple nodes of the cluster, you can prefix the netlogger command by the versatile isi_for_array utility. For example:
# isi_for_array –s ‘isi diagnostics netlogger --nodelist 2,3 --timeout 5 --snaplength 256’
This command syntax creates five minute incremental files on nodes 2 and 3, using a snaplength of 256 bytes, which captures the first 256 bytes of each packet. These five-minute logs are kept for about three days. The naming convention is of the form netlog-<node_name>-<date>-<time>.pcap. For example:
# ls /ifs/netlog/tme_h700-1
netlog-tme_h700-1.2022-09-02_10.31.28.pcap
When using netlogger, set the ‘–snaplength’ option appropriately, depending on the protocol, in order to capture the right amount of detail in the packet headers and/or payload. Or, if you want the entire contents of every packet, use a value of zero (‘–snaplength 0’).
The default snaplength for netlogger is to capture 320 bytes per packet, which is typically sufficient for most protocols.
However, for SMB, a snaplength of 512 is sometimes required. Note that depending on a node’s traffic quantity, a snaplength of 0 (that is: capture whole packet) can potentially overwhelm the network interface driver.
All the output gets written to files under /ifs/netlog directory, and the default capture time is ten minutes (‘–duration 10’).
You can apply filters to constrain traffic to/from certain hosts or protocols. For example, to limit output to traffic between client 10.10.10.1 and the cluster node:
# isi diagnostics netlogger --duration 5 --snaplength 256 --clients 10.10.10.1
Or to capture only NFS traffic, filter on port 2049:
# isi diagnostics netlogger --ports 2049
Author: Nick Trimbee
Related Blog Posts

OneFS and HTTP Security
Mon, 22 Apr 2024 20:35:30 -0000
|Read Time: 0 minutes
To enable granular HTTP security configuration, OneFS provides an option to disable nonessential HTTP components selectively. This can help reduce the overall attack surface of your infrastructure. Disabling a specific component’s service still allows other essential services on the cluster to continue to run unimpeded. In OneFS 9.4 and later, you can disable the following nonessential HTTP services:
Service | Description |
PowerScaleUI | The OneFS WebUI configuration interface. |
Platform-API-External | External access to the OneFS platform API endpoints. |
Rest Access to Namespace (RAN) | REST-ful access by HTTP to a cluster’s /ifs namespace. |
RemoteService | Remote Support and In-Product Activation. |
SWIFT (deprecated) | Deprecated object access to the cluster using the SWIFT protocol. This has been replaced by the S3 protocol in OneFS. |
You can enable or disable each of these services independently, using the CLI or platform API, if you have a user account with the ISI_PRIV_HTTP RBAC privilege.
You can use the isi http services CLI command set to view and modify the nonessential HTTP services:
# isi http services list
ID                     Enabled
------------------------------
Platform-API-External Yes
PowerScaleUI          Yes
RAN                   Yes
RemoteService         Yes
SWIFT                 No
------------------------------
Total: 5
For example, you can easily disable remote HTTP access to the OneFS /ifs namespace as follows:
# isi http services modify RAN --enabled=0
You are about to modify the service RAN. Are you sure? (yes/[no]): yes
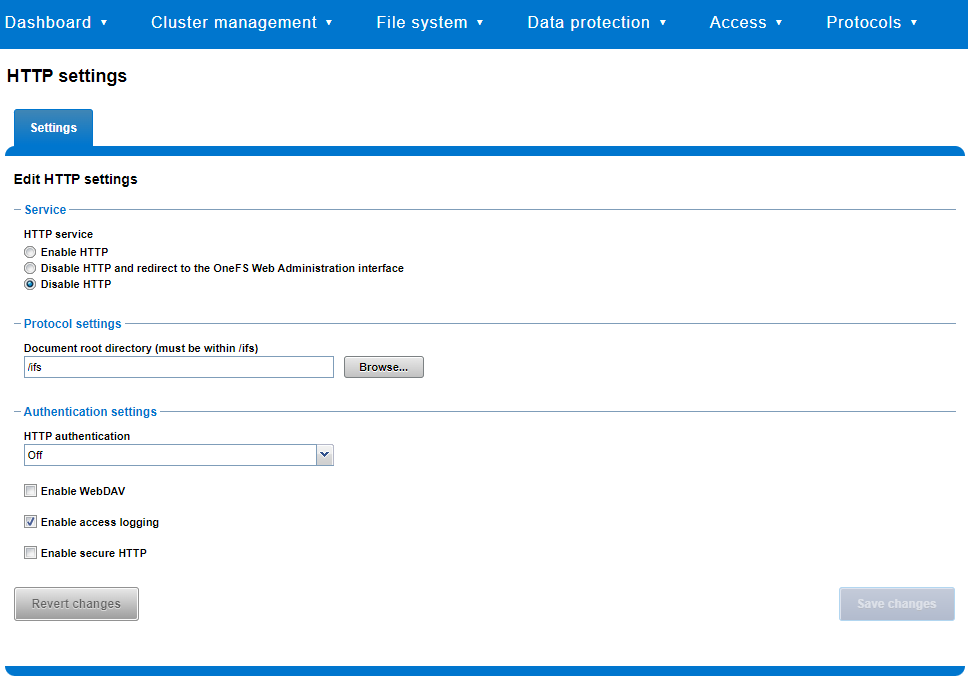
Similarly, you can also use the WebUI to view and edit a subset of the HTTP configuration settings, by navigating to Protocols > HTTP settings:
That said, the implications and impact of disabling each of the services is as follows:
Service | Disabling impacts |
WebUI | The WebUI is completely disabled, and access attempts (default TCP port 8080) are denied with the warning Service Unavailable. Please contact Administrator. If the WebUI is re-enabled, the external platform API service (Platform-API-External) is also started if it is not running. Note that disabling the WebUI does not affect the PlatformAPI service. |
Platform API | External API requests to the cluster are denied, and the WebUI is disabled, because it uses the Platform-API-External service. Note that the Platform-API-Internal service is not impacted if/when the Platform-API-External is disabled, and internal pAPI services continue to function as expected. If the Platform-API-External service is re-enabled, the WebUI will remain inactive until the PowerScaleUI service is also enabled. |
RAN | If RAN is disabled, the WebUI components for File System Explorer and File Browser are also automatically disabled. From the WebUI, attempts to access the OneFS file system explorer (File System > File System Explorer) fail with the warning message Browse is disabled as RAN service is not running. Contact your administrator to enable the service. This same warning also appears when attempting to access any other WebUI components that require directory selection. |
RemoteService | If RemoteService is disabled, the WebUI components for Remote Support and In-Product Activation are disabled. In the WebUI, going to Cluster Management > General Settings and selecting the Remote Support tab displays the message The service required for the feature is disabled. Contact your administrator to enable the service. In the WebUI, going to Cluster Management > Licensing and scrolling to the License Activation section displays the message The service required for the feature is disabled. Contact your administrator to enable the service. |
SWIFT | Deprecated object protocol and disabled by default. |
You can use the CLI command isi http settings view to display the OneFS HTTP configuration:
# isi http settings view
            Access Control: No
      Basic Authentication: No
    WebHDFS Ran HTTPS Port: 8443
                        Dav: No
         Enable Access Log: Yes
                      HTTPS: No
 Integrated Authentication: No
               Server Root: /ifs
                    Service: disabled
           Service Timeout: 8m20s
          Inactive Timeout: 15m
           Session Max Age: 4H
Httpd Controlpath Redirect: No
Similarly, you can manage and change the HTTP configuration using the isi http settings modify CLI command.
For example, to reduce the maximum session age from four to two hours:
# isi http settings view | grep -i age
           Session Max Age: 4H
# isi http settings modify --session-max-age=2H
# isi http settings view | grep -i age
           Session Max Age: 2H
The full set of configuration options for isi http settings includes:
Option | Description |
--access-control <boolean> | Enable Access Control Authentication for the HTTP service. Access Control Authentication requires at least one type of authentication to be enabled. |
--basic-authentication <boolean> | Enable Basic Authentication for the HTTP service. |
--webhdfs-ran-https-port <integer> | Configure Data Services Port for the HTTP service. |
--revert-webhdfs-ran-https-port | Set value to system default for --webhdfs-ran-https-port. |
--dav <boolean> | Comply with Class 1 and 2 of the DAV specification (RFC 2518) for the HTTP service. All DAV clients must go through a single node. DAV compliance is NOT met if you go through SmartConnect, or using 2 or more node IPs. |
--enable-access-log <boolean> | Enable writing to a log when the HTTP server is accessed for the HTTP service. |
--https <boolean> | Enable the HTTPS transport protocol for the HTTP service. |
--https <boolean> | Enable the HTTPS transport protocol for the HTTP service. |
--integrated-authentication <boolean> | Enable Integrated Authentication for the HTTP service. |
--server-root <path> | Document root directory for the HTTP service. Must be within /ifs. |
--service (enabled | disabled | redirect | disabled_basicfile) | Enable/disable the HTTP Service or redirect to WebUI or disabled BasicFileAccess. |
--service-timeout <duration> | The amount of time (in seconds) that the server will wait for certain events before failing a request. A value of 0 indicates that the service timeout value is the Apache default. |
--revert-service-timeout | Set value to system default for --service-timeout. |
--inactive-timeout <duration> | Get the HTTP RequestReadTimeout directive from both the WebUI and the HTTP service. |
--revert-inactive-timeout | Set value to system default for --inactive-timeout. |
--session-max-age <duration> | Get the HTTP SessionMaxAge directive from both WebUI and HTTP service. |
--revert-session-max-age | Set value to system default for --session-max-age. |
--httpd-controlpath-redirect <boolean> | Enable or disable WebUI redirection to the HTTP service. |
Note that while the OneFS S3 service uses HTTP, it is considered a tier-1 protocol, and as such is managed using its own isi s3 CLI command set and corresponding WebUI area. For example, the following CLI command forces the cluster to only accept encrypted HTTPS/SSL traffic on TCP port 9999 (rather than the default TCP port 9021):
# isi s3 settings global modify --https-only 1 –https-port 9921
# isi s3 settings global view
         HTTP Port: 9020
        HTTPS Port: 9999
        HTTPS only: Yes
S3 Service Enabled: Yes
Additionally, you can entirely disable the S3 service with the following CLI command:
# isi services s3 disable
The service 's3' has been disabled.
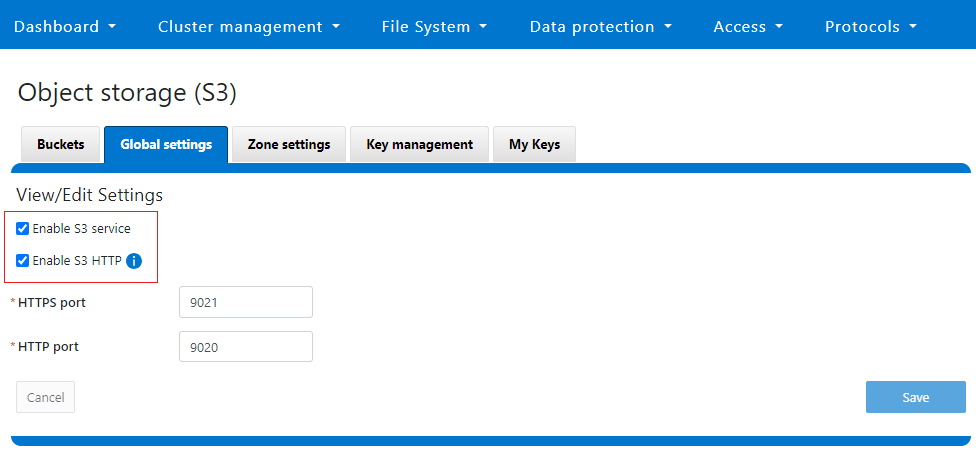
Or from the WebUI, under Protocols > S3 > Global settings:
Author: Nick Trimbee

OneFS and PowerScale F-series Management Ports
Mon, 22 Apr 2024 20:12:20 -0000
|Read Time: 0 minutes
Another security enhancement that OneFS 9.5 and later releases brings to the table is the ability to configure 1GbE NIC ports dedicated to cluster management on the PowerScale F900, F710, F600, F210, and F200 all-flash storage nodes and P100 and B100 accelerators. Since these platforms were released, customers have been requesting the ability to activate the 1GbE NIC ports so that the node management activity and front end protocol traffic can be separated on physically distinct interfaces.
For background, since their introduction, the F600 and F900 have shipped with a quad port 1GbE rNDC (rack Converged Network Daughter Card) adapter. However, these 1GbE ports were non-functional and unsupported in OneFS releases prior to 9.5. As such, the node management and front-end traffic was co-mingled on the front-end interface.
In OneFS 9.5 and later, 1GbE network ports are now supported on all of the PowerScale PowerEdge based platforms for the purposes of node management, and are physically separate from the other network interfaces. Specifically, this enhancement applies to the F900, F600, F200 all-flash nodes, and P100 and B100 accelerators.
Under the hood, OneFS has been updated to recognize the 1GbE rNDC NIC ports as usable for a management interface. Note that the focus of this enhancement is on factory enablement and support for existing F600 customers that have the unused 1GbE rNDC hardware. This functionality has also been back-ported to OneFS 9.4.0.3 and later RUPs. Since the introduction of this feature, there have been several requests raised about field upgrades, but that use case is separate and will be addressed in a later release through scripts, updates of node receipts, procedures, and so on.
Architecturally, aside from some device driver and accounting work, no substantial changes were required to the underlying OneFS or platform architecture to implement this feature. This means that in addition to activating the rNDC, OneFS now supports the relocated front-end NIC in PCI slots 2 or 3 for the F200, B100, and P100.
OneFS 9.5 and later recognizes the 1GbE rNDC as usable for the management interface in the OneFS Wizard, in the same way it always has for the H-series and A-series chassis-based nodes.
All four ports in the 1GbE NIC are active, and for the Broadcom board, the interfaces are initialized and reported as bge0, bge1, bge2, and bge3.
The pciconf CLI utility can be used to determine whether the rNDC NIC is present in a node. If it is, a variety of identification and configuration details are displayed. For example, let’s look at the following output from a Broadcom rNDC NIC in an F200 node:
# pciconf -lvV pci0:24:0:0
bge2@pci0:24:0:0: class=0x020000 card=0x1f5b1028 chip=0x165f14e4 rev=0x00 hdr=0x00
      class       = network
      subclass    = ethernet
      VPD ident   = ‘Broadcom NetXtreme Gigabit Ethernet’
      VPD ro PN   = ‘BCM95720’
      VPD ro MN   = ‘1028’
      VPD ro V0   = ‘FFV7.2.14’
      VPD ro V1   = ‘DSV1028VPDR.VER1.0’
      VPD ro V2   = ‘NPY2’
      VPD ro V3   = ‘PMT1’
      VPD ro V4   = ‘NMVBroadcom Corp’
      VPD ro V5   = ‘DTINIC’
      VPD ro V6   = ‘DCM1001008d452101000d45’
We can use the ifconfig CLI utility to determine the specific IP/interface mapping on the Broadcom rNDC interface. For example:
# ifconfig bge0
 TME-1: bge0: flags=8843<UP,BROADCAST,RUNNING,SIMPLEX,MULTICAST> metric 0 mtu 1500
 TME-1:      ether 00:60:16:9e:X:X
 TME-1:      inet 10.11.12.13 netmask 0xffffff00 broadcast 10.11.12.255 zone 1
 TME-1:      inet 10.11.12.13 netmask 0xffffff00 broadcast 10.11.12.255 zone 0
 TME-1:      media: Ethernet autoselect (1000baseT <full-duplex>)
 TME-1:      status: active
In this output, the first IP address of the management interface’s pool is bound to bge0, which is the first port on the Broadcom rNDC NIC.
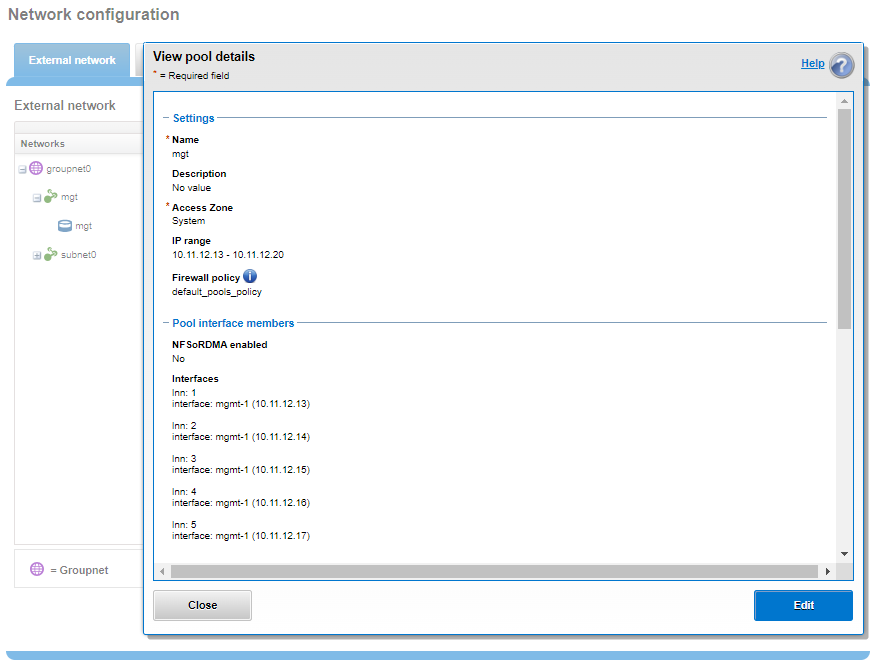
We can use the isi network pools CLI command to determine the corresponding interface. Within the system zone, the management interface is allocated an address from the configured IP range within its associated interface pool. For example:
# isi network pools list
ID                      SC Zone                  IP Ranges                   Allocation Method
----------------------------------------------------------------------------------------------
groupnet0.mgt.mgt       cluster_mgt_isln.com     10.11.12.13-10.11.12.20     static
# isi network pools view groupnet0.mgt.mgt | grep -i ifaces
               Ifaces: 1:mgmt-1, 2:mgmt-1, 3:mgmt-1, 4:mgmt-1, 5:mgmt-1
Or from the WebUI, under Network configuration > External network:
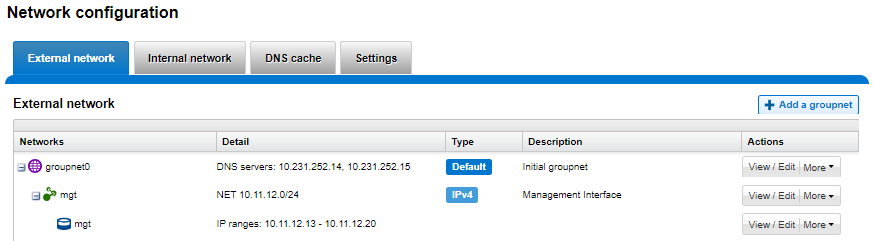
Drilling down into the mgt pool details shows the 1GbE management interfaces as the pool interface members:
Note that the 1GbE rNDC network ports are solely intended as cluster management interfaces. As such, they are not supported for use with regular front-end data traffic.
The F900 and F600 nodes already ship with a four port 1GbE rNDC NIC installed. However, the F200, B100, and P100 platform configurations have also been updated to include a quad port 1GbE rNDC card. These new configurations have been shipping by default since January 2023. This required relocating the front end network’s 25GbE NIC (Mellanox CX4) to PCI slot 2 in the motherboard. Additionally, the OneFS updates needed for this feature have also now allowed the F200 platform to be offered with a 100GbE option too. The 100GbE option uses a Mellanox CX6 NIC in place of the CX4 in slot 2.
With this 1GbE management interface enhancement, the same quad-port rNDC card (typically the Broadcom 5720) that has been shipped in the F900 and F600 since their introduction, is now included in the F200, B100 and P100 nodes as well. All four 1GbE rNDC ports are enabled and active under OneFS 9.5 and later, too.
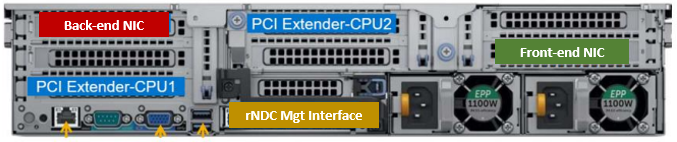
Node port ordering continues to follow the standard, increasing numerically from left to right. However, be aware that the port labels are not visible externally because they are obscured by the enclosure’s sheet metal.
The following back-of-chassis hardware images show the new placements of the NICs in the various F-series and accelerator platforms:
F600

F900
For both the F600 and F900, the NIC placement remains unchanged, because these nodes have always shipped with the 1GbE quad port in the rNDC slot since their launch.
F200

The F200 sees its front-end NIC moved to slot 3, freeing up the rNDC slot for the quad-port 1GbE Broadcom 5720.

Because the B100 backup accelerator has a fibre-channel card in slot 2, it sees its front-end NIC moved to slot 3, freeing up the rNDC slot for the quad-port 1GbE Broadcom 5720.

Finally, the P100 accelerator sees its front-end NIC moved to slot 3, freeing up the rNDC slot for the quad-port 1GbE Broadcom 5720.
Note that, while there is currently no field hardware upgrade process for adding rNDC cards to legacy F200 nodes or B100 and P100 accelerators, this will be addressed in a future release.
Author: Nick Trimbee