


VMmark on XR4000
Download PDFMon, 16 Jan 2023 19:04:39 -0000
|Read Time: 0 minutes
Summary
Dell Technologies has recently announced PowerEdge XR4000: an industry certified, multi-node, 2U short-depth rugged OEM- ready server with rack or wall mountable options. The XR4000 is optimized for edge use cases, including retail, manufacturing, and telecom. This Direct from Development (DfD) demonstrates VM deployment capability for virtualized environments using VMmark, a benchmark that measures the performance and scalability of virtualization platforms.
Market positioning
The new Dell PowerEdge XR4000 is a 2U server with an innovative sled-based design. Dell Technologies’ shortest depth server to date is purpose-built for the edge, delivering high-performance compute and ultimate deployment flexibility in two new chassis form factors. The chassis consists of two 14”-depth form factors, referred to as “rackable” and “stackable.” XR4000 comes with an optional nano server sled that can provide an in-chassis witness node for the vSAN cluster. Replacing the need for a virtual witness node, the Nano server can function as an in-chassis witness node, allowing for a native, self-contained 2-node vSAN cluster in even the 14” x 12” stackable server chassis. This allows for VM deployments where the option was previously unavailable, due to latency or bandwidth constraints.
This document describes the VMmark 3.1.1 benchmark that was used to test the outstanding performance delivered by Dell PowerEdge servers, powered by Intel® Xeon® D processors.
VMmark benchmark
Overview
The first version of VMmark was launched in 2007 as a single-host benchmark when organizations were in their infancy in terms of their virtualization maturity. VMmark 3.1.1, released in 2020, is the current release of the benchmark.
VMmark uses a unique tile-based implementation in which each “tile” consists of a collection of virtual machines running a set of diverse workloads. This tile-based approach is common across all versions of the VMmark benchmark. Since the initial release of VMmark, virtualization has become the norm for applications, and these applications have evolved. The workloads that are run in the VMmark tiles have also evolved to provide the closest to real-world metrics for users to assess their virtual environments.
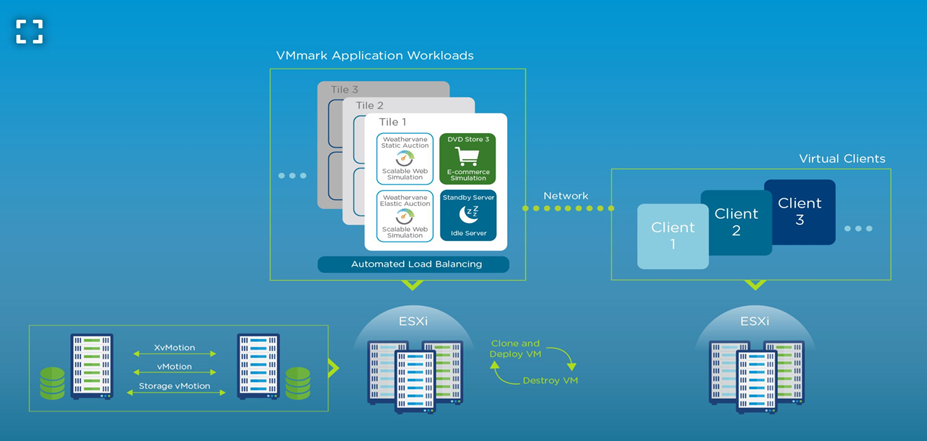
Figure 1. A Web-Scale Multi-Server Virtualization Platform Benchmark
Power Measurement
Power and cooling expenses are a substantial — and increasing — part of the cost of running a data center. Environmental considerations are also a growing factor in data center design and selection. To address these issues, VMmark enables optional power measurement in addition to performance measurements. VMmark 3.1.1 benchmark results can be any of three types:
- Performance only (no power measurement)
- Performance with server power
- Performance with server and storage power
VMmark results with power measurement allow hardware purchasers to see not just absolute performance, but also absolute power consumption and performance per kilowatt. This makes it possible to consider both capital expenses and operating expenses when selecting new data center components.
Solution architecture
This solution includes the following components:
Component | Details |
SUTs | 4 x Dell XR4510c servers |
Clients | 2 x Dell PowerEdge R740xd |
Storage | vSAN used for all Workload VMs iSCSI SAN used for Infrastructure Operations |
Network | Dell Z9432F-ON switch Intel® E823-C 25G 4P LOM |
OS | Dell Customized Image of VMware ESXi 7.0U3 A08, Build# 20328353 |
The metrics of the application workloads within each tile are computed and aggregated into a score for that tile. This aggregation is performed by first normalizing the different performance metrics (such as actions/minute and operations/minute) for a reference platform. Then, a geometric mean of the normalized scores is computed as the final score for the tile. The resulting per-tile scores are then summed to create the application workload portion of the final metric. The metrics for the infrastructure workloads are aggregated separately. The final benchmark score is computed as a weighted average: 80 percent to the application workload component and 20 percent to the infrastructure workload component.
When power is to be measured using the PTDaemon, either for server only or for both server and storage, the VMmark harness starts the PTDdaemon, which initiates a connection between the PTD client (or clients) specified in the VMmark
3.1.1 properties file and the power meter (or meters) they are configured to monitor. Once the required connections are established and the benchmark run is underway, the harness captures each of the power meter (or meters) results into a single unified data stream. This data, like that from other VMmark workloads, is broken up into various sections (ramp up, three 40-minute steady-state phases, and ramp down). The reported VMmark .3.1.1 power consumption is the total average watts consumed during the steady-state phase of the benchmark run that resulted in the median score; the total average watts being the sum of the average watts reported by each power meter used in the run. The final VMmark Performance Per Kilowatt (PPKW) score is the VMmark 3.1.1 score divided by the average power consumption in kilowatts. The below results are based on the performance testing conducted in Dell Solution Performance Analytics (SPA) Lab on 9/30/2022.
The published result met all QoS thresholds and is compliant with VMmark 3.1.1 run and reporting rules. The following table shows the scores of the submitted test results.
vMotion (number of operations per hour) | 57.00 |
SVMotion (number of operations per hour) | 44.00 |
XVMotion (number of operations per hour) | 34.00 |
Deploy (number of operations per hour) | 17.00 |
Unreviewed_VMmark3_Applications_Score | 4.93 |
Unreviewed_VMmark3_Infrastructure_Score | 2.15 |
Unreviewed_VMmark3_Avg_Watts | 1085.50 |
Unreviewed_VMmark3_Score | 4.37 @ 4 Tiles |
Unreviewed_VMmark3_PPKW | 4.0285 @ 4 Tiles |
Conclusion
Virtualization is imminent for an edge application. Without virtualization, it is very difficult to fully utilize the power of a modern server. In a virtualized environment, a software layer lets users create multiple independent VMs on a single physical server, taking full advantage of the hardware resources. A single-socket Dell PowerEdge XR4000 server equipped with the Intel Xeon D-2776NT has VMmark Power Performance Score of 4.0285 @ 4 Tiles[1] and a VMmark Score of 4.37 @ 4tiles. This is representative of different virtualization workloads that can run optimally maintaining the constraints of latency important for the edge with a strong level of performance, making it an excellent choice for edge customers who want to take advantage of the benefits that vitalization has to offer.
- Based on the performance testing conducted in Dell Solution Performance Analytics (SPA) Lab on 9/30/2022