
Test 5 results – cluster at full capacity
Test 5 results – cluster at full capacity
-
Once we identified the optimal Azure Arc-enabled SQL MI size, we deployed 4 of the SQL MIs to each worker node for a total of 12 SQL MIs. Our goal was to achieve reasonable SQL database TPMs and approach 80% utilization across the dbaas-databases-1 AKS hybrid workload cluster. We also wanted to prove that the load was being distributed evenly across all resources in the cluster in an automated fashion.
We observed performance metrics at the following layers of the solution architecture:
- Physical Azure Stack HCI layer
- AKS hybrid workload cluster layer
- SQL MI layer
The following figure illustrates the automated and even distribution of the SQL MI pods across dbaas-databases-1. As already mentioned, each of these SQL MI pods had an associated HammerDB pod in the dbaas-applications-1 workload cluster generating the synthetic test traffic.
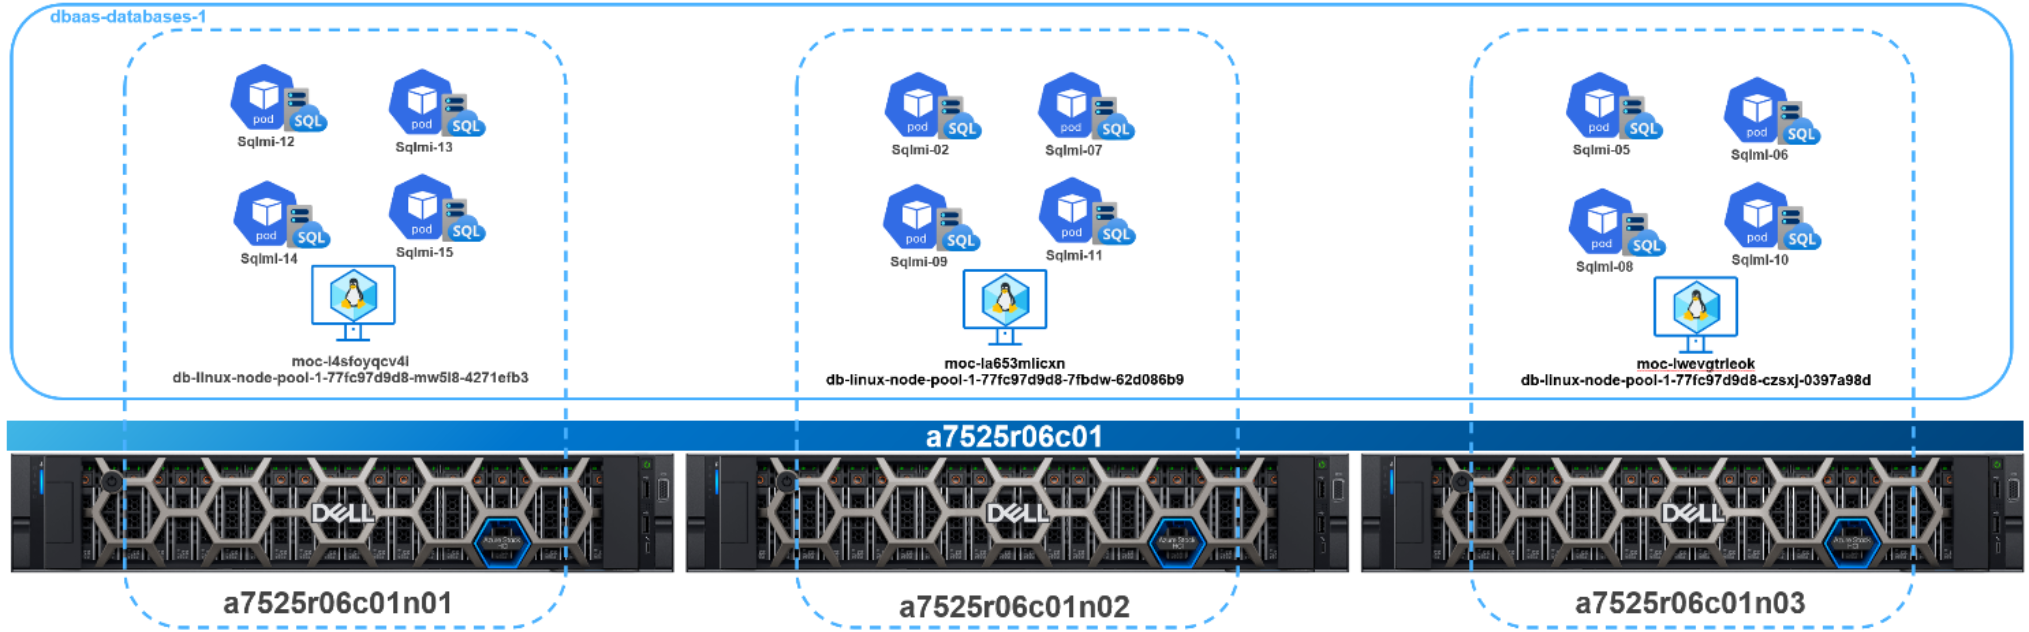
Figure 23. Dbaas-databases-1 worker node and SQL MI distribution
We monitored the TPMs with our testing harness and recorded the results in the following table. This table represents the aggregation of TPMs for all SQL MIs performed on each Azure Stack HCI cluster node. Overall, these results aligned with our expectations. We saw near linear scale of TPMs as users increased. We also attributed the density achieved to the intelligent and automated distribution of the AKS hybrid workload cluster and SQL MIs across all the compute, storage, and networking resources of the Azure Stack HCI cluster.
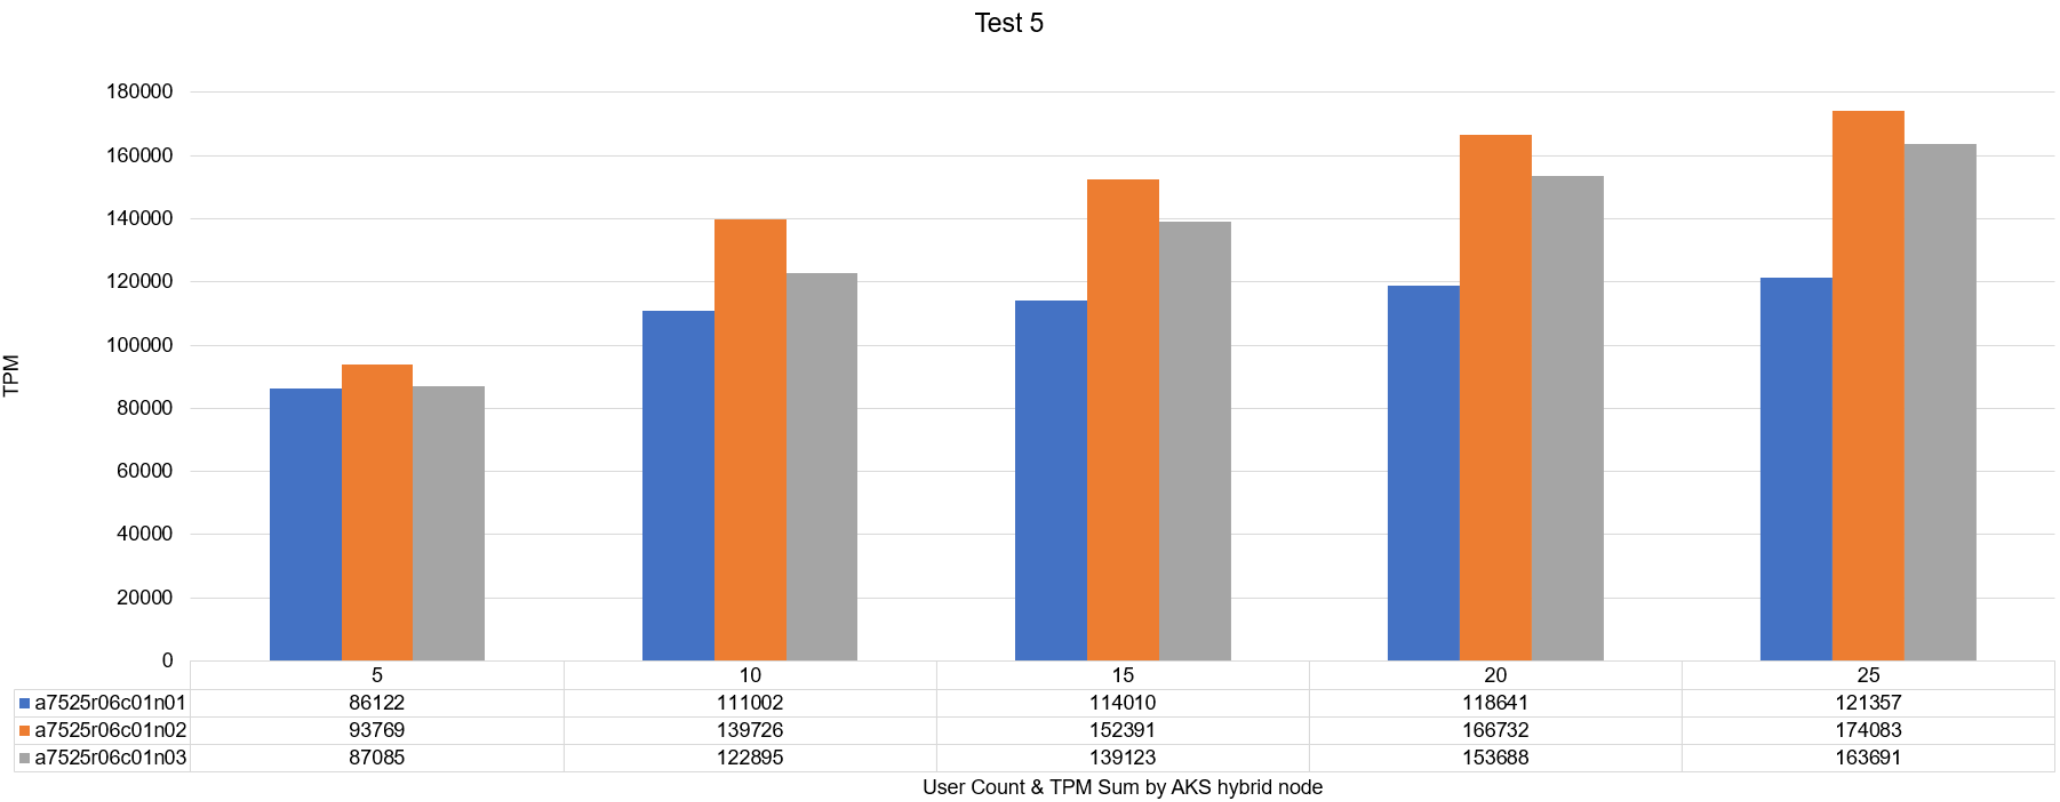
Figure 24. Aggregated TPM sum by Azure Stack HCI cluster node
While these tests were running, we captured various Grafana charts to observe resource utilization at various layers of the platform. The primary purpose of capturing these metrics was to uncover any opportunities to tune performance. We also wanted evidence of the even distribution of the SQL database workload across all the resources in the solution architecture.
Figure 25 was captured from the Grafana instance running in the Azure Arc-enabled data services data controller. Fluent Bit harvested performance metrics for all SQL MI pods during our testing. We only provided a screenshot for a single SQL MI, sqlmi-02, because the performance results were nearly identical across all SQL MIs running during test 5. We observed consistent linear scale of transactions per second, which aligned to the TPMs logged. CPU usage was low and running with excellent efficiency. Memory was never under pressure, which pointed to additional availability in the SQL buffer cache. SQL waits were at an acceptable level and did not warrant further attention.
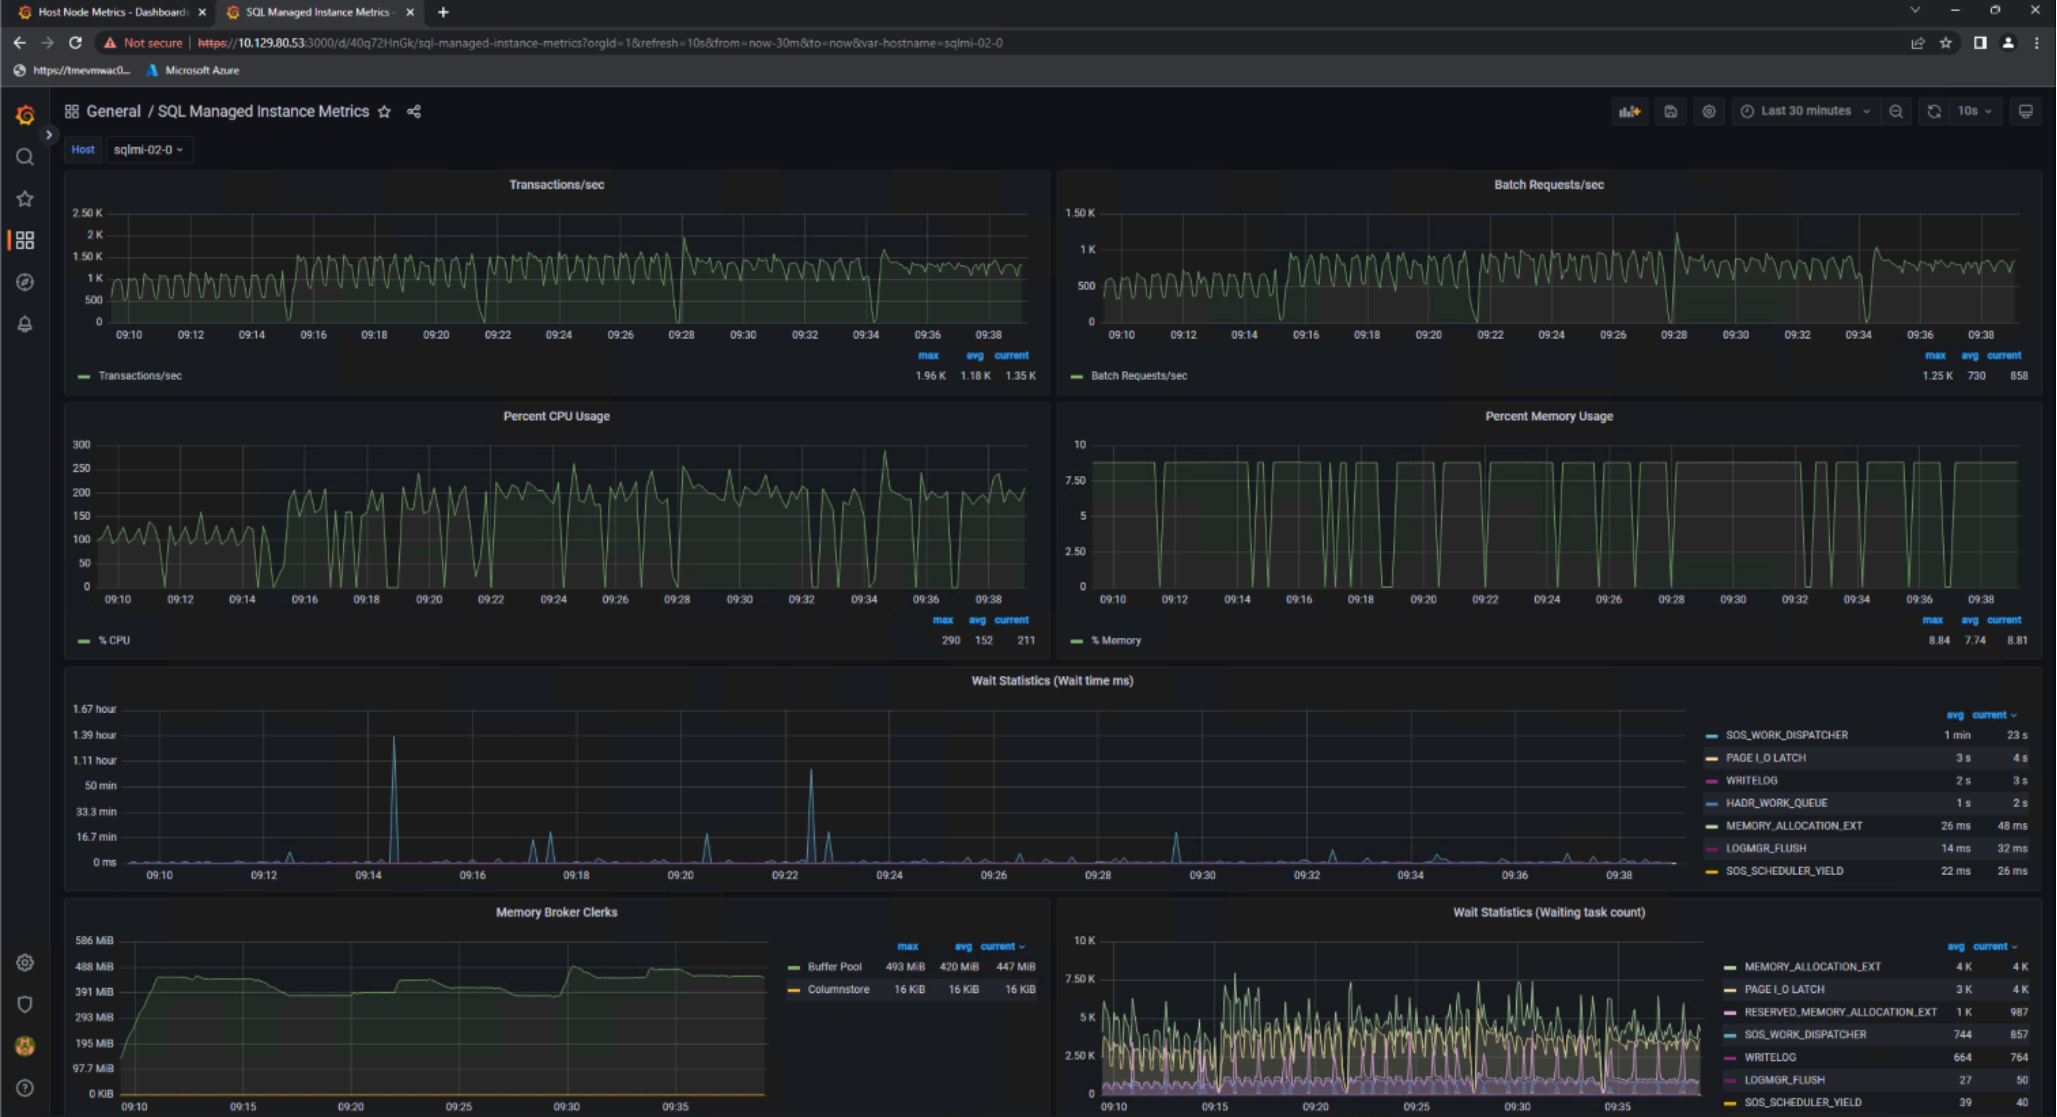
Figure 25. Sqlmi-02 utilization
Figure 26 is another view from the data controller’s Grafana instance. In this figure, we focused on a single AKS hybrid worker node. We observed a clear increase in utilization as more users were introduced in the HammerDB configuration. CPU utilization at the 25-user mark hovered around 70%, which aligned closely with our goal of 80% utilization. We observed a very similar utilization pattern for all the worker nodes in dbaas-databases-1.
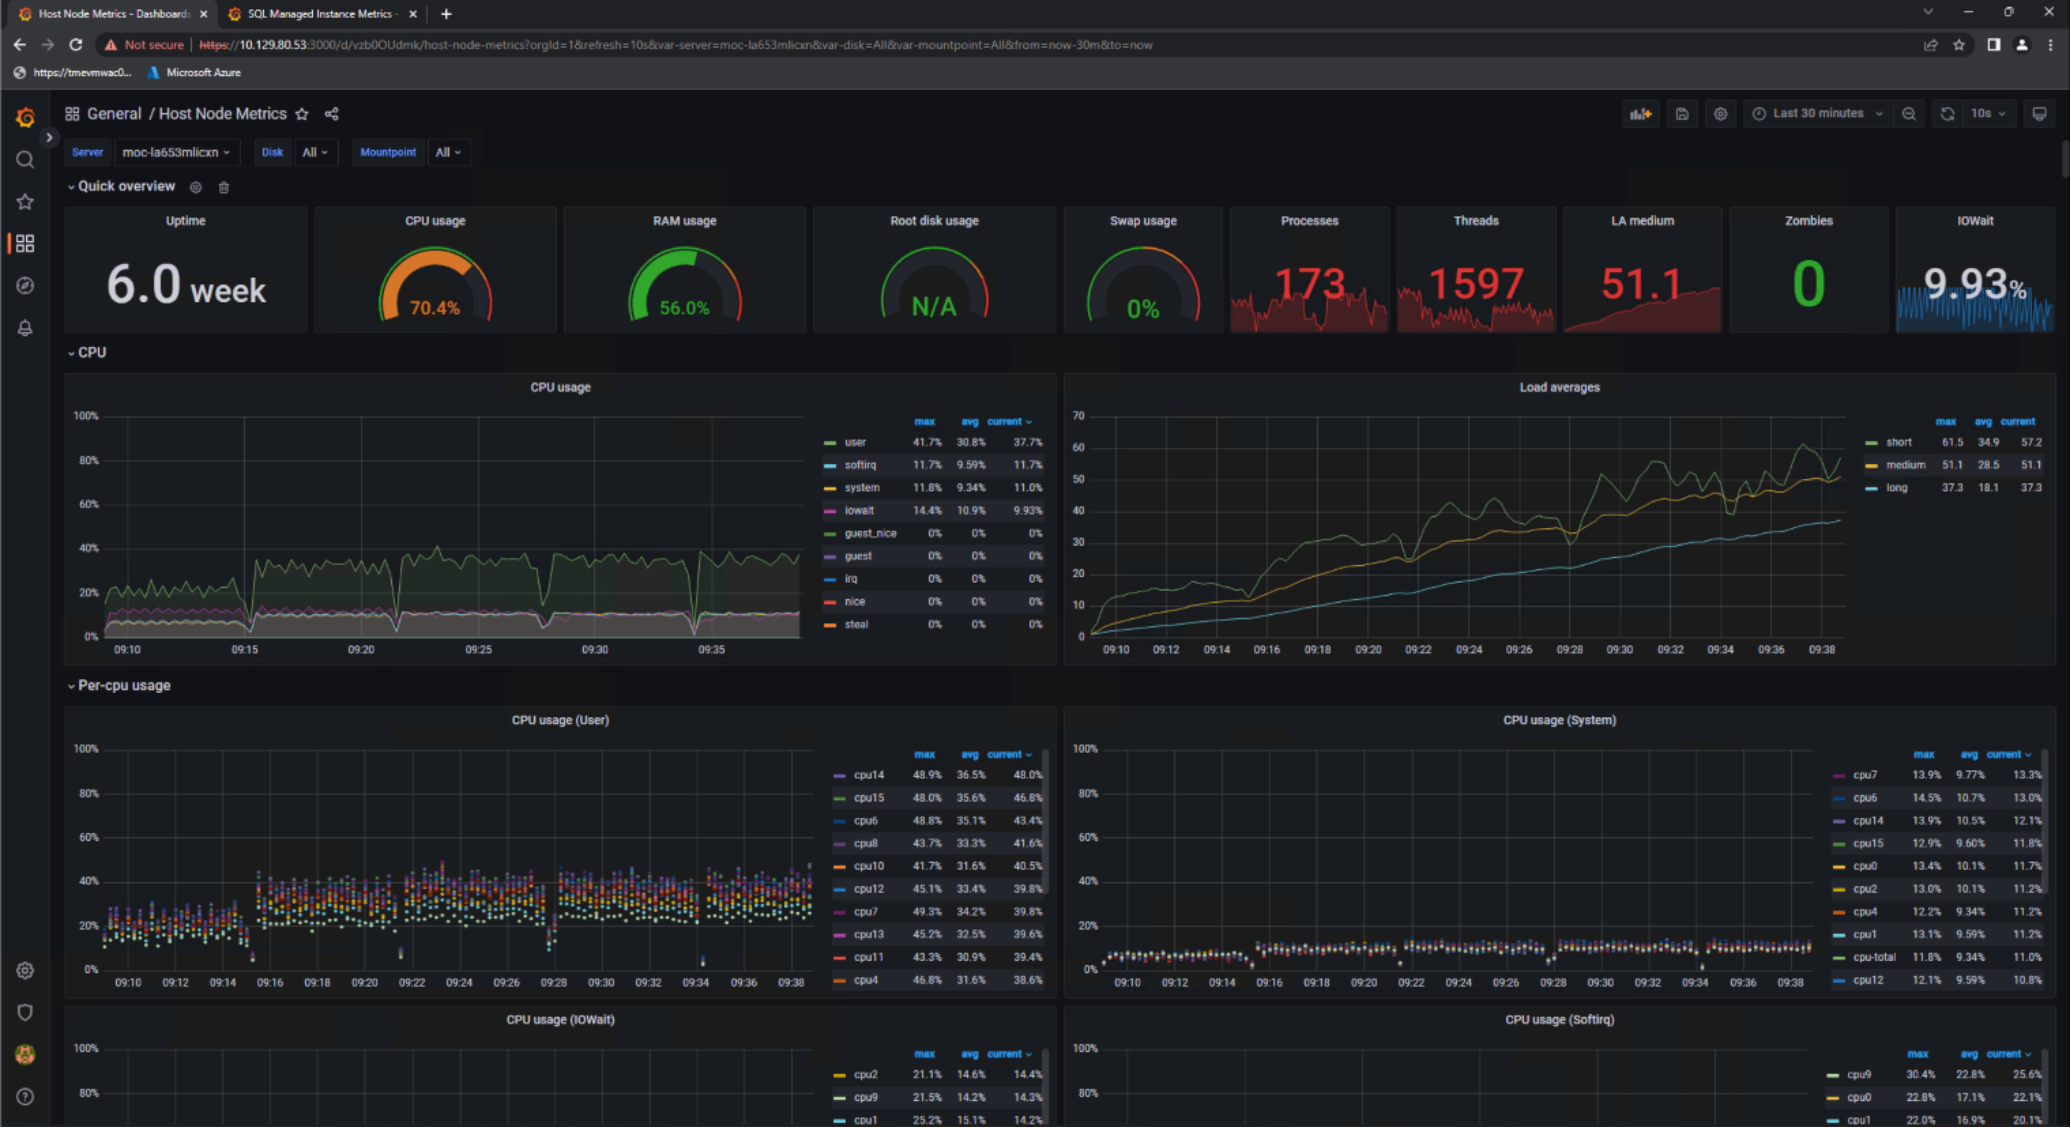
Figure 26. AKS hybrid worker node utilization
Figure 27 was taken from the Grafana instance installed in the dbaas-databases-1 workload cluster. This chart confirmed that the CPU utilization we observed for a single AKS hybrid worker node in Figure 26 was representative across the entire workload cluster. We also analyzed the CPU Quota portion of this graph – specifically the CPU requests vs. limits for the arc-services-ns namespace. We consumed 62% of the CPU requested and only 30% of the limit. This indicated that we could have pushed the SQL MIs with a more intense workload and consumed more of the configured CPU limit. Additional memory could have also been allocated to SQL MIs to drive higher utilization. More data pages in memory could have potentially benefited the SQL MIs and removed CPU pressure at increased HammerDB loads.
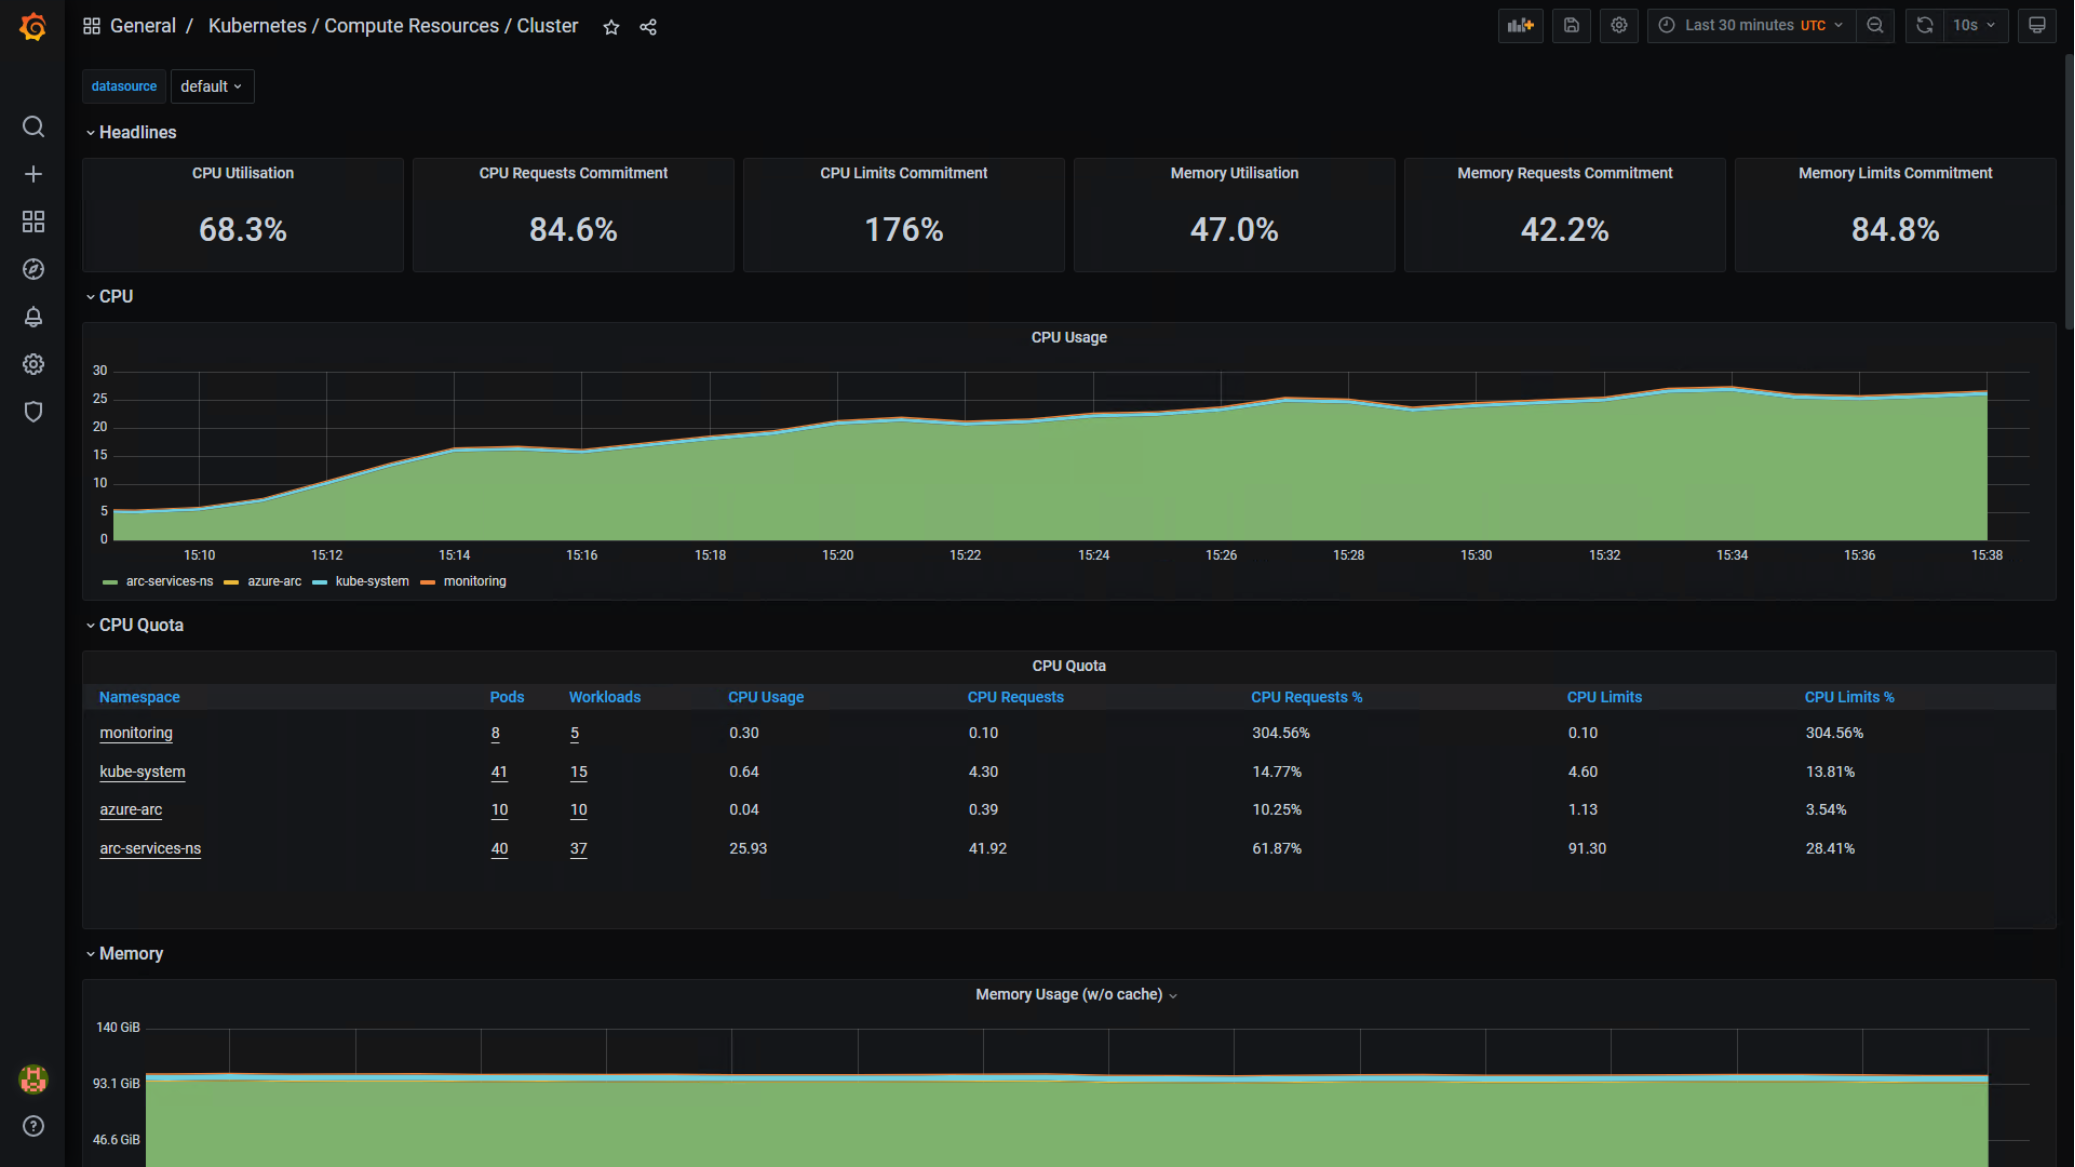
Figure 27. Dbaas-databases-1 workload cluster-wide utilization
The next two Grafana charts focused on the Azure Stack HCI cluster layer. From a cluster-wide perspective, we observed that the SQL MIs drove substantial storage IOPS at just over 2 millisecond latency. We expected this level of performance from a single-tier, all-NVMe storage subsystem using volumes configured with 3-way mirroring. Neither CPU nor memory resources were ever constrained, which was a key design principle. We reserved adequate spare capacity for additional AKS hybrid workload clusters and VMs.
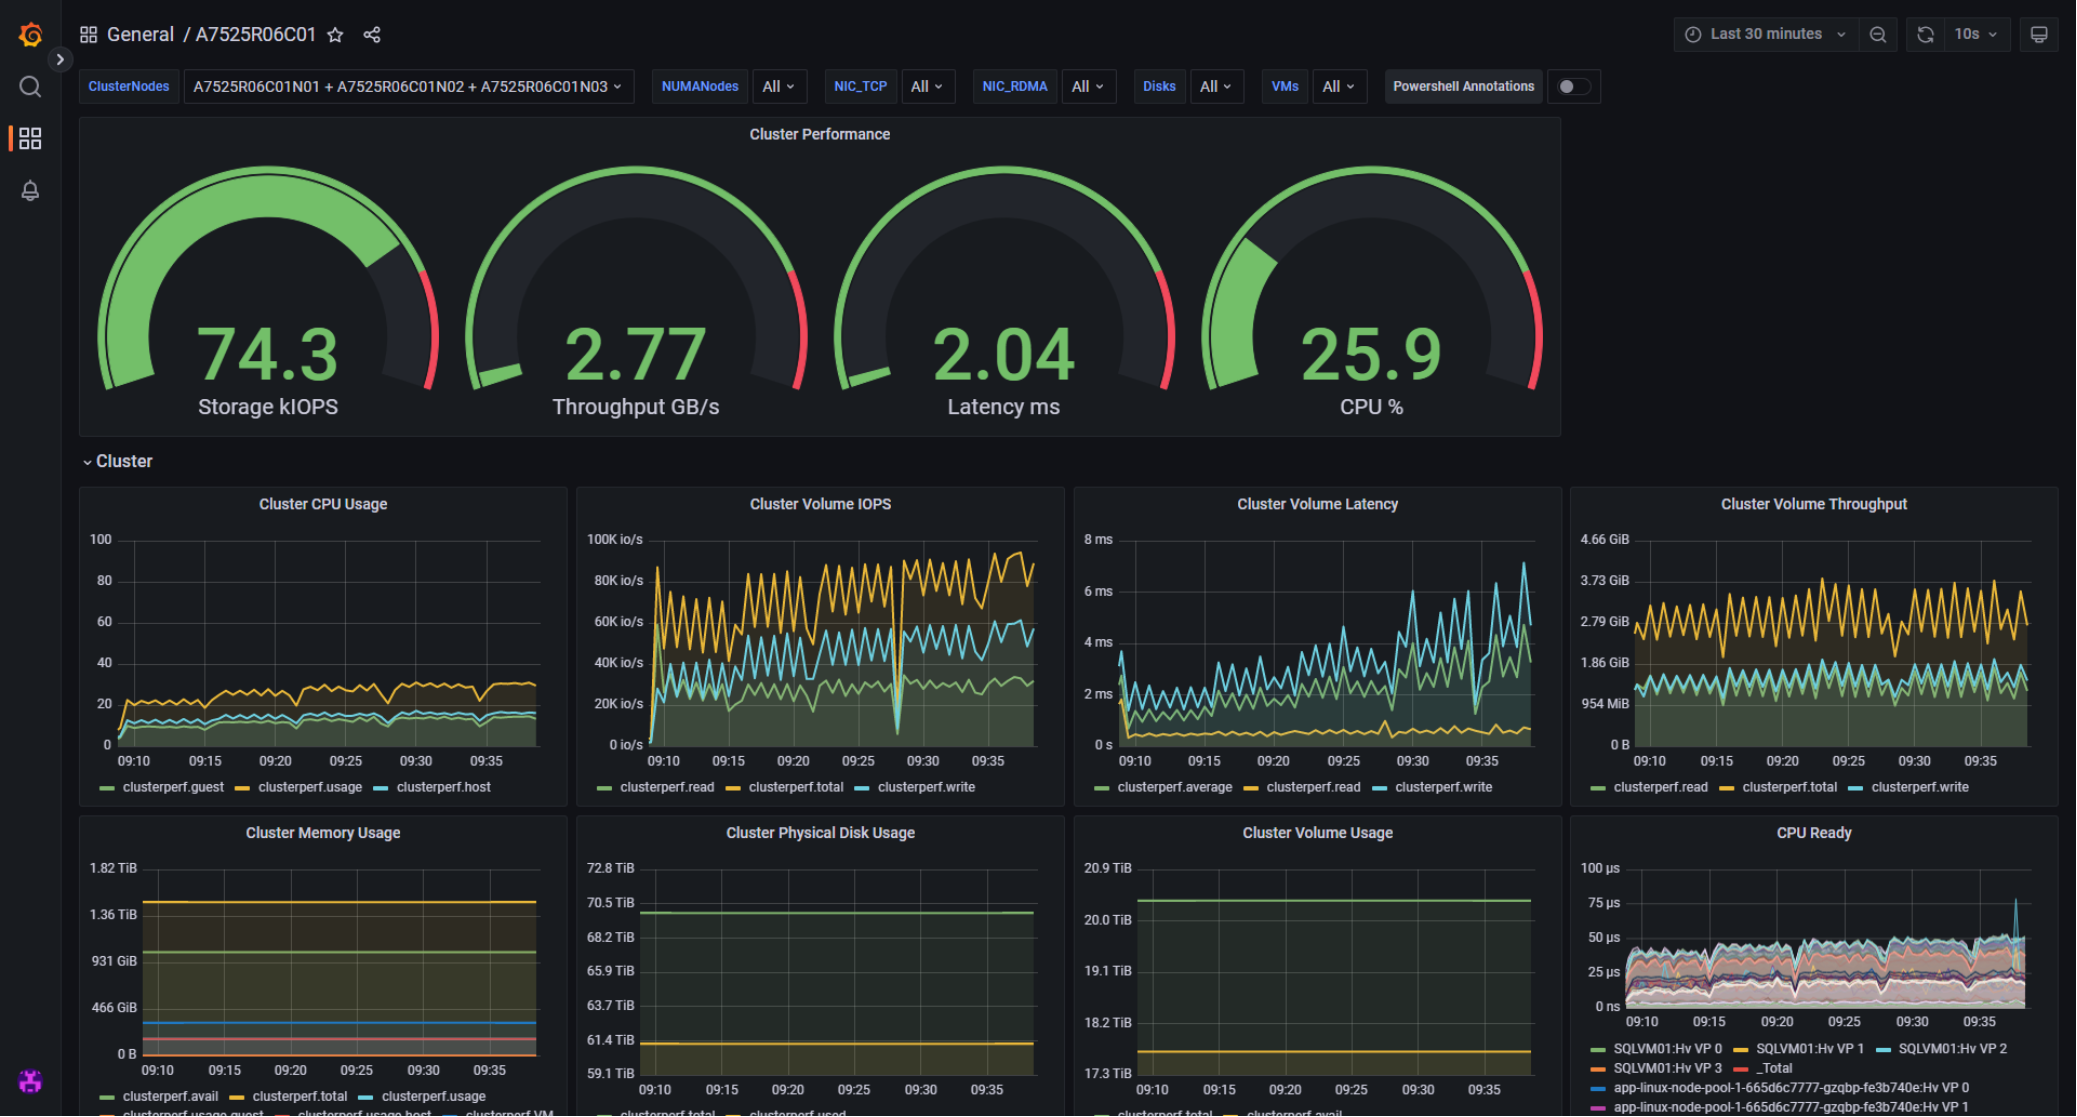
Figure 28. A7525R06C01 Azure Stack HCI cluster-wide utilization
We noted the even utilization of hardware resources across all the Azure Stack HCI cluster nodes. This provided us the evidence of the benefits of the automated distribution of infrastructure resources by the AKS hybrid scheduler and data controller.
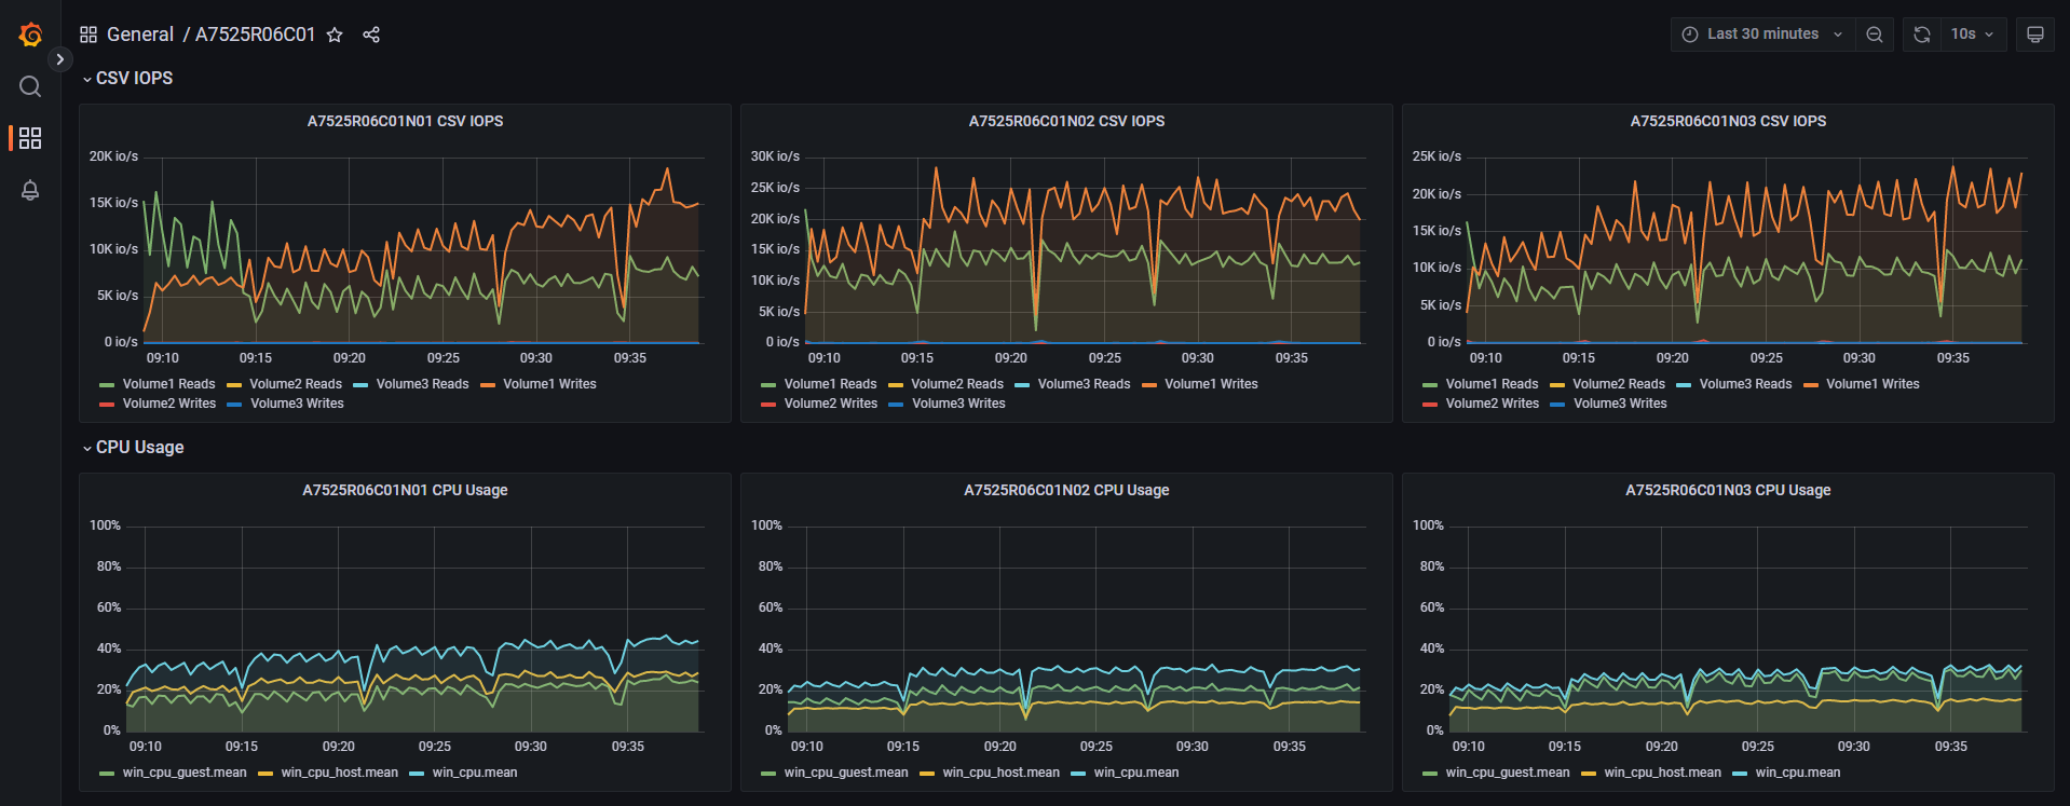
Figure 29. Azure Stack HCI physical node-focused utilization