


Unreducible Capacity Alerting for PowerMax for Possibly Indicating a Ransomware Attack


Unreducible Capacity Alerting for PowerMax for Possibly Indicating a Ransomware Attack
With the release of PowerMaxOS 6079.175.0042 and Unisphere 10.0.1 (March 2023), you can now get anomaly detection for your PowerMax storage environment. This blog explores the various ways you can set up capacity anomaly detection for your PowerMax storage environments that could possibly indicate a ransomware attack occurring on your PowerMax.
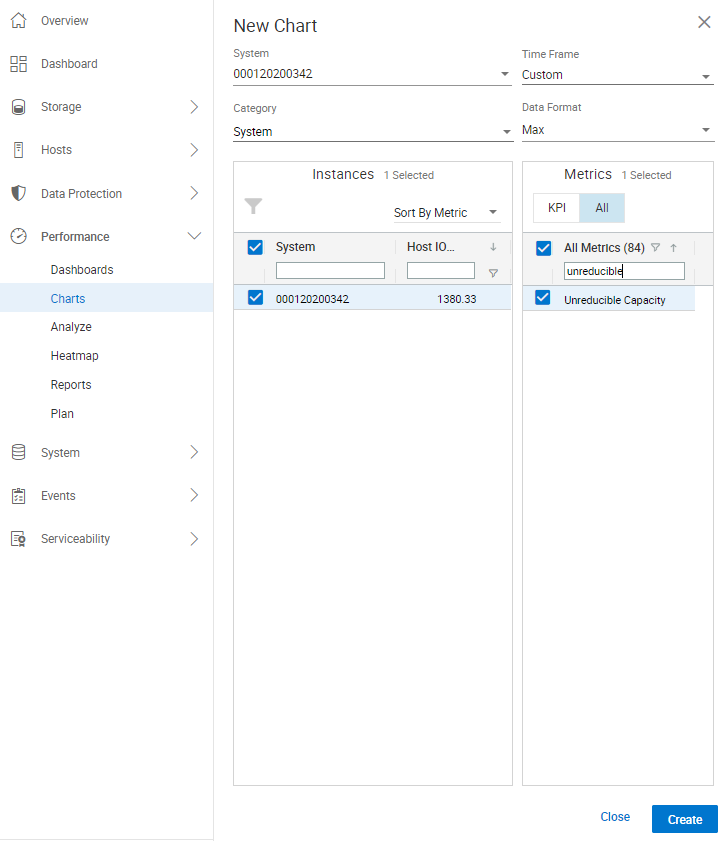
Unisphere 10.0.1 provides a new performance metric called Unreducible Capacity, which reports on the unreducible capacity in the storage array. With data reduction capabilities enabled by default, this metric monitors your unreducible capacity for a system and Storage Group. To chart the unreducible capacity within a PowerMax environment:
- Log in to Unisphere 10.0.1.
- Select the PowerMax for which you would like to chart unreducible capacity (this assumes that the PowerMax is leveraging DRR capabilities).
- On the left-hand side of Unisphere, expand the Performance section and select Charts (example shown here).
- Locate the Time Frame section and select a time frame. Please note, the ‘Unreducible Capacity’ metric is selectable with all ‘Diagnostic’ and ‘Historical’ time frames, however the metric is not selectable with the Realtime time frame.
- Under Category, Unreducible Capacity is eligible for System and Storage Group (which is under the System & Hosts category). There are benefits to charting unreducible capacity for system and Storage Groups. The benefits are:
- For System – Gives customers an idea if a massive ransomware attack is occurring across the whole system.
- For Storage Groups – Gives customers a more surgical approach because Storage Groups are typically created on an application-by-application basis. Therefore, customers can chart the unreducible capacity per Storage Group and give an indication if a ransomware attack may be occurring on the application.
- Change Data Format from the default setting of Avg (for average) to Max.
- If charting the System, check under Instances for the PowerMax array serial number you want to chart.
- Under Metric, select All for all the available metrics.
- In the All Metrics field, enter unreducible and Unreducible Capacity appears. Select Unreducible Capacity, and click Create at the bottom of the screen.
Here is how the screen now appears:
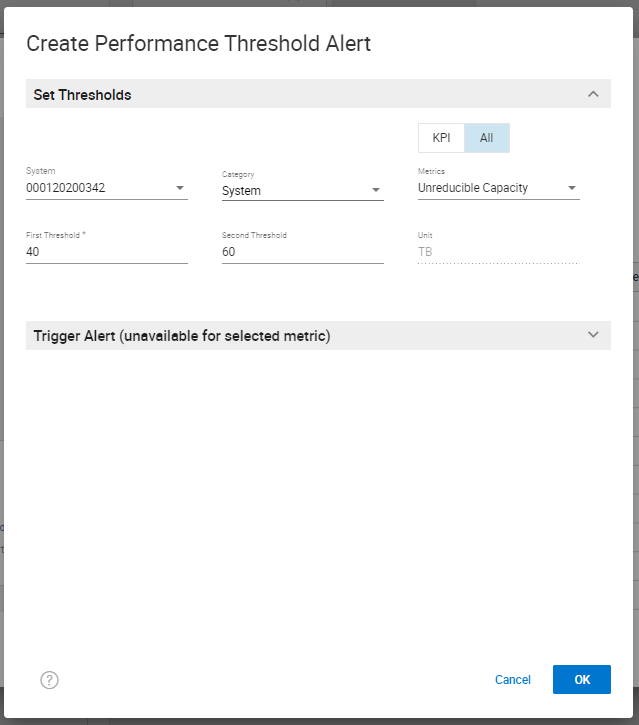
This figure shows how customers can chart the Unreducible Capacity metric in Unisphere. Customers can also set a Performance Threshold and Alert within the Settings section of Unisphere. Doing this enables customers (after monitoring the System and Storage Group for the appropriate thresholds) to set an alert within Unisphere. Unisphere will generate an alert within Unisphere and could email and/or have SNMP send the alert to stakeholders if the thresholds set for Unreducible Capacity are exceeded. To set an alert for Unreducible Capacity:
- Log in to Unisphere.
- Navigate to and select the gear icon in the top right-hand corner of Unisphere. The gear icon is the Settings section for Unisphere for this PowerMax instance.
- On the left-hand side, navigate to the Alerts section and expand it.
- Select the Performance Thresholds and Alerts section. This opens a panel to configure performance thresholds and alerts within Unisphere.
- By default, the category System is selected. To create a threshold for Unreducible Capacity for System:
- Select the Create button.
- On the top right-hand side, select the All setting to view all the Performance Metrics available within Unisphere for the category System.
- The metrics are listed in alphabetical order, so scroll down to the Unreducible Capacity metric and select it.
- Enter a number for First Threshold and a higher number for Second Threshold.
- On the bottom right-hand side, click OK to create a Performance Threshold alert for unreducible capacity being measured against the PowerMax system.
Here is how the information appears with these steps completed:
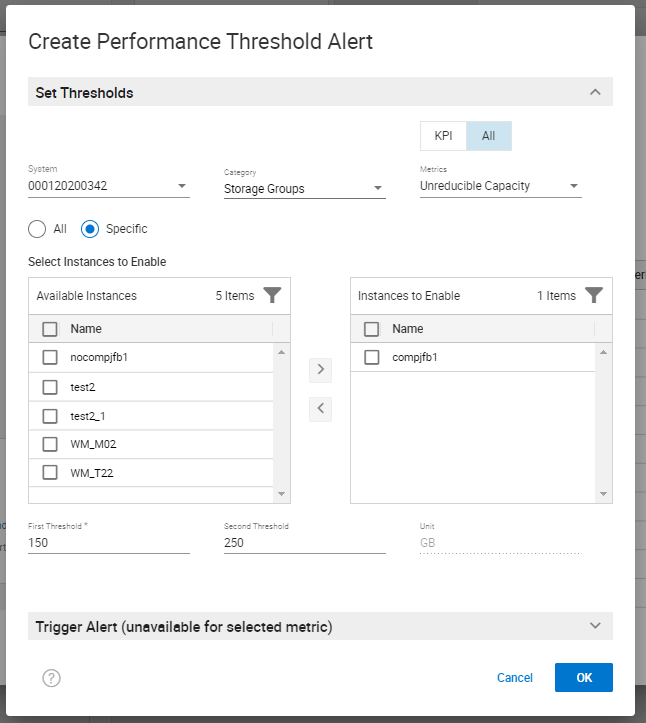
You can change the Category shown in this screenshot from System to Storage Groups to set a performance threshold alert for an individual storage group. Here is a screenshot of creating a performance threshold and alert for Storage Groups (Note: I selected the radio button Specific to pick specific Storage Groups that I want to monitor and alert on).
If you have SRS enabled on your PowerMax array, you can onboard CloudIQ through Unisphere. CloudIQ is a monitoring and reporting tool for all supported Dell assets that feed data into CloudIQ. With PowerMaxOS 6079.175.0042, you can use CloudIQ for Capacity Anomaly Detection on a PowerMax storage array.
For more information about the technologies mentioned in this blog, see the following resources:
- For Unisphere information, review the Dell Technologies Support page
- PowerMaxOS Release Notes
Authors: Justin Bastin (Senior Principal Engineer) and Richard Pace (Principal Engineering Technologist)
Related Blog Posts

Unisphere for PowerMax Workload Planner
Fri, 15 Mar 2024 21:21:58 -0000
|Read Time: 0 minutes
Workload Planner (WLP) is a FAST component used to display performance metrics to calculate VMAX component utilizations and storage group Service Level Objective compliance. It allows for more informed workload monitoring, using up-stream components (Unisphere GUI and REST API) with respect to current VMAX performance capacity.
WLP is supported on arrays running 5977 and upwards code levels. Each service level and workload type has a response band associated with it. When a storage group (workload) is said to be compliant, it is operating within the associated response time band.
When assessing the compliance of a storage group, Workload Planner calculates its weighted response time for the past 4 hours and the past 2 weeks, and then compares the two values to the maximum response time associated with its given service level. If both calculated values fall within (under) the service level-defined response time band, the compliance state is STABLE. If one of them complies and the other is out of compliance, then the compliance state is MARGINAL. If both are out of compliance, then the compliance state is CRITICAL.
SG SLO compliance
To begin, let’s examine our SG SLO compliance to examine how our SG’s have been performing.
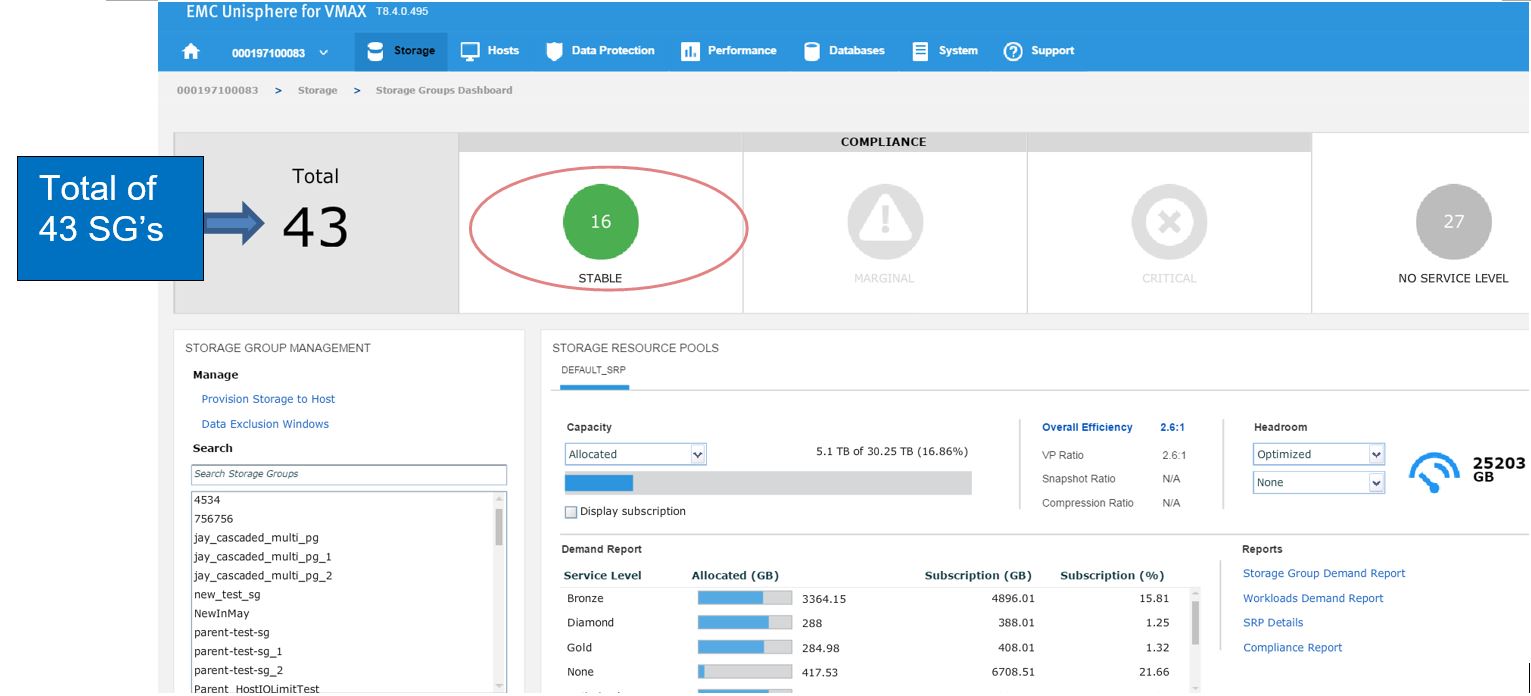 Figure 1. Storage group view
In this example, we have a total of 43 SGs with none being in a marginal or critical state. Let’s click on 16 stable SG’s and review further.
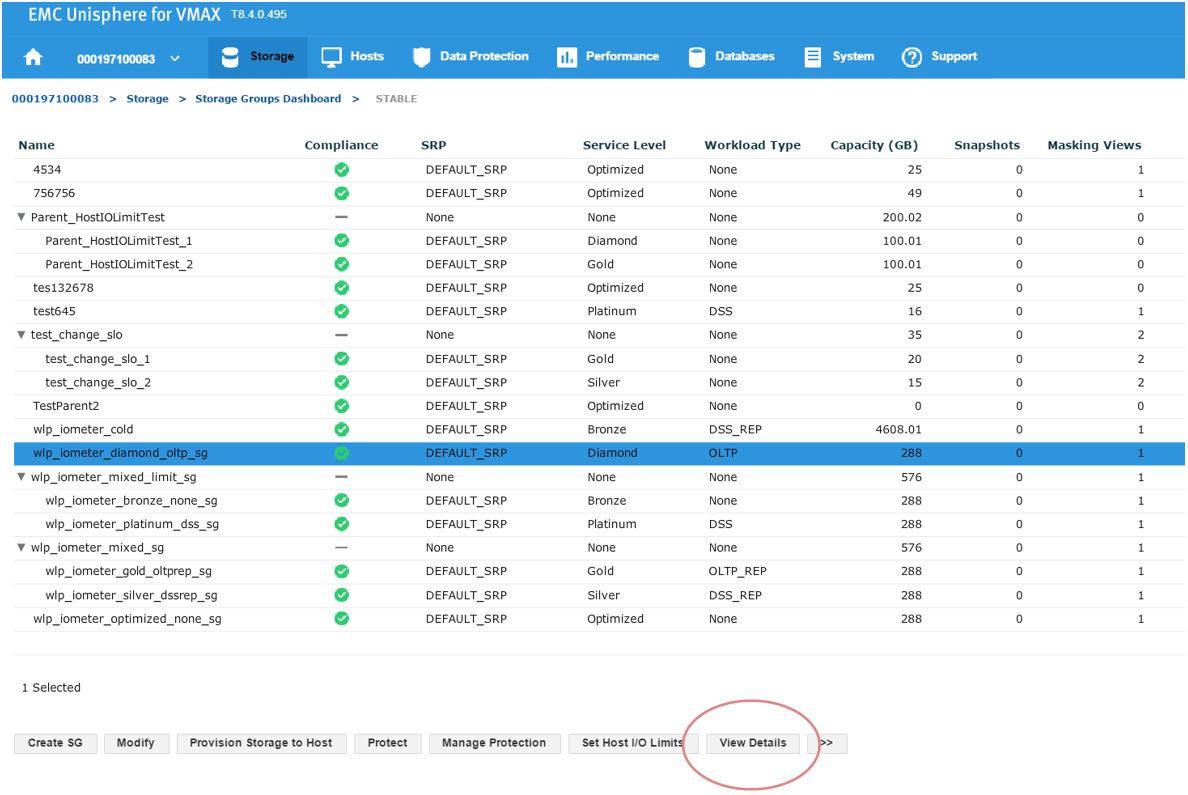
Figure 2. Storage groups drill down view
Here, we have a SG list for the array. In the second column, we see that our sg wlp_iometer_diamond is in a compliant SLO state. Let’s review this SG further by selecting this SG, and then clicking on View Details. This takes us to Details view where we can review the properties of the SG and check its performance on the right-hand side. Here, we want to select Compliance and select the storage tab.
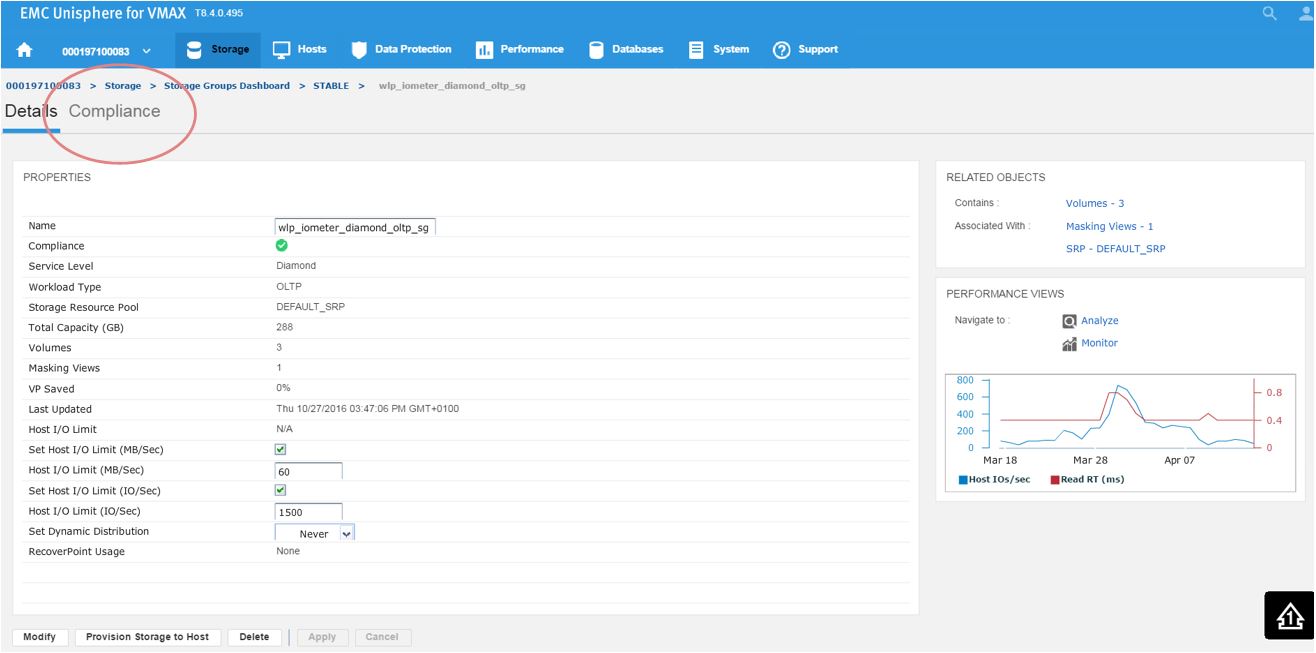
Figure 3. Storage group Details view
Here, we get greater detail on the current compliance state of the SG. We can see that it has a Diamond SLO which is stable. Currently, its capacity trend is flat, however we can also see how our response times over the windows of time. Additionally, we can review how the SG is performing compared to when it was first created.
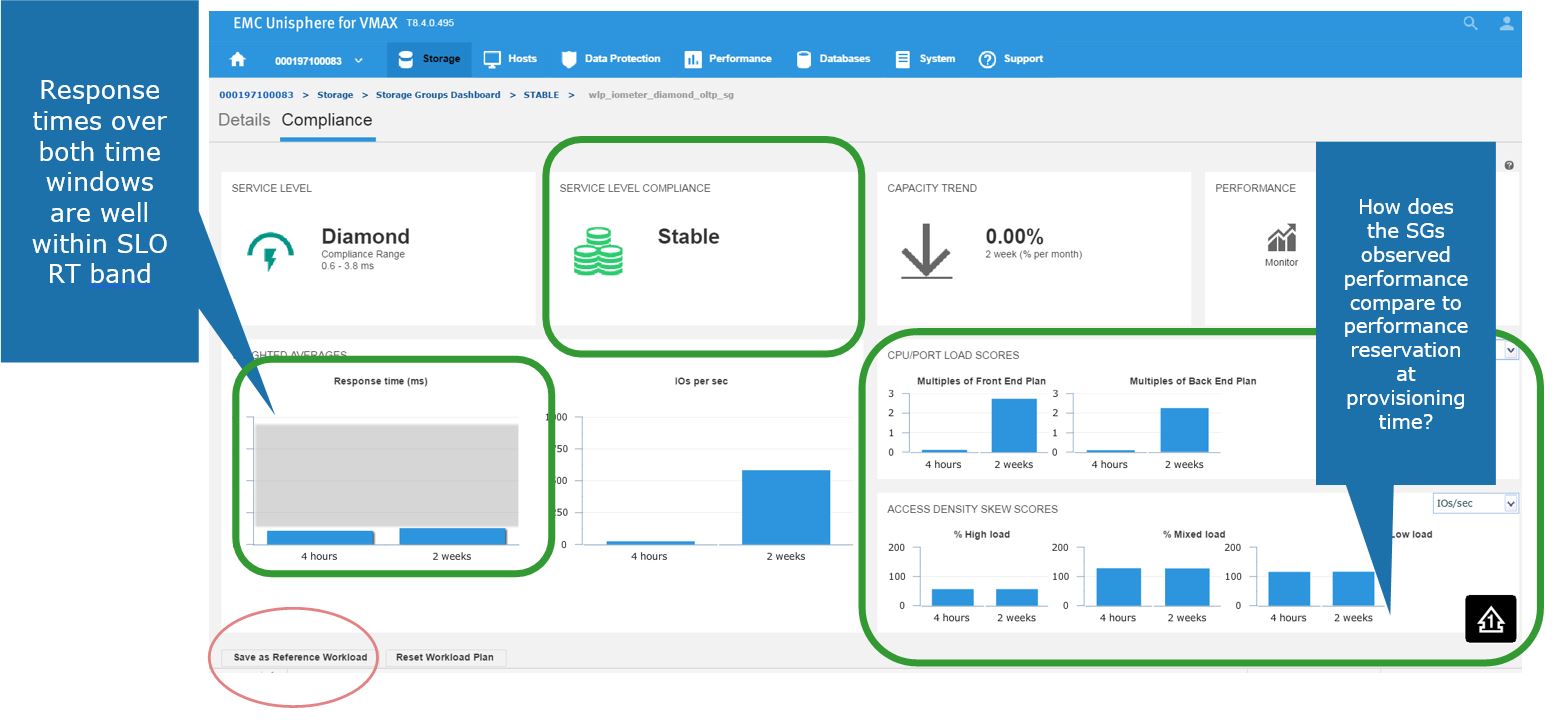
Figure 4. Storage group Compliance view
Saving a favorite reference workload
Here, we also have the ability to save this as a reference workload. For example, this SG is being used for an Oracle database, and we are happy with its performance and configuration since we rolled the application out into production.
Let’s leverage Unisphere to keep this workload for use in the future.
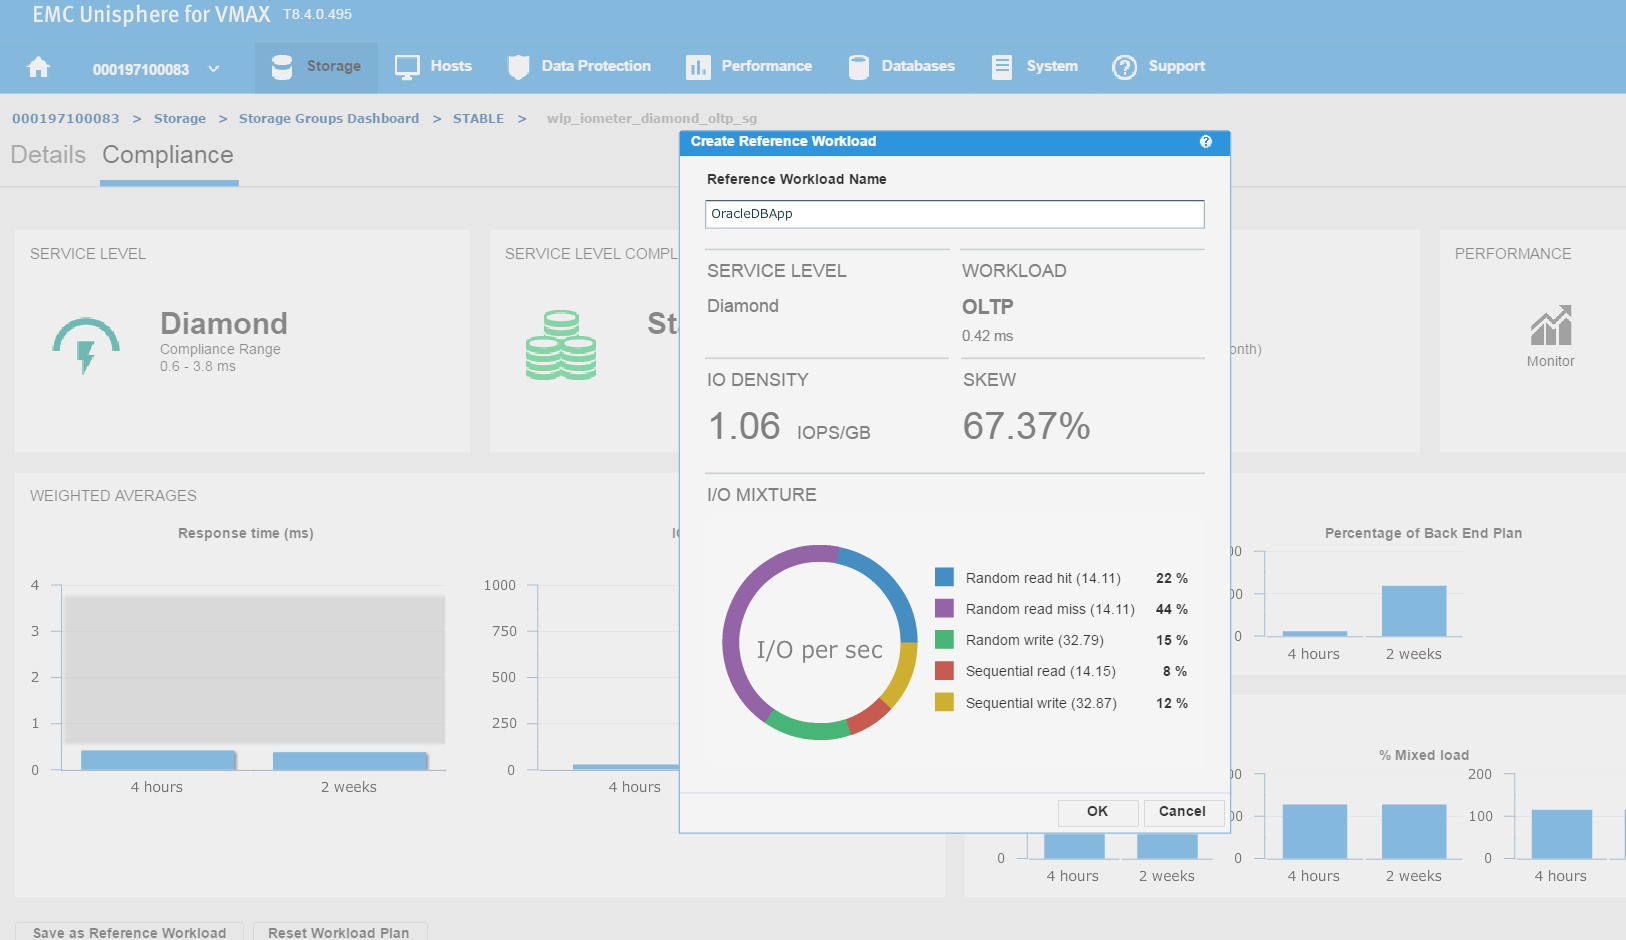
Figure 5. Create reference workload
We have named the workload OracleDBApp, so we can use this as a reference point when we roll out a similar Oracle Application with the breakdown of read and writes in terms of I/O.
Continuing along, let’s first verify that our workload type was saved correctly. To do this, go to Storage > Service Level, and select the Workload Types tab.
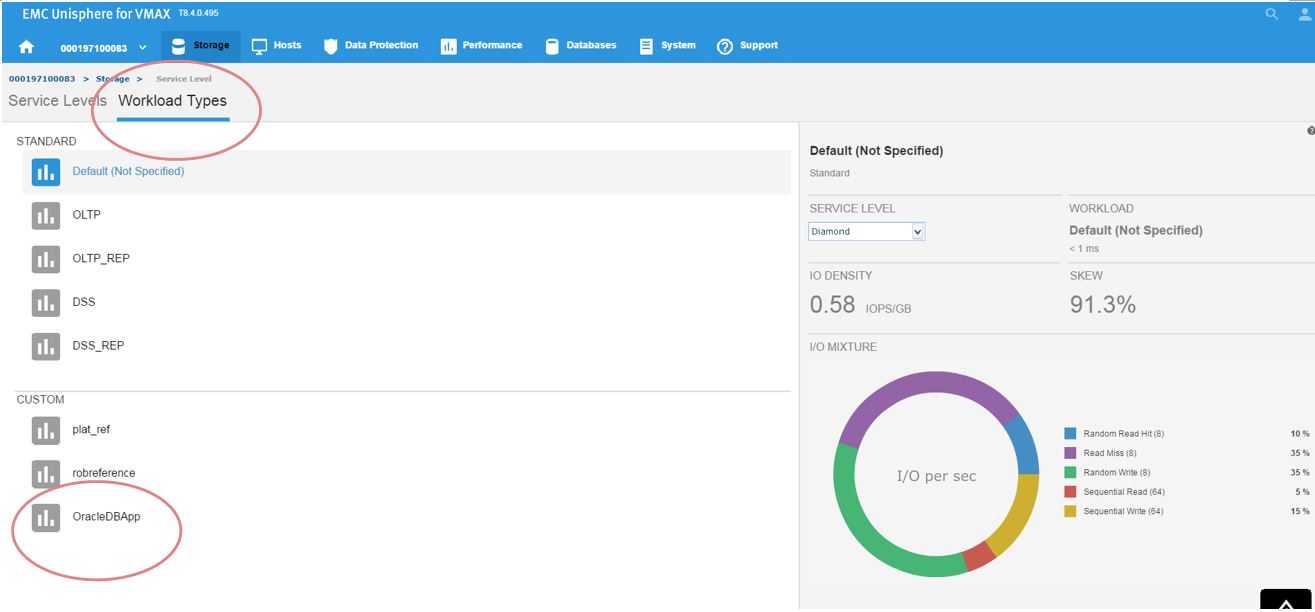
Figure 6. Save workload type
Now, we can see the reference workload we have customized in OracleDBApp. Since we are satisfied with the configuration of this application’s performance, we can leverage this workload type for use in the future when rolling out similar type applications.
Let’s see how we can use this in the provisioning wizard.
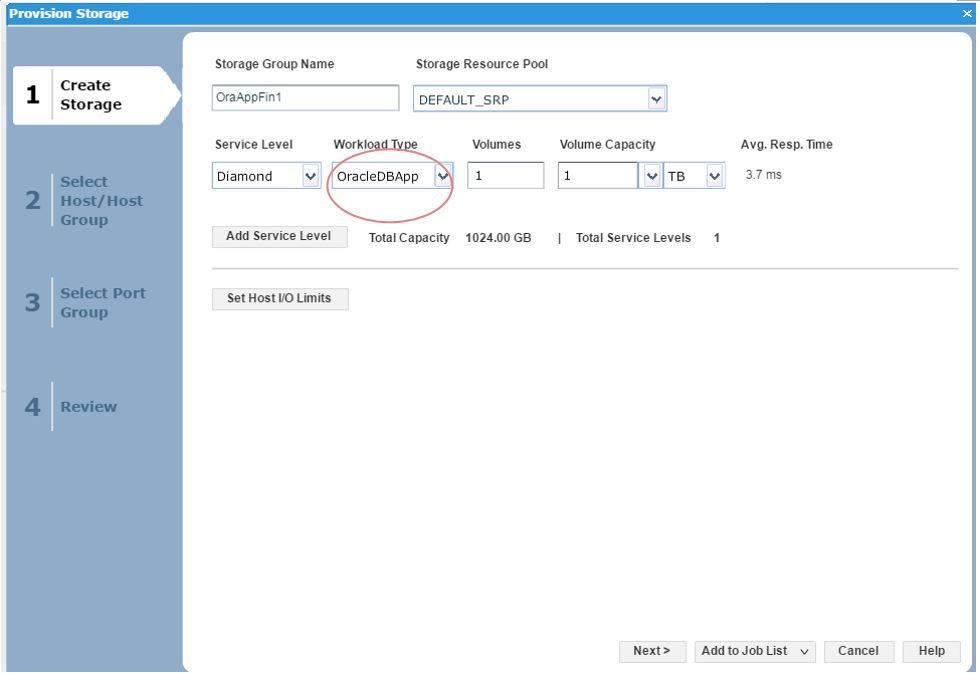
Figure 7. Create storage group view
Here, we can see that as we have received another request from our finance team for a new SG, so we decide to choose the workload type we had previously customized as a reference point and use this for the new SG.
Investigating an SG compliance issue with WLP
Let’s begin with a realistic scenario. One of our application teams contacted us over an issue with an SG, and they wanted us to investigate further to see if it has had any compliance issues in the recent past. Let’s begin with looking at the SG compliance report.
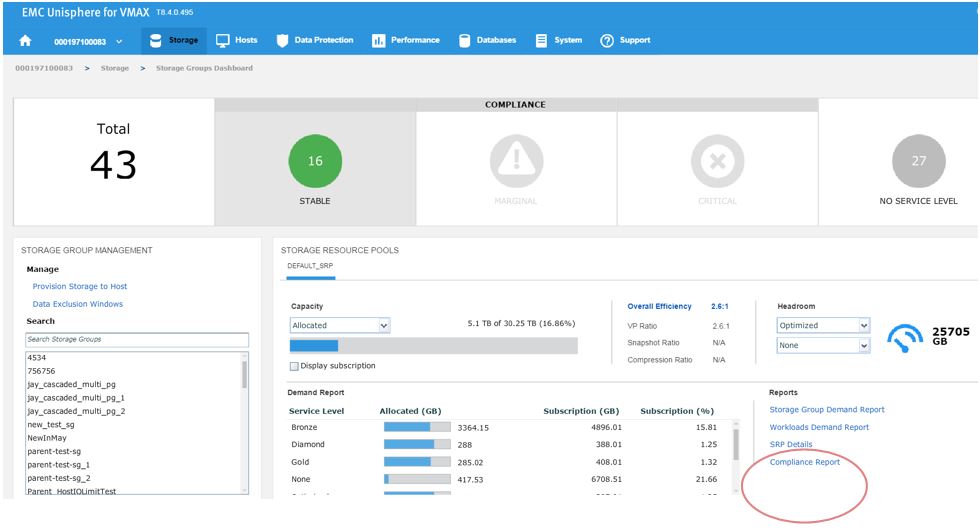
Figure 8. Storage group compliance view 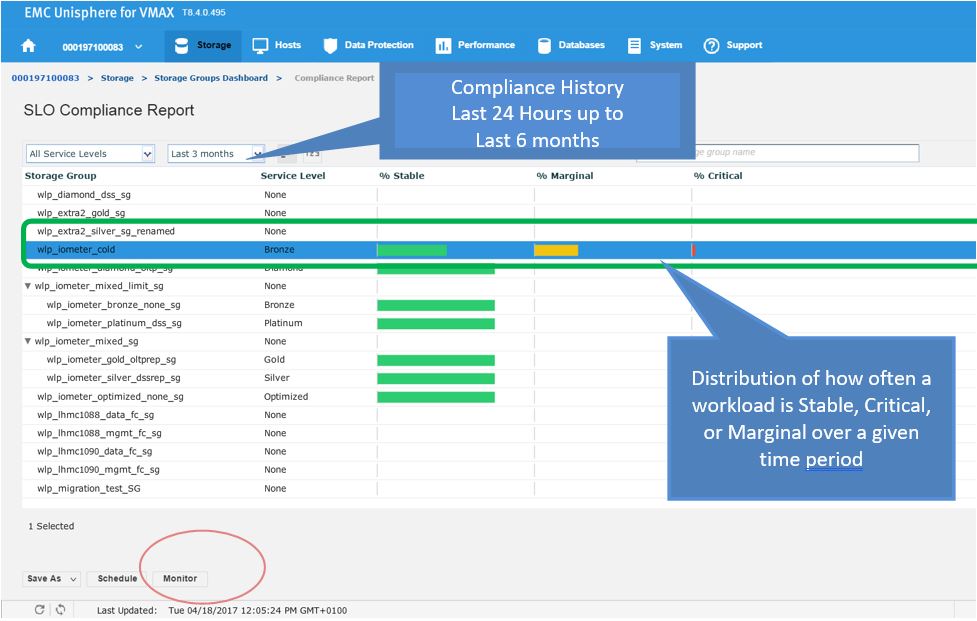
Figure 9. Storage group compliance issue
Here we see for the SG wlp_iometer_cold, we had a compliance issue in the last 3 months, with some being in a marginal state and some being in a critical state. If we select the SG, we have the option of saving the report off for reference or to potentially show to the application owner. We can also select Monitor, which will launch us directly into the Performance section of Unisphere shown in the following figure where we can check specific metrics.
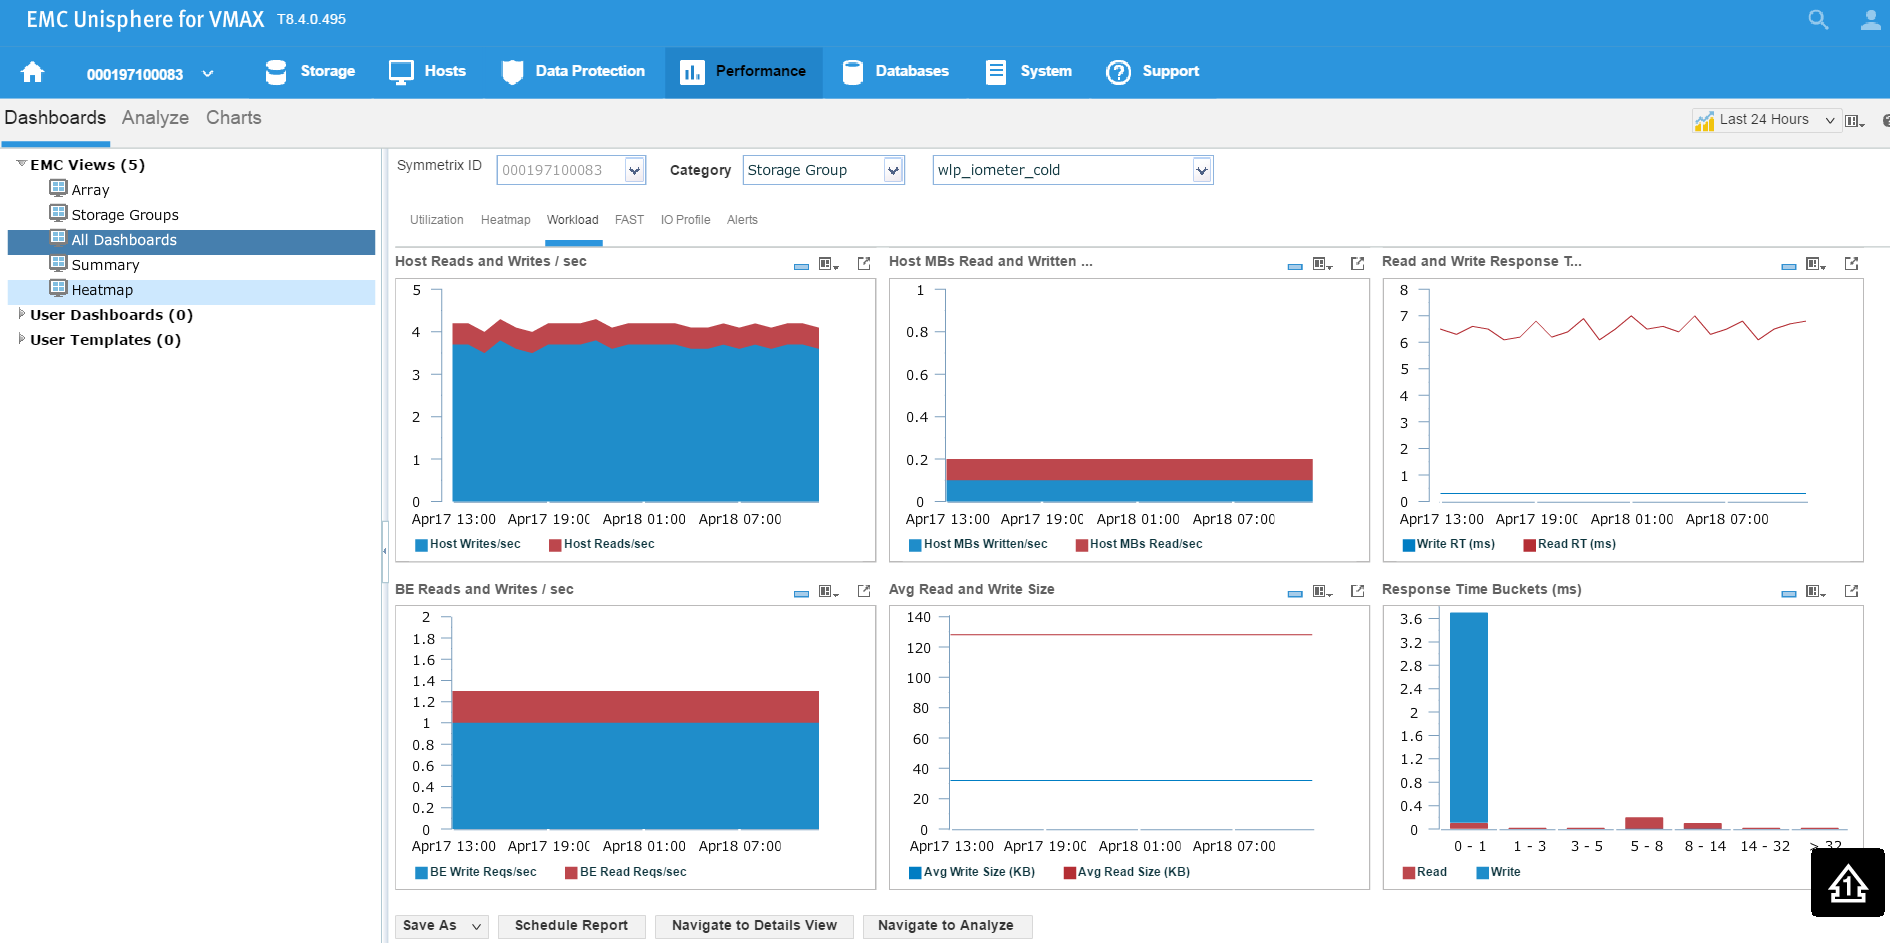
Figure 10. Storage group performance view
Examining headroom for Service Level and Workload Type combinations
In this section, I will be covering how to examine the available headroom for various Service Level and Workload Type combinations. Also, I will show you how to run a suitability check while provisioning more storage to an existing storage group.
The headroom available shows the space available for a certain combination of service level and workload type if all the remaining capacity was on that type. Here, I wanted to show you two examples for different service levels to showcase the calculation change.
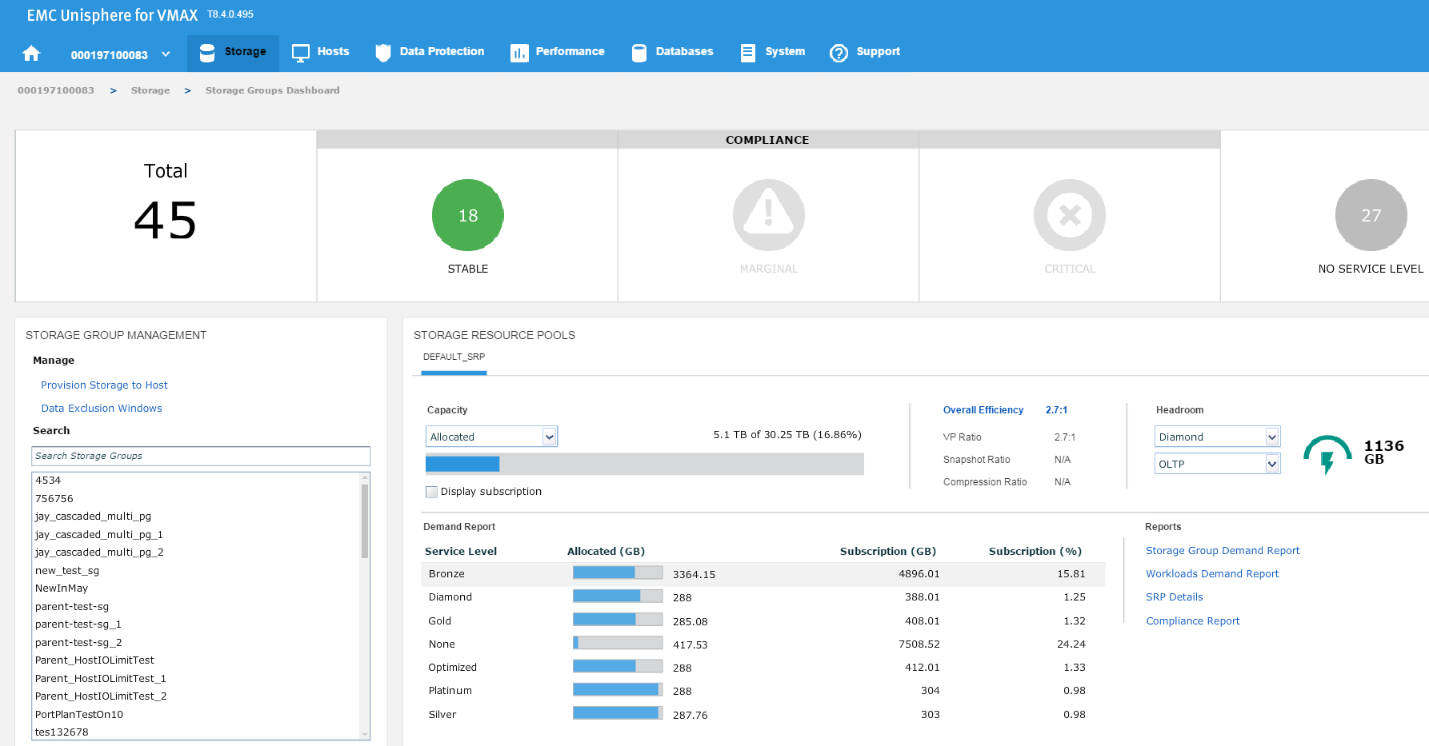
Figure 11. Storage group compliance view
In this example, we have chosen a Diamond SLO and an OLTP workload, which allows us free space of 1136 GB with that combination for that array. Let’s change the parameters, and see what happens.
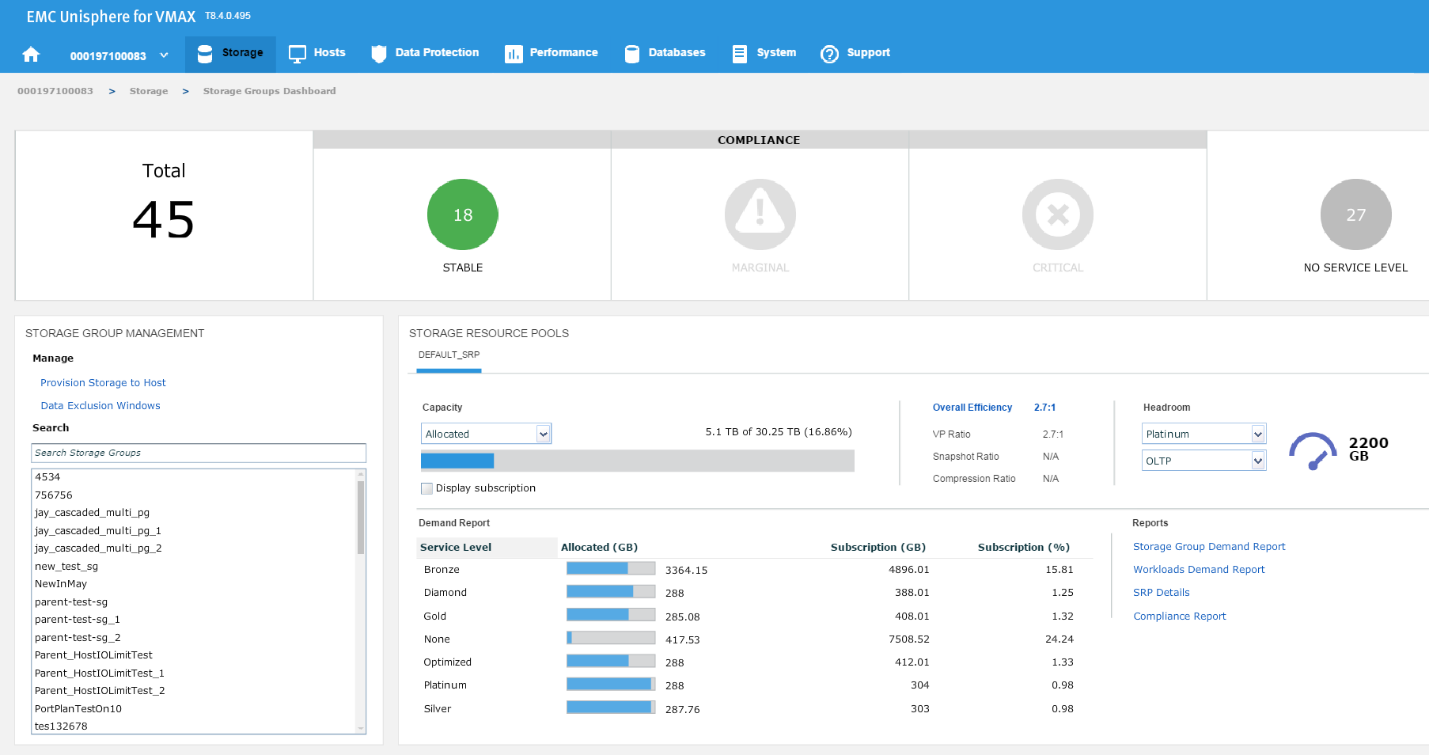
Figure 12. Storage group resource pools view
Now, we have 2200 GB of space available at a platinum level, which is almost double the capacity we had at Diamond level. These can be useful indicators of when we have an array that is nearing capacity as we can gauge which of our most important applications can go on to which SLO so we can maximize the efficiency of our storage.
Expanding the capacity of an existing SG
Now, let’s examine how we can expand the capacity of an existing SG while checking its suitability through the provisioning wizard. Let’s start at the SG list view in the storage group dashboard. We select our SG and then click on View Details.
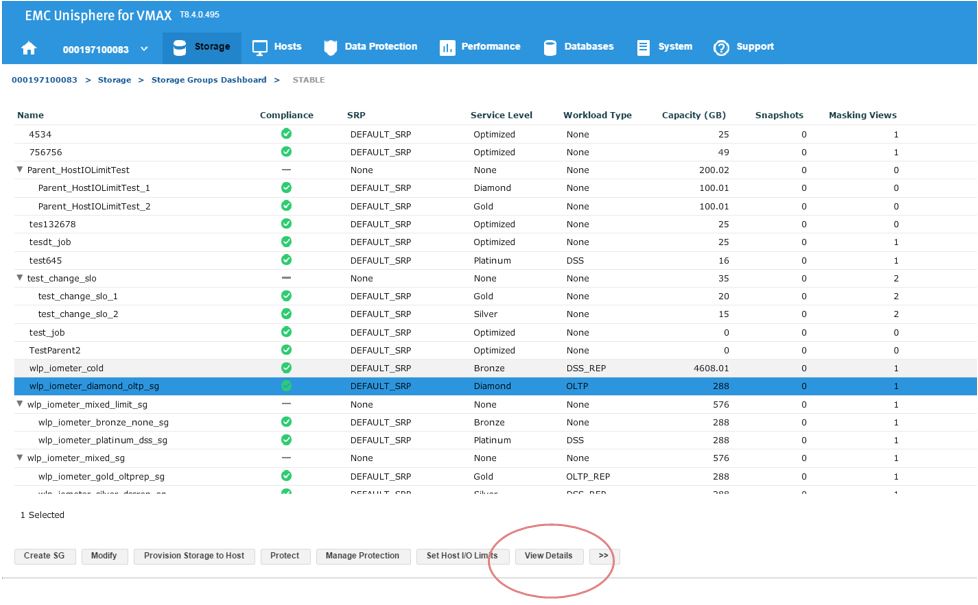
Figure 13. Storage group dashboard view
This will take us to the Details view of the wlp_iometer_diamond SG, which is the SG we want to expand. We then select Modify to start the process.
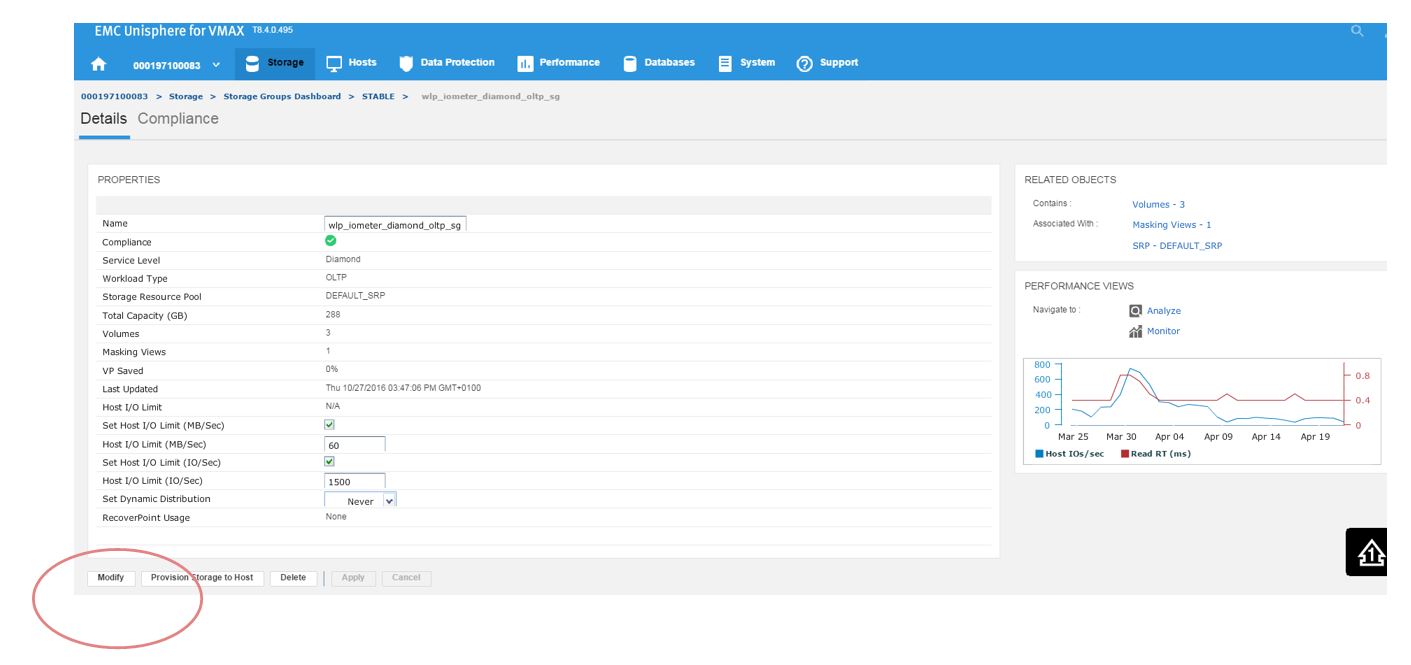
Figure 14. Storage group properties view
This launches the Modify Storage Group wizard shown in the following figure. We have received a request from the application owner that they need additional storage, however we wanted to be sure prior to allocation that they will not breach their SLO compliance nor experience any performance problems.
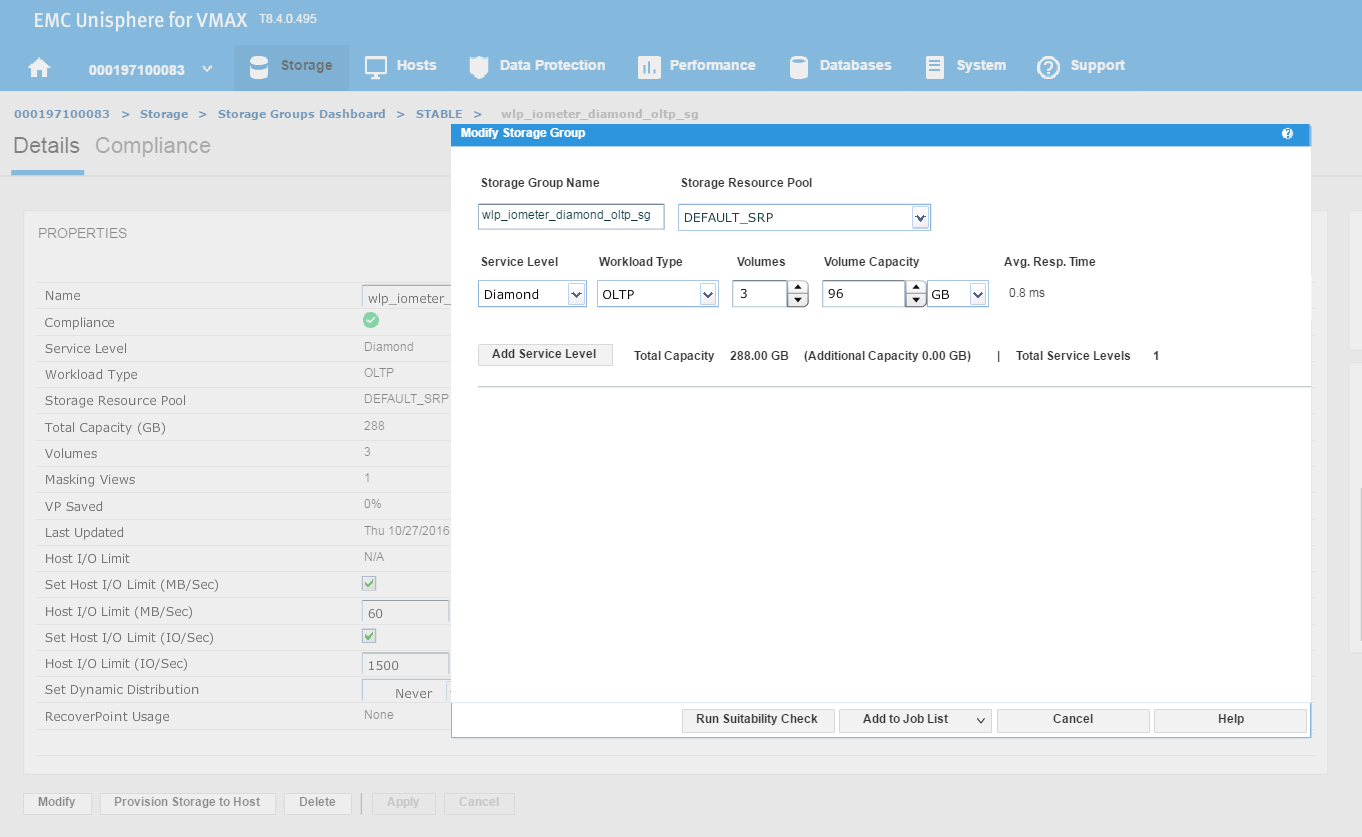
Figure 15. Modify storage group view
We have agreed with the application owners to grant them an additional 96 GB of storage, which will expand their capacity by roughly 25%. This allows us to increase the number of volumes by 1, and then select Run Suitability Check to verify this change won’t affect the performance of the SG adversely.
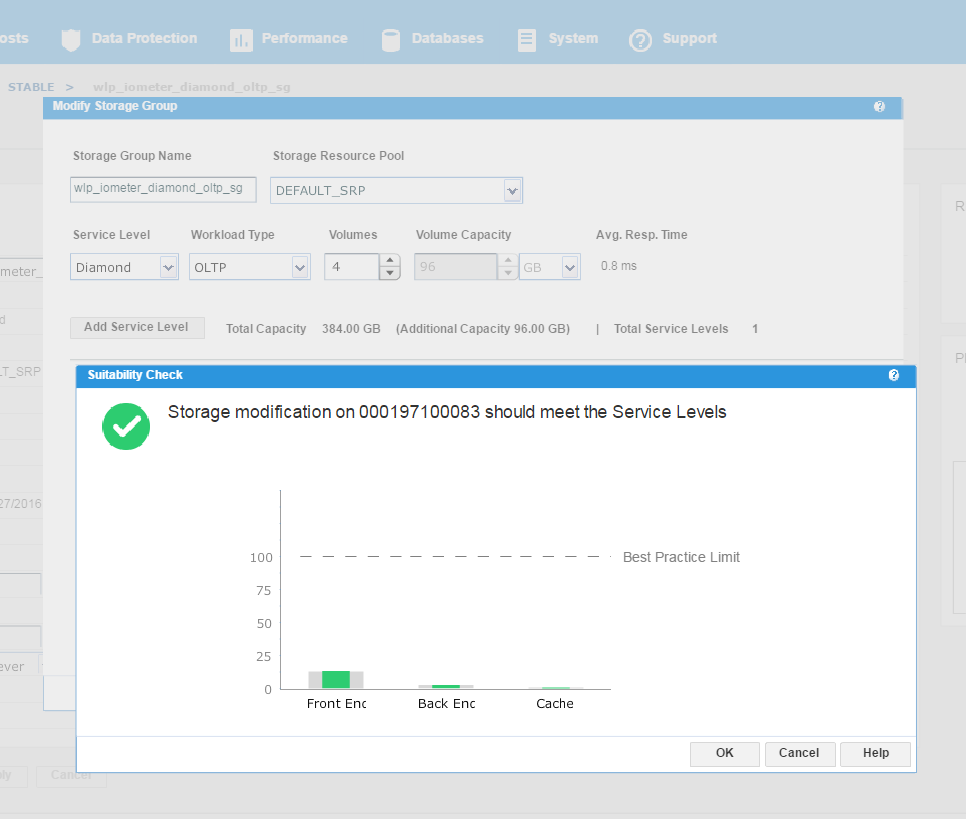
Figure 16. Storage group service levels view
We can see that the check has completed successfully and that increasing the capacity of the SG will not have any adverse effects on its performance. This promotes good housekeeping in terms of the storage array as we prevent poor configurations from being rolled out. At this stage, we can select Run Now and add to the job list to run later.
Data Exclusion Windows
In this section, I will be covering how to manage Data Exclusion Windows. This procedure explains how to manage Data Exclusion windows for calculating headroom and suitability.
Peaks in storage system statistics can occur due to:
- Anomalies or unusual events
- Recurring maintenance during off-hours that fully loads the storage system
Due to the way this data is condensed and used, unexpected headroom and suitability results can occur. There are two ways to improve the handling of these cases:
- One-time exclusion period – When the one-time exclusion period value is set, all statistics before this time are ignored. This helps resolve anomalies or unusual events where a significant one-time peak distorts the results due to reliance on two weeks of data points. This is set system wide for all components.
- Recurring exclusion period – You can select n of 42 buckets to use in admissibility checks. This is set system wide for all components. Recurring exclusion periods are repeating periods of selected weekday or time slot combinations where collected data is ignored for the purpose of compliance and admissibility considerations. The data is still collected and reported, but it is not used in those calculations.
Let’s begin at our usual starting point, the storage group dashboard, by selecting the Data Exclusion Window.
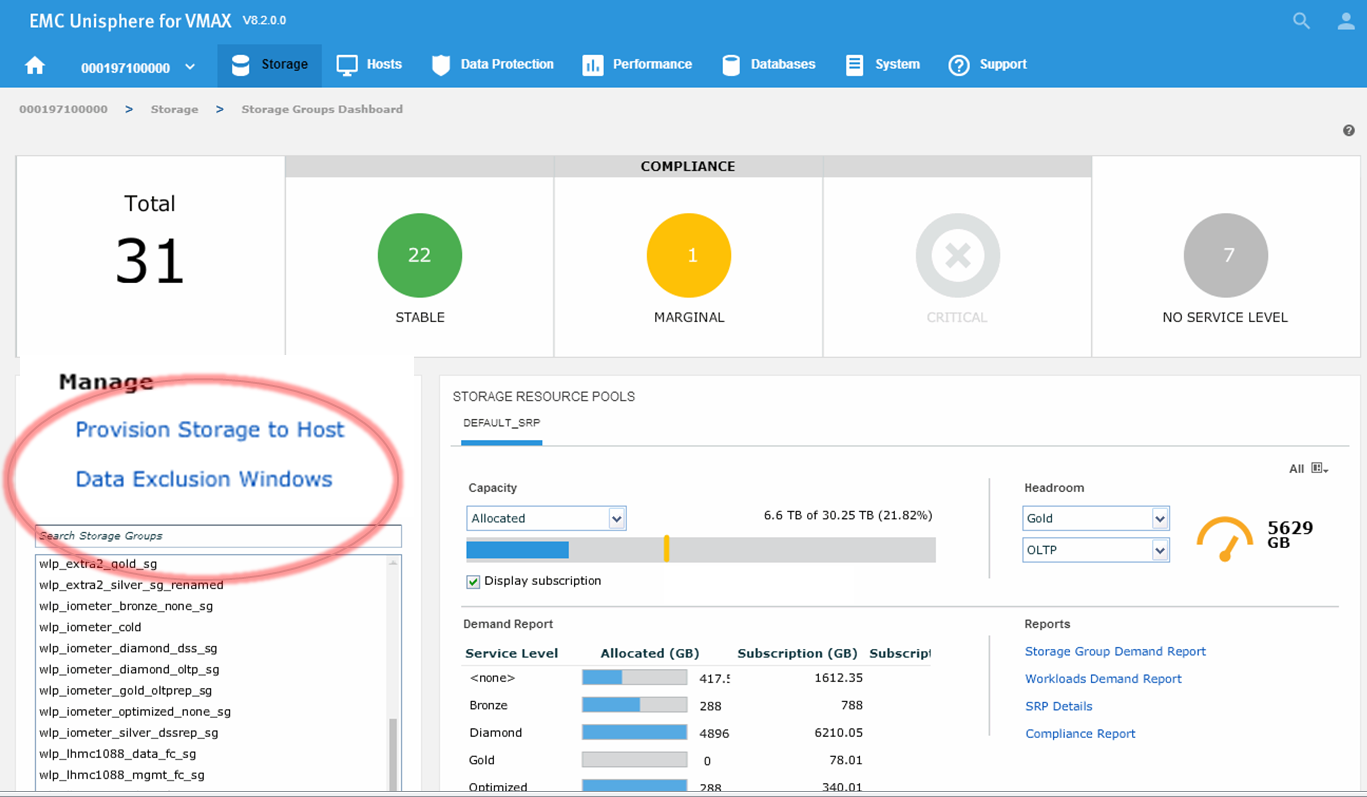
Figure 17. Data Exclusion Windows
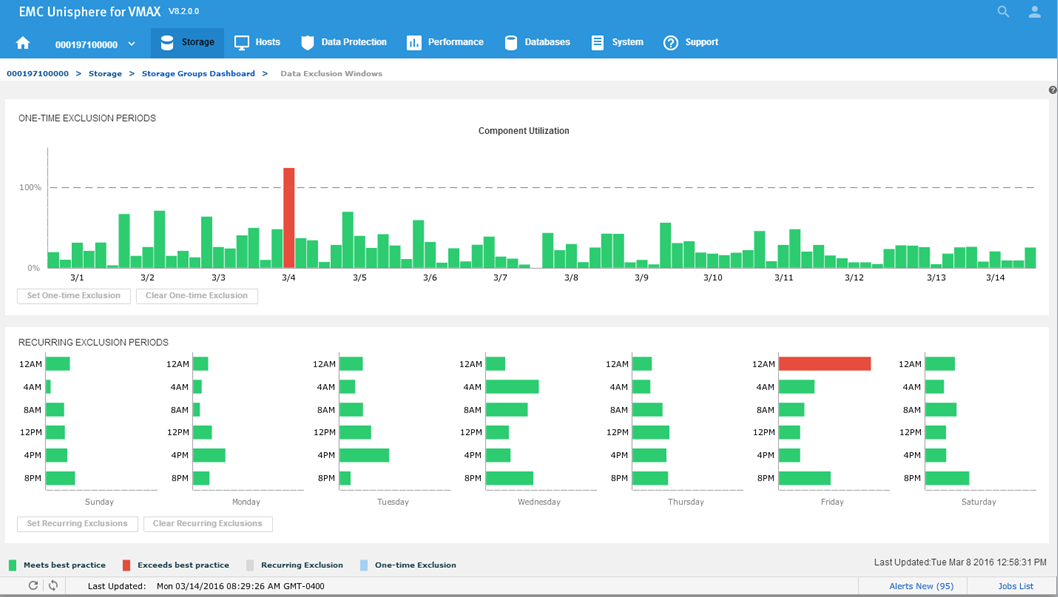
Figure 18. Data Exclusion Windows
All the component utilizations for the prior two-week period are compared, and the greatest (with respect to its individual best-practice limit) is displayed across the top of this display. Each weekly time period, represented by two bars in the top display, is also displayed across the bottom.
Now we will set a one-time exclusion window. When you click on the tallest bar in the top display, all history up to that time is shaded. You can then select Set One-time Exclusion so the bottom display panel is recalculated excluding that time frame.
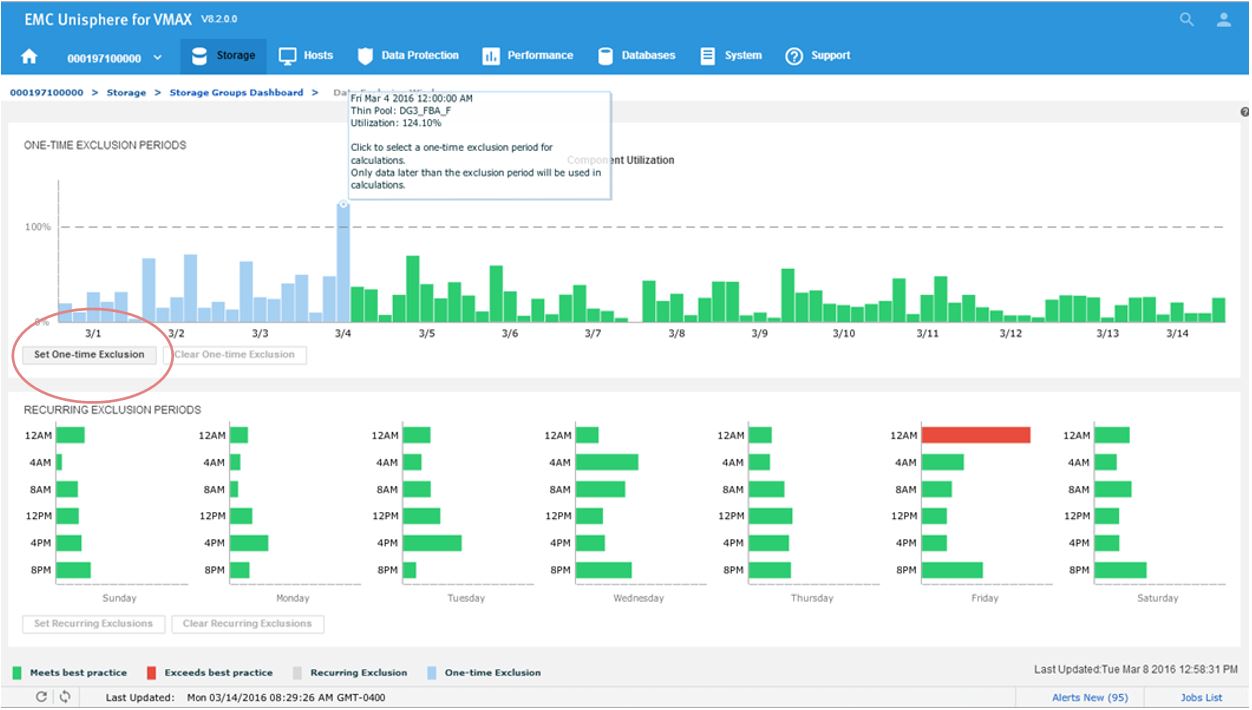
Figure 19. Data Exclusion time window view
After setting the exclusion, you can now see that at 12 a.m, we are green in the bottom panel as we have chosen to ignore that specific timeframe in our calculations.
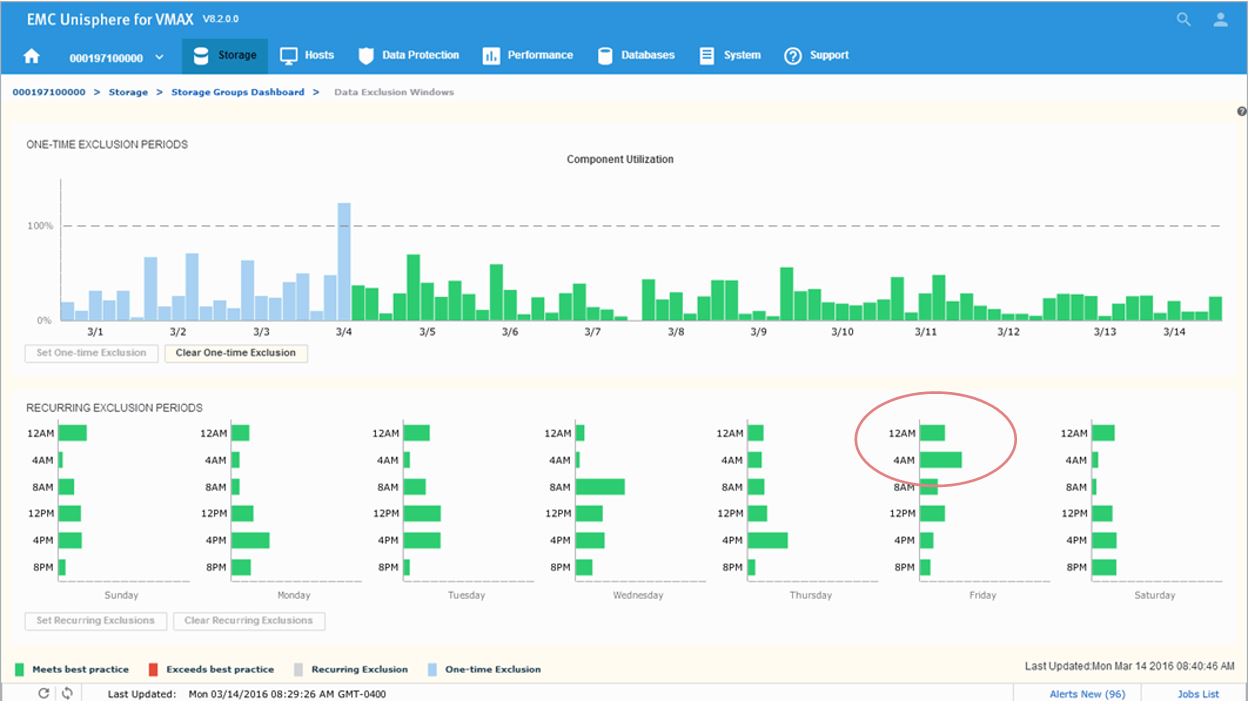
Figure 20. Data Exclusion Windows time view
Next, we will look to set a recurring Exclusion window:
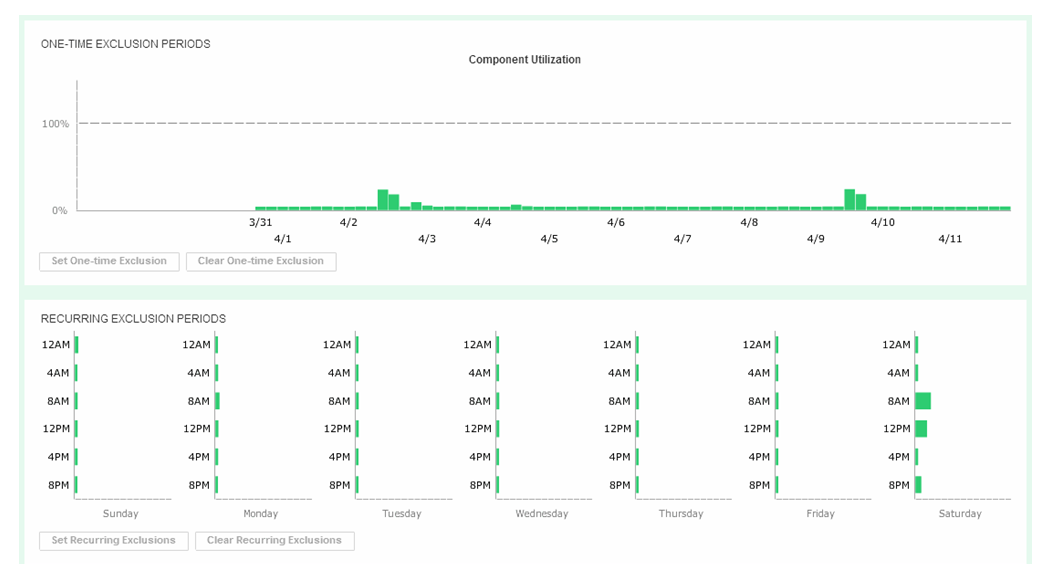
Figure 21. Set recurring Data Exclusion Window
If you click on the bars in the bottom display, their state will toggle, shading themselves and the two corresponding bars in the top display to set any weekly period to be excluded from all suitability and headroom calculations from there on for the future.
FAST Array Advisor
In this section, I will be covering how to leverage FAST Array Advisor to see if you could move workloads between arrays. The FAST Array Advisor wizard determines the performance impact of migrating the workload from one storage system (source) to another storage system (target). If the wizard determines that the target storage system can absorb the added workload, it automatically creates all the necessary auto provisioning groups to duplicate the source workload on the target system.
Let’s pick a suitable SG PF_NDM_2_SG and select the More Options button.
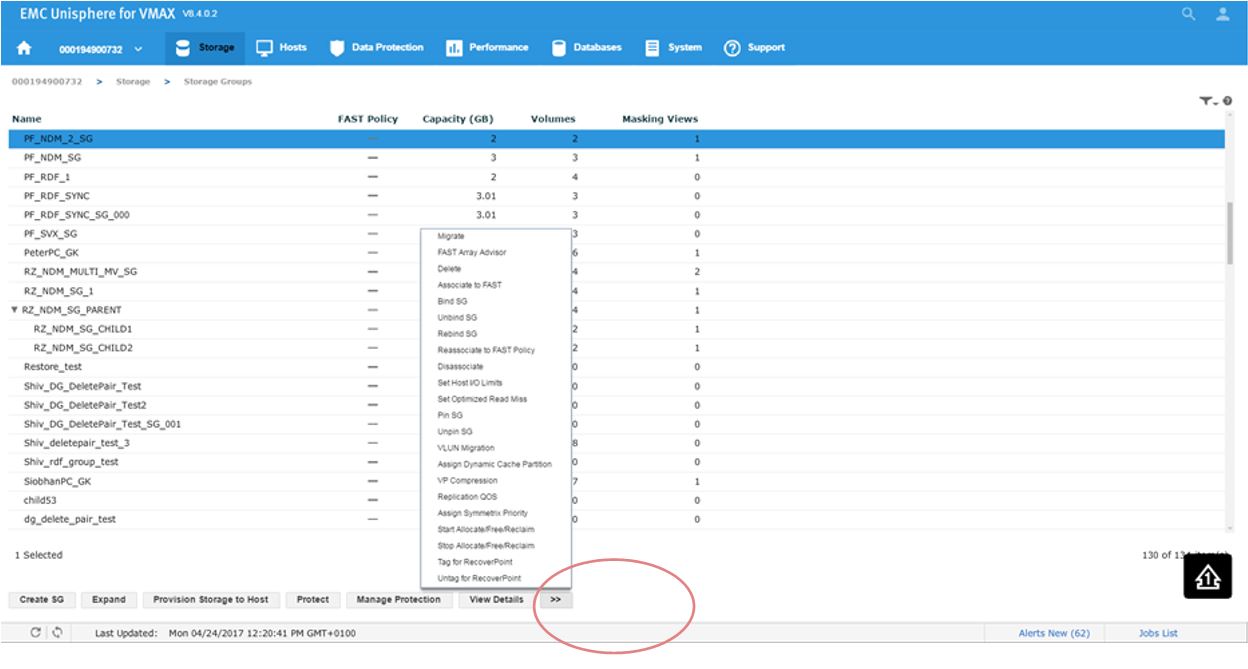
Figure 22. Storage group selection view
This will present us with a series of options. Second from the top, we see FAST Array Advisor, so we select that.
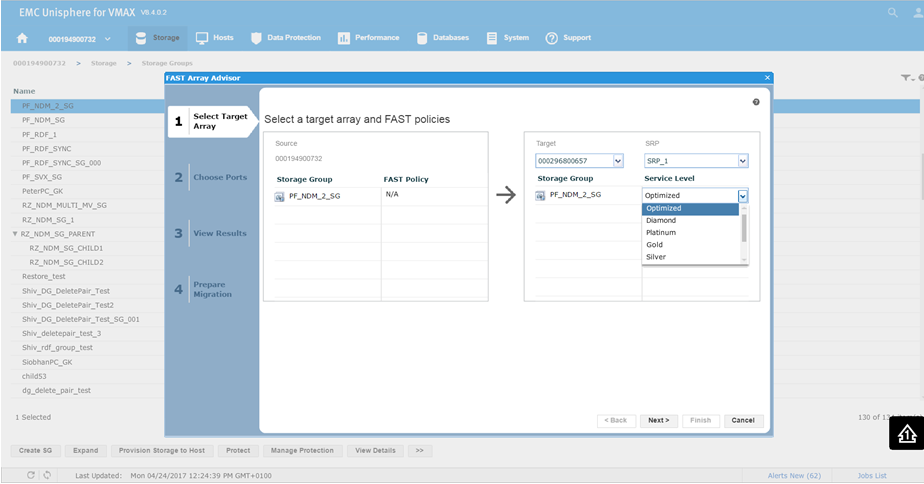
Figure 23. Select target array view
This will bring us the wizard where we select the source and target array. In this example, 0732 is a V1 running 76 code, and we want to look at the possibility of moving it to 0657 which is a V3 running 77 codes. This is viewed in terms of a migration of the SG off the older source array and on the newer target array. You can see that on a V1, we did not have service levels, however we can set them on our V3 array. For this example, we choose a Silver SLO and click Next.
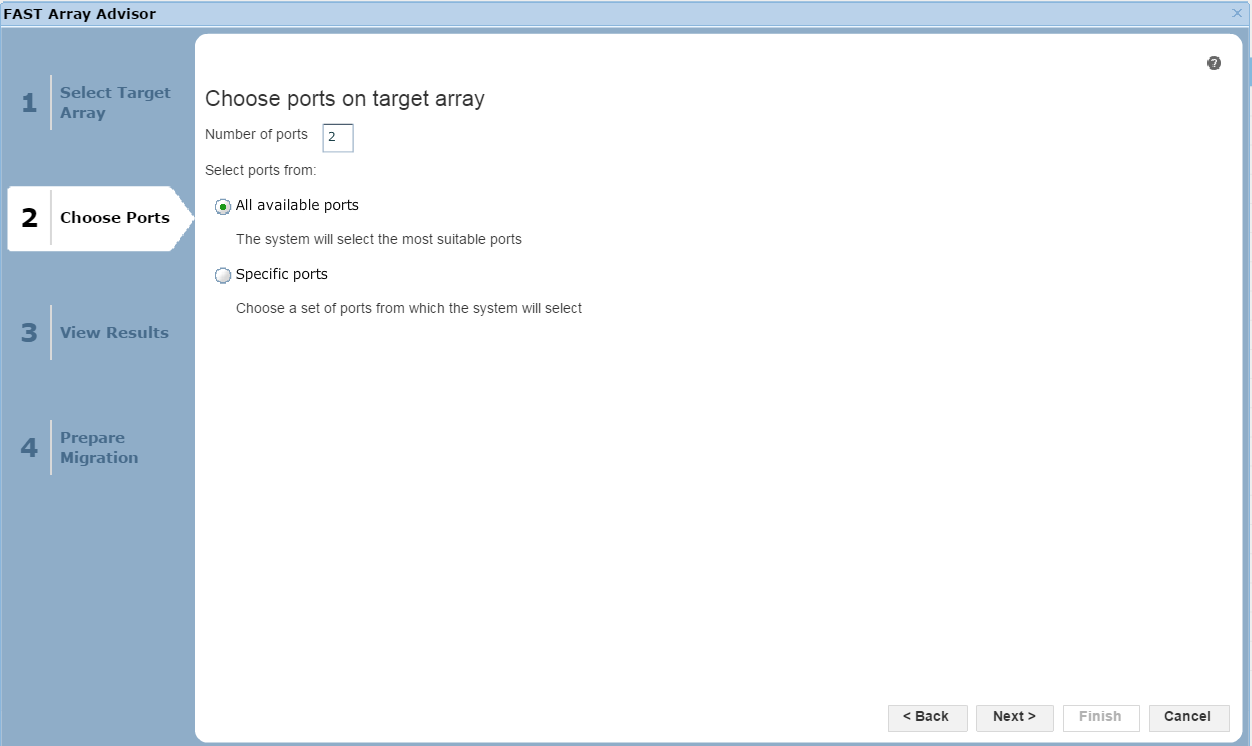
Figure 24. Port selection view
In this section of the wizard, we have the option of allowing Unisphere to choose the most suitable ports based on how busy they are, or we can select specific ports if we like. Click Next to view the results.
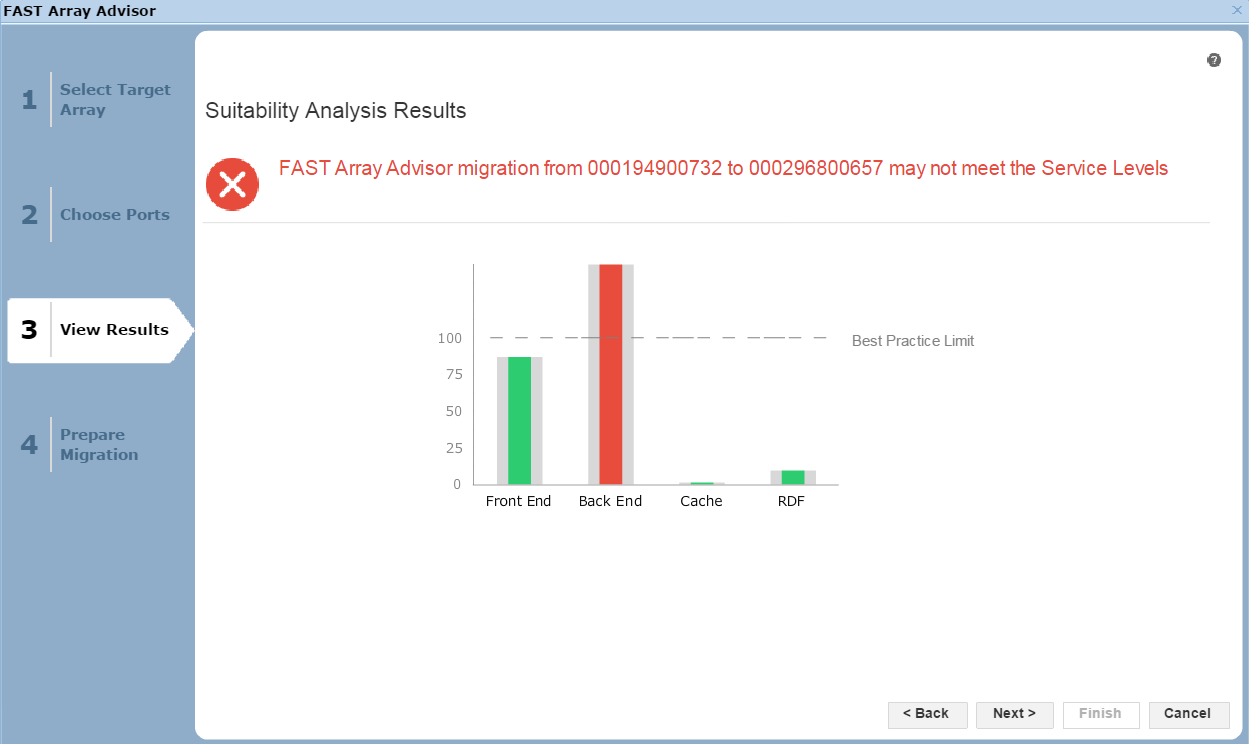
Figure 25. Suitability analysis view
Here, we see the results of the potential migration. The front end, the cache utilization, and the RDF impact all look fine. That said, in the back end, we would exceed our Best Practice Limit, so we may suffer from contention and performance issues as a result. It would be up to the individual customer to proceed in these circumstances, however we would recommend adhering to best practices. In this case, let’s select Next to view the final screen of the wizard.
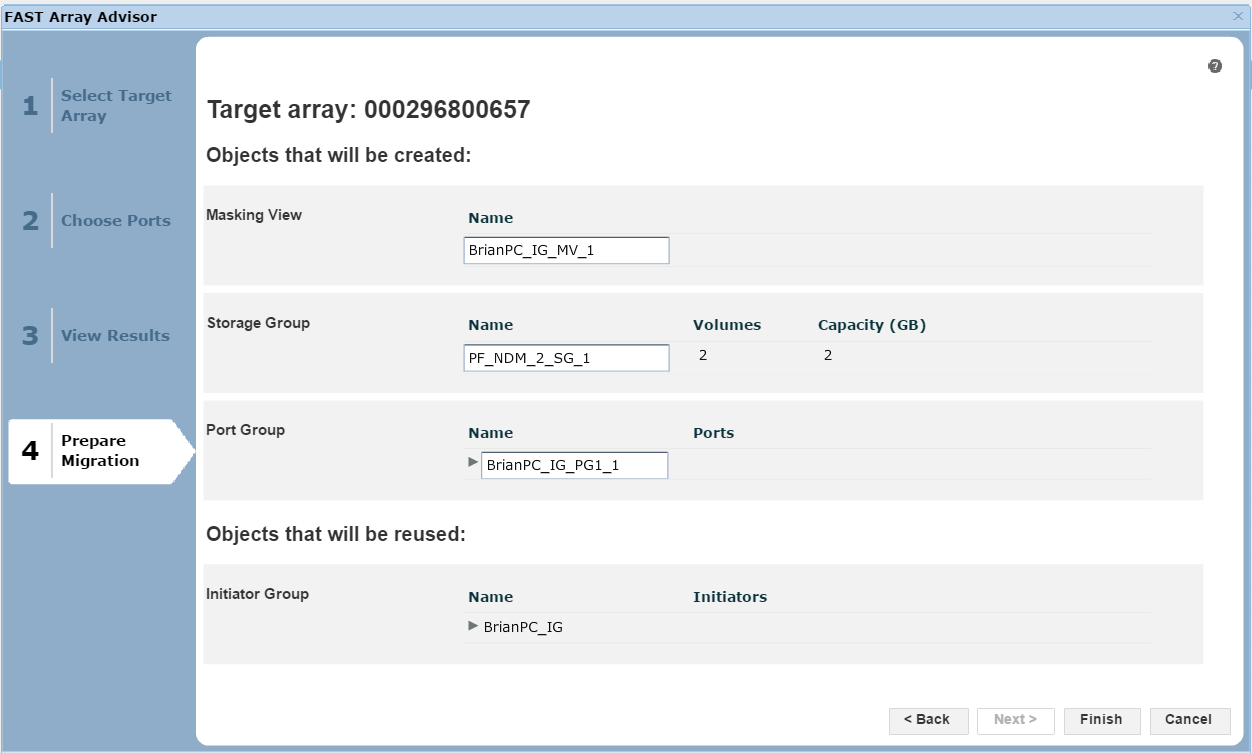
Figure 26. Prepare migration view
Here, we are presented with a summary of the migration if we were to go ahead, listing what objects, such as the masking views, storage groups and port groups, would be created on the target array 0657. At this point, we can click Finish to begin the migration.
Author: Finbarr O’Riordan, ISG Technical Program Manager for Transformation

RESTing on our Laurels - What’s New with the PowerMax API and Unisphere 10.1

Tue, 17 Oct 2023 13:12:28 -0000
|Read Time: 0 minutes
Unisphere 10.1 has just been released! Although the internal code name was Laurel, we are doing a lot in the API, so we definitely haven’t been RESTing on our laurels!
With this release the Unisphere for PowerMax team focused on what could be done better in the PowerMax API, to make things easier for developers and to reduce the amount of code people must maintain to work with the PowerMax API. Personally, I think they have knocked it out of the park with some new features. These features lay the groundwork for more of the same in the future. As always, there is a full change log for the API published along with updated OpenAPI documents available on https://developer.dell.com. In this blog I provide my own take and highlight some areas that I think will help you as a customer.
Let’s start with the traditional Unisphere for PowerMax API. With this new version of Unisphere there is a new version of the API and simpler versioning referencing throughout the API. For example, the following GET version API call returns the api_version (in this case, 101), and the currently supported API versions with this release (101, 100, and 92). As always, the previous two versions are supported. Here, the supported_api_versions key takes any guesswork out of the equation. If you are using PyU4V, a new version (10.1) is available, which supports all of the new functionality mentioned here.
https://Unisphere:8443/univmax/restapi/version (GET)
{
  "version": "T10.1.0.468",
  "api_version": "101",
  "supported_api_versions": [
    "101",
    "100",
    "92"
  ]
}
I’ll break the other changes down by functional resource so you can skip any that you’re not using:
- Serviceability API calls
- Replication Call Enhancements
- Sloprovisioning Call Enhancements
- System Call Enhancements
- Performance API Call Enhancements
- The All New Enhanced PowerMax API – Bulk API calls
Serviceability API calls
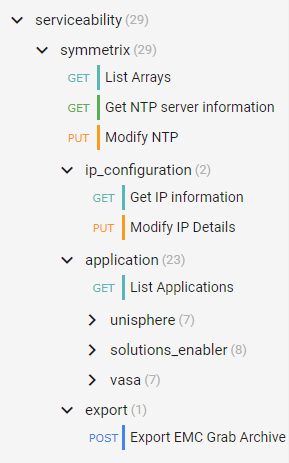
For embedded Unisphere for PowerMax users, when the system is updated to the latest version of Unipshere, a new Serviceability API Resource becomes available.
The new serviceability API calls (as shown in the following figure) give control over the embedded Unisphere, providing access to solutions enabler settings, and Unisphere settings that up until now have only been accessible in the UI, such as:
- Setting up the nethosts file for client/server access from CLI hosts running Solutions Enabler
- Host based access control
- Certificate Management of the Solutions Enabler Guest OS
- And more
Here’s the tree of the Serviceability API resource:
Note: When executing API calls to update the Unisphere application, the server will restart as a result of these changes. You must wait for these to complete before you can issue more API calls. Also, as a reminder, if you are changing the IP address of the Unisphere server you must update your API connection for future calls.
Replication call enhancements
Good news for customers using snapshots and snapshot policies. New replication calls and keys will make the management workflows easier for anyone automating snapshot control and using policies.
An updated API call adds keys for directly associated policies vs inherited policies:
101/replication/symmetrix/{symmetrixId}/storagegroup/{storageGroupId} (GET)In the API, identifying and tracking back linked snapshots has been time consuming in the past. Based on valued customer feedback, our product management and developers have implemented key changes that will help.
The ability to list storage groups that are linked targets has been there for a while, with query parameters in the following GET call:
101/replication/symmetrix/{symmetrixId}/storagegroup?is_link_target=trueHowever, finding out which snapshot was linked, and which source storage group owned that snapshot was a challenge. To make this easier, new keys now appear:
101/replication/symmetrix/{symmetrixId}/storagegroup/{storageGroupId} (GET)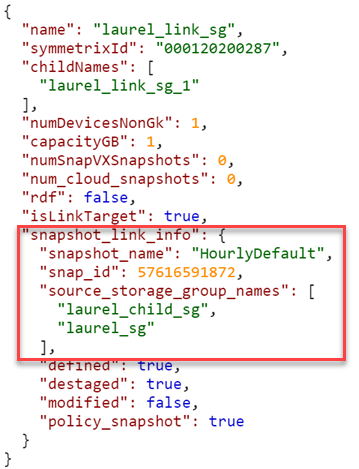
As you can see, the 10.1 API call returns a new key (snapshot_link_info) that includes all the information you need to be able to manipulate the linked snapshots, without having to engineer any trickery yourself.
Sloprovisioning call enhancements
Probably the single biggest change to the Provisioning API calls is the ability to Validate and return a Bad Request when the performance_impact_validation_option is set for sloprovisoning the /maskingview POST call. This gives the developer a way to check, at the time of provisioning, whether a workload is suited to run on the supplied PowerMax serial number. This call uses performance data from the workload planner database and can help create enhanced provisioning workloads with performance and zoning in mind.
The Payload can now accept a new key (performance_impact_validation_option) which can be set to:
- IfRecommended – Run performance impact tests. If no performance capacity threshold is breached, run the requested configuration change.
- Preview – Run performance impact tests and return performance impact scores for the requested operation. Return the input object (with generated fields, if applicable) for relevant follow up API calls.
In addition, the payload has a “portGroupSelection” key that can automatically create a new port group or use an existing port group based. If automatic selection is used, selection can be either UtilizationBased or ZoningBased. (Note: Automatic port selection is only available for Fibre (SCSI FC))
If you choose to use an existing port group, existing port groups are evaluated by the workload planner algorithms examining port groups that are already configured on the system. The algorithm will select the least loaded port group for the provisioning and ignore zoning. Users have the Option to restrict selection to a supplied list of port groups using the API keys. See documentation for details of the various keys.
Note: When using the performance impact selection, you can’t specify an existing storage group because it’s assumed that they are already provisioned. Full documentation for the API call mentioned is here with the supported parameters.
The provisioning API calls include other additions:
- Update POST for Create Masking View, to allow the specifying of a Starting LUN Address. This was a customer enhancement to make it easier to configure boot from SAN.
- Update PUT for Modify SG, to allow the specifying of a Starting LUN Address when adding volumes. .
- Update PUT for Modify SG, to allow terminating snapshots associated with volumes being removed from a SG in a single call. This is very useful because it prevents stranded snapshots from consuming space on the array.
System call enhancements
We have added system calls to enable the refresh of Unisphere. This is useful to customers who are working in a distributed environment and who want to ensure that Unisphere data is up to the second with the latest information. This should be the case, but in the event that there were changes made on a remote system, it could take a minute or so before these are reflected in the object model. The new refresh call has some guardrails, in that you can only run it once every five minutes. If you try to execute too soon, status code 429 will return with message telling you to wait for it to come back:
“Bad or unexpected response from the storage volume backend API: Error POST None resource. The status code received is 429 and the message is {'retry_after_ms': 285417}.”The documentation for this API call (/101/system/symmetrix/{array_serial}/refresh) is here.
Getting information about REST API resources and server utilization was previously only ever available in the user interface. It made sense to make this information available through the REST API because the information pertains to REST. The new GET call to obtain this information (/101/system/management_server_resources) is available, documentation is here.
Along the same lines, we have also added the following calls:
- Change Log Level - /101/system/logging (PUT/GET)
- Configure/Check SNMP Destination - /101/system/snmp (GET/POST/PUT/DELETE)
- Server Cert management - /101/system/snmp/server_cert (POST)
- Configure SNMPv3 with TLS - /101/system/snmp/v3_tls (POST)
- Manage PowerMax Licensing via API
Performance API call enhancements
There is only one minor change in the traditional API for performance with this release. We are adding the ability to register a list of storage groups for real time performance and also bring file metrics for SDNAS onto the Unisphere for PowerMax array for monitoring. The POST call /performance/Array/register has been updated to take new keys, selectedSGs, and a file.
The new payload would look something like this:
{
  "symmetrixId": "01234568779",
  "selectedSGs": "sg1,sg2,sg3",
  "diagnostic": "true",
  "realtime": "true",
  "file": "true"
}
There are some additional changes for mainframe and also Workload Planner which are covered in the changelog documentation. I just want to highlight here what I think most customers will be interested in and give some background.
The all new enhanced PowerMax API – Bulk API calls
I’ve been looking forward to being able to announce some very nice enhancements to the PowerMax API. The API provides new calls with resources accessible under a different Base URI. Rather than https:// {server_ip}:{port}/univmax/restapi/, the new API calls are under https://{server_ip}:{port}/univmax/rest/v1.
The difference between the two entry points will become apparent as you get used to these calls and the versioning will be arguably simpler going forward. Documentation is here.
- GET - /systems/{id}/volumes
- GET - /systems/{id}/storage-groups
- GET - /systems/{id}/performance-categories
- GET - /systems/{id}/performance-categories/{id}
For complete details about these endpoints, see:
- The API documentation marked "POWERMAX - ENHANCED ENDPOINTS"
- The Unisphere for PowerMax 10.1 REST API Changelog
“Ok” I hear you say, “so what’s the big deal?”. Well, these endpoints behave differently from our existing API calls. The provide more information faster so that developers don’t have to maintain a lot of code to get the information they need.
The volumes GET call returns details about every volume on a system in a single call. There is no pagination required and you don’t need to worry about iterators or have to deal with anything fancy. The API just gives you back one big JSON response with all the information you need. This eliminates the need to loop on calls and will dramatically cut down the number of API calls you need to issue to the server.
The same is true for the storage groups calls. With a single call, you can get information on all storage groups on the system, their attributes, and which volumes are in those groups.
But wait, there’s more…
We have implemented a modified form of filtering of the response. You can now filter on all attributes and nested attributes that are returned in the response:
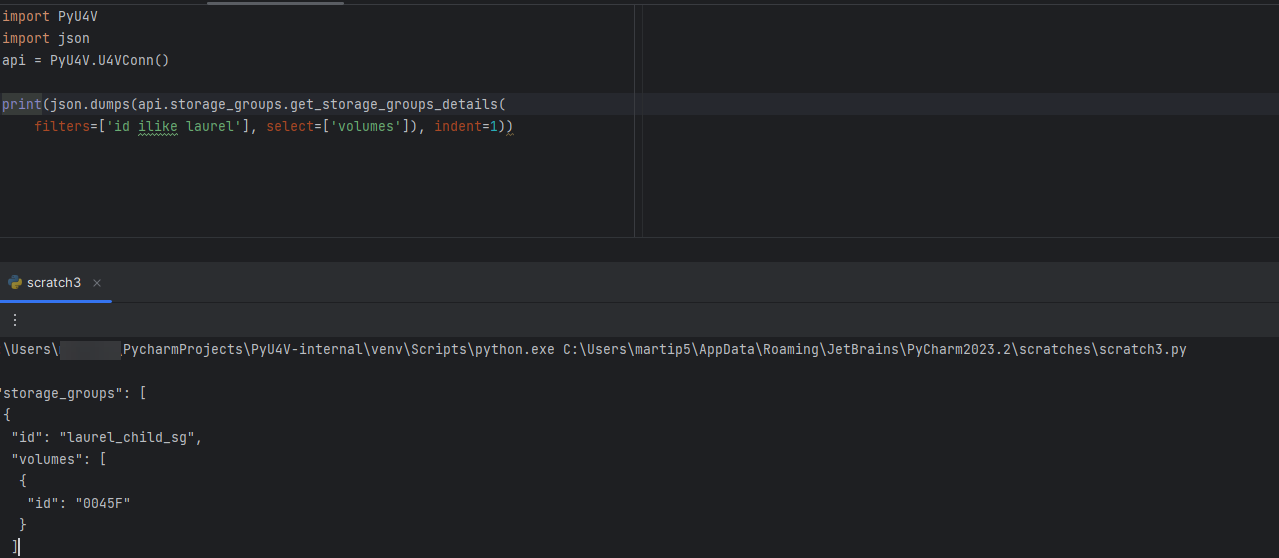
../storage-groups?filter=cap_gb eq 100
../storage-groups?filter=volumes.wwn like 12345678
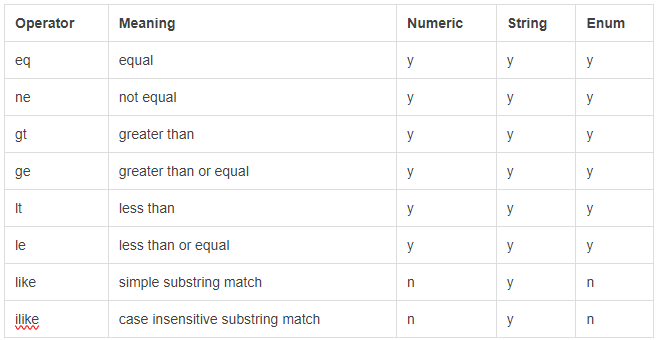
The available filter options are:
 The endpoints require you to “select” the desired attributes instead of returning everything up front. By doing so, you can control how server-intensive each request is by omitting or including only the relevant info:
…/storage-groups?select=cap_gb,uuid,type,num_of_volumes
This returns only the cap_gb,uuid, type and num_of_volumes for each storage group.
This also applies to nested attributes (a full stop is used to define child attributes):
…/storage-groups?select=volumes.wwn,volumes.effective_wwn,snapshots.timestamp_ms
If no attributes are defined in the “select”, only the default values, such as “id”, are returned. The list of attributes that can be selected is available in the documentation here.
Functions are also available for this in PyU4V. Currently multiple filter options are combined in an AND pattern and select can be applied to the data to reduce the output to only what you are interested in. The following is an example of this functionality as executed through PyU4V 10.1:
With this new functionality you can get all details for your volumes and storage groups in two calls per array, reduced from tens of thousands of calls on larger systems.
Enhanced performance metrics with the new Bulk API
In addition to the new GET calls for Volumes and Storage groups, there are new calls for the performance metrics.
The /systems/{id}/performance-categories (GET) call returns a list of performance categories valid for the arrays you are querying.
When you query each category, the API returns the last interval of diagnostic performance data using the new /systems/{id}/performance-categories/{id} GET call. This returns all key performance indicator metrics at the diagnostic level for the category and all instances in that category for the last five minutes.
These new enhanced API calls reduce the amount of code that developers need to write and maintain. The API call is intentionally designed to provide only the latest information. This reduces the amount of code for which developers need to maintain performance data collection for dashboard type tools and data collectors.
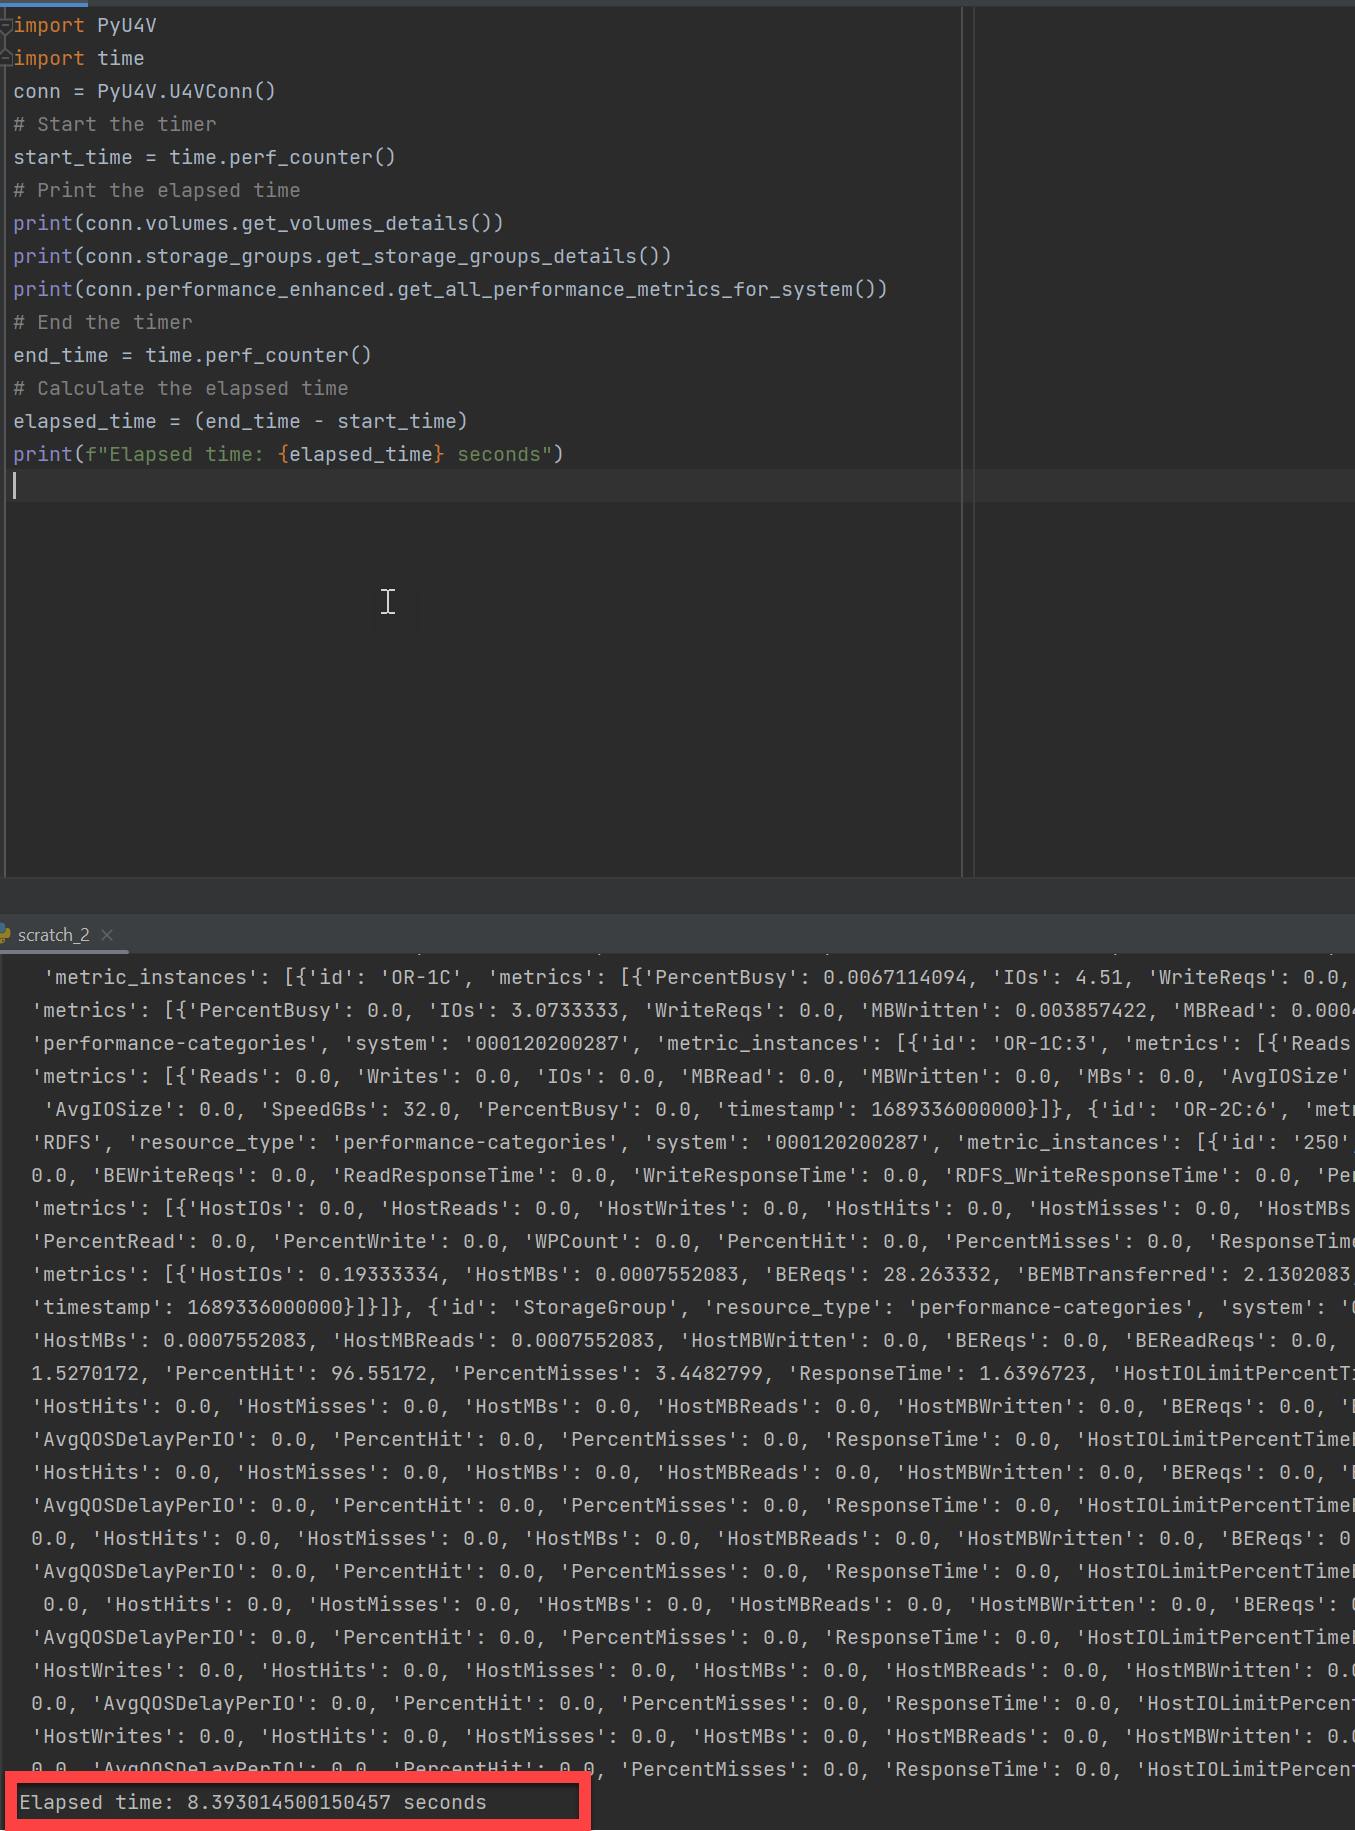
The following example shows a PyU4V script executing a few lines of code to gather all performance stats for every category on every component of a PowerMax array. It’s also gathering details on all volumes and all storage groups using the new Enhanced API calls. On my system, the code takes about eight seconds on average to gather all that information.
To wrap up
Hopefully this blog has provided some insight into the latest changes in the PowerMax REST API. As you can see, our developers have not been RESTing on their laurels!
Watch this space for more about the PowerMax API, and if there are topics that are of interest to you and you would like to learn more, send a request to @rawstorage on Twitter and I’ll try to accommodate your request!
Be sure to provide feedback through your account team for any enhancement requests or start a discussion on https://www.dell.com/community/en/topics/automation. Our product managers will take your requests and bring them to the development team.
Author: Paul Martin