


Thinking About How to Import from VNX2 File Storage Environments?
Wed, 13 Jul 2022 09:30:08 -0000
|Read Time: 0 minutes
In the world today, many users are overwhelmed with the rapid pace of technology and innovation. Businesses are growing at swift rates and many users know they need to migrate off of older storage hardware that may be under heavy load or running out of support.
Dell PowerStore has made it simple to import other storage systems through orchestration wizards so that users can get their existing data up and running quickly on the new technology. Previous versions of PowerStoreOS allowed for block import — and now, we have come full circle to support file import!
PowerStoreOS 3.0 and higher now supports importing virtual data movers (VDMs) and their filesystems from the Dell VNX2 system. This includes both NFS and SMB file systems. Users can natively import their data without any special migration solution or hardware required. PowerStore handles all the creation, monitoring, and management.
This blog provides a quick high-level overview of the import stages. For additional details, see also a video that shows this process.
The file import workflow contains six major steps:
- Prepare VNX system
- Prepare PowerStore system
- Add Remote System
- Create Import Session
- Cutover Import Session
- Commit Import Session
Step 1 – Ensure that your VNX2 has the proper code levels and connectivity to talk to the PowerStore system. (For the latest details, see the PowerStore documentation listed at the bottom of this blog.)
Step 2 – Verify that the PowerStore system is running PowerStoreOS 3.0 or higher, and has the “file mobility network” configured. You can configure this network by selecting Settings -> Networking -> Network IP’s under “File Mobility”.
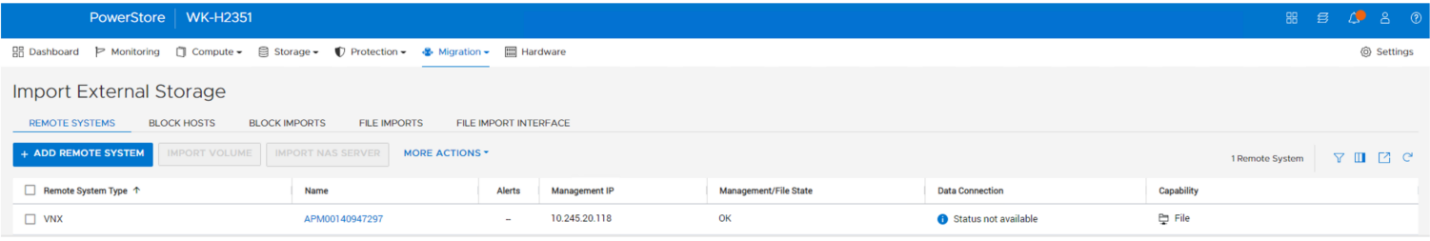
Step 3 – Add the remote system by navigating to Migration -> Import External Storage from the PowerStore management console, as shown here.
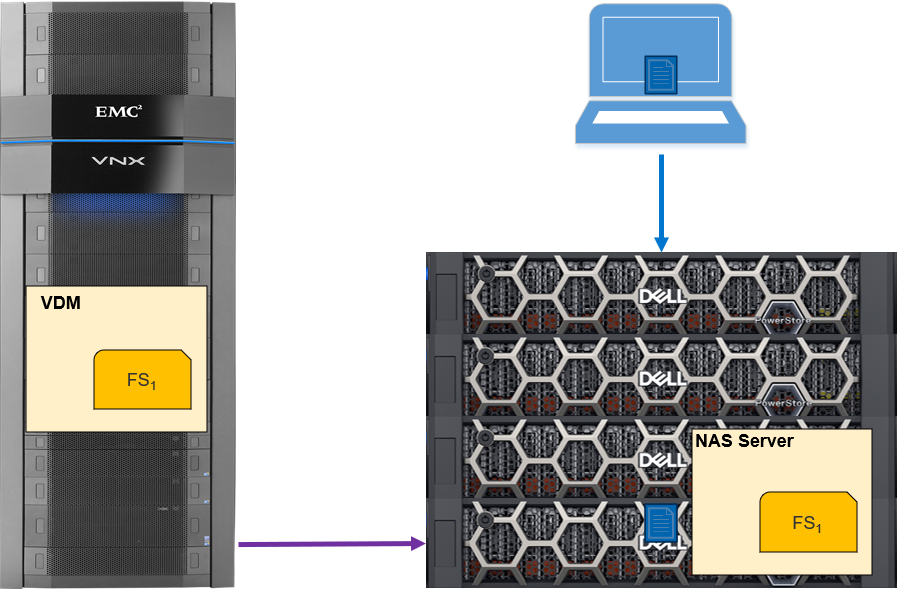
Step 4 – Create the import session. This is where you select the VNX2 VDM for import. The host is still accessing data on the VNX2. A connection is established, and resources are created on the target PowerStore. Cold data is now being copied to the PowerStore, as shown here.
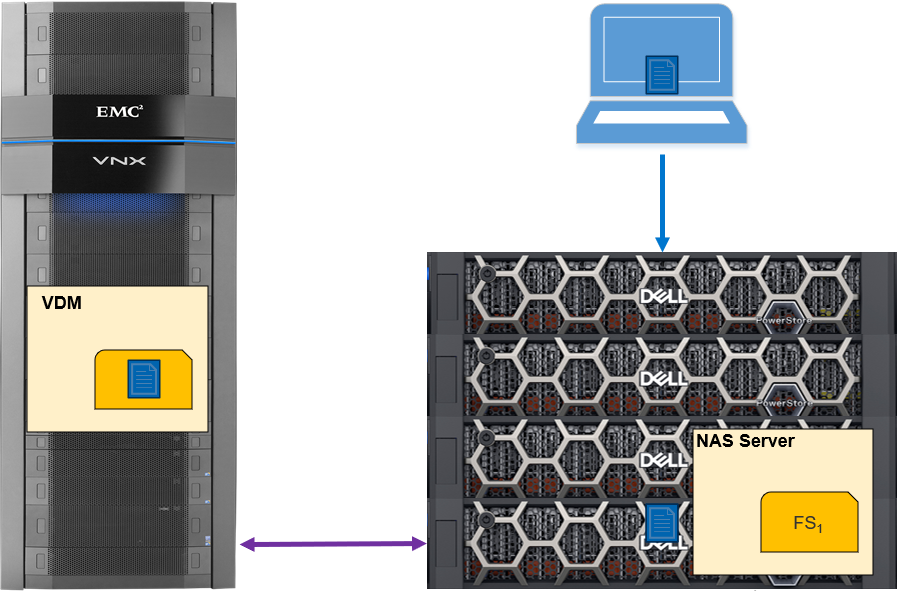
Step 5 – The cutover import session begins. Data is copied from the source VNX2 to the PowerStore, which then services the read requests from the host. Data that remains on the VNX2 is read from it. Incoming writes are mirrored to the VNX2 and to the PowerStore system, The data continues to be copied in the background to the PowerStore, as shown in the following figure.
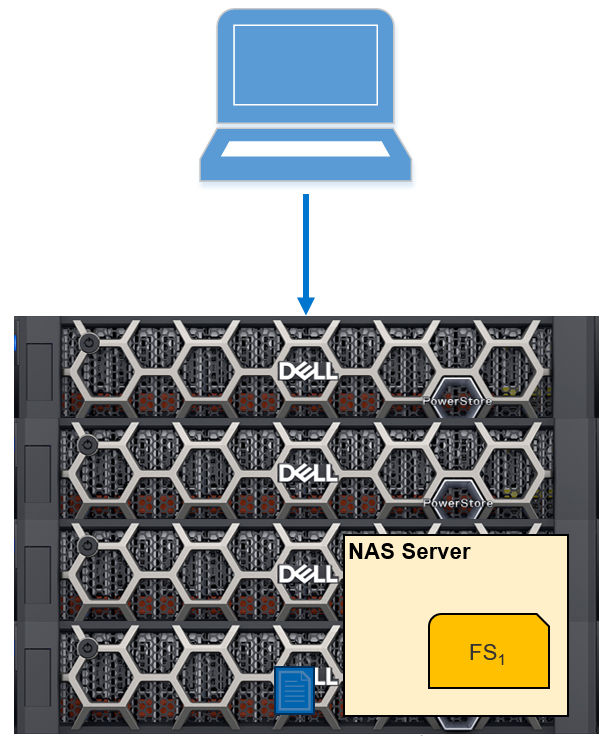
Step 6 – the final step, commits the import session. When all the data has been transferred from the VNX2 to the PowerStore, the state will show “Ready for Cutover”, and you can commit the import session. This will suspend the write mirroring: the session cannot be rolled back from this point. This process will also clean up the source VNX2 system. Because the import has completed, the data is now being accessed just from the PowerStore (as in the following figure).
Conclusion
I’ve outlined just a few of the import and migration features in the Dell PowerStoreOS 3.0 release. For more information about these and other features in this release, check out these resources:
- PowerStore: Migration Technologies
- Dell Technologies Info Hub
- Dell PowerStore Simple Support Matrix
- Video: Dell PowerStore: Import Dell VNX File Resources
Author: Andrew Sirpis
Related Blog Posts

Dell Technologies Has the Storage Visibility You’re Looking For!

Fri, 26 Apr 2024 17:42:19 -0000
|Read Time: 0 minutes
It’s no secret that high-performance storage is crucial for demanding database workloads. Database administrators (DBAs) work diligently to monitor and assess all aspects of database performance -- and storage is a top priority. As database workloads grow and change, storage management is critical to meeting SLAs.
How do you manage what you can’t see?
As a former DBA, one of the challenges that I faced when assessing storage performance and troubleshooting storage latency was determining root cause. Root cause analysis requires an end-to-end view to collect all data points and determine where the problem lies. It’s like trying to find a water leak, you must trace the route from beginning to end.
This becomes more complicated when you replace a single disk drive with a drive array or modern storage appliances. The storage is no longer part of the host, so from an operating system (OS) perspective, storage visibility is lost beyond the host. Popular third party monitoring tools don’t solve the problem because they don’t have access to that information either. This is where the finger pointing begins between storage administrators and DBAs because neither has access (or understanding) of the other side.
Stop the finger pointing!
Dell Technologies heard the need to provide end-to-end storage visibility and we have listened. Kubernetes brings a lot of production-grade capabilities and frameworks, and we are working to leverage these wherever possible. One of these is storage visibility, or observability. Now, everyone who works with Kubernetes (K8s) can view end-to-end storage metrics on supported Dell Storage appliances! DBAs, storage administrators, and developers can now view the storage metrics they need, track end-to-end performance, and communicate effectively.
How does it work?
The Dell Container Storage Module (CSM) for Observability is an OpenTelemetry agent that provides volume-level metrics for Dell PowerStore and other Dell storage products. The Dell CSM for Observability module leverages Dell Container Storage Interface (CSI) drivers to communicate with Dell storage. Metrics are then collected from the storage appliance and stored in a Prometheus database for consumption by popular monitoring tools that support a Prometheus data source such as Grafana. Key metrics collected by CSM observability include but are not limited to:
- Storage pool consumption by CSI Driver
- Storage system I/O performance by Kubernetes node
- CSI Driver positioned volume I/O performance
- CSI Driver provisioned volume topology
Let’s take a look
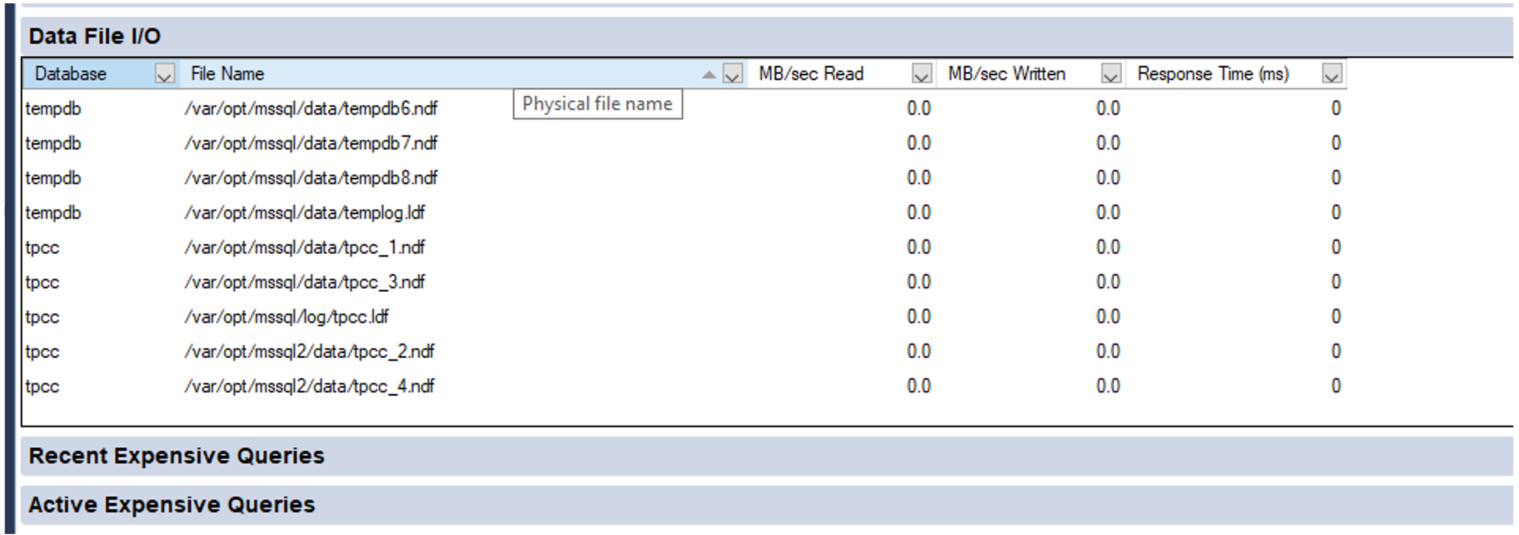
Let’s walk through a quick end-to-end example. A familiar display from SQL Server Management Studio shows the files and folders that comprise our tpcc database:
Now we need to translate that into K8s storage terms. Using meaningful naming standards for Persistent Volume Claims will negate a lot of this process, but it’s good to know how it all ties together!
A SQL Server pod will contain one or more Persistent Volume Claims (unless you don’t want to persist data 😊). These represent storage volumes and are presented to the SQL Server instance as a mount point.
The following example shows the deployment definition for our SQL Server pod with one of the mount points and Persistent Volume Claims highlighted. By examining the pod deployment, we can see that the folder/mount point /var/opt/mssql presented to SQL Server is tied to the K8s volume mssqldb and the underlying persistent volume claim mssql-data.
apiVersion: apps/v1
kind: Deployment
metadata:
  name: mssql-deployment
spec:
  replicas: 1
  selector:
     matchLabels:
       app: mssql
  template:
    metadata:
      labels:
        app: mssql
    spec:
       terminationGracePeriodSeconds: 30
      hostname: mssqlinst
      securityContext:
        fsGroup: 10001
      containers:
      - name: mssql
        image: mcr.microsoft.com/mssql/server:2019-latest
        ports:
        - containerPort: 1433
        resources:
          limits:
            cpu: "28"
            memory: "96Gi"
          requests:
            cpu: "14"
            memory: "48Gi"
        env:
        - name: MSSQL_PID
          value: "Developer"
        - name: ACCEPT_EULA
          value: "Y"
        - name: SA_PASSWORD
          valueFrom:
            secretKeyRef:
              name: mssql
              key: SA_PASSWORD
        volumeMounts:
        - name: mssqldb
          mountPath: /var/opt/mssql
        - name: mssqldb2
          mountPath: /var/opt/mssql2
        - name: mssqllog
          mountPath: /var/opt/mssqllog
      volumes:
      - name: mssqldb
         persistentVolumeClaim:
          claimName: mssql-data
      - name: mssqldb2
         persistentVolumeClaim:
          claimName: mssql-data2
      - name: mssqllog
         persistentVolumeClaim:
          claimName: mssql-log
Following that example, you can see how the other Persistent Volume Claims, mssql-data2 and mssql-log are used by the SQL Server database files. The following figure shows one of the Grafana dashboards that makes it easy to tie the Persistent Volume Claims for the mssql-data, mssql-data2, and mssql-log used by the SQL Server pod to the Persistent Volume name.
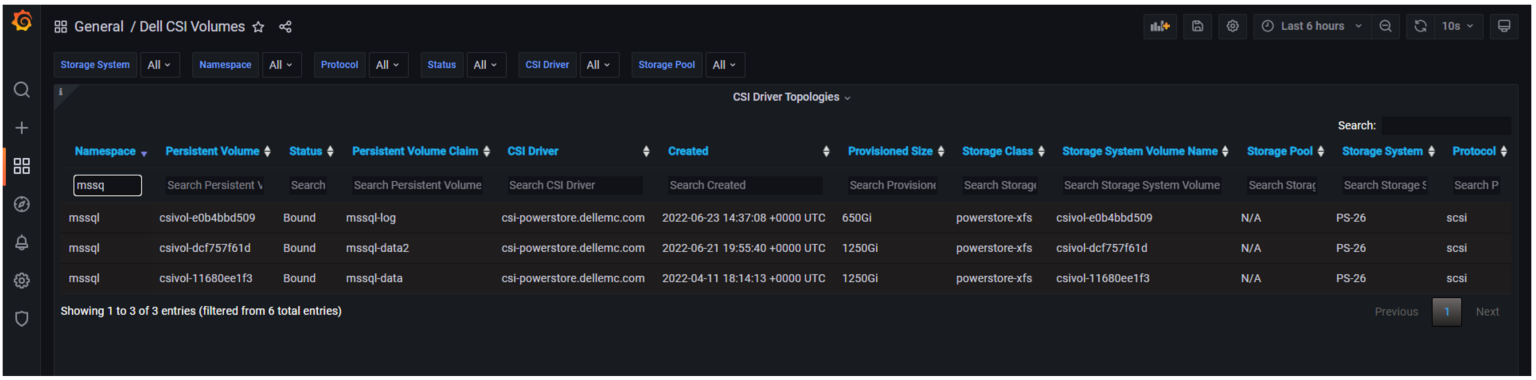
From here, we can use the Persistent Volume name associated with the Persistent Volume Claim to view metrics on the storage appliance, or better yet, in another Grafana dashboard.
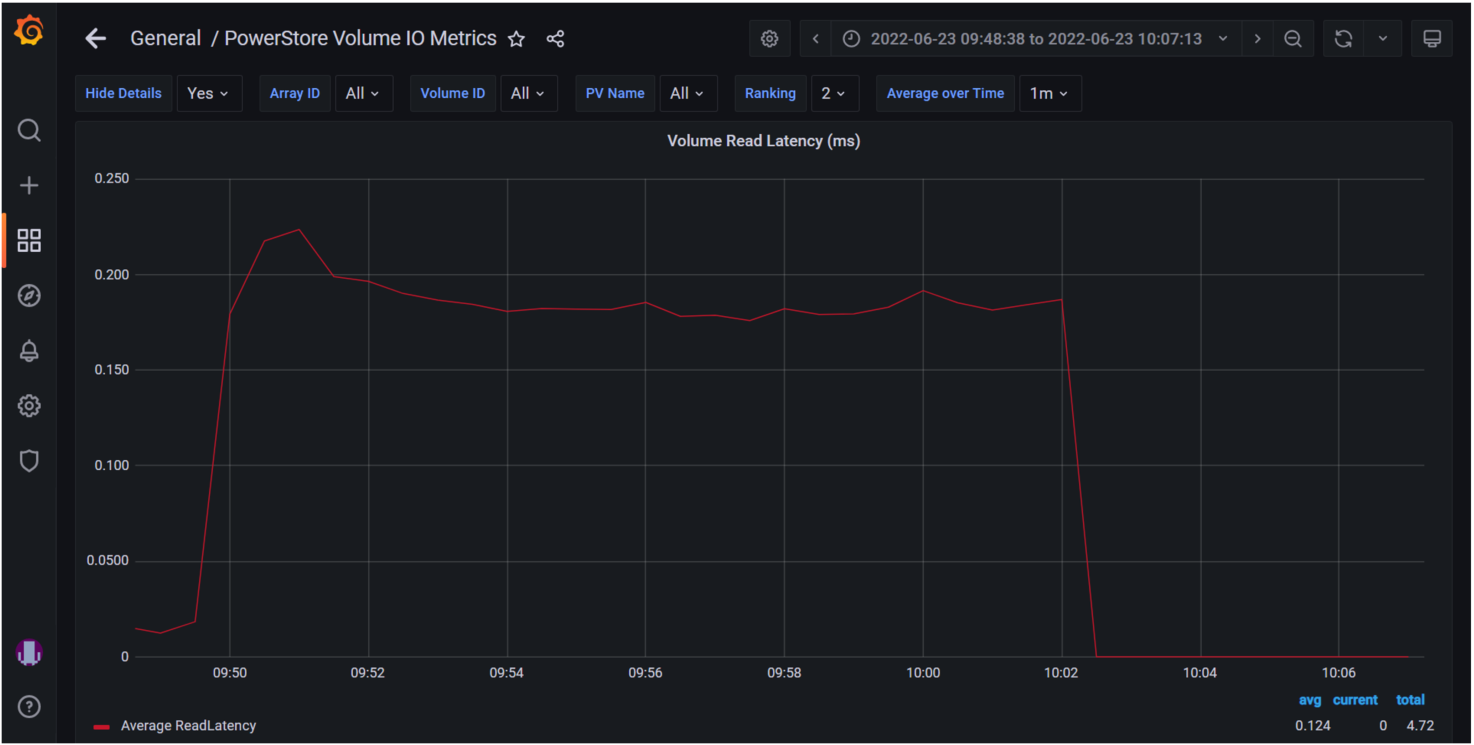
The following example shows the PowerStore Volume I/O Metrics dashboard. The key storage metrics (IOPS, latency, and bandwidth) are displayed as reported by the Dell PowerStore storage appliance.

You can select any of the charts for expanded viewing. The Volume Read Latency chart is selected below.
Rapid Adoption
These Kubernetes frameworks are becoming popular, and adoption is happening rapidly. Microsoft SQL Server Big Data Clusters and their latest offering Azure Arc-enabled SQL Managed Instance both display SQL statistics in Grafana as well. This allows single pane of glass viewing for all your key SQL metrics!

Kubernetes and cloud-native design are here to stay. They bridge the gap between cloud and on-premises deployments and the wealth of capabilities provided by K8s make it impossible to ignore.
Dell Technologies is leading the way with PowerStore capabilities as well as the full Dell portfolio of products. We are working diligently with partners such as Microsoft to prove out new technologies so you can modernize your data estate with confidence!
For more information about Azure Arc-enabled SQL Managed Instance and PowerStore, see:
- Our latest joint white paper: Dell PowerStore with Azure Arc-enabled Data Services which highlights performance and scale.
- The Microsoft blog post: “Performance benchmark of Azure Arc-enabled SQL Managed Instance.”
- The Microsoft digital events Microsoft Build and Azure Hybrid, Multicloud, and Edge Day.
Author: Doug Bernhardt
Sr. Principal Engineering Technologist

Getting Tough with PowerStore and STIG Mode: Meeting Federal Compliance Requirements
Wed, 09 Aug 2023 15:22:52 -0000
|Read Time: 0 minutes
US Federal Security Technical Information Guide (STIG) overview
Compliance with the US Federal Security Technical Information Guide requirements, (STIG compliance) is a critical feature for many of our customers in the Federal space. STIG compliance is also a prerequisite for the Approved Product List (APL) certification. The latter is also a requirement for some Department of Defense (DoD) sites.
How PowerStoreOS 3.5 is supporting STIG
The new PowerStoreOS 3.5 release now supports STIG mode. This mode applies configuration changes to the core of the product for the system to meet STIG requirements related to the operating system, embedded web server, internal databases, and various networking functions.
Enabling STIG mode
When a user wants to enable STIG mode, they need to run a REST API command against the PowerStore cluster or use the PowerStore command line interface (PowerStore CLI). The following is an example of the REST API command where <IP> is the IP of the PowerStore cluster.
curl -kv https://<IP>:443/api/rest/security_config/1?is_async=true --user admin:Password -X PATCH --data '{"is_stig_enabled":true}' -H "Content-Type:application/json“You can also enable STIG mode by issuing the following command in the PowerStore CLI:
pstcli -user admin -password Password -destination <IP> security_config -id 1 set -is_stig_enabled true -async
When the STIG enable process is kicked off, it takes about 45 minutes to enable STIG mode for a single appliance system. Larger clusters will take a little longer. You can confirm whether the process is running or completed by viewing the job status under Monitoring > Jobs in PowerStore Manager (Figure 1). In this example, notice that the ‘Modify security configuration’ job status is Completed.

Figure 1. STIG enablement job status
Enabling STIG is comparable to a PowerStoreOS upgrade, where the process is coordinated across the cluster, its nodes, and appliances. The process requires reboots across the nodes because of kernel changes and because additional Federal Information Processing Standard (FIPS) settings are enabled. FIPS in this case restricts the communication paths and the encryption used in those paths to be FIPS 140-2 compliant. By default, the drives in PowerStore are already leveraging FIPS encryption for storing data. STIG mode only enables the FIPS communication path part of the FIPS compliance, at the kernel level. This includes items such as data in flight and replication peers.
Disabling STIG mode, after it is enabled, is not supported. This is because a user enabling STIG mode is protecting top secret data, and we don’t want to enable anyone to disable this mode. The only way to remove or disable STIG mode from the PowerStore would be to perform a factory reset, which would delete all data. When STIG mode is enabled, PowerStore Manager displays a new login banner, as shown in Figure 2.
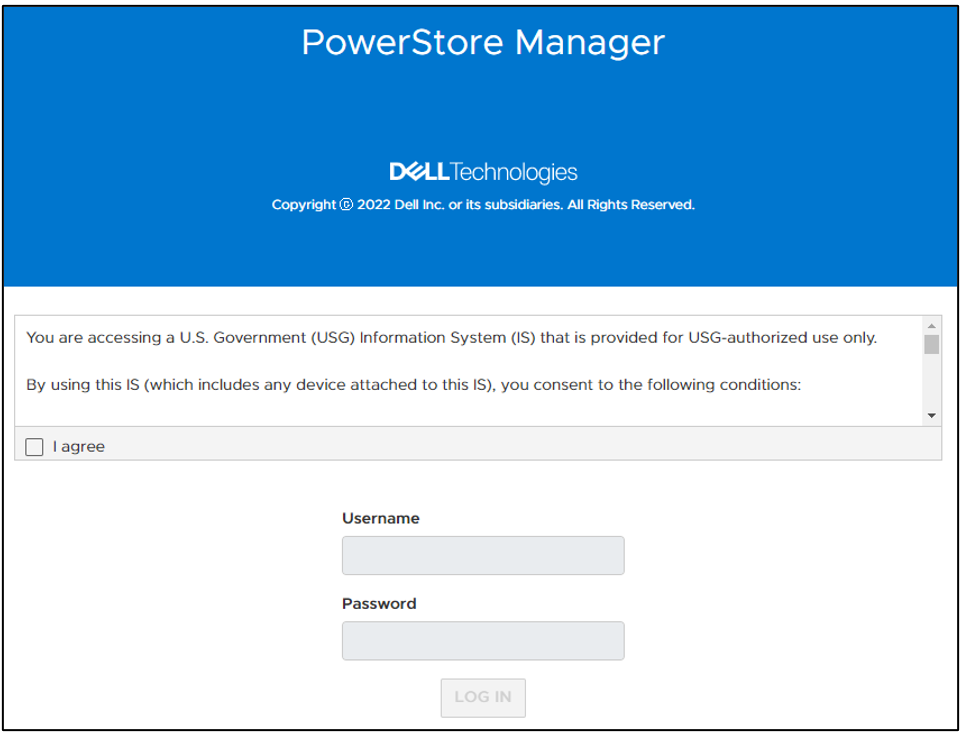
Figure 2. New STIG login banner
The user needs to scroll through this banner and click I agree to be able to input their credentials. They are then prompted to create a new password that meets STIG requirements and increases the security posture of the system. These requirements are outlined in the blue section of Figure 3.
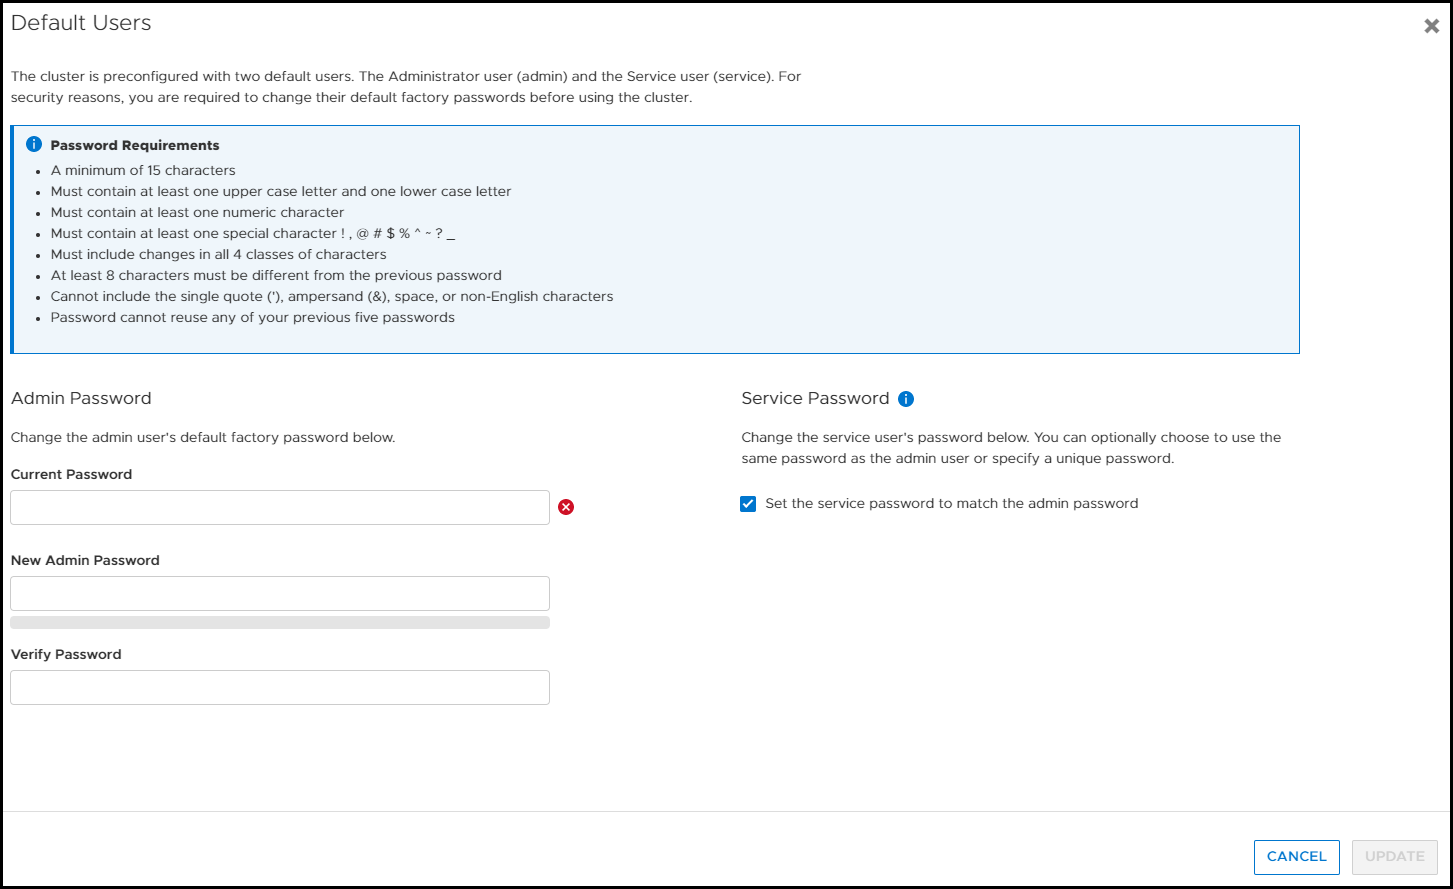
Figure 3. Update password to meet STIG requirements
Now, after logging in for the first time, you can notice a few of the changes from having enabled STIG mode in PowerStore Manager. If we look at the Login Message under Settings, the user can’t disable or change the login banner message. In Figure 4, notice that Enabled is grayed out and the login message is read-only. (If this system weren’t in STIG mode, users would be able to set their own login banner message, and enable or disable it as they see fit.)
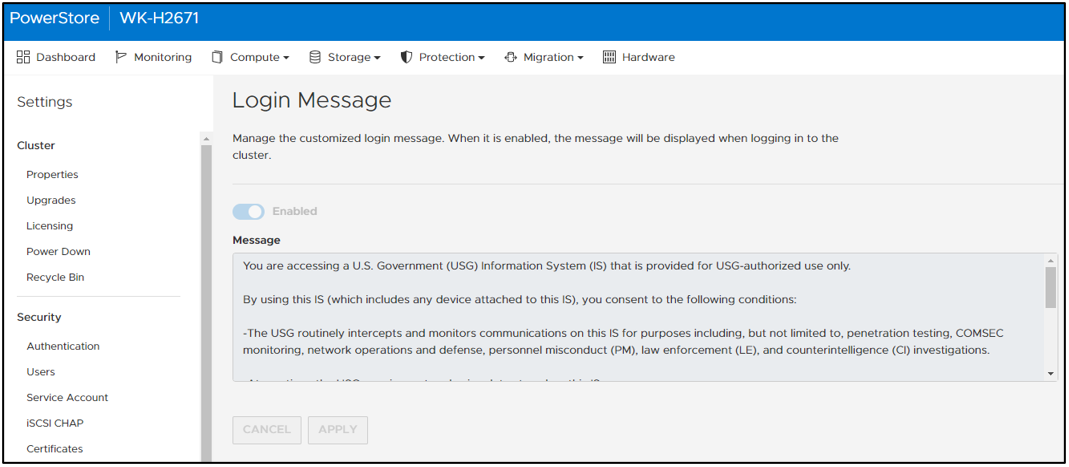
Figure 4. Login message can’t be changed or disabled
In PowerStore Manager, under Settings > Security > Session Timeout, only users with the Administrator or Security Administrator role can change the session timeout value. The options are 5, 10, and 20 minutes. Ten minutes is the default for STIG mode (Figure 5).
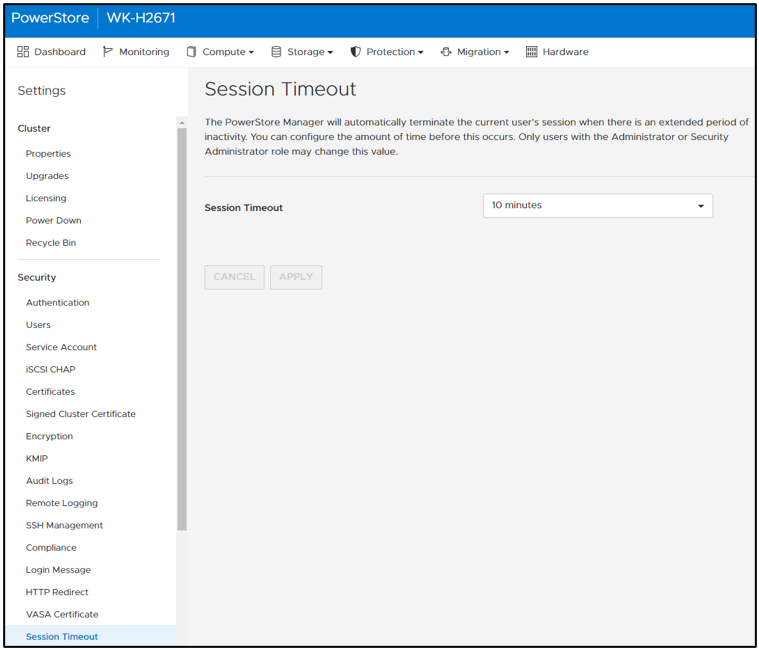
Figure 5. Default STIG mode session timeout
STIG mode also disables the ability for users to add PowerStore appliances to a STIG enabled cluster. Users who want to use multiple appliances must join them together before enabling STIG mode. This helps ensure a high security posture. On the Hardware page, notice that the ADD button is grayed out and that mousing over it displays a tooltip message (Figure 6).
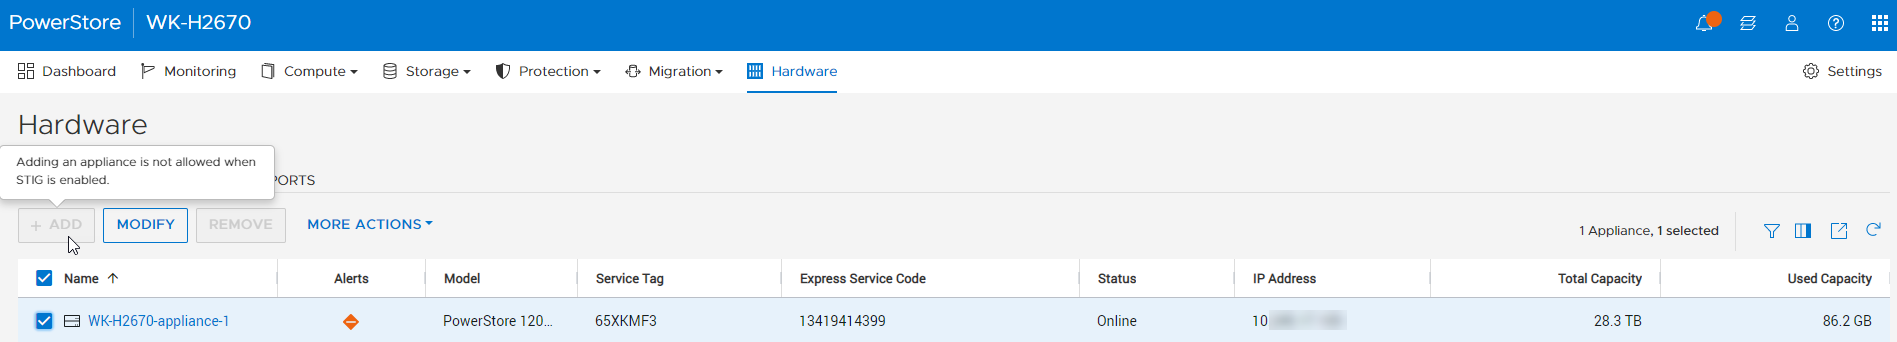
Figure 6. Add appliance disabled
After STIG mode is enabled, the Advanced Intrusion Detection Environment (AIDE) is also enabled on PowerStore. AIDE runs a scan once a day to look for file tampering of system files. This is another method that STIG uses to protect the PowerStore. Because PowerStore system files should only be changed during upgrades, it is easy for AIDE to detect tampering. If tampering is detected, PowerStore alerts appear, and the audit log is updated.
Conclusion
This blog provided you a quick glimpse into how easy it is to enable STIG mode on PowerStore to increase the system’s security posture and meet Federal compliance requirements. We went over some of the basic changes that STIG mode makes on the surface. Many more security items are changed underneath the covers of PowerStore to make it secure for Federal environments. Federal users will benefit from these security features and still be able to take advantage of PowerStore’s intuitive interface.
Resources
For more information about PowerStoreOS 3.5, and PowerStore in general, check out these resources:
- Dell Technologies PowerStore Info Hub
- Dell PowerStore: Cybersecurity White Paper
- Dell PowerStore: Blogs
Author: Andrew Sirpis