


CloudIQ Provides Data Driven Server Management Decisions
Download PDF
Summary
CloudIQ for PowerEdge provides a single easy-to-use portal to view the health and information of Dell Servers. CloudIQ’s powerful reporting backend enables customers to visualize and analyze server performance data. Key hardware metrics are collected, regardless of operating system and applications installed. Beyond reporting current server performance data, CloudIQ historical seasonality and anomaly detection accelerates issue detection and resolution for customers. This Direct from Development (DfD) tech note describes both the existing data server metrics reporting capabilities and the new historical seasonality with anomaly detection feature in PowerEdge for CloudIQ.
Introduction
CloudIQ is a cloud based proactive application that delivers insights and recommendations that give customers a consolidated view of PowerEdge servers and other Dell data center infrastructure, including storage, networking, and data protection systems. It can also consolidate multiple OpenManage Enterprise instances into a single portal.
Server Metrics
iDRAC
The advanced agent-free architecture in iDRAC (Integrated Dell Remote Access Controller) incorporated in each PowerEdge server provides data about CPU performance, thermals, and power consumption. In order to collect these server metrics, each iDRAC needs to have at least an Enterprise, or OpenManage Enterprise Advanced license installed. If Data Center licenses are installed on the iDRACs, additional metrics for NIC traffic, Fibre Channel traffic, and SSD/NVMe device data are also available. Server metrics are compiled on individual iDRACs and then collected by OME. OME then consolidates and securely uploads this data to CloudIQ every 15 minutes.
CloudIQ
Within CloudIQ, the performance page displays a summary per server in a dashboard view (Fig. 1). Clicking into a single server, customers can view several ready to use server performance visualizations for significant measurements, such as CPU usage, system thermals, and power consumption. This includes the new ability to track and display historical seasonality data and anomaly detection (Fig. 2). The customer can also create custom graphs in the “report browser” feature (Fig. 3).
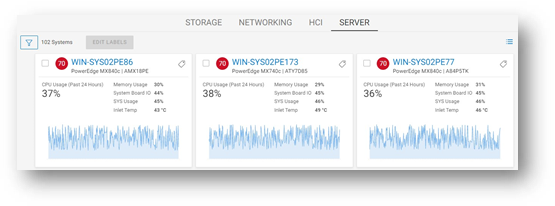
Figure 1 : Server Performance – Summary Dashboard
Anomaly Detection
The new ability based on historic seasonality data lets CloudIQ highlight irregular server behavior. Customers can now view a range of statistically normal behavior for each server’s performance metrics on the performance details page. This is calculated using data from each specific server based on a rolling three-week analysis per metric. The metrics chart visuals now highlight an anomaly any time the metric breaches the normal range within the last 24 hours. Anomaly detection is supported for all metrics that are displayed on the system performance page.
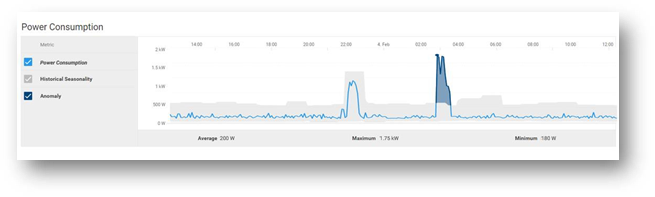
Figure 2: Server Performance – Example “Power Consumption” highlighting anomaly detection
Custom Reports
CloudIQ can create custom reports for up to 55 different server metrics. Customers can schedule reports to be run and emailed on a daily, weekly, or monthly basis. The data can also be exported as a CSV or PDF file.
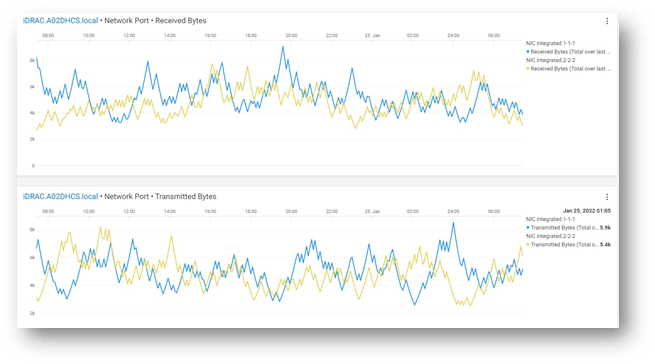
Figure 3 : Server Performance - From Metric Browser – Example custom graph showing NIC data
Example Server Metrics
The following table shows a selection of some server metrics available. For a complete list, see Appendix A2 in the white paper PowerEdge Metrics in CloudIQ using OpenManage Enterprise (OME): An Overview.
Metrics | Sample Timing | License Required |
System Performance |
|
|
CPU Usage % 1 | Avg of 5 minute sample | OME-Advanced or Data Center |
IO Usage (PCI Express traffic) % 1 | Avg of 5 minute sample | OME-Advanced or Data Center |
Memory Usage (channels bandwidth ) % 1 | Avg of 5 minute sample | OME-Advanced or Data Center |
System Usage % (amalgamation of CPU / IO and memory usage) 2 | Avg of 5 minute sample | OME-Advanced or Data Center |
System Power |
|
|
System Power Consumption kWh | Avg, Min and Max of 15 minute sample | Enterprise |
System Thermal |
|
|
Temperature Reading Degrees C 2 | Avg of 5 minute sample | Enterprise |
Sys Net Airflow CFM 2 | Avg of 15 minute sample | OME-Advanced/ Data Center |
NICs |
|
|
TxBytes 2 | Total in 5 minute samples | Data Center |
RxBytes 2 | Total in 5 minute samples | Data Center |
FC HBAs |
|
|
FCRxKBCount 2 | Total in 5 minute samples | Data Center |
FCTxKBCount 2 | Total in 5 minute samples | Data Center |
- – System performance data on 12 and 13 generation servers only require an iDRAC enterprise license.
- – iDRAC9 only
Basic Metrics include Power, Thermal, and CPU. YX5X servers have different Basic Metrics, based on whether they are AMD or Intel:
- Intel model Basic Metrics include Power, Thermal, CPU, IO, and Memory utilization.
- AMD model Basic Metrics include Power, Thermal, and CPU
Conclusion
Some customers say, “slow is the new down”! With in-depth visibility of key performance metrics for servers, storage, and networking infrastructure, CloudIQ allows customers stay on top of all their Dell data center resources, giving them the ability to manage, analyze, and plan proactively.
References
For more details about the available PowerEdge Metrics in CloudIQ, see the full table in Appendix A2 of the white paper PowerEdge Metrics in CloudIQ using OpenManage Enterprise - An Overview.
For more information, see:
Related Documents

Server Power Consumption Reporting and Management


Mon, 16 Jan 2023 18:31:46 -0000
|Read Time: 0 minutes
Summary
Between customers’ sustainability initiatives to reduce carbon emissions, and demands to control energy consumption and costs, the ability to report, analyze and action server power usage data has become a key initiative. This DfD tech note explores the rich server power usage data available from Dell PowerEdge servers and the various methods to collect, report, analyze, and act upon it.
What is server power consumption?
A wide variety of server power information is offered by the iDRAC. The amount and frequency of information varies by iDRAC version and licensed features and the choice of optional tools and consoles.
One-to-one and one-to-many
There are multiple ways to view power consumption data from the iDRAC, depending on needs and preferences. One way is to open the web interface GUI. Another way is using scripts, either Racadm or Redfish, to retrieve the data. iDRAC can also send data to the OpenManage Enterprise Power Manager Plugin. OpenManage Enterprise can also forward this information to CloudIQ for PowerEdge. For those customers looking for the ultimate solution, iDRAC9 can stream these power statistics as telemetry data to analytics solutions such as Splunk or ELK Stack for real-time in-depth analysis.
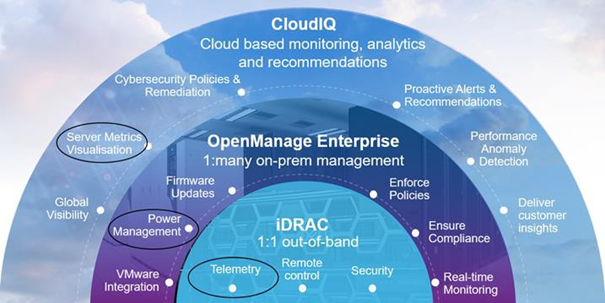
Figure 1. PowerEdge management stack, with power management and data reporting highlighted
PowerEdge server power data
Embedded with every Dell PowerEdge server, the integrated Dell Remote Access Controller (iDRAC) enables secure and remote server access for out-of-band and agent-free server management tasks. Features include BIOS configuration, OS deployment, firmware updates, health monitoring, and maintenance. One key set of data that iDRAC provides is power usage. IT admins have used iDRAC data to view and react to power issues for over 10 years. The iDRAC engineering teams have continued to expand the capabilities within the iDRAC UI as well as the information available to “one to many” consoles such as OpenManage Enterprise. iDRAC9 with Datacenter feature set enabled extends the solution even further with telemetry streaming.
iDRAC
iDRAC monitors the power consumption, processes, and reports continuously at the individual server level. The browser user interface displays the following power values:
- Power consumption warning and critical thresholds
- Cumulative power, peak power, and peak amperage values
- Power consumption over the last hour, last day, or last week
- Average, minimum, and maximum power consumption with historical peak values and peak timestamps
- Peak headroom and instantaneous headroom values (for rack and tower servers)
iDRAC9 provides a graphical view of these power metrics such as the power consumption example shown here.
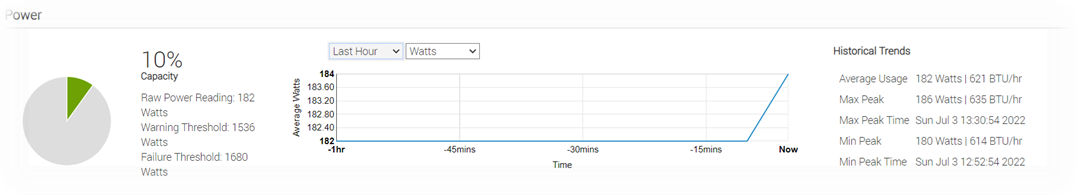
Figure 2. iDRAC9 GUI power consumption data
iDRAC9 connects to all critical server components and, in conjunction with the Datacenter license, can collect over 180 server metrics in near-real-time. These metrics include granular, time-stamped data for critical functions such as processor and memory utilization, network card, power, thermal, and more. iDRAC9 can stream this telemetry data in real time.
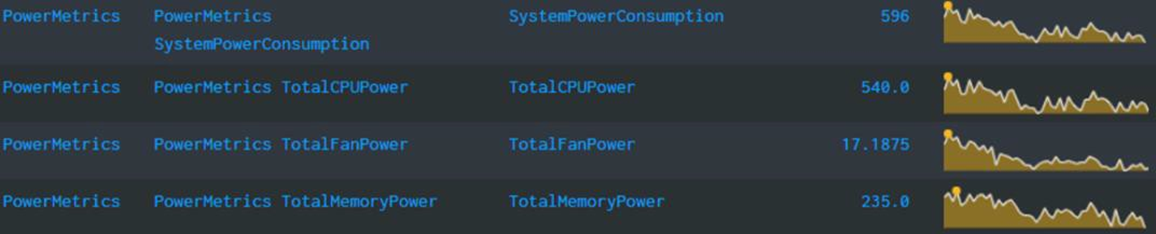
Figure 3. iDRAC power telemetry data collected by Splunk
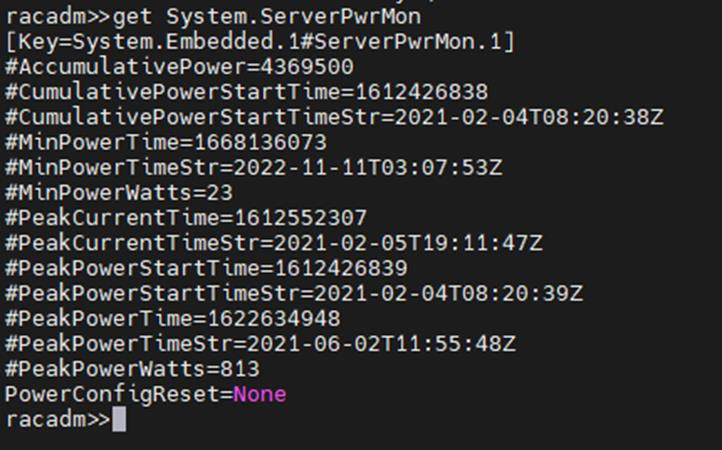
Get Server Power – RACADM CLI Examples
The RACADM command-line provides a basic scriptable interface that enables you to retrieve server power either locally or remotely. In addition to the CLI interface, iDRAC also supports the Redfish RESTful API. Example Powershell and Python scripts that can be used to collect power data can be download from the Dell area in github.com. The RACADM CLI can be access from the following interfaces:
- Local - Supports running RACADM commands from the managed server's operating system (Linux/Windows). To run local RACADM commands, install the OpenManage DRAC Tools software on the managed server.
- SSH or Telnet (also known as Firmware RACADM) - Firmware RACADM is accessible by logging into iDRAC using SSH or Telnet.
- Remote - Supports running RACADM commands from a remote management station such as a laptop or desktop running Windows or Linux. To run remote RACADM commands, install the OpenManage DRAC Tools software on the management station.
Here are some examples using the remote iDRAC9 SSH CLI method, post authentication.
- Instantaneous server power usage:

- Server power stats:
OpenManage Enterprise Power Manager
The Power Manager Plugin for OpenManage Enterprise uses the power data securely collected from iDRACs to observe, alert, report, and, if required, place power caps on servers. For ease of management, servers can be logically grouped together, such as in a rack, a row, or in custom grouping, such as a workload. Using this data, customers can drive data center efficiency in several ways, such as by easily identifying idle servers for repurposing or retirement. Using built in reports or creating a custom report, customers can identify server racks not using their full available power capacity to deploy new hardware without needing additional power. Customers can mitigate risk by detecting when groups of servers are nearing their power capacity during specific timeframes. Using automated policies, customers can maximize power available to business-critical applications by reducing noncritical consumption by using scheduled or permanent power capping.
Important in today’s climate concerns are reports on carbon emissions based on server usage. Power Manager provides reports on the carbon emissions for individual servers as well as racks and custom groups of servers. This information can be used to identify areas of concern and to show progress in carbon emission reductions based on power policies, removal of idle servers, and other initiatives such as consolidation and refresh.
The power data is displayed by applets integrated into OpenManage Enterprise. (See examples in the following figure.) There are also several predefined reports built into the report library designed around power usage. Power Manager automates actions driven by specific power or thermal events, including running scripts, applying power caps, and forwarding alerts. Power Manager collects this power data and stores it for up to 365 days.
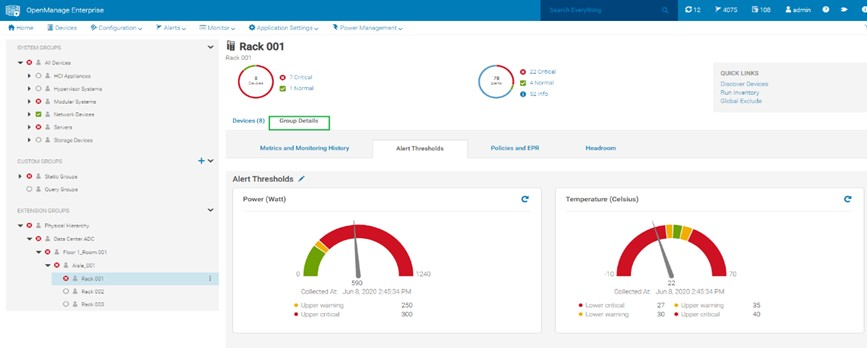
Figure 4. View of a rack group alert threshold graphic for power and thermal
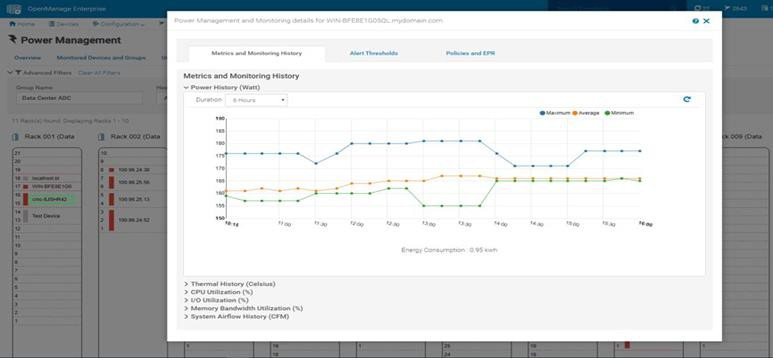 Figure 5. Rack view showing max/min/avg power for the last six hours
CloudIQ for PowerEdge – Reporting Server Power
Another method to visualize and report the power data is by CloudIQ. Utilizing the OpenManage Enterprise CloudIQ Plugin, customers can connect their PowerEdge servers to the Dell hosted CloudIQ secure portal. This is a cloud based software-as-a-service portal, hosted in the Dell data centers, that provides powerful analytic, health, and performance monitoring for servers. CloudIQ can consolidate multiple OpenManage Enterprise instances, providing a truly global view of an organization’s server estate. Within CloudIQ, power data can be graphed and reported on over time. These graphs can easily be exported or emailed as PDFs and the raw data exported as CSV for further reviews. In fact, in addition to collecting power metrics, CloudIQ can track and collect over 50 server metrics for users to review. CloudIQ also interfaces with other elements of Dell’s infrastructure, including storage and networking, giving customers the ability to correlate data, events, and trends across multiple technologies. CloudIQ is offered at no additional cost for all PowerEdge servers with ProSupport or higher contracts.
When power data is collected in CloudIQ, advanced AI algorithms process this data and automatically flag whether the server power usage behavior is outside normal parameters, based on historic data from that particular server.
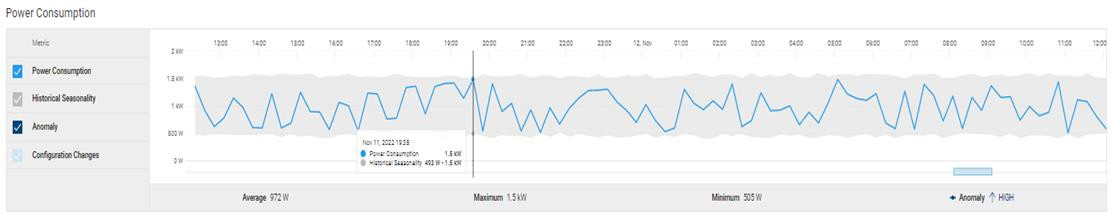
Fiure 6. individual server power data with historical seasonality – no anomaly
Multiple servers can be put onto the same graph, making it easy to identify any rogue behavior by individual servers.
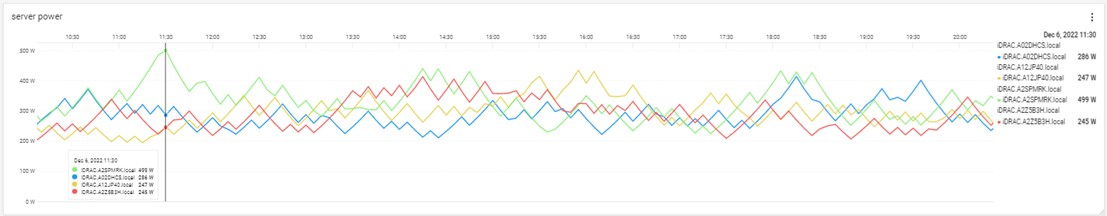
Figure 7. Multi server power usage report
The visualization of this data can be displayed from just hours to a whole year, with the ability to zoom in on a particular time.
Conclusion
Dell PowerEdge servers offer an extensive amount of data about power consumption by the advanced capabilities of the iDRAC. This power information is available on the iDRAC UI, as is telemetry information ready to be consumed by analytic solutions such as Splunk. This information is also accessible from the RACAMD CLI and RESTful API. Dell Technologies’ own one to many management solutions can also collect, collate, and report this information. Dell lets server admins select from a wide variety of tools and methodologies to meet the needs of their datacenter server power management requirements.
References
iDRAC
- Documentation, white papers and videos www.dell.com/support/idrac
- Transform datacenter analytics with iDRAC9 Telemetry Streaming
- iDRAC9 Telemetry Streaming Visualization with Splunk (a Tolly report)
- iDRAC Telemetry and Splunk Video Overview
- How to Integrate iDRAC9 Telemetry Data into the Splunk Platform
- Integrated Dell Remote Access Controller 9 - CLI Guide
OpenManage Enterprise Power Manager
- Documentation, white papers and videos Support for Power Manager
- Reduce Server Power Usage and Save Money with Power Manager
- Improve sustainability through energy insights (a Principled Technology study)
- Guide to OpenManage Enterprise Power Manager API
CloudIQ for PowerEdge
- Documentation, white papers and videos Support for CloudIQ For PowerEdge
- CloudIQ Provides Data Driven Server Management Decisions
GitHub for Dell Technologies, including iDRAC and OME/ Power Manager examples Dell Technologies · GitHub
API guide and landing page for developers including iDRAC & OME/ Power Manager https://developer.dell.com/

Dell CloudIQ Cybersecurity For PowerEdge: The Benefits Of Automation
Mon, 16 Jan 2023 15:08:26 -0000
|Read Time: 0 minutes
Summary
There are many server settings that customer infrastructure teams can select to harden servers against growing cyber threats. But how can they find and use Dell’s security configuration settings best- practices? And how can they efficiently and continuously check if the settings are incorrectly configured or have changed? The answer is the cybersecurity feature in the CloudIQ for PowerEdge AIOps solution. It compares the configuration of deployed PowerEdge servers to a security related configuration policy. When CloudIQ identifies a deviation between the actual settings and the recommended configuration settings, it notifies the administrator and recommends remediation steps to correct the issue(s). This Direct from Development (DfD) tech note details the time savings that customers can achieve by using the CloudIQ automated cybersecurity policy engine versus manually examining compliance.
Introduction
In today’s always-on, always-connected environment, all organizations constantly need to enhance their cybersecurity strategy to mitigate the increasing threat of attack. Using the built-in cybersecurity feature of Dell CloudIQ, customers can easily build security policies to protect PowerEdge servers. A policy consists of ready-to-use tests that customers can enable simply by selecting a checkbox. The tests consist of infrastructure security settings that are based on Dell best practices and the American NIST (National Institute of Standards and Technology) cybersecurity framework. Dell CloudIQ Cybersecurity for PowerEdge both enables the easy creation of a policy and automates the policy policing—making it simple, efficient, and predicable.
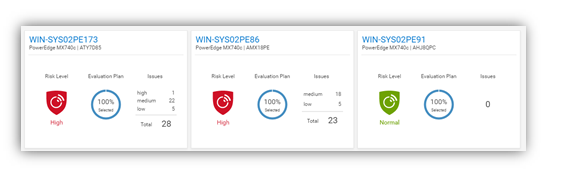
Figure 1. CloudIQ Cybersecurity Dashboard
CloudIQ is the AIOPs proactive monitoring and analytics application that delivers system health insights and recommendations for Dell infrastructure solutions, including storage, data protection, networking, and of course, PowerEdge servers.
The cybersecurity policy engine built into CloudIQ has over 30 security configuration rules for PowerEdge that can be implemented simply. Because CloudIQ is cloud based, it can integrate with any number of OpenManage Enterprise (OME) instances across multiple datacenters, through the OME CloudIQ Plugin. This means that CloudIQ can apply the same policy to multiple OME managed servers, regardless of their location. This feature is delivered by CloudIQ without any additional configuration at the iDRAC or OME level. When a policy is established, CloudIQ continuously checks the desired state of PowerEdge security configuration settings against the current “as is” configuration. If a server is found to be out of policy compliance, it is highlighted. The results are scored by CloudIQ, with the most vulnerable servers being given a “high” risk level. Individual problems can be viewed with recommended remediation. These recommended security configuration corrections can then be executed one-to-one per server using the iDRAC GUI. If multiple hosts are found to be non-compliant, then OME can be used to deliver a configuration update template file or execute a RACADM script to correct the security configurations for multiple servers.
The Benefits Of Automation
To understand the profound impact of the automation of this process, we have tested it against a manual process for 1, 10, 100*, and 1,000* servers. Based on the testing of the CloudIQ Cybersecurity approach for a customer with 1000* servers, we found the following:
- The CloudIQ task completed 99% quicker than a manual review.*
- CloudIQ reduced the time by 98 hours to complete the task once.*
- Using CloudIQ Cybersecurity automation saves over a week of effort immediately versus manual.*
- Once enabled, CloudIQ monitors of all these key security configuration settings continuously.
*Projected outcomes based on analysis of results, results may vary.
In the lab testing, we found that manually checking 15 settings on the iDRAC GUI took 5 minutes 56 seconds. By contrast, creating a CloudIQ cybersecurity policy consisting of 15 active test items and selecting target server(s) only took 2 minutes 58 seconds. In addition, whether creating the policy for 1, 10, 100, or 1000 servers, this task took the same amount of time. However, using the manual process, each additional server added an additional 5 minutes 56 seconds to complete the checks. Also, after the policy is set, CloudIQ continues to check the servers’ as-is settings for compliance.
Results Summary
The following graph highlights the differences between automation and the manual process, showing the time saving advantages.
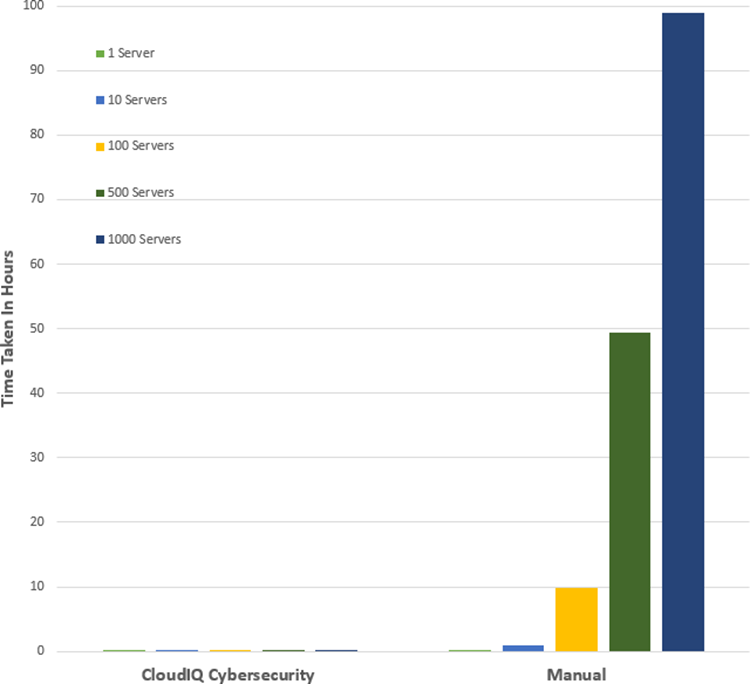
See Table 1 near the end of this document for full results.
Testing Overview
To demonstrate the ease of use and the impact of automation, we tested two different approaches: manual versus automation. To use this Cybersecurity feature of CloudIQ:
- OpenManage Enterprise 3.9 “OME” or higher must be installed, with the CloudIQ Plugin 1.1 or higher enabled
- the PowerEdge server(s) must be covered by Dell Pro Support
- the target servers for the policy must already be discovered by OME
To build the policy, the user must have the CyberSec admin rights assigned in CloudIQ. Some of the configuration rules used in the test security policy are the iDRAC default values. However, any of these values can be changed on an individual iDRAC by administrators with the correct rights, opening a security weakness.
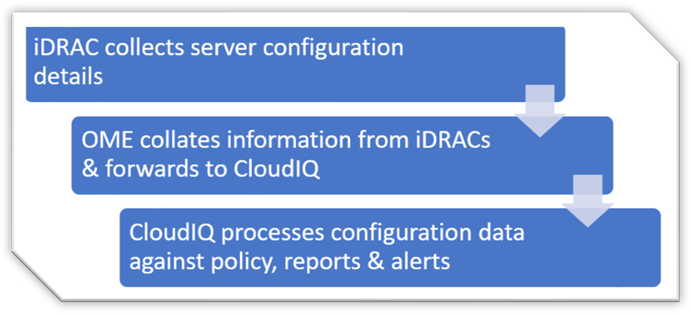
Figure 2. Configuration Data Flow
Testing Procedure
To ensure an accurate comparison of the test approaches, we rigidly tested and documented our testing. We selected 15 common settings, a mixture of BIOS and iDRAC configuration values, and enabled 15 tests in the trial policy.
Tests were conducted in-house on July 6, 2022, at Dell Technologies in Austin TX, in the technical marketing lab facility and online using Dell’s CloudIQ offering.
I. USB ports: Disabled
II. iDRAC active NIC: Dedicated
III. System lock down: Enabled
IV. iDRAC config from host: Disabled
V. IPMI over LAN: Disabled
VI. Secure boot: Enabled
VII. Password policy: Strong
VIII. VNC: Disabled
IX. SNMP version 3: Enabled
X. SSH: Disabled
XI. Syslog: Enabled
XII. Active directory authentication: Enabled
XIII. IP blocking: Enabled
XIV. Virtual media encrypted: Enabled
XV. NTP time synchronization: Enabled
Steps for an automated approach: using CloudIQ PowerEdge Cybersecurity policy
Starting from the CloudIQ “sign in page” https://cloudiq.emc.com:
- Sign into CloudIQ.
2. From the menu down at the left-hand side of the screen. select Cybersecurity.
3. Select Policy.
4. Select the templates tab.
5. Select add template.
6. Name template.
7. Select PowerEdge from product drop down menu, then click next.
8. In the template evaluation plan, configure the following:
9. Access Control – select: IP blocking is enabled/SSH is disabled/The SNMP configured for V3/Active directory authentication is enable / VNC disabled
10. Audit and Accountability – select: NTP time synchronization enabled / Remote Syslog enabled
11. Configuration Management – select: configure iDRAC from Post/System lockdown enabled/USB ports disabled
12. Identification and Authentication – select: Password has minimum strength score of strong
13. System and Coms Protection – select: IPMI over lan disabled / virtual media encryption enabled / dedicated nic
14. System and information – secure boot enabled
15. Select finish.
16. Select the systems tab.
17. Select the required hosts from the list of hosts (in our test we selected a list of 1 or 10 or 100 or 1000).
18. Click assign.
19. Select the required template from the drop down template list menu.
20. From the menu down at the left-hand side of screen, select system risk to view results.
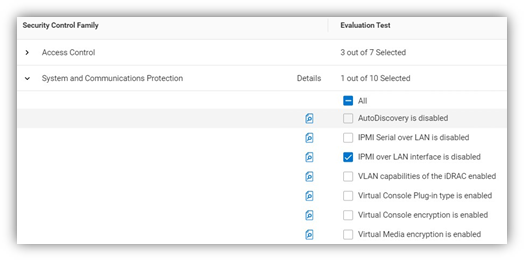
Figure 3. Select rules to build a policy
Steps for the manual approach: checking configuration values in iDRAC GUI
From a browser displaying the iDRAC login screen:
1. Login
2. USB – Configuration/BIOS settings/integrated devices/user accessible USB ports: all ports off
3. Secure boot – Configuration/BIOS settings/TPM advanced /secure boot: enabled
4. VNC – Configuration/Virtual console/VNC server/Enable VNC server: Disabled
5. SNMPv3 – Configuration/System setting/Alert config/SNMP trap/SNMP setting/SNMP Trap format: SNMP v3
6. Syslog – Configuration/System settings/Alert configuration/Remote syslog settings/Remote syslog: Enabled
7. Virtual Media encryption – Configuration/Virtual media/Attached media/Virtual Media encryption: Enabled
8. Dedicated port – iDRAC settings: Active NIC interface: dedicated
9. Local iDRAC Config – iDRAC settings/services/local config/disable iDRAC local configuration: enabled
10. IPMI – iDRAC settings/connectivity/network/IPMI settings/Enable IPMI over lan: disabled
11. Password Policy – iDRAC settings/users/global users settings/Password setting/Policy/Score: Strong1
12. AD authentication – iDRAC settings/Users/Directory services/Microsoft AD: Enabled
13. SSH – iDRAC settings/services/SSH/Enabled: Disabled
14. IP blocking – iDRAC settings/Connectivity/Network/Advanced networking setting/IP blocking/Blocking: Enabled
15. NTP time synchronization – iDRAC settings/settings/Time zone/NTP server/Enable NTP: Enabled
16. Lockdown – check padlock icon on top right of screen is displaying locked mode
These steps were tested using Dell PowerEdge R540 BIOS 2.12.2 and iDRAC9 firmware: 5.10.00
Enforcing the strong password policy manually ensures new password compliance with the password policy, however pre-existing accounts could still have weak passwords waist cloudIQ flags any iDRAC with weak password.
Results
Number of servers | CloudIQ Cybersecurity Policy | Manual Checking |
1 | 2 Min 58 Sec | 5 mins 56 secs |
10 | 2 Min 58 Sec | 59 min |
100 | 2 Min 58 Sec | 9 hours 53 mins |
500 | 2 Min 58 Sec | 49 hours 26 mins |
1000 | 2 Min 58 Sec | 98 hours 53 min |
Summary
Our testing showed that automation using the Dell CloudIQ for PowerEdge cybersecurity policy engine brought major benefits in time efficiency, repeatability, predictability, and of course, peace of mind. The benefits also dramatically increased as we extrapolated the number of servers in the testing data.
References
CloudIQ on Dell.com - for data sheets and demo videos
Take Control of Server Cybersecurity with Intelligent Cloud-Based Monitoring Blog
Building and Tracking Dell CloudIQ Cyber Security Policies for PowerEdge Servers Video
Technical Knowledge Page For OpenManage Enterprise CloudIQ Plugin
Additional Cybersecurity Related Solutions from Dell