
Assets

Server Power Consumption Reporting and Management


Mon, 16 Jan 2023 18:31:46 -0000
|Read Time: 0 minutes
Summary
Between customers’ sustainability initiatives to reduce carbon emissions, and demands to control energy consumption and costs, the ability to report, analyze and action server power usage data has become a key initiative. This DfD tech note explores the rich server power usage data available from Dell PowerEdge servers and the various methods to collect, report, analyze, and act upon it.
What is server power consumption?
A wide variety of server power information is offered by the iDRAC. The amount and frequency of information varies by iDRAC version and licensed features and the choice of optional tools and consoles.
One-to-one and one-to-many
There are multiple ways to view power consumption data from the iDRAC, depending on needs and preferences. One way is to open the web interface GUI. Another way is using scripts, either Racadm or Redfish, to retrieve the data. iDRAC can also send data to the OpenManage Enterprise Power Manager Plugin. OpenManage Enterprise can also forward this information to CloudIQ for PowerEdge. For those customers looking for the ultimate solution, iDRAC9 can stream these power statistics as telemetry data to analytics solutions such as Splunk or ELK Stack for real-time in-depth analysis.
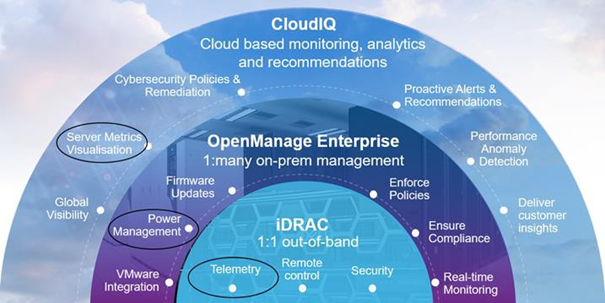
Figure 1. PowerEdge management stack, with power management and data reporting highlighted
PowerEdge server power data
Embedded with every Dell PowerEdge server, the integrated Dell Remote Access Controller (iDRAC) enables secure and remote server access for out-of-band and agent-free server management tasks. Features include BIOS configuration, OS deployment, firmware updates, health monitoring, and maintenance. One key set of data that iDRAC provides is power usage. IT admins have used iDRAC data to view and react to power issues for over 10 years. The iDRAC engineering teams have continued to expand the capabilities within the iDRAC UI as well as the information available to “one to many” consoles such as OpenManage Enterprise. iDRAC9 with Datacenter feature set enabled extends the solution even further with telemetry streaming.
iDRAC
iDRAC monitors the power consumption, processes, and reports continuously at the individual server level. The browser user interface displays the following power values:
- Power consumption warning and critical thresholds
- Cumulative power, peak power, and peak amperage values
- Power consumption over the last hour, last day, or last week
- Average, minimum, and maximum power consumption with historical peak values and peak timestamps
- Peak headroom and instantaneous headroom values (for rack and tower servers)
iDRAC9 provides a graphical view of these power metrics such as the power consumption example shown here.
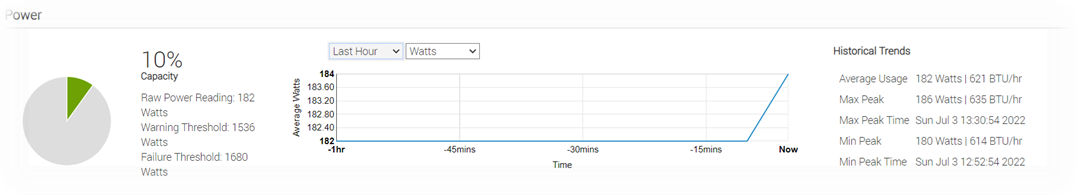
Figure 2. iDRAC9 GUI power consumption data
iDRAC9 connects to all critical server components and, in conjunction with the Datacenter license, can collect over 180 server metrics in near-real-time. These metrics include granular, time-stamped data for critical functions such as processor and memory utilization, network card, power, thermal, and more. iDRAC9 can stream this telemetry data in real time.
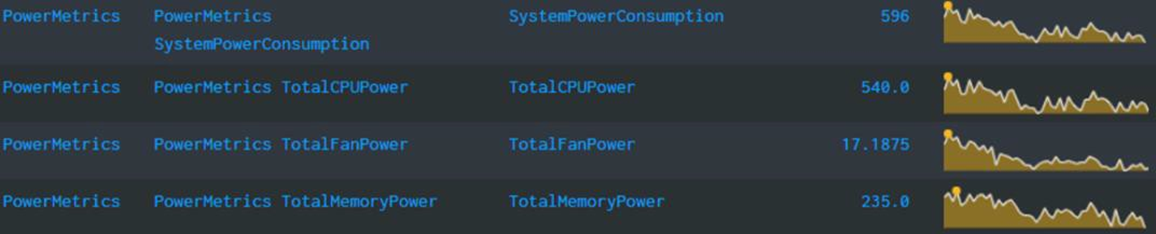
Figure 3. iDRAC power telemetry data collected by Splunk
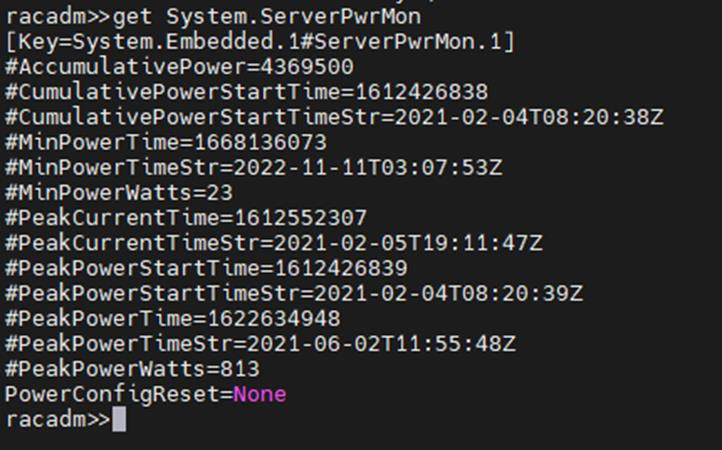
Get Server Power – RACADM CLI Examples
The RACADM command-line provides a basic scriptable interface that enables you to retrieve server power either locally or remotely. In addition to the CLI interface, iDRAC also supports the Redfish RESTful API. Example Powershell and Python scripts that can be used to collect power data can be download from the Dell area in github.com. The RACADM CLI can be access from the following interfaces:
- Local - Supports running RACADM commands from the managed server's operating system (Linux/Windows). To run local RACADM commands, install the OpenManage DRAC Tools software on the managed server.
- SSH or Telnet (also known as Firmware RACADM) - Firmware RACADM is accessible by logging into iDRAC using SSH or Telnet.
- Remote - Supports running RACADM commands from a remote management station such as a laptop or desktop running Windows or Linux. To run remote RACADM commands, install the OpenManage DRAC Tools software on the management station.
Here are some examples using the remote iDRAC9 SSH CLI method, post authentication.
- Instantaneous server power usage:

- Server power stats:
OpenManage Enterprise Power Manager
The Power Manager Plugin for OpenManage Enterprise uses the power data securely collected from iDRACs to observe, alert, report, and, if required, place power caps on servers. For ease of management, servers can be logically grouped together, such as in a rack, a row, or in custom grouping, such as a workload. Using this data, customers can drive data center efficiency in several ways, such as by easily identifying idle servers for repurposing or retirement. Using built in reports or creating a custom report, customers can identify server racks not using their full available power capacity to deploy new hardware without needing additional power. Customers can mitigate risk by detecting when groups of servers are nearing their power capacity during specific timeframes. Using automated policies, customers can maximize power available to business-critical applications by reducing noncritical consumption by using scheduled or permanent power capping.
Important in today’s climate concerns are reports on carbon emissions based on server usage. Power Manager provides reports on the carbon emissions for individual servers as well as racks and custom groups of servers. This information can be used to identify areas of concern and to show progress in carbon emission reductions based on power policies, removal of idle servers, and other initiatives such as consolidation and refresh.
The power data is displayed by applets integrated into OpenManage Enterprise. (See examples in the following figure.) There are also several predefined reports built into the report library designed around power usage. Power Manager automates actions driven by specific power or thermal events, including running scripts, applying power caps, and forwarding alerts. Power Manager collects this power data and stores it for up to 365 days.
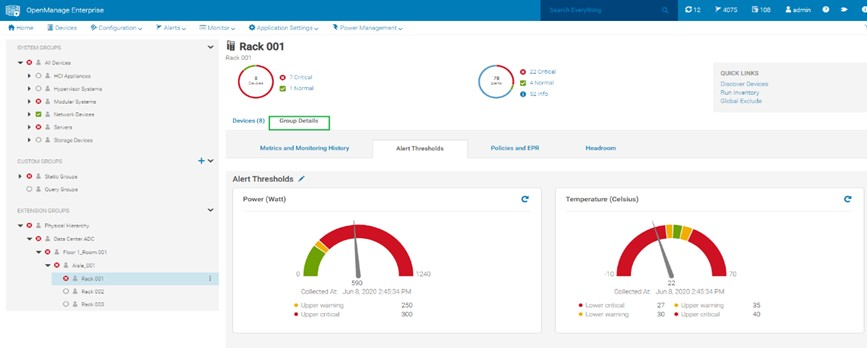
Figure 4. View of a rack group alert threshold graphic for power and thermal
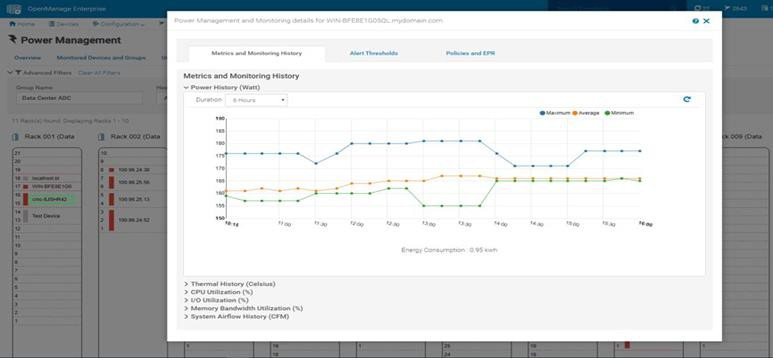 Figure 5. Rack view showing max/min/avg power for the last six hours
CloudIQ for PowerEdge – Reporting Server Power
Another method to visualize and report the power data is by CloudIQ. Utilizing the OpenManage Enterprise CloudIQ Plugin, customers can connect their PowerEdge servers to the Dell hosted CloudIQ secure portal. This is a cloud based software-as-a-service portal, hosted in the Dell data centers, that provides powerful analytic, health, and performance monitoring for servers. CloudIQ can consolidate multiple OpenManage Enterprise instances, providing a truly global view of an organization’s server estate. Within CloudIQ, power data can be graphed and reported on over time. These graphs can easily be exported or emailed as PDFs and the raw data exported as CSV for further reviews. In fact, in addition to collecting power metrics, CloudIQ can track and collect over 50 server metrics for users to review. CloudIQ also interfaces with other elements of Dell’s infrastructure, including storage and networking, giving customers the ability to correlate data, events, and trends across multiple technologies. CloudIQ is offered at no additional cost for all PowerEdge servers with ProSupport or higher contracts.
When power data is collected in CloudIQ, advanced AI algorithms process this data and automatically flag whether the server power usage behavior is outside normal parameters, based on historic data from that particular server.
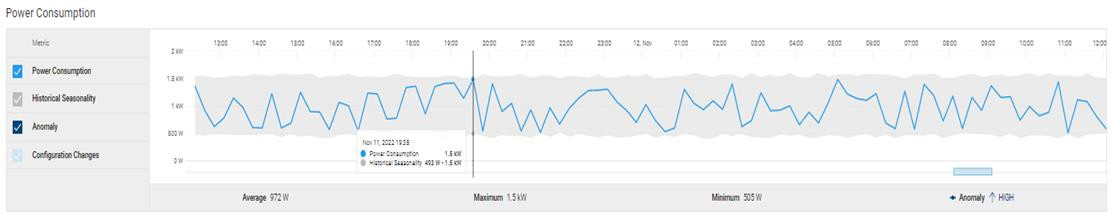
Fiure 6. individual server power data with historical seasonality – no anomaly
Multiple servers can be put onto the same graph, making it easy to identify any rogue behavior by individual servers.
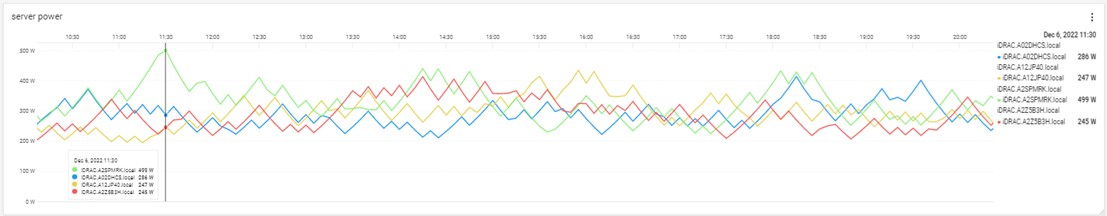
Figure 7. Multi server power usage report
The visualization of this data can be displayed from just hours to a whole year, with the ability to zoom in on a particular time.
Conclusion
Dell PowerEdge servers offer an extensive amount of data about power consumption by the advanced capabilities of the iDRAC. This power information is available on the iDRAC UI, as is telemetry information ready to be consumed by analytic solutions such as Splunk. This information is also accessible from the RACAMD CLI and RESTful API. Dell Technologies’ own one to many management solutions can also collect, collate, and report this information. Dell lets server admins select from a wide variety of tools and methodologies to meet the needs of their datacenter server power management requirements.
References
iDRAC
- Documentation, white papers and videos www.dell.com/support/idrac
- Transform datacenter analytics with iDRAC9 Telemetry Streaming
- iDRAC9 Telemetry Streaming Visualization with Splunk (a Tolly report)
- iDRAC Telemetry and Splunk Video Overview
- How to Integrate iDRAC9 Telemetry Data into the Splunk Platform
- Integrated Dell Remote Access Controller 9 - CLI Guide
OpenManage Enterprise Power Manager
- Documentation, white papers and videos Support for Power Manager
- Reduce Server Power Usage and Save Money with Power Manager
- Improve sustainability through energy insights (a Principled Technology study)
- Guide to OpenManage Enterprise Power Manager API
CloudIQ for PowerEdge
- Documentation, white papers and videos Support for CloudIQ For PowerEdge
- CloudIQ Provides Data Driven Server Management Decisions
GitHub for Dell Technologies, including iDRAC and OME/ Power Manager examples Dell Technologies · GitHub
API guide and landing page for developers including iDRAC & OME/ Power Manager https://developer.dell.com/

iDRAC9 Virtual Power Cycle: Remotely power cycle Dell EMC PowerEdge Servers
Mon, 16 Jan 2023 17:55:02 -0000
|Read Time: 0 minutes
Summary
Dell EMC PowerEdge servers stand out for offering the ability to remotely invoke an A/C power cycle to the Baseboard Management Controller. With distributed and scaled-out IT environments, the means of restoring or resetting power states in as little time as possible takes on added importance.
Introduction
On those occasions when it’s necessary for an IT admin to reboot a server, whether due to a faulty hardware component or an operating system ‘stuck’ in an unresponsive state, it may be necessary to drain all power to the server. This step is rare but could be the essential means to drain auxiliary power from capacitors to recover a device in a hung state and reboot the physical device’s firmware stack.
Since it is increasingly unlikely that a server room is located ‘down the hall’, and more likely across town within a ‘lights out’ co-location datacenter, the means of restoring or resetting power states in as little time as possible takes on added importance.
iDRAC9 enables remote power cycles
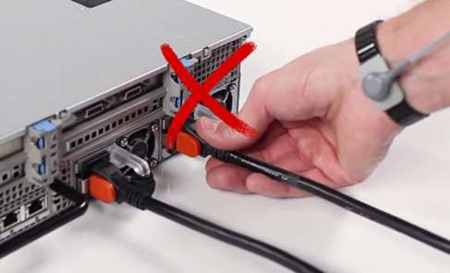
With the integrated Dell Remote Access Controller (iDRAC), standard on all Dell EMC PowerEdge servers, IT administrators can mimic a power cycle and restore the system without having to go to the datacenter, find the server in the hot aisle, and pull the plug. The following solutions will work for either AC or DC power supplies.
Invoking Virtual A/C Power Cycle
Dell EMC PowerEdge servers with iDRAC9 offer 2 options for invoking a virtual A/C (vAC) power cycle:
- Use of iDRAC9 out-of-band capabilities
- Use of an iDRAC Service Module (iSM) installed on Windows, Linux, or ESXi
Both options eliminate the need for physical presence, to locate the correct server in a hot aisle, and pull out the power cord before plugging it back in.
The path chosen is likely predicated on situation particulars:
- Using iDRAC, assuming no operating system dependencies:
- Set “Full Power Cycle” using GUI/Redfish/RACADM
- ‘Power Cycle’ – perform a power cycle of the server via iDRAC
- To note, the virtual A/C power cycle is always available and can be performed regardless of the host state; indeed, it may be required if the host operating system is not responding properly
- Of further note, this process applies to rack/tower systems, whereas for modular systems, it’s best to use the “virtual reseat” of the server option.
- iSM – sending commands to an agent through the operating system or hypervisor:
- Two commands are issued, one to activate the vAC, and one to perform a graceful power-down of the host
- May be necessary whenever the iDRAC is in an unresponsive state
- Requires PowerEdge servers with iDRAC9
Invoking a remote virtual A/C power cycle
With iDRAC, via the:
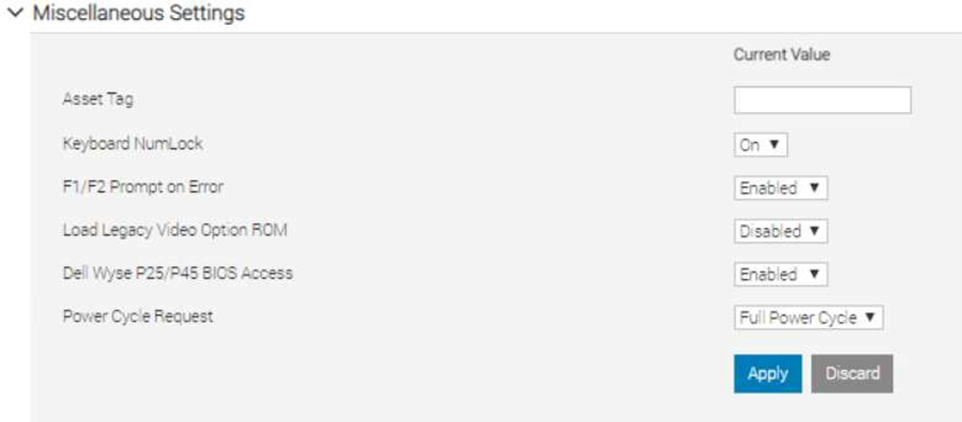
- GUI – navigate to Configuration > BIOS Settings > Miscellaneous Settings > Power Cycle Request
RACADM
- racadm set BIOS.MiscSettings.PowerCycleRequest FullPowerCycle
- racadm jobqueue create BIOS.Setup.1-1
- reboot host when ready.
Redfish
- PATCH / redfish/v1/Systems/System.Embedded.1/Bios/Settings with
{
“Attributes”: {
“PowerCycleRequest”: “FullPowerCycle:
},
"@Redfish.SettingsApplyTime": {
"@odata.type": "#Settings.v1_1_0.PreferredApplyTime", "ApplyTime": "OnReset"
}
}
When the patch command has successfully completed, a 202 “Accepted” status message will be returned along with the Task URI for newly created job.
- POST /redfish/v1/Systems/System.Embedded.1/Actions/ComputerSystem.Reset
{
"ResetType":"On" /// If Powered Off
}
or
{
"ResetType":"GracefulRestart" /// If already Powered On
}
This will restart the Host and start the Task/Job, wait for it to complete.
- iSM
- For Windows operating system – Shortcut menus are available for the FullPowerCycle Activate (request), FullPowerCycle Cancel and FullPowerCycle get status operations.
- To request FullPowerCycle on your system, type Invoke-FullPowerCycle –status request cmdlets in power shell console
- To get the status of the Full Power Cycle on your system, type Invoke-FullPowerCycle –status Get cmdlets in power shell console
- To cancel the Full Power Cycle on your system, type Invoke-FullPowerCycle –status cancel cmdlets in power shell console
- For Windows operating system – Shortcut menus are available for the FullPowerCycle Activate (request), FullPowerCycle Cancel and FullPowerCycle get status operations.
- For Linux operating system –
- To request Full Power Cycle on your system, type /opt/dell/svradmin/iSM/bin/Invoke-FullPowerCycle request
- To get the status of the Full Power Cycle on your system, type /opt/dell/svradmin/iSM/bin/Invoke-FullPowerCycle get-status
- To cancel the Full Power Cycle on your system, type /opt/dell/svradmin/iSM/bin/Invoke-FullPowerCycle cancel
Note: After running the command, a host power cycle (cold boot) is necessary for FullPowerCycle to take effect.
Conclusion
With servers increasingly managed remotely, a means of performing the virtual equivalent of pulling out the power cord and pushing it back in is a necessary capability in order to occasionally ‘unstick’ the operating system. With the Dell EMC PowerEdge iDRAC9 virtual power cycle feature, IT admins have access to console or agent-based routines to restore or reset power states in minutes rather than hours. This remote capability is essential to keeping distributed and scaled- out IT environments running smoothly.
Resources
iDRAC9 whitepapers and videos www.dell.com/support/idrac
iDRAC Manuals and User Guides www.dell.com/idracmanuals
iDRAC Service Module
www.dell.com/idracmanuals (select iDRAC Service Module)

iDRAC9 Telemetry Enhancements: Customizable Reports and Multiple Consoles
Mon, 16 Jan 2023 17:42:47 -0000
|Read Time: 0 minutes
Summary
iDRAC9 telemetry enhancements include the ability to create user- defined custom reports and balance volume of streamed telemetry across more than one collection point. iDRAC9 data streamed to an external ingress collector, from which tools like Splunk or ELK Stack can be used to aggregate data, examine trends, issue alerts, and generate timely reports.
Introduction
The iDRAC9 firmware v4.40.10 in conjunction with the Datacenter license, now includes feature enhancements to the telemetry streaming function. These include the ability to create user-defined custom reports and direct data streams to more than one collection point.
Embedded with every PowerEdge server, the integrated Dell Remote Access Controller 9 (iDRAC9) enables secure and remote server access, regardless of operating system state or presence of hypervisor, and makes possible a range of server management tasks, including configuration, OS deployment, firmware updates, health monitoring and maintenance.
The iDRAC9, while providing out-of-band and agent-free systems management, connects to all critical server component and collects over 180 server metrics in near-real-time. These metrics include granular, time-stamped data for critical functions such as processor and memory utilization, network card, power, thermal, memory, and graphics processing, and more; they enable consistency and scaling as infrastructure needs grow.
iDRAC9 data is streamed to an external ingress collector, from which tools like Splunk or ELK Stack can be used to aggregate data, examine trends, issue alerts, and generate timely reports. Data collected from iDRAC9 by server administrators can be used to make better data center performance decisions and prioritize proactive maintenance.
Customized Reporting
Building on prior capabilities, which included exposed time-series sensor data and JSON-enabled streaming telemetry data, version 4.40.10 of the iDRAC9 firmware has moved the DMTF Redfish schema-based reporting beyond default reports and values, to include the creation of user-defined custom reports. This flexibility helps to potentially cut down the size of data sets and reports, whether by changing the collection time interval, using additional aggregation functions within reports (beyond average/maximum/minimum), eliminating unwanted metrics, using 24 custom report definitions (in addition to 24 existing report definitions), or limiting report content to a subset of the maximum 2,400 values per report.
Support for Multiple Consoles
New iDRAC9 features also include, in response to customer feedback, the ability to send iDRAC9-streamed telemetry from one or many Dell EMC PowerEdge servers, to more than one collection console, for use by one or many organizations charged with overseeing data center operations. A total of eight separate collection consoles can be specified, which allows for reducing the rate and volume of telemetry data flowing to any one particular collector, and avoiding any “thundering herd” effect when formerly thousands of iDRAC9 servers could potentially fire off data at a particular collector on a non-randomized schedule. This feature improvement also allows for variations in data sampling rates and reporting schedules, tied to custom reports that drive requirements for sampling interval, metrics collected, and configuration parameters set. Through better distribution of streamed telemetry at the collector level, the greater the number of iDRAC9 servers that can be supported.
All changes to all reports are normally global, regardless of whether a report is a legacy report or a custom report, as all collectors see the changes, regardless of which particular collector initiated the change. By using specific report definition names, however, a particular collector can lay claim to that particular report definition.
New reports are created using functions supported by HTTP, including PATCH, POST, PUT, and DELETE, whereby a web server accepts enclosed data or a request to make partial changes or deletions to an existing resource. ‘Pre-canned’ reports included with iDRAC9 can be changed using the PATCH function. They cannot be deleted, however, using DELETE, as this merely resets the report back to factory default values. Standard DMTF Redfish semantics apply to all of these operations, as does Report URI, used for monitoring security policies. Report definitions can be deployed using the Server Configuration Profile feature (SCP). SCP enables changes to configuration, firmware and redeployment of the operating system through a single XML or JSON template; The SCP template can then be applied to multiple servers.
Conclusion
As data centers grow in importance, servers proliferate, and differences between poorly-run and well-run facilities become readily apparent and thus consequential, iDRAC9, standard with all PowerEdge servers, provides an effective means of monitoring, analyzing, and acting upon data streamed from 180 or more monitored server performance indicators. The addition of feature enhancements to the latest iDRAC release make it now possible to create custom reports and balance the volume of streamed telemetry across more than one collection point.
These tools and more underscore how Dell EMC PowerEdge servers are compelling compute solutions. The inclusion of custom reports and support for multiple collectors, ease-of-monitoring, managing, updating, troubleshooting, and remediation of server performance, make for seamless and integrated server data collection, a key enabler of any well-run datacenter.

iDRAC9 System Lockdown: Preventing Unintended Server Changes
Mon, 16 Jan 2023 17:38:11 -0000
|Read Time: 0 minutes
Summary
Enabling system lockdown mode is part of Dell Technologies’ cyber resilient architecture of Protect, Detect and Recover. System Lockdown helps prevent change or “drift” in system firmware images and critical server configuration settings. Dell Technologies is the only vendor to offer the ability to dynamically enable and disable system lockdown once your server is provisioned and in production without having to reboot.
Introduction
Running the latest firmware on datacenter servers helps keep up with security and performance improvements, maintain optimal operating parameters, and leverage new features. All are critical to the bottom line, to getting the most from your datacenter investment. When unplanned or unforeseen changes occur to server configurations, whether benign or malicious, these can propagate across a datacenter with a corresponding loss in productivity or extra cost.
iDRAC9 System Lockdown Benefits
To prevent unintentional changes, the iDRAC9 Enterprise and Datacenter licenses now include a feature “System Lockdown,” a virtual lock for firmware and hardware configurations. Even those with full admin privileges are limited to read-only access—unless the lock is first disabled. This prevents server ‘drift’, the unintentional migration of firmware and configuration settings across servers.
The lock does, however, allow for continued access to key operations, such as power capping and power cycling, health monitoring and virtual console access, while keeping server workloads running. All hypervisor and OS functionality are also fully accessible.
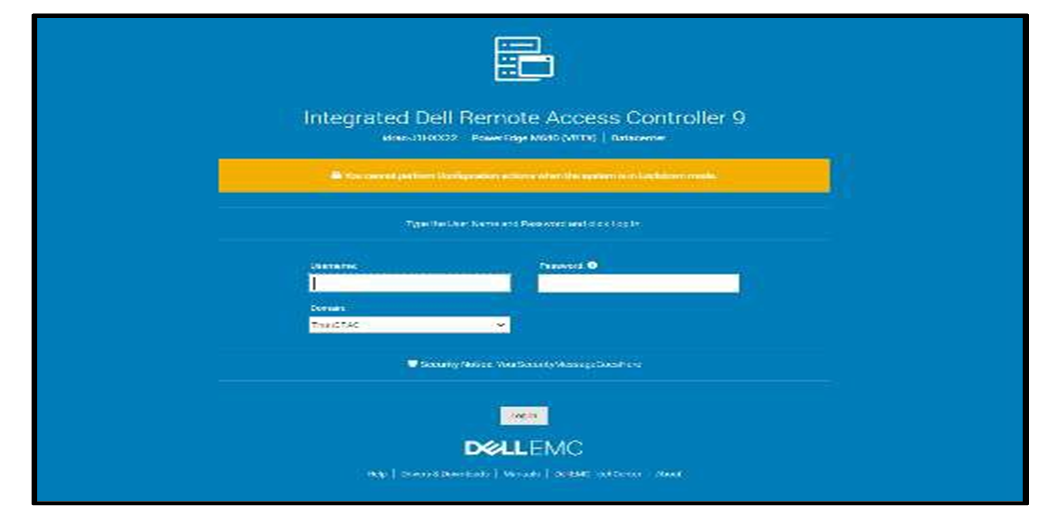
When accessed via a web GUI, Redfish REST APIs, or RACADM command-line utility, systems administrators are prevented from making changes that could impact servers in production. Additionally, the lockdown status is evident via a padlock icon and greyed out settings in the iDRAC GUI.

Even before logging in, the admin is notified the system is in Lockdown mode.
iDRAC9 System Lockdown is Part of Dell’s Cyber Resilient Architecture
The lockdown mode is part of Dell’s PowerEdge cyber resilient architecture, with its emphasis on Protect, Detect and Recover. It protects by preventing firmware downgrades as a possible vector of attack, adding or removing users as a means of circumventing settings, or modifying lockout policies. System Lockdown enables detecting changes outside a maintenance window by creating alerts in the iDRAC lifecycle log that can be configured to send notifications, and it potentially cuts recovery time spent re-imaging or re-configuring servers.
System lockdown now offers native lockdown support in select NICs which prevents malware in the OS from installing firmware updates using altered versions of vendor tools. This also addresses concerns for cloud providers of end customers installing their own firmware versions on the server hardware they are using. As a result, subsequent users of a cloud server can be assured that the networking adaptor firmware is secure and version consistent.
System Lockdown Drives Datacenter Efficiencies
The system lockdown fits well with standard server maintenance window methodologies, the unlocking and locking of servers serving as ‘bookends’ at the start or end of maintenance work. Once operationalized, it helps drive good maintenance behavior, cuts unforced errors, and prevent server ‘drift’.
In Conclusion
Enabled in iDRAC Enterprise and Datacenter licenses, the lockdown feature is another important tool available from Dell Technologies to manage and maximize your investment in your PowerEdge servers.

“Thermal Manage” Features and Benefits

Mon, 16 Jan 2023 17:06:35 -0000
|Read Time: 0 minutes
Summary
This Tech Note covers the features and benefits of using the “Thermal Manage” features within the iDRAC Datacenter license.
Introduction
With increasing server densities and the desire to maximize compute power per unit area at the datacenter level, there is an increasing need for better telemetry and controls related to power and thermals to manage and optimize data center efficiency.
“Thermal Manage” includes features of the iDRAC Datacenter license and provides key thermal telemetry and associated control features that facilitate deployment and customization challenges.
Thermal Manage – Feature Overview
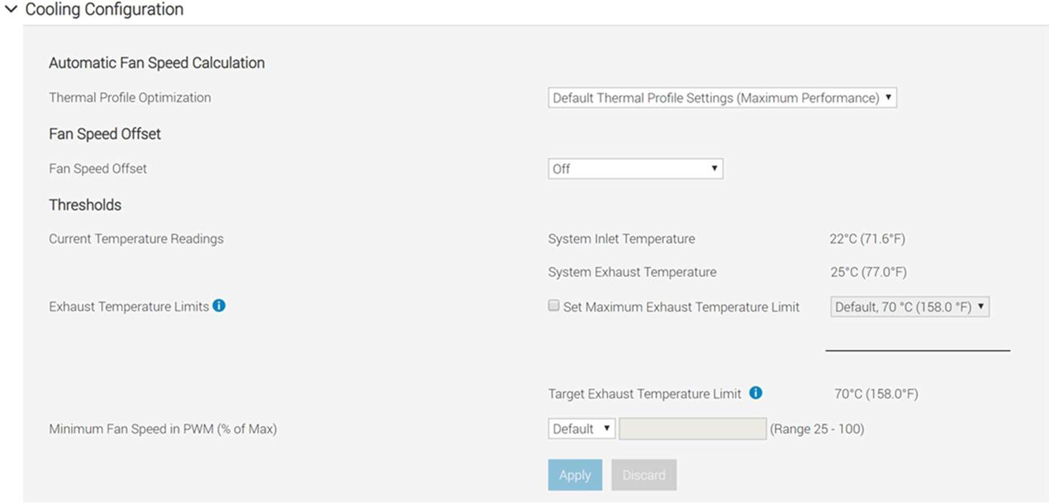
Thermal Manage allows customers to customize the thermal operation of their PowerEdge servers with the following benefits:
- Optimize server-related power and cooling efficiencies across their datacenters.
- Integrates seamlessly with OpenManage Enterprise Power Manager for optimized management experience.
- Provides a state-of-the-art PCIe cooling management dashboard.
Represented in the following diagram (See figure 1) and listed below is a summary of the features and its utilities.
- System Airflow Consumption: Displays the real-time system airflow consumption (in CFM), allowing airflow balancing at rack and datacenter level.
- Custom Delta-T: Limit air temperature rise from inlet air to exhaust to right-size your infrastructure level cooling.
- Exhaust Temperature Control: Specify the temperature limit of the air exiting the server to match your datacenter needs.
- Custom PCIe inlet temperature: Choose the right input inlet temperature to match 3rd party device requirements.
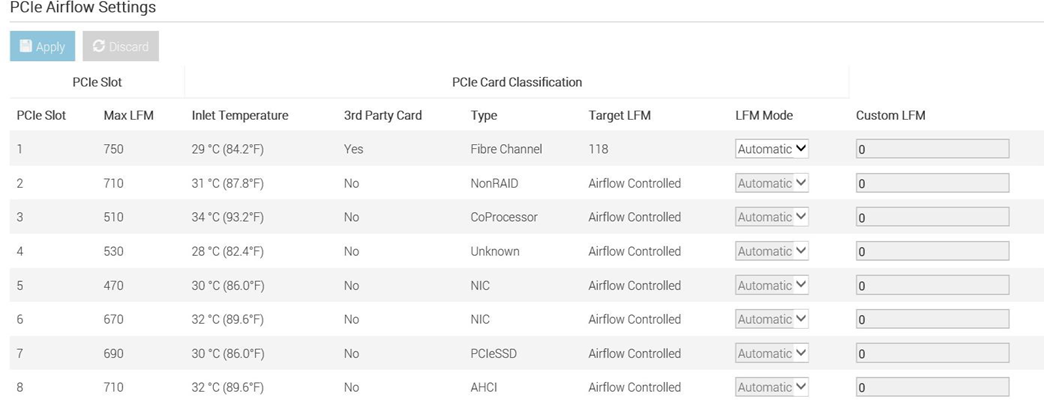
- PCIe airflow settings: Provides a comprehensive PCIe device cooling view of the server and allows cooling customization of 3rd party cards.
Details and Use Cases
By default, Dell server thermal controls algorithm works to minimize system airflow consumption and maximize exhaust air temperature.
The higher the air exhaust temperature going into the HVAC (CRAC units) – the higher capacity they exhibit.
- It is directly proportional to the temperature difference between return air (exhaust) and the cooling coil for a given coil flow rate.
- This could result in lower CRAC capital costs if you can cool more with fewer CRAC units and an operational savings of cooling with less equipment.
Some customers, however, have challenges with high exhaust temperatures in the hot aisle, namely:
- Technicians don’t like the extra heat while working in the hot aisle.
- Components in the hot aisle (PDUs, cables, network switches) may have exceeded their ambient temperatures.
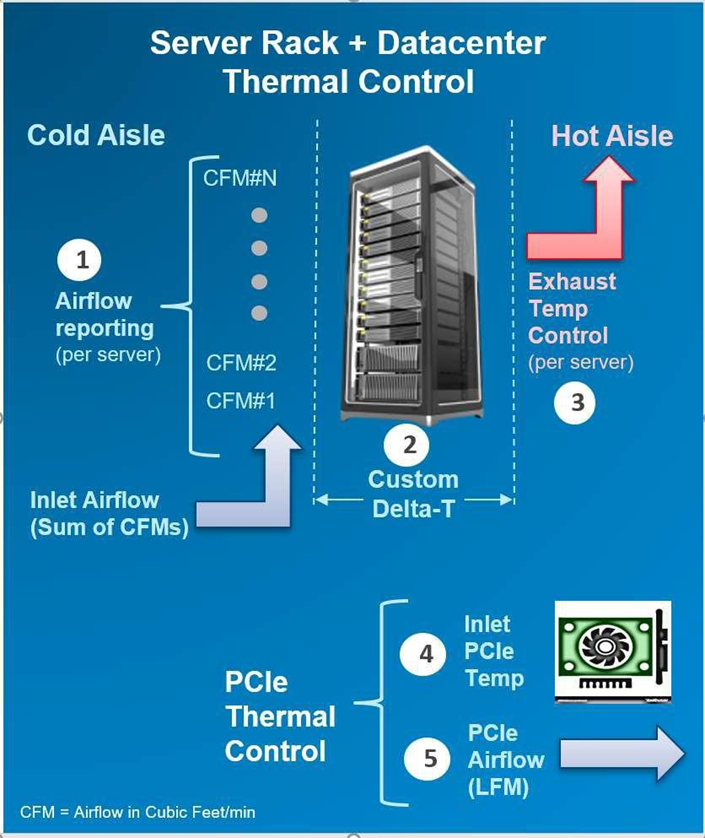
Figure 1 displays the features and its utilities.
In either case, we allow customization of this exhaust temperature via iDRAC interfaces.
Using the real-time airflow telemetry, a datacenter can create a good balance of airflow delivery vs. airflow demand at the server. A reduction in CFM also can be monetized on a dollar/CFM basis.
- In an example analysis using a 17 KW rack, a drop in CFM by 10% could result in capital savings (CRAC costs of $257/rack) and an annual operational savings of $93 per rack based on the typical energy cost and data center efficiencies assumed.
- However, the greater benefit is the potential ability to fit more racks on the floor (or more servers in a rack), if airflow balancing is achieved by closely matching the server/rack airflow consumption.
iDRAC Thermal Manage features require an iDRAC Datacenter license. Here is an image from the iDRAC GUI showing the thermal telemetry and customization options:
Deploying 3rd party PCIe cards in PowerEdge servers is a common practice. The PCIe airflow settings feature allows a better understanding of the cooling state of the PCIe devices. This helps customers protect their high-value PCIe card with the right amount of cooling. Additionally, this optimizes system airflow, which ties into the earlier point of data center airflow management.
By default, the presence of a 3rd party card may cause the system fan speeds to increase based on internal algorithms. However, this additional cooling may be more or less than required and hence the need for allowing customers to customize airflow delivery to their custom card.
In the iDRAC GUI under PCIe Airflow Settings (Dashboard » System » Overview » Cooling » Configure Cooling – see example snapshot below), the system displays high-level cooling details for each slot in which a card is present. It also displays the max airflow capability of each slot. This airflow information is provided in units of LFM (Linear Feet per Minute), which is industry standard for defining the airflow needs for a card. Only for the 3rd Party Card, customers can see min LFM value delivered to the card and either disable the custom cooling response for that card or disable and then set custom LFM value desired (based on card vendor specifications).
NOTE: For Dell standard devices, the correct power and cooling requirements are part of the iDRAC code, which allows for the appropriate airflow.
In Conclusion
Thermal Manage features within the iDRAC Datacenter provides industry-leading custom thermal control options that provides valuable custom cooling and efficiency optimization options for both the system and data center level.

Dell PowerEdge – iDRAC Automatic Certificate Enrollment
Mon, 16 Jan 2023 16:59:18 -0000
|Read Time: 0 minutes
Summary
In the latest generation of Dell EMC PowerEdge Servers, iDRAC v4.0, has implemented a new automated security feature to keep your iDRAC SSL/TLS certificates current. The iDRAC’s Automatic Certificate feature automatically assures SSL/TLS certificates are in place and up-to-date for both bare-metal and previously installed systems.
Introduction
Dell EMC PowerEdge server’s Integrated Dell Remote Access Controller (iDRAC) v4.0 offers a new security feature, Secure Sockets Layer (SSL)/ Transport Layer Security (TLS) Automatic Certificate Enrollment that helps the Data Center Manager maintain security with less effort.
Data Center Managers need to be vigilant to make sure that their compute environment is protected from a range of threats and attacks. Monitoring and assuring that all security measures are current and in place is time- consuming and imperative to prevent unauthorized access and manipulation of your servers.
iDRAC Web User Interface and SSL/TLS Certificates
The iDRAC enables remote system management and reduces the need for physical access to the system. The iDRAC Web User Interface can be reached with any supported browser and uses an SSL/TLS certificate to authenticate itself to web browsers and command-line utilities running on management stations thereby establishing an encrypted link.
If the Certificate Authority that issued the certificate is not trusted by the management station, warning messages will be displayed on the management station. Having an iDRAC SSL/TLS certificate in place ensures a validated and secure connection.
Previously, creating and renewing iDRAC SSL/TLS certificates required a mostly manual, time-consuming effort. Monitoring approaching expiration dates and arranging for new certificates to be generated from a CA authority is just one aspect. IT admins then had to update scripts to deploy the certificates to embedded devices like the iDRAC.
iDRAC SCEP Client Support - Automatic Certificate Enrollment
iDRAC has added a client for Simple Certificate Enrollment Protocol (SCEP) support. SCEP is a protocol standard used for managing certificates to large numbers of network devices using an automatic enrollment process. The iDRAC can now integrate with SCEP-compatible servers like Microsoft Server’s NDES service to maintain SSL/TLS Certificates automatically. This feature can be used to enroll and refresh a soon-to-be-expired web server certificate.
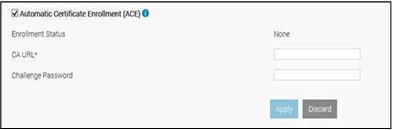
ACE- Automatic Certificate Enrollment
Automatic Certificate Enrollment will enroll and monitor the iDRAC web server SSL/TLS certificate. It enrolls to the specified Certificate Authority (CA) credentials provided. This can be done 1x1 in the iDRAC GUI, set via Server Configuration Profile, or scripted via tools such as Racadm.
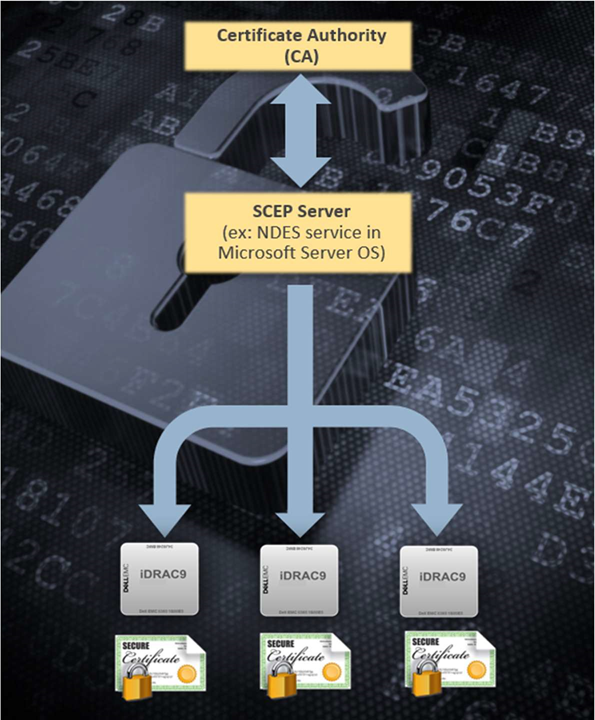
iDRAC Integration with MS-NDES over SCEP
In Conclusion
Monitoring and assuring that all security measures are current and in place is both time-consuming and essential to prevent unauthorized access and manipulation of your servers. The Automatic Certificate Enrollment feature in iDRAC9 v4.0, is just another way Dell EMC is helping you to keep your data center secure.

Transform Datacenter Analytics with iDRAC9 Telemetry Streaming
Mon, 16 Jan 2023 16:51:18 -0000
|Read Time: 0 minutes
Summary
Telemetry Streaming, a new feature in iDRAC9 v4.0 enabled by the new Datacenter License, can produce more high-value (comprehensive and accurate) data faster than with previous versions. There is a huge amount of untapped machine data in your IT infrastructure: use iDRAC9 Telemetry Streaming and analytics to leverage that data to optimize your server management and operations.
Introduction
With the advent of the new iDRAC9 v4.00.00.00 firmware release and the Datacenter license, IT managers can now integrate advanced telemetry about the server hardware operation into their existing analytics solutions. This telemetry is provided as granular, time-series data that can be streamed versus using inefficient, legacy polling methods. The advanced agent-free architecture in iDRAC9 provides over 180 data metrics (with more coming) related to server and peripherals operations that are precisely time-stamped and internally buffered to allow highly efficient data stream collection and processing with minimal network loading. This comprehensive telemetry can be fed to popular analytics tools to predict failure events, optimize server operation, and enhance cyber-resiliency.
Telemetry and Analytics
Telemetry has been around for decades and has been used in various business applications, from hospitals monitoring patients to oil and gas drilling systems to weather balloons transmitting meteorological data. The definition of Telemetry is an “automated communications process by which measurements are made, and other data collected at remote or inaccessible points are transmitted to receiving equipment for monitoring.”
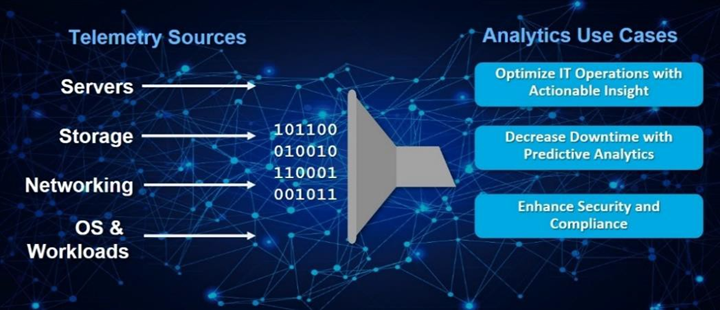
Figure 1. Telemetry Monitoring in a Typical Data Center
In the era of “Big Data,” IT managers leverage a wide range of telemetry from their infrastructure in their monitoring tools, as shown in Figure 1. However, increasingly that telemetry is also used in AI-based analytics to gain operational insight into their datacenter operations. This is far more powerful than using simple alerting and monitoring techniques that typically only report health and status via SNMP alerts or IMPI traps.
Using analytics tools, IT managers can more proactively manage by analyzing trends and discovering insightful relationships between seemingly unrelated events and operations. A recent survey found that 61% of IT decision-makers considered data and analytics very important to their business growth strategy/digital transformation efforts.1
Some of the use cases for data center analytics are:
- Predictive analytics: Customers can perform an in-depth analysis of server telemetry, including device parametric data to proactively replace failing devices. In one case, an IT team used analytics on telemetry from memory devices to develop an algorithm that predicted eventual failure. This allows proactive replacement of suspect devices during scheduled maintenance windows, significantly improving uptime and SLA quality.
- Optimized IT operations: You can perform time-series analysis of vital server metrics to gain insights into optimizing server operation, including tracking of power, temperature, CPU, and I/O performance, etc. One industry that makes extensive use of analytics is High-Frequency Trading, where every millisecond of compute counts in accelerating automated trades. Detailed telemetry is commonly used to discover ways to squeeze out more performance from servers, which becomes a key competitive advantage in this industry.
- Security: AI-based analytics can respond far faster to security events. You can enhance security AI and forensics by monitoring the say of unusual user login activity or physical intrusion events on your servers.
However, to perform effective analytics, you need data: lots and lots of it to feed Machine or Deep Learning techniques effectively. The larger the data set, the more accurate the analysis becomes as evidenced by the petabytes of data that social media uses in analytics of user attributes and buying behaviors.
The Streaming Advantage in iDRAC9
Telemetry streaming’s big performance advantage is in reducing the overhead needed to get the complete data stream from a remote device. Retrieving telemetry using polling can result in an enormous number of discrete commands being issued, which is very challenging in scaling across a large datacenter. With iDRAC9 Telemetry Streaming, you get time-series and detailed statistics reports delivered directly to a variety of analytics collection tools with higher efficiency by removing the need for issuing individual commands for each piece of data. The streaming configuration is flexible so users can modify the number of metrics they require, the report interval (30 seconds for example), and enable reports to be sent immediately upon detection of critical events in the server (like a PSU failure say).
In summary, the advantages of Streaming over Polling are:
- Better Scalability: Polling requires a lot of scripting work and CPU cycles to aggregate data and suffers from scaling issues when we are talking about 100’s or 1000’s of servers. Streaming data, in contrast, can be pushed directly into popular analytics tools like Prometheus, ELK stack, InfluxDB, Splunk without the overhead and network loading associated polling.
- More Accuracy: Polling can also lead to data loss or “gaps” in sampling for time series analysis; it is usually only a snapshot of current states, not the complete picture over time. You might miss critical peaks or excursions in data.
- Less Delay: Data can be severely delayed in time due to needing multiple commands to get a complete set of data and the inability to poll simultaneously from a central management host. Streaming more accurately preserves the time-series context of data samples.
Consequently, streaming is a far more efficient and accurate way to gather telemetry.
Telemetry Excellence with the iDRAC9 Datacenter License
iDRAC9 v4.0, with the Datacenter license, offers over 180 telemetry metrics on various server devices and sensors. These metrics also form the basis of our SupportAssist Collection Report, an incredibly useful tool that captures over 5,000 pieces of diagnostic data and log files for troubleshooting server issues. iDRAC9 Telemetry Streaming does all the heavy lifting for you by internally sampling and storing all the data points and then streaming them out in reports at a frequency that fits your needs. iDRAC9 can deliver almost 3 million metrics a day to transform the accuracy of analytics processing for your data center!
Telemetry can be delivered via the following methods:
- Redfish Server-Sent Events (SSE), a DMTF standard for streaming data2
- Redfish subscription for pushing events, another DMTF standard
- Remote Syslog, a protocol for pushing logs for centralized monitoring
- Non-streaming, scripted polling via the iDRAC9 RESTful API (though not as efficient as streaming as discussed earlier)
The data is formatted using JSON (JavaScript Object Notation) and can be easily adapted to connect many analytics solutions on the market, as shown in Figure 2.
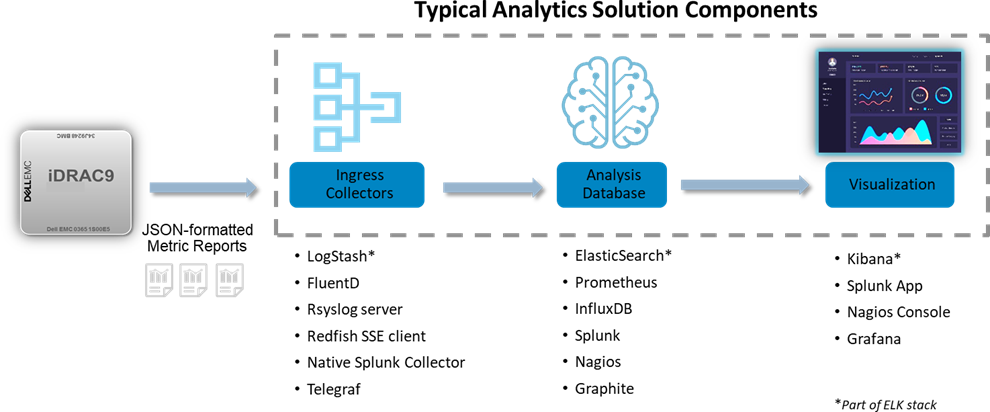
Figure 2. Integrating iDRAC9 Telemetry Streaming with Popular Analytics Solutions
Types of Telemetry Data
A summary of the types of telemetry that iDRAC9 has are:
New Telemetry Data with iDRAC9 4.0:
- Serial Data Log messages
- GPU Accelerator Inventory & Monitoring
- Advanced CPU Metrics
- Storage Drive SMART logs
- Advanced Memory Monitoring
- SFP+ Optical Transceiver Inventory & Monitoring
Existing Telemetry Data:
- Configuration – comprehensive settings for all devices (BIOS, iDRAC, NICs, RAID, etc.)
- Inventory: comprehensive server hardware and firmware reporting
- Performance: CPU, memory bandwidth and I/O usage (Compute Usage Per Second or CUPS)
- Performance and diagnostic statistics: PERC, NICs, Fiber Channel
- Sensors: voltage, temperature, power, connectivity status, intrusion detection
- Logs: SEL log, iDRAC diagnostics, Lifecycle Controller Log
Figure 3 illustrates an external analytics solution capturing and visualizing iDRAC9 Telemetry Streaming. In this case, CUPS performance data was streamed to InfluxDB for the data analysis, and Grafana then used for the visualization.
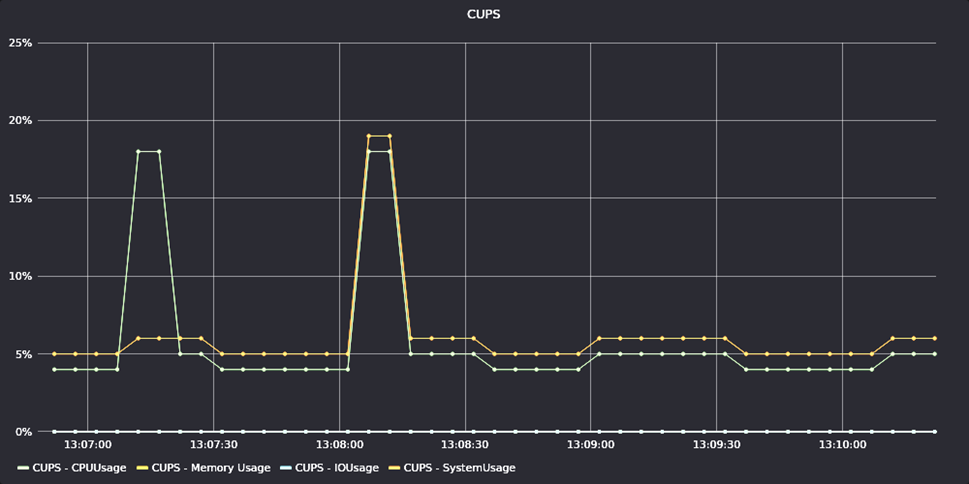
Figure 3. Example of iDRAC9 Telemetry for CUPS Performance Data
In Conclusion
Dell EMC continues to introduce innovations that help our customers automate the management of their IT infrastructure. iDRAC9 Telemetry Streaming represents a huge step forward in helping our customers leverage the extensive data available in their PowerEdge servers. Customers can easily stream this telemetry into their analytics tools and leverage advanced AI techniques to automate their IT systems management and operations further.
- “2020 Global State of Enterprise Analytics”, published by MicroStrategy.
- Server-Sent Events (SSE) is a server push technology (part of HTML5) enabling a client to receive automatic updates from a server via an HTTP/S internet connection.

Improved iDRAC9 Security using TLS 1.3 over HTTPS on Dell PowerEdge Servers
Mon, 16 Jan 2023 16:30:31 -0000
|Read Time: 0 minutes
Summary
The iDRAC is designed for secure local and remote server management and offers industry-leading security features. iDRAC9 5.10.00.00 supports TLS 1.3 over HTTPS, to encrypt data and authenticate connections for moving data over the internet. TLS 1.3 uses advanced encryption algorithms, fewer cipher suites, and more secure handshakes.
Features supported by iDRAC9 over HTTPS using TLS 1.3 include:
- iDRAC9 Web Server
- Firmware Updates
- Export SupportAssist
- Import/Export Server Configuration File
- Export Inventory
- Export Lifecycle Log
Introduction
Data Center Managers rely on remote server management to deploy, update, and monitor their servers to extend their reach without having physical access to them. Securing your remote connection with encryption and secure login credentials is one way to prevent malicious actors from gaining access to your server. A secure connection prevents the deletion of critical data, ability to apply malware, or alter the system configuration
Embedded within every Dell PowerEdge server is a powerful leading-edge remote server management processor, the Integrated Dell Remote Access Controller (iDRAC). The iDRAC is designed for secure local and remote server management and offers industry-leading security features. iDRAC9 establishes an encrypted connection over HTTPS using an SSL/TLS certificate to authenticate to web browsers and command line utilities. iDRAC9 version 5.10.00.00, now supports TLS v1.3 over HTTPS.
Secure communications with SSL/TLS
The iDRAC Web User Interface can be reached with any supported browser. iDRAC uses an SSL/TLS certificate to authenticate itself to web browsers and command line utilities, establishing an encrypted link. Transport Layer Security (TLS) is one of the most widely used security protocols.
When a user goes to a website, their browser checks for a TLS certificate on the site. If a certificate is present, their browser performs a TLS handshake to check its validity and authenticate the server. Once a link has been established between the two servers, TLS encryption and SSL decryption enable secure data transport.
There are several options available to secure the network connection using an TLS/SSL certificate. iDRACs web server has a self-signed TLS/SSL certificate by default. The self-signed certificate can be replaced with a custom certificate, a custom signing certificate, or a certificate signed by a well- known Certificate Authority (CA). Automated certificate upload can be accomplished by using Redfish scripts. The iDRAC9 Automatic Certificate Enrollment and Renewal feature automatically assures SSL/TLS certificates are in place and up to date for both bare-metal and previously installed systems. The Automatic Certificate Enrollment and Renewal feature requires the iDRAC9 Datacenter license.
TLS 1.3
TLS 1.3 offers several advantages over TLS 1.2. TLS version 1.3 uses advanced encryption algorithms, fewer cipher suites and, faster and more secure handshakes. Enabling TLS 1.3 results in better network connection performance.
Many new operating systems and browsers support TLS 1.3. Web browsers and command-line utilities, such as RACADM and WS-Man, use this TLS/SSL certificate for server authentication and to establish an encrypted connection. If the HTTPS server is configured for TLS 1.3, the clients will automatically detect it and perform the operation over TLS 1.3.
iDRAC9 Web Server can be configured with options to support “TLS 1.3 only.” Use the “TLS 1.3 only” option when the HTTPS client can support it. Older browsers that do not support TLS 1.3 should be configures to “TLS 1.2 and Higher” or “TLS 1.1 and Higher.”
Once iDRAC is configured and the TLS/SSL certificate is installed on the management stations, SSL enabled clients can access iDRAC securely and without certificate warnings.
Conclusion
iDRAC9 continues to support that latest security standards to meet the needs of security focused customers. iDRAC9 5.10.00.00 TLS 1.3 support over HTTPS, enables you to use the most current security stance for remotely managing your PowerEdge servers.

Advanced Features of the iDRAC9 eHTML Virtual Console
Mon, 16 Jan 2023 15:15:34 -0000
|Read Time: 0 minutes
Summary
The iDRAC9 Virtual Console feature allows users to perform server operations remotely as if they are in front of the server, bringing more flexibility and security. Beginning with iDRAC9 firmware 6.00.00, eHTML5 will be the single option to access virtual console and virtual media.
Introduction
Embedded with every Dell PowerEdge server, the integrated Dell Remote Access Controller (iDRAC) enables secure and remote server access, providing out-of-band and agent-free systems management. One of the most often-used iDRAC features is the virtual console. For well over a decade, IT admins have relied on the ability to remotely access the operating system and perform a variety of features.
The virtual console feature allows users to remotely manage their PowerEdge server using video, keyboard, and mouse from their management system. It allows video- keyboard-mouse redirection over the network and to virtualize the remote server console on management system. The user can perform all operations with the remote host as if they are in front of the server.
As far back as DRAC4, there were two client plug-in options available: Java and ActiveX, to enable the launch of a virtual console to a remote host server. The Java/ActiveX plug-in had features like server power control, mapping first boot device, keyboard macros, performance statistics, and chat client. However, both these native plug-ins are prone to vulnerabilities. Later, HTML5 technologies became popular, having most of the features in Java/ActiveX plug-ins, and are inherently more secure as they are run in the browser. In March of 2016, Dell Technologies added an HTML5 browser-based plug-in option to iDRAC7/8 firmware version 2.30.30.
Enhanced HTML5
To bridge the JAVA/ActiveX and HTML5 feature/security gap, Dell Technologies introduced eHTML5 (enhanced HTML5) with features set on par with the Java plug-in with iDRAC9 4.40.40 in December of 2020. This eHTML5-based solution consists completely of Dell developed code. This brings more flexibility and control in terms of maintainability and future enhancement around this solution.
Beginning with iDRAC9 firmware 6.00.00, eHTML5 will be the single option to access the virtual console and virtual media.
Features offered with eHTML5:
- HTML5 only with video encryption always ON
- Server power control options
- Next boot device menu
- Video logs (up to three BIOS boot logs and OS crash logs) in standard MPEG format
Sessions management:
- Up to six concurrent sessions
- Access sharing handshake among connected clients
- Chat option
- Connected users list Secure solution:
- Video encryption always enabled
- Local video enable/disable option
- Auto lock server while exiting vConsole session Keyboard support:
- Virtual keyboard layout (English, French, German, Spanish, Japanese, Chinese)
- Virtual clipboard
- Keyboard macro menu
- Screen capture, refresh, full screen
- Performance
- Performance statistics display
- Performance tuning knobs
Virtual media solution
The eHTML5 virtual media solution is also completely redeveloped by Dell with all legacy features supported. The new vMedia solution is ~30% faster than the legacy HTML5-based client.
It also has an additional feature of IMG file creation which is useful when a user wants to attach some local file folder to a remote server for transferring data.
The remote file share feature is extended for one more image file attachment. This is very useful in an OS-deployment scenario to attach an additional password file along with an ISO image.
Table 1. Comparison with legacy options
Java/ActiveX | HTML5 | eHTML5 |
Security concerns |
|
|
Conclusion
The iDRAC is designed for secure local and remote server management and helps IT administrators deploy, update, and monitor Dell PowerEdge servers anywhere, anytime. The iDRAC Virtual Console feature enables system administrators to be more productive and improve the overall availability of Dell PowerEdge servers.
References

iDRAC9 System Lockdown: Preventing Unintended Server Changes
Fri, 13 Jan 2023 10:54:41 -0000
|Read Time: 0 minutes
Summary
Enabling system lockdown mode is part of Dell Technologies’ cyber resilient architecture of Protect, Detect and Recover. System Lockdown helps prevent change or “drift” in system firmware images and critical server configuration settings. Dell Technologies is the only vendor to offer the ability to dynamically enable and disable system lockdown once your server is provisioned and in production without having to reboot.
Introduction
Running the latest firmware on datacenter servers helps keep up with security and performance improvements, maintain optimal operating parameters, and leverage new features. All are critical to the bottom line, to getting the most from your datacenter investment.
When unplanned or unforeseen changes occur to server configurations, whether benign or malicious, these can propagate across a datacenter with a corresponding loss in productivity or extra cost.
iDRAC9 System Lockdown Benefits
To prevent unintentional changes, the iDRAC9 Enterprise and Datacenter licenses now include a feature “System Lockdown,” a virtual lock for firmware and hardware configurations. Even those with full admin privileges are limited to read-only access—unless the lock is first disabled. This prevents server ‘drift’, the unintentional migration of firmware and configuration settings across servers.
The lock does, however, allow for continued access to key operations, such as power capping and power cycling, health monitoring and virtual console access, while keeping server workloads running. All hypervisor and OS functionality are also fully accessible. When accessed via a web GUI, Redfish REST APIs, or RACADM command-line utility, systems administrators are prevented from making changes that could impact servers in production. Additionally, the lockdown status is evident via a padlock icon and greyed out settings in the iDRAC GUI.
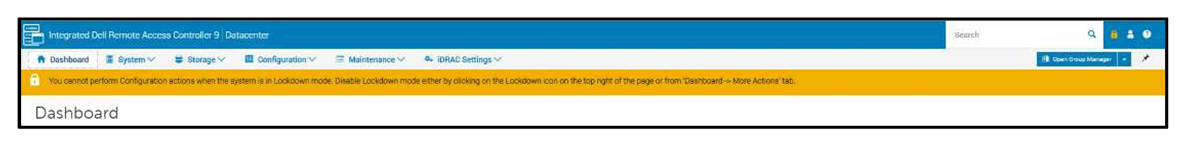
Even before logging in, the admin is notified the system is in Lockdown mode.
iDRAC9 System Lockdown is Part of Dell’s Cyber Resilient Architecture
The lockdown mode is part of Dell’s PowerEdge cyber resilient architecture, with its emphasis on Protect, Detect and Recover. It protects by preventing firmware downgrades as a possible vector of attack, adding or removing users as a means of circumventing settings, or modifying lockout policies. System Lockdown enables detecting changes outside a maintenance window by creating alerts in the iDRAC lifecycle log that can be configured to send notifications, and it potentially cuts recovery time spent re-imaging or re-configuring servers.
System lockdown now offers native lockdown support in select NICs which prevents malware in the OS from installing firmware updates using altered versions of vendor tools. This also addresses concerns for cloud providers of end customers installing their own firmware versions on the server hardware they are using. As a result, subsequent users of a cloud server can be assured that the networking adaptor firmware is secure and version consistent.
System Lockdown Drives Datacenter Efficiencies
The system lockdown fits well with standard server maintenance window methodologies, the unlocking and locking of servers serving as ‘bookends’ at the start or end of maintenance work. Once operationalized, it helps drive good maintenance behavior, cuts unforced errors, and prevent server ‘drift’.
In Conclusion
Enabled in iDRAC Enterprise and Datacenter licenses, the lockdown feature is another important tool available from Dell Technologies to manage and maximize your investment in your PowerEdge servers.