

Assets

Reduce Server Power Usage and Save Money with Power Manager

Mon, 16 Jan 2023 18:41:07 -0000
|Read Time: 0 minutes
Summary
Between the substantial rise in energy costs and organizations’ sustainable initiatives to reduce global warming, lowering data center power usage is a key strategy for many IT teams. This Direct from Development Tech Note describes the capabilities of Dell OpenManage Enterprise Power Manager version 3.0, which is a fully integrated extension to Dell OpenManage Enterprise. Power Manager provides increased visibility of server power data, including consumption, anomalies, and utilization. Customers can use this tool to discover and then proactively manage server power consumption plus server thermals while also assessing their carbon footprint.
Introduction
The phrase “you can’t manage what you can’t measure” is often attributed to W. Edwards Deming, the statistician. In terms of server power usage, this adage means that organizations need data plus tools to manage and lower server power usage, resulting in a reduced carbon footprint. With Dell OpenManage Enterprise Power Manager, PowerEdge customers can both monitor and actively manage server power usage. In addition to reporting power and thermal data, Power Manager can also cap server power consumption and manage thermal events. Version 3.0 also introduces a new carbon usage calculation feature for customers who want to understand their server estate emissions.
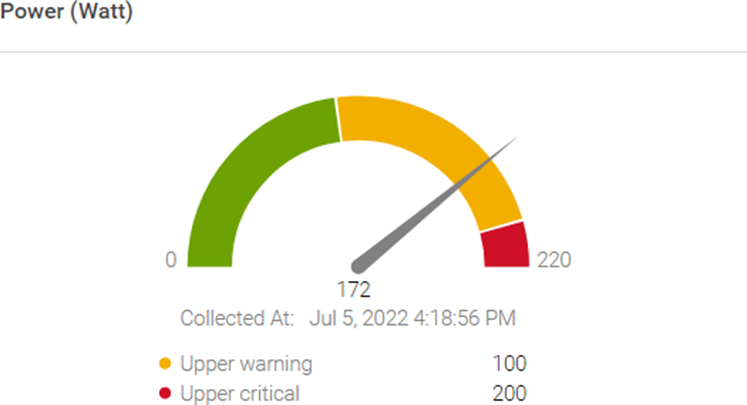
Figure 1. Server power usage data and threshold
Power reduction strategy
OpenManage Enterprise Power Manager supports creating a power reduction strategy easily and efficiently through several key elements.
Current usage
Discovering the current usage across an entire server estate is simple. Each managed server’s iDRAC gathers various metrics, such as power consumption, thermal utilization, and server utilization. OpenManage Enterprise collects and displays the data in dashlet graphs (mini dashboards), such as Power History (Watt) (shown in Figure 2). Within the tool, administrators can place servers into racks, aisles, and then data center collections to reflect the real-world environment to assist with reporting and actions. These dashlets offer powerful visualization of the data, from one server to an entire server fleet, for the last few hours or up to an entire year. If required, customers can add power values for unmonitored devices for a more complete view of data center power usage. An OpenManage Enterprise Advanced or Advanced+ license is required on each server to enable Power Manager.
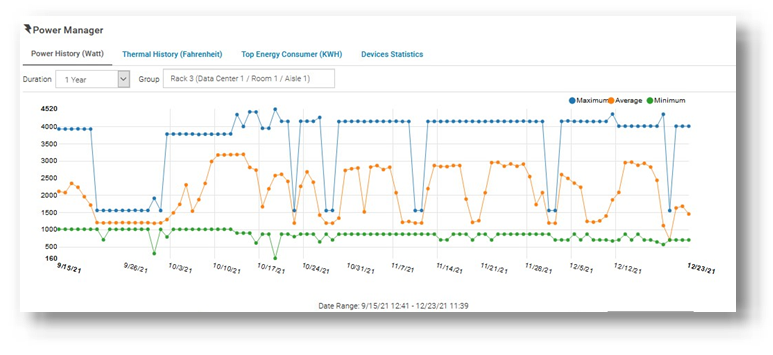
Figure 2. Power history for one group of servers
Review and analyze
Through its dashlets, Power Manager accelerates customers’ understanding by providing relevant data that highlights servers that should be reviewed. These include top energy consumers (kWh), as shown in Figure 3.
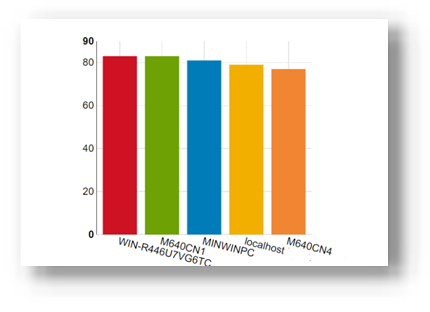
Figure 3. Top energy-consuming servers (kWh)
This data is also consolidated into reports and is available in the custom report builder as well. The prebuilt library contains numerous useful reports, including Power Manager: Server Utilization Report and Power Manager: Power and Thermal Report (shown in Figure 4). These reports highlight underutilized and idle servers that could be candidates for consolidation or decommissioning.
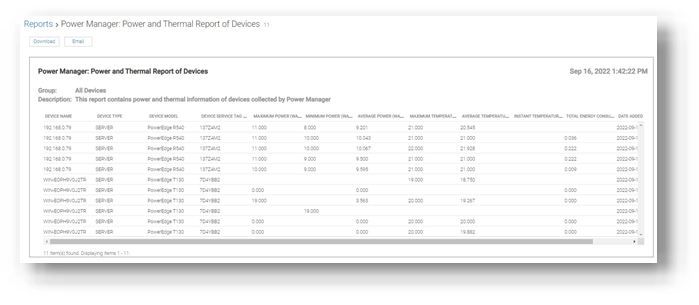
Figure 4. Power and thermal report
Administrators can assess power draw by virtual machines (VMware ESXi and Microsoft Hyper-V hosts) as well as power draw by key components such as CPU, RAM, server fans, and local storage.
Customers who want carbon footprint data can use the integrated greenhouse gas emissions reports that detail energy consumed (kWh) and greenhouse gas emissions per server and per group. All report data can be exported as HTML, PDF, CSV, or XLS, and any report can be run ad hoc or automatically delivered by email on a regular basis through the OpenManage Enterprise report schedule.
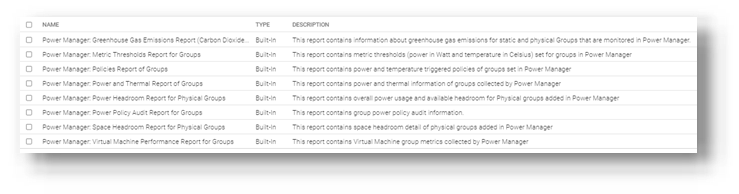
Figure 5. List of power-related reports
Take action
Administrators can consider using power capping during hours that are outside of normal operations or in test and development environments. Modern servers are relatively efficient when idling; however, the introduction of power capping can guarantee low power usage. Administrators can use Power Manager’s static policies to set budget power for a device or group, or even the entire server estate, as shown in Figure 6. Power caps can be set in watts or percentage.
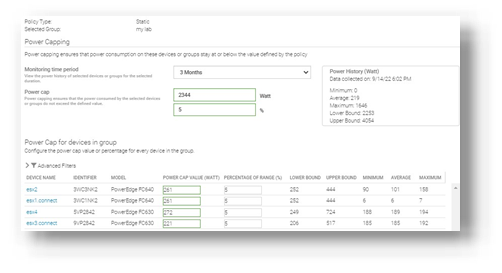
Figure 6. Creating a power-capping policy for multiple servers
For example, an administrator might have no power capping policies during the day when full server performance is required and configure a lower power cap for evenings and weekends when server workload is less.
Additional suggestions to decrease power consumption and carbon footprint include:
- Review and change the server BIOS system profile. For example, change Maximum Performance to Performance Per Watt. Expect Power Manager to manage this profile setting in future releases.
- Replace or consolidate older servers that use outdated CPU technology. Those older servers are not as power- efficient as the latest generation of PowerEdge. Tools such as Dell Live Optics, through which you can review current server operating system performance data such as RAM capacity and storage performance, and Dell Enterprise Infrastructure Planning Tool (EIPT) can help with further investigation and “what-if” migration modeling.
- Improve the overall efficiency of data center cooling, thereby improving power usage effectiveness (PUE). For example, review air flow for more effective cooling, resolving data center hot spots/cold spots, or implement highly efficient liquid-cooled Dell servers.
- Move to renewable energy sources/suppliers to aid in decreasing carbon emissions.
References
- Dell OpenManage Enterprise Power Manager Support site
- Usage of Reports in Data Center through Dell OpenManage Enterprise Power Manager
- iDRAC, CMC, OpenManage Enterprise, OpenManage Integration with Microsoft Windows Admin Center, OpenManage Integration with ServiceNow, and DPAT trial licenses

Server Power Consumption Reporting and Management

Mon, 16 Jan 2023 18:31:46 -0000
|Read Time: 0 minutes
Summary
Between customers’ sustainability initiatives to reduce carbon emissions, and demands to control energy consumption and costs, the ability to report, analyze and action server power usage data has become a key initiative. This DfD tech note explores the rich server power usage data available from Dell PowerEdge servers and the various methods to collect, report, analyze, and act upon it.
What is server power consumption?
A wide variety of server power information is offered by the iDRAC. The amount and frequency of information varies by iDRAC version and licensed features and the choice of optional tools and consoles.
One-to-one and one-to-many
There are multiple ways to view power consumption data from the iDRAC, depending on needs and preferences. One way is to open the web interface GUI. Another way is using scripts, either Racadm or Redfish, to retrieve the data. iDRAC can also send data to the OpenManage Enterprise Power Manager Plugin. OpenManage Enterprise can also forward this information to CloudIQ for PowerEdge. For those customers looking for the ultimate solution, iDRAC9 can stream these power statistics as telemetry data to analytics solutions such as Splunk or ELK Stack for real-time in-depth analysis.
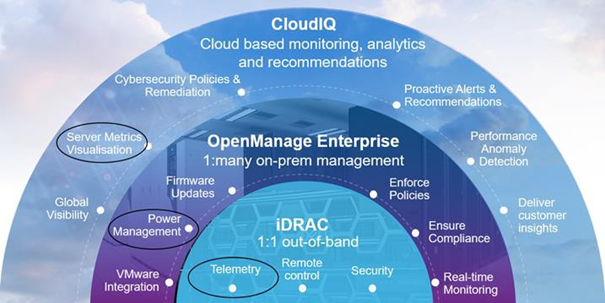
Figure 1. PowerEdge management stack, with power management and data reporting highlighted
PowerEdge server power data
Embedded with every Dell PowerEdge server, the integrated Dell Remote Access Controller (iDRAC) enables secure and remote server access for out-of-band and agent-free server management tasks. Features include BIOS configuration, OS deployment, firmware updates, health monitoring, and maintenance. One key set of data that iDRAC provides is power usage. IT admins have used iDRAC data to view and react to power issues for over 10 years. The iDRAC engineering teams have continued to expand the capabilities within the iDRAC UI as well as the information available to “one to many” consoles such as OpenManage Enterprise. iDRAC9 with Datacenter feature set enabled extends the solution even further with telemetry streaming.
iDRAC
iDRAC monitors the power consumption, processes, and reports continuously at the individual server level. The browser user interface displays the following power values:
- Power consumption warning and critical thresholds
- Cumulative power, peak power, and peak amperage values
- Power consumption over the last hour, last day, or last week
- Average, minimum, and maximum power consumption with historical peak values and peak timestamps
- Peak headroom and instantaneous headroom values (for rack and tower servers)
iDRAC9 provides a graphical view of these power metrics such as the power consumption example shown here.
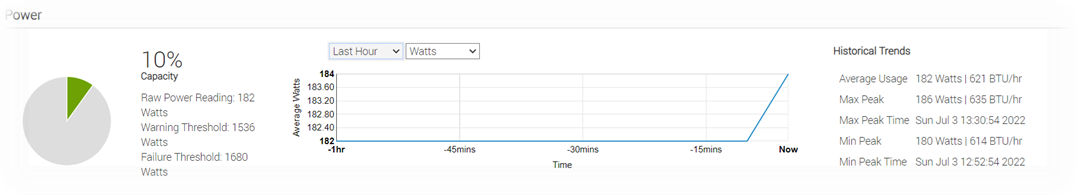
Figure 2. iDRAC9 GUI power consumption data
iDRAC9 connects to all critical server components and, in conjunction with the Datacenter license, can collect over 180 server metrics in near-real-time. These metrics include granular, time-stamped data for critical functions such as processor and memory utilization, network card, power, thermal, and more. iDRAC9 can stream this telemetry data in real time.
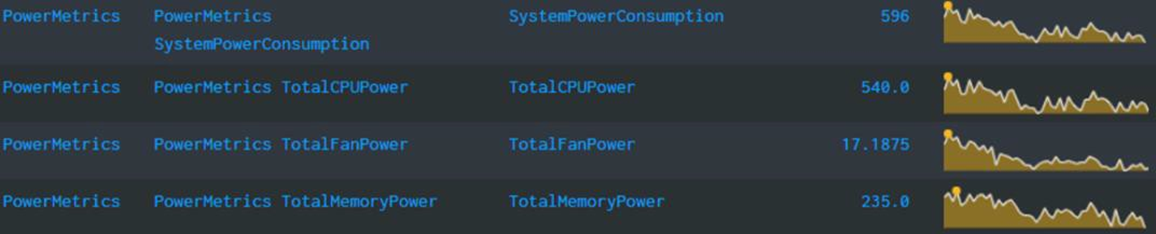
Figure 3. iDRAC power telemetry data collected by Splunk
Get Server Power – RACADM CLI Examples
The RACADM command-line provides a basic scriptable interface that enables you to retrieve server power either locally or remotely. In addition to the CLI interface, iDRAC also supports the Redfish RESTful API. Example Powershell and Python scripts that can be used to collect power data can be download from the Dell area in github.com. The RACADM CLI can be access from the following interfaces:
- Local - Supports running RACADM commands from the managed server's operating system (Linux/Windows). To run local RACADM commands, install the OpenManage DRAC Tools software on the managed server.
- SSH or Telnet (also known as Firmware RACADM) - Firmware RACADM is accessible by logging into iDRAC using SSH or Telnet.
- Remote - Supports running RACADM commands from a remote management station such as a laptop or desktop running Windows or Linux. To run remote RACADM commands, install the OpenManage DRAC Tools software on the management station.
Here are some examples using the remote iDRAC9 SSH CLI method, post authentication.
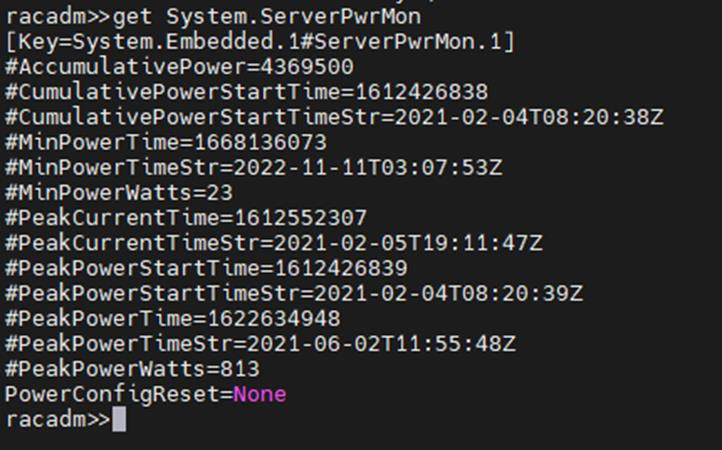
- Instantaneous server power usage:

- Server power stats:
OpenManage Enterprise Power Manager
The Power Manager Plugin for OpenManage Enterprise uses the power data securely collected from iDRACs to observe, alert, report, and, if required, place power caps on servers. For ease of management, servers can be logically grouped together, such as in a rack, a row, or in custom grouping, such as a workload. Using this data, customers can drive data center efficiency in several ways, such as by easily identifying idle servers for repurposing or retirement. Using built in reports or creating a custom report, customers can identify server racks not using their full available power capacity to deploy new hardware without needing additional power. Customers can mitigate risk by detecting when groups of servers are nearing their power capacity during specific timeframes. Using automated policies, customers can maximize power available to business-critical applications by reducing noncritical consumption by using scheduled or permanent power capping.
Important in today’s climate concerns are reports on carbon emissions based on server usage. Power Manager provides reports on the carbon emissions for individual servers as well as racks and custom groups of servers. This information can be used to identify areas of concern and to show progress in carbon emission reductions based on power policies, removal of idle servers, and other initiatives such as consolidation and refresh.
The power data is displayed by applets integrated into OpenManage Enterprise. (See examples in the following figure.) There are also several predefined reports built into the report library designed around power usage. Power Manager automates actions driven by specific power or thermal events, including running scripts, applying power caps, and forwarding alerts. Power Manager collects this power data and stores it for up to 365 days.
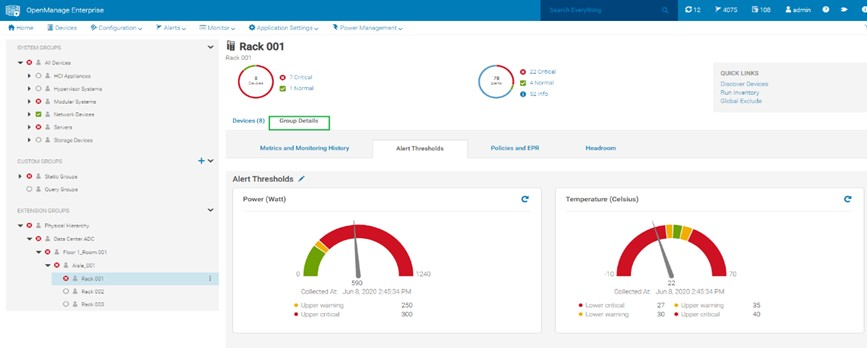
Figure 4. View of a rack group alert threshold graphic for power and thermal
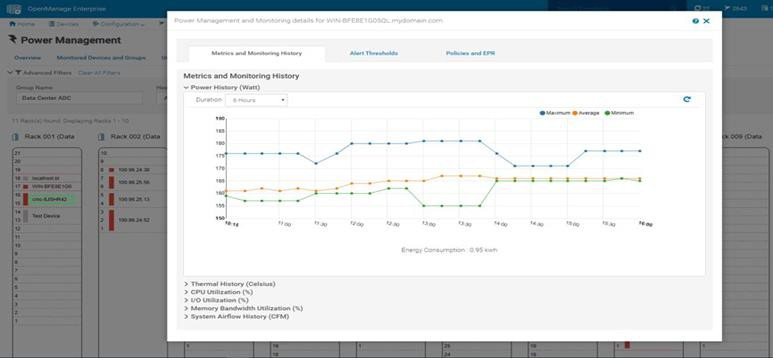 Figure 5. Rack view showing max/min/avg power for the last six hours
CloudIQ for PowerEdge – Reporting Server Power
Another method to visualize and report the power data is by CloudIQ. Utilizing the OpenManage Enterprise CloudIQ Plugin, customers can connect their PowerEdge servers to the Dell hosted CloudIQ secure portal. This is a cloud based software-as-a-service portal, hosted in the Dell data centers, that provides powerful analytic, health, and performance monitoring for servers. CloudIQ can consolidate multiple OpenManage Enterprise instances, providing a truly global view of an organization’s server estate. Within CloudIQ, power data can be graphed and reported on over time. These graphs can easily be exported or emailed as PDFs and the raw data exported as CSV for further reviews. In fact, in addition to collecting power metrics, CloudIQ can track and collect over 50 server metrics for users to review. CloudIQ also interfaces with other elements of Dell’s infrastructure, including storage and networking, giving customers the ability to correlate data, events, and trends across multiple technologies. CloudIQ is offered at no additional cost for all PowerEdge servers with ProSupport or higher contracts.
When power data is collected in CloudIQ, advanced AI algorithms process this data and automatically flag whether the server power usage behavior is outside normal parameters, based on historic data from that particular server.
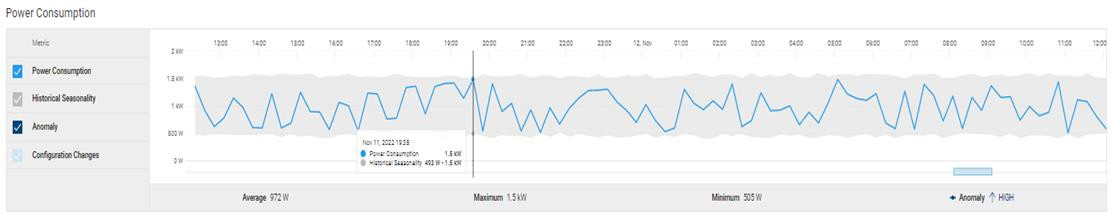
Fiure 6. individual server power data with historical seasonality – no anomaly
Multiple servers can be put onto the same graph, making it easy to identify any rogue behavior by individual servers.
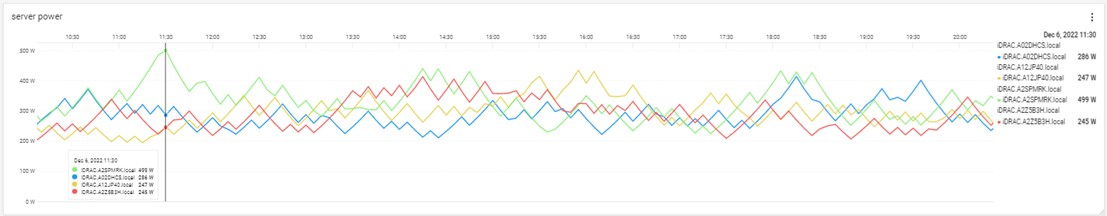
Figure 7. Multi server power usage report
The visualization of this data can be displayed from just hours to a whole year, with the ability to zoom in on a particular time.
Conclusion
Dell PowerEdge servers offer an extensive amount of data about power consumption by the advanced capabilities of the iDRAC. This power information is available on the iDRAC UI, as is telemetry information ready to be consumed by analytic solutions such as Splunk. This information is also accessible from the RACAMD CLI and RESTful API. Dell Technologies’ own one to many management solutions can also collect, collate, and report this information. Dell lets server admins select from a wide variety of tools and methodologies to meet the needs of their datacenter server power management requirements.
References
iDRAC
- Documentation, white papers and videos www.dell.com/support/idrac
- Transform datacenter analytics with iDRAC9 Telemetry Streaming
- iDRAC9 Telemetry Streaming Visualization with Splunk (a Tolly report)
- iDRAC Telemetry and Splunk Video Overview
- How to Integrate iDRAC9 Telemetry Data into the Splunk Platform
- Integrated Dell Remote Access Controller 9 - CLI Guide
OpenManage Enterprise Power Manager
- Documentation, white papers and videos Support for Power Manager
- Reduce Server Power Usage and Save Money with Power Manager
- Improve sustainability through energy insights (a Principled Technology study)
- Guide to OpenManage Enterprise Power Manager API
CloudIQ for PowerEdge
- Documentation, white papers and videos Support for CloudIQ For PowerEdge
- CloudIQ Provides Data Driven Server Management Decisions
GitHub for Dell Technologies, including iDRAC and OME/ Power Manager examples Dell Technologies · GitHub
API guide and landing page for developers including iDRAC & OME/ Power Manager https://developer.dell.com/