Home > Networking Solutions > Enterprise/Data Center Networking Solutions > Enterprise SONiC Networking Solutions > Guides > Enterprise SONiC Distribution by Dell Technologies - Lifecycle Management > sFlow
sFlow
-
sFlow is a standard-based sampling technology that is embedded within switches and routers that monitor network traffic. sFlow provides traffic monitoring for high-speed networks with many switches and routers. There are two types of sampling:
sFlow monitoring consists of a sFlow agent that is embedded in the device and a sFlow collector. The sFlow agent resides anywhere within the path of the packet. The agent combines the flow samples and interface counters into sFlow datagrams and forwards them to the sFlow collector at regular intervals. The datagrams include information about the packet header, ingress and egress interfaces, sampling parameters, and interface counters. Application-specific integrated circuits, or ASICs, handle packet sampling. The sFlow collector analyses the datagrams that are received from the different devices and produce a network-wide view of the traffic flows.
Advantages of sFlow
Networking monitoring on PowerSwitches running Enterprise SONiC Distribution by Dell Technologies NOS is possible using sFlow. The benefits of using sFlow include:
sFlow operations
The following operations can be performed using sFlow:
- Enable sFlow
- Disable sFlow
- Configure polling interval
- Disable polling interval
- Add a collector
- Add a collector with a port number
- Delete a collector
- Add agent-id information
- Disable sFlow agent
- Enable sFlow on the interface
- Disable sFlow on the interface
- Configure sampling rate on the interface
- Disable sampling rate on the interface
sFlow use case and example
sFlow provides a convenient way of monitoring traffic using flow-based sampling technology. Some of the use cases for sFlow include network security monitoring in large enterprise data centers, monitoring traffic for different tenants in a logical network, monitoring traffic on interfaces of interest, and Quality of Service (QoS).
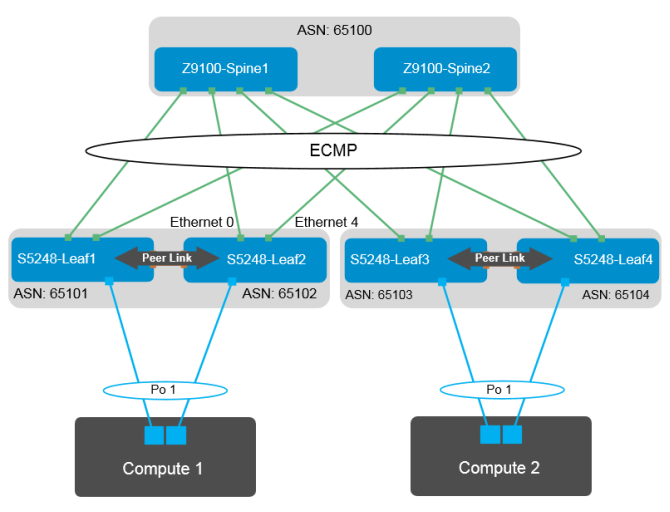
Consider the use case example of monitoring traffic on switch S5248-Leaf2 on the ports that are connected to the Z9100-Spine1 switch, and the Z9100-Spine2 switch, as shown in Figure 18. The Ethernet 0 interface on the S5248-Leaf2 switch connects to the Z9100-Spine1 switch, and Ethernet 4 interface connects to the Z9100-Spine2 switch.
Figure 18: Leaf-spine topology use case for sFlow

sFlow allows the sampled packet to be analyzed using the sFlow collector. Other functions include the polling interval and the sampling rate. All these details can be configured using the CLI to enable and monitor the sFlow packet samples. Configure sFlow globally or on individual interfaces on a SONiC switch.
In this example, the collector IP address is 100.67.204.144/24. The broad steps include enabling sFlow for the interface, indicating the collector IP address (port number can also be mentioned optionally), defining the sFlow agent-id, and optionally modifying the sampling rate and polling intervals from the default values.
The polling interval is the time in seconds when traffic samples or counters are collected. The interval range is from 5 to 300, and the default is 20. Enter 0 to disable sFlow traffic polling.
Enable sFlow for the interfaces
configure terminal
interface Ethernet 0
sflow enable
exit
interface Ethernet 4
sflow enable
exitDefine sFlow agent-id
sflow collector collector_1 100.67.204.144
Define polling interval
sflow polling-interval 44
Verify sFlow
Validate and verify the configurations for sFlow using the following validation examples:
sonic # show sflow
---------------------------------------------------------
Global sFlow Information
---------------------------------------------------------
admin state: up
polling-interval: 44
agent-id: default
configured collectors: 1
collector_1 100.67.204.144 6343
sonic# show sflow interface
-----------------------------------------------------------
sFlow interface configurations
Interface Admin State Sampling Rate
Ethernet0 up 10000
Ethernet4 up 10000Disable sFlow
To disable the sFlow configuration later, run the following command in the CLI:
configure terminal
interface Ethernet 0
no sflow enable
exit
interface Ethernet 4
no sflow enable
exit
