Home > Integrated Products > VxRail > White Papers > Elastic Stack on Dell EMC VxRail > Kibana
Kibana
-
Kibana is an open-source, browser-based UI that can be used to search, analyze, and visualize data stored in Elasticsearch indices. It contains several different analytic applications, such as Graph, Machine Learning, Metrics, and Logs, as well as configuration management and administration capabilities for the Elastic Stack. Kibana visualizations include histograms, line graphs, pie charts, sunbursts, and more. You can also design your own custom visualizations to suit your needs and all the visualizations leverage the capabilities of Elasticsearch.
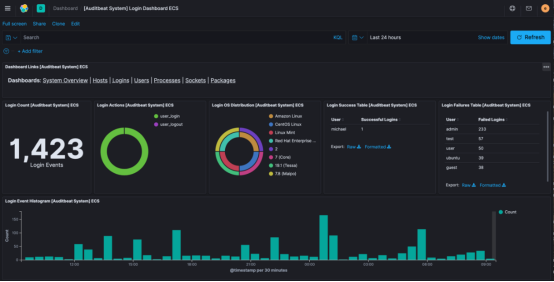
A sample Kibana dashboard is shown here:

Figure 5. Sample Kibana dashboard
