Home > Integrated Products > XC Family > Guides > Best Practices Guide—Deploying Oracle 12c RAC Database on Dell EMC XC Series All-Flash > Performance monitoring
Performance monitoring
-
Introduction
It is important to monitor the performance of various infrastructure components such as CVM, Oracle VM, CPU, memory, storage, and the network. The following subsections describe the different ways to find this information. One or multiple methods can be combined to provide a complete picture of the infrastructure performance.
Nutanix Prism
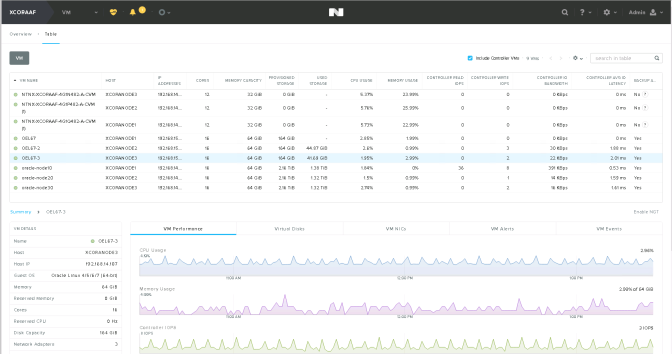
Prism is a rich graphical HTML-based management console for configuring, managing, and monitoring all components within the infrastructure. It provides excellent performance monitoring and analytic capabilities. It also gathers certain data from the VMware vSphere and display all relevant information through a single Prism interface. For example, to see the virtual machines, including CVMs and performance data, click VM > Table > Check Include Controller VMs.

The Analysis section in Prism allows creating custom charts for almost every aspect of Nutanix platform and some VMware vSphere metrics, providing invaluable insight into the environment. Customers can easily see the current and historical trends by sliding the time scale at the top of the screen. Charts can be added from the existing charts in other pages or can be easily created using a simple popup where components are selected. Here are some of the useful charts:
- Cluster hypervisor IOPS
- Cluster hypervisor IO latency
- Cluster IO bandwidth
- Cluster read/write IOPS
- Controller IOPS
- Controller latency
- Controller bandwidth
- Container IOPS
- Container latency
- Container bandwidth
- Disk IOPS
- Cluster CPU/memory utilization
- Content cache utilization
vSphere client
While Prism can see deep into the distributed storage platform, VMware vSphere provides extensive information on the hypervisor and the VMs. Since CVMs are just other virtual machines managed by vSphere, many resource statistics can be obtained through the regular vSphere client. To view this information, click vSphere Web Client > Physical node > VM > Monitor tab > Performance.

CVM CLI
The other option to obtain the CVM performance data is to connect directly to each CVM through ssh and run the non-graphical command-line utilities:
- ssh to the individual CVM IP addresses and log in with the Nutanix administration account (typically nutanix).
- Run the top utility to show real-time system resources such as processor, memory, and swap.
- Run the free utility to show real-time memory and swap consumption.
- Run additional Linux performance utilities as desired, such as vmstat, mpstat, and iostat.
The downside of the CLI is that the utilities offer only real-time information. To see historical data and trends, use vSphere client or Prism.
ESX/ESXi CLI
To see performance of a specific ESX host, connect directly to the ESX host and run the esxtop command utility which provides real-time resource utilization:
- ssh to the ESX host.
- Log in with the administrator account.
- Run the esxtop command.
The information pertains only to that specific host and does not include any cluster-wide information. esxtop breaks down the physical CPU utilization which can be very useful for troubleshooting performance issues.
Oracle EM Express
Oracle provides a free web-based tool, Enterprise Manager Database Express (EM Express), for managing Oracle Database 12c. EM Express is included with the database and does not require any separate middle-tier application layer so it can be run directly on the database VM.
EM Express offers a friendly web UI. Under the performance hub, customers can find performance data collected by the database in real-time or from a given period of time in the past. Some useful performance data includes:
