


PowerFlex: CloudIQ Enhancements
Thu, 16 Nov 2023 22:07:06 -0000
|Read Time: 0 minutes
Have you checked out the All Features and Updates dialog in CloudIQ recently? If not, then let’s take a look together!
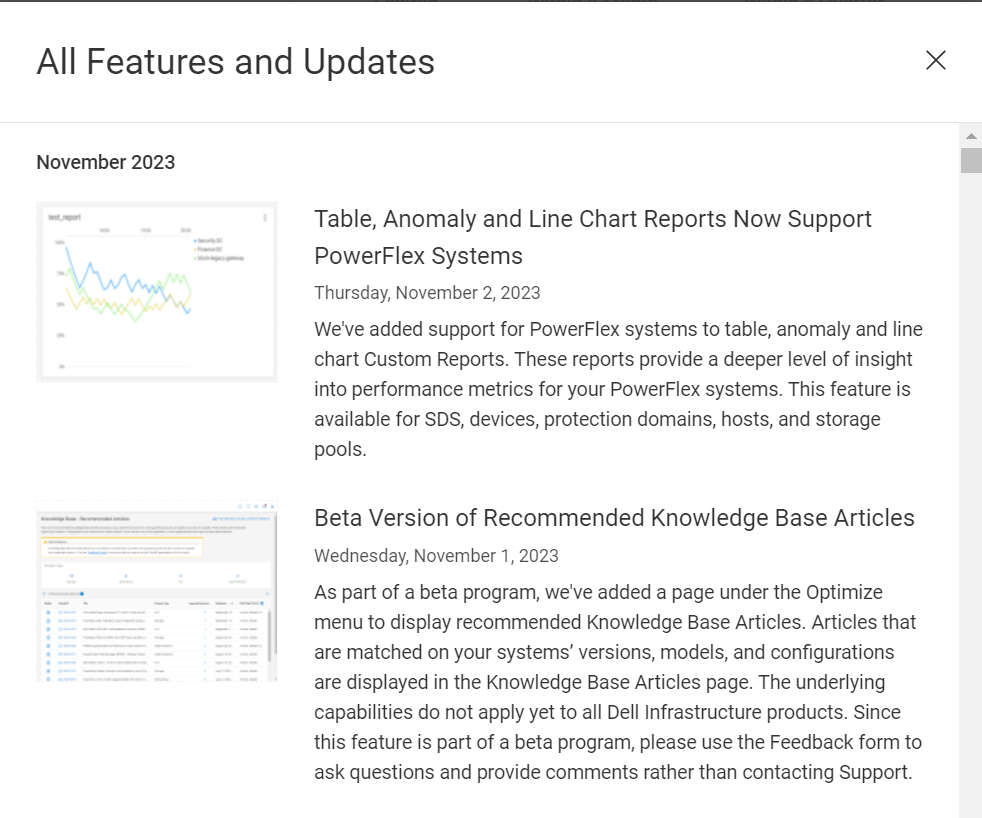
Figure 1. All Features and Updates dialog in CloudIQ
The first enhancement happened early this year with the addition of PowerFlex alerts. The alerts can be viewed through the System Alerts tile on the Home page, shown in figure 2, or by selecting Alerts under the Monitor menu. The System Alerts tile provides an alert count by severity level for all systems monitored by CloudIQ. Selecting the severity icon in the System Alerts tile redirects you to the Alerts page with a filter applied based on the selected severity.
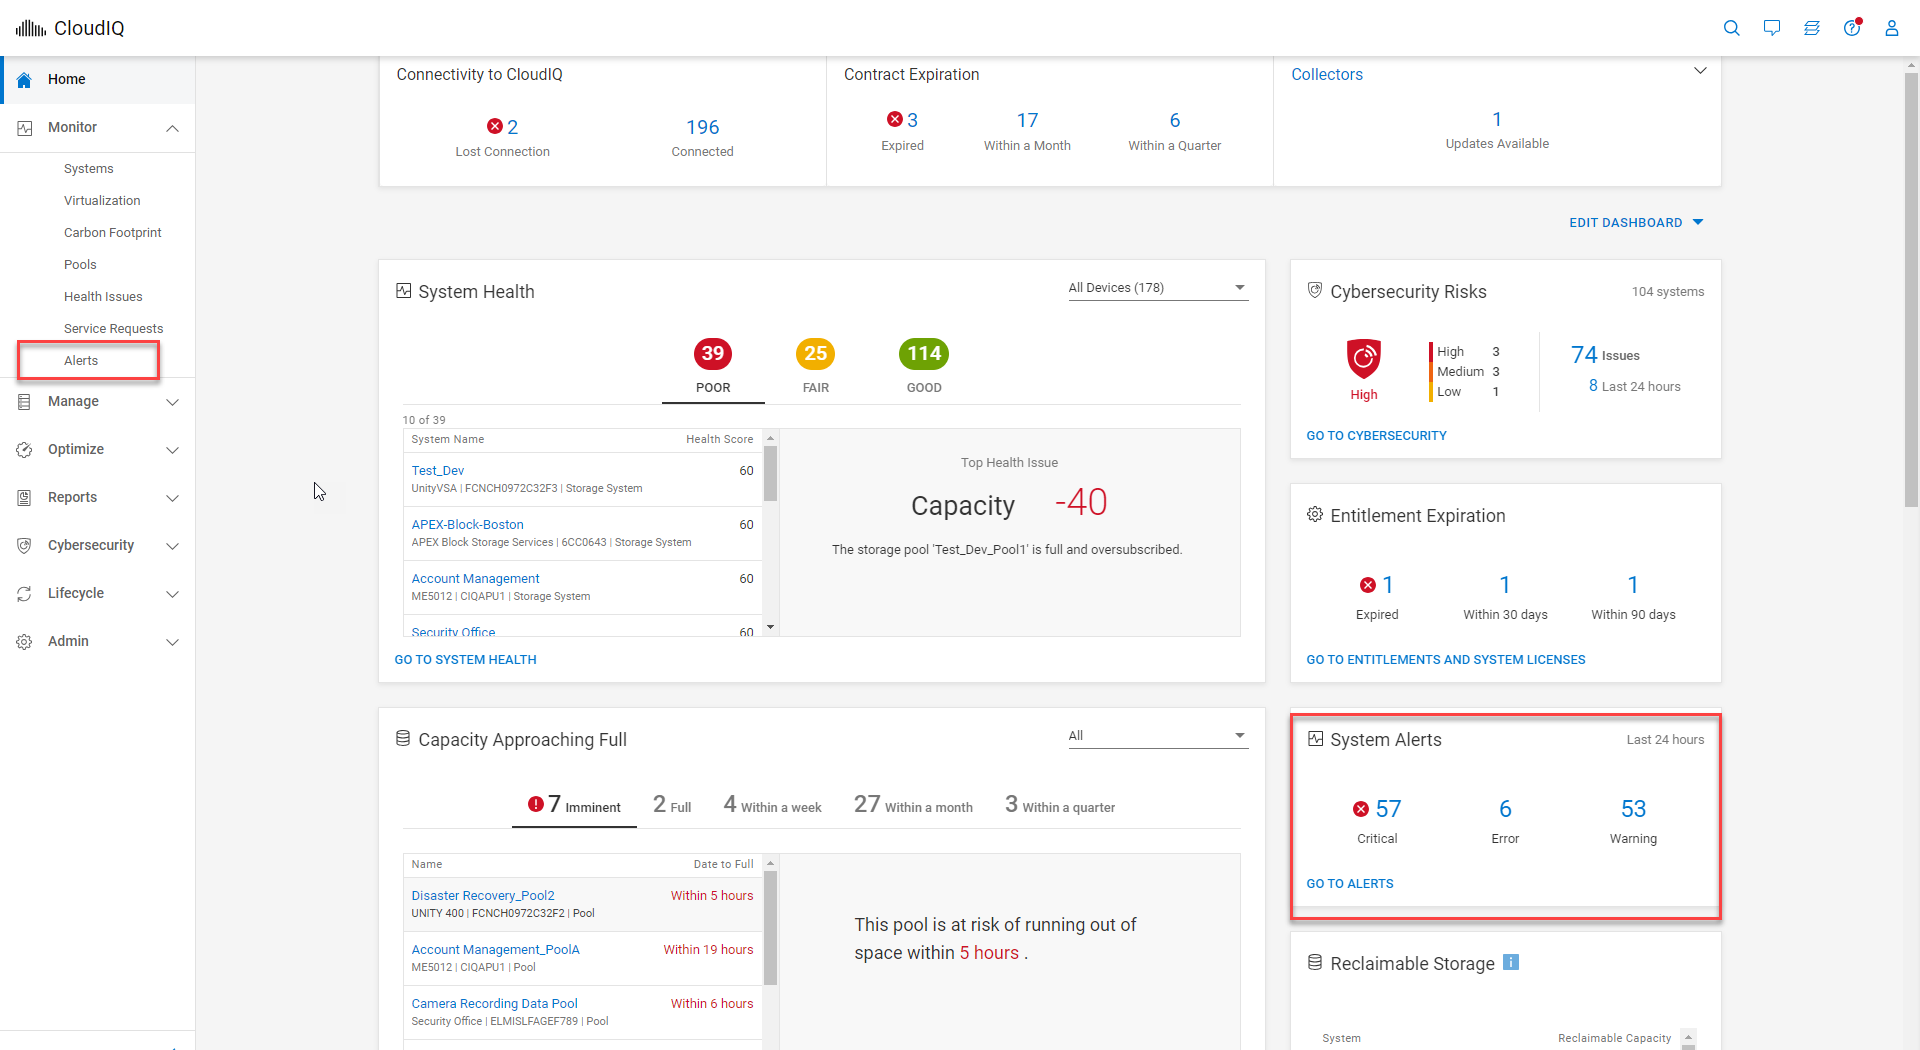
Figure 2. System Alerts tile within CloudIQ Home page
Once on the Alerts page, you can apply additional filters. The Alerts page has a simple table layout and displays information such as severity, system name, and model alert description, as well as the date and time when the alert occurred. Details of an alert can be viewed by selecting the details icon, as highlighted in figure 3.
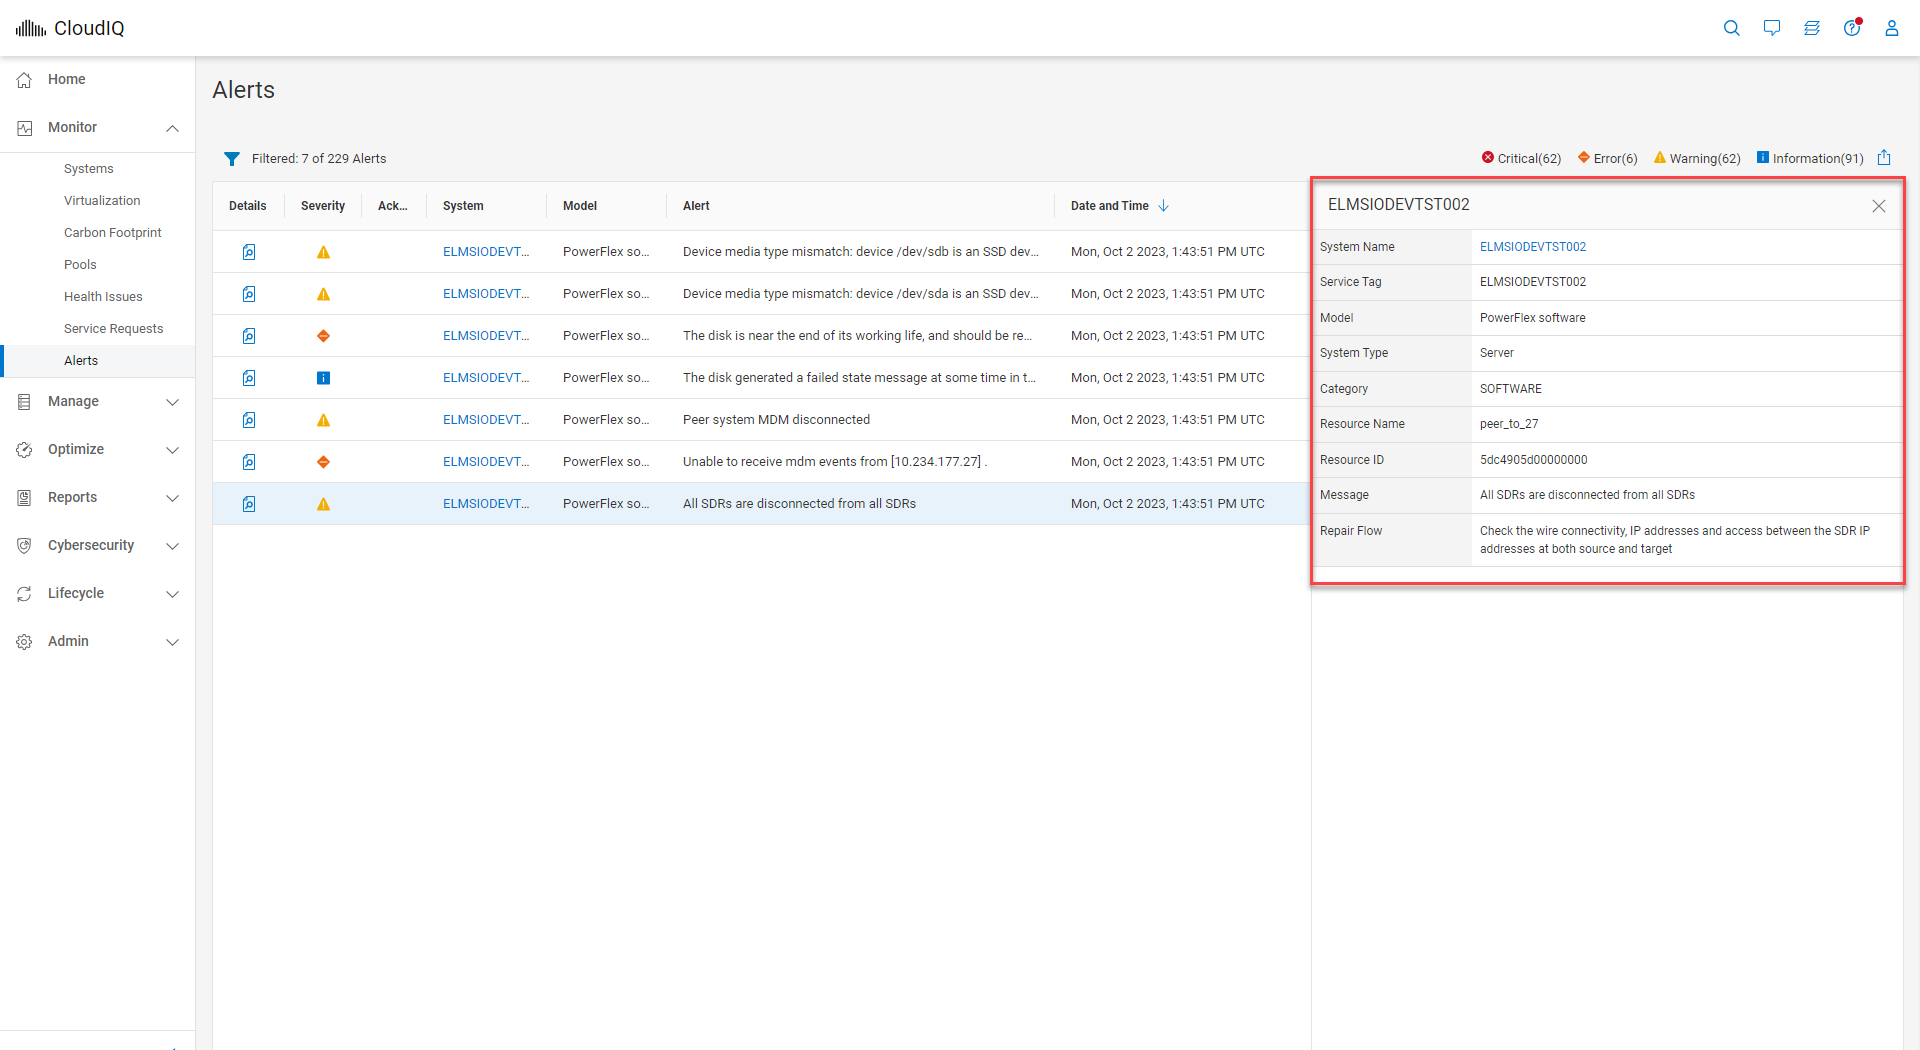
Figure 3. Details expanded for CloudIQ alert
In August, the PowerFlex/CloudIQ engineering team was busy releasing a bunch of exciting updates.
CloudIQ now supports Secure Connect Gateways (SCG) for PowerFlex systems. You can view the SCG information at a system level by visiting the PowerFlex system details page and clicking the GATEWAYS tab, highlighted in figure 3. The GATEWAYS tab consists of the gateway serial number, site information, location, gateway version, connectivity status, and heartbeat status.
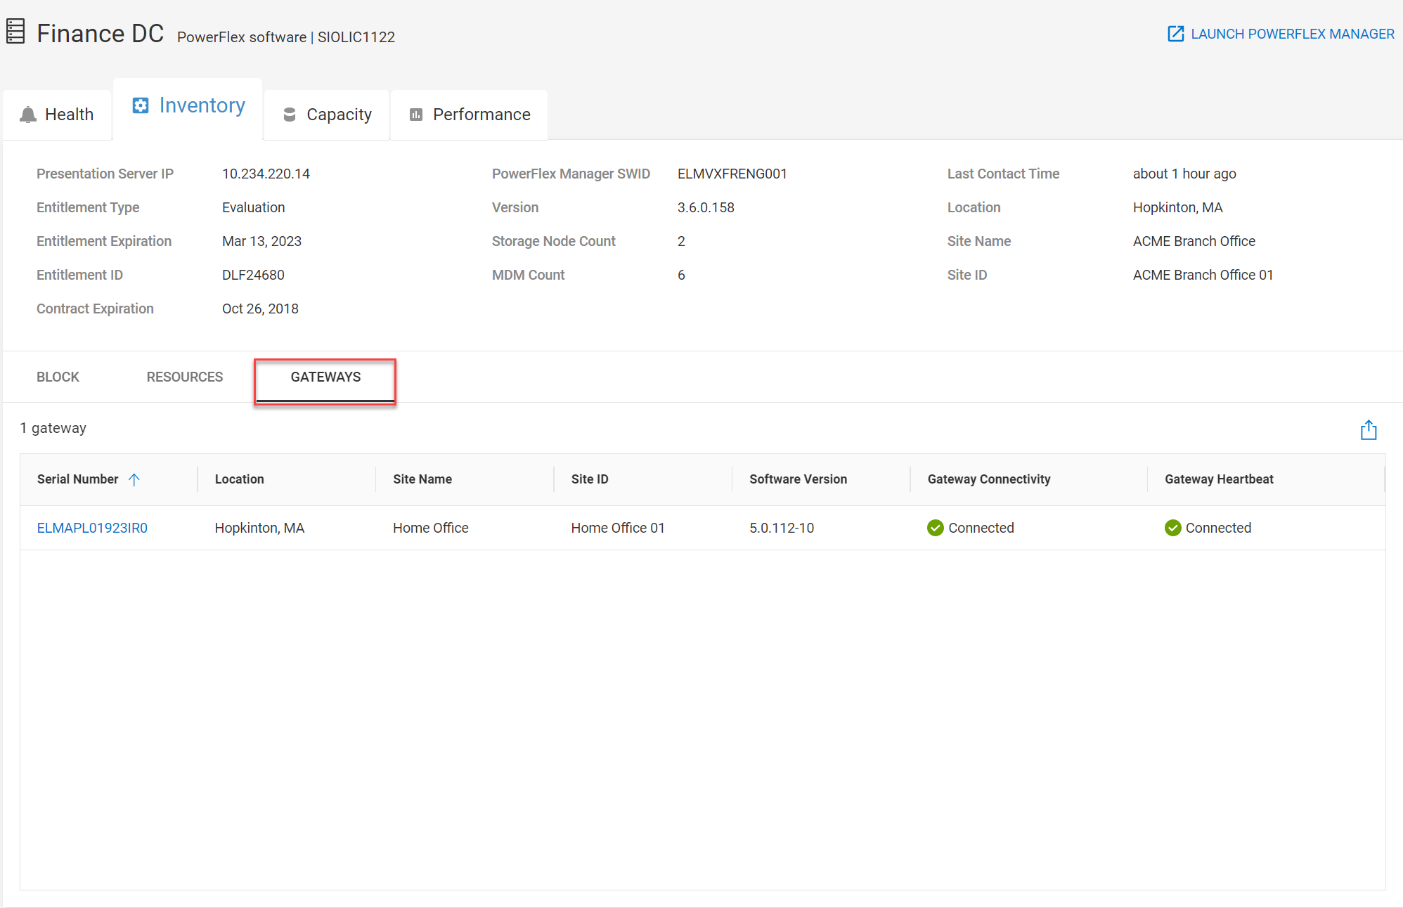
Figure 4. GATEWAYS tab for Finance DC PowerFlex system
The SCG serial number links to the SCG details page shown in figure 5. All systems connected to the specific SCG are listed on the SCG details page. From here, you can launch the SCG UI by clicking the link at the upper right corner of the page, providing a seamless workflow when working with the gateway from CloudIQ.
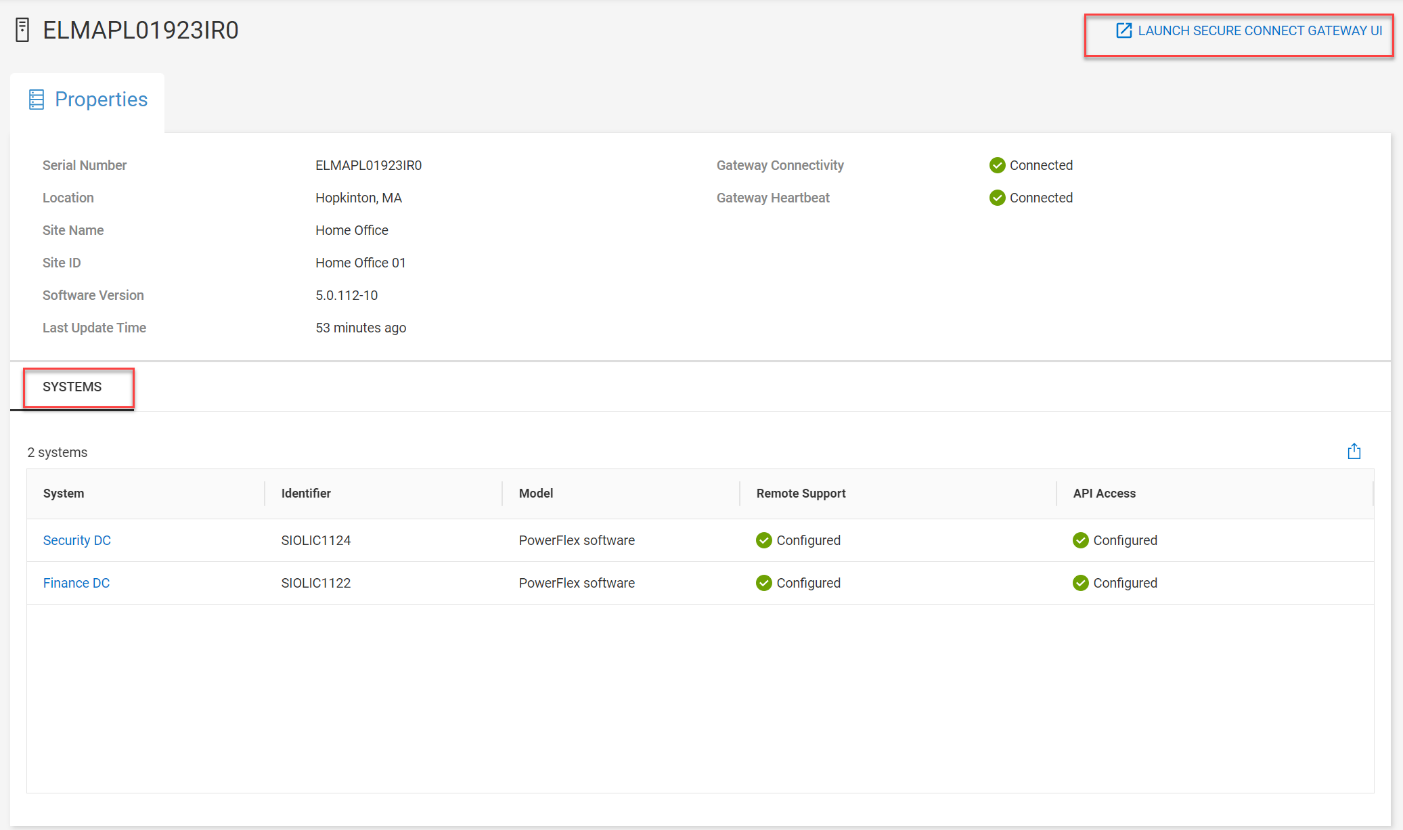
Figure 5. SCG details page highlighting connected systems and the SCG UI launch
A Gateway column was added to the Admin>Connectivity page. The most recently active gateway for the PowerFlex system is listed in this column and contains a link to the gateway details page.
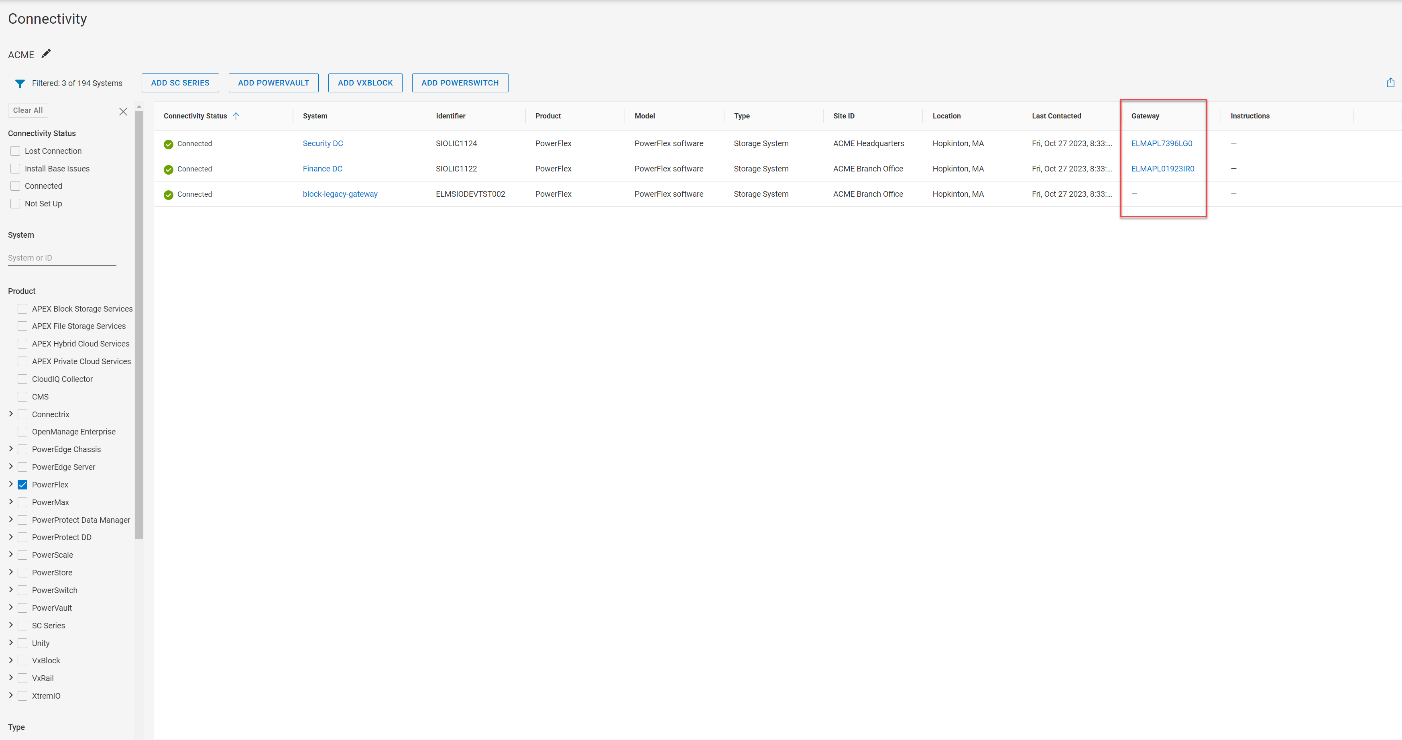
Figure 6. Gateway column on the Connectivity page
The next update is the Entitlements and System Licenses page, which you can find in the Admin section under Licenses. Here, you can check on the entitlements and licenses for all your PowerFlex systems. For more on this update, refer to the blog, Managing Dell PowerFlex Licensing and Being Way Less Sad.
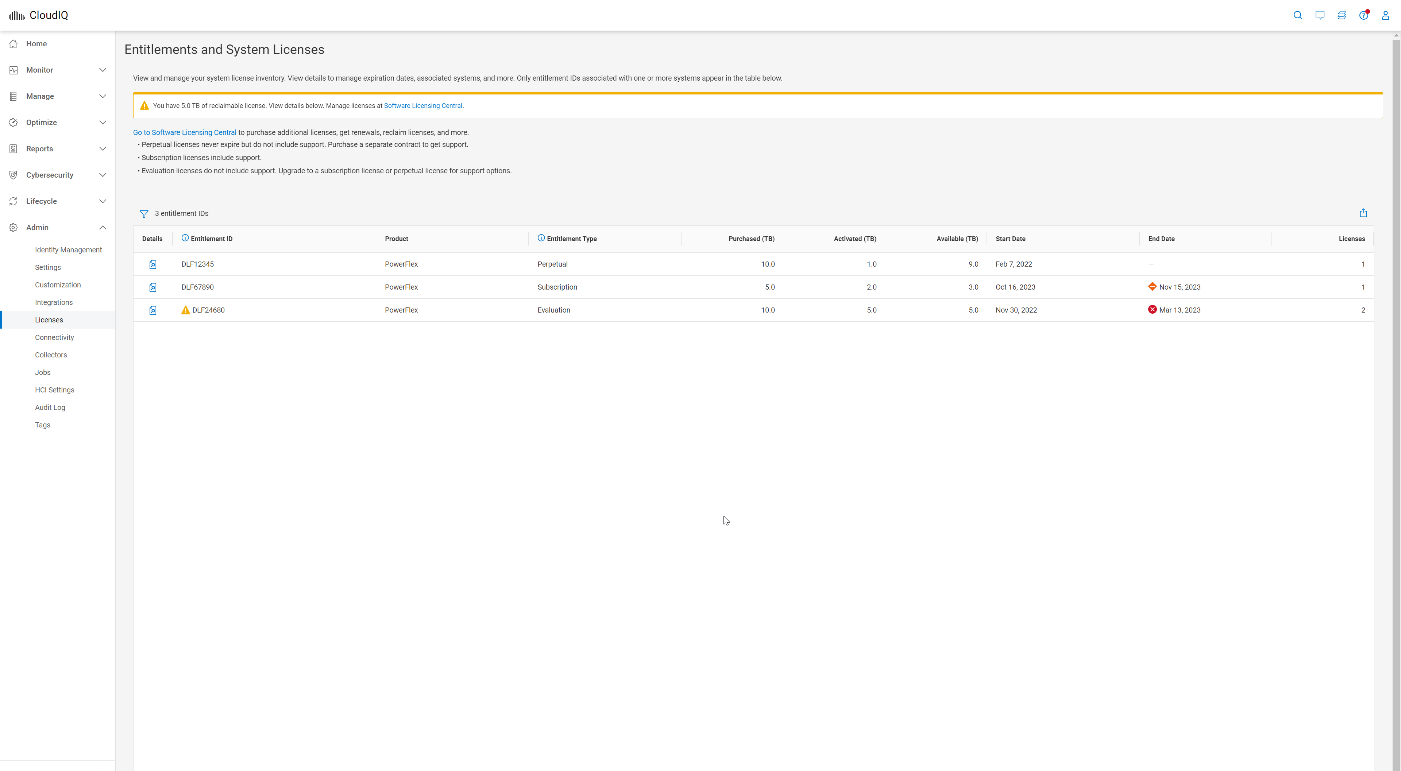
Figure 7. Entitlements and System Licenses page
A new Entitlements tile is now available on the CloudIQ Home page, providing a summary of entitlement status. The Entitlements tile lets you quickly view the number of PowerFlex systems with entitlements and licenses that are expired, expiring withing 30 days, and expiring within 90 days.
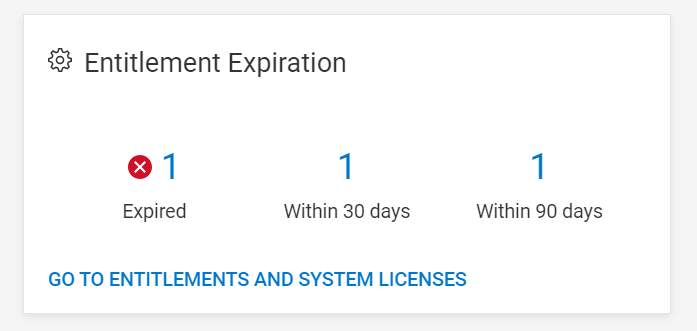
Figure 8. Entitlement Expiration tile on CloudIQ Home page
Another location for entitlement and contract status is on the PowerFlex Systems tiles. An entitlement that is in good standing is marked with a green checkmark, soon to expire with a yellow icon, and expired with a red “x.”
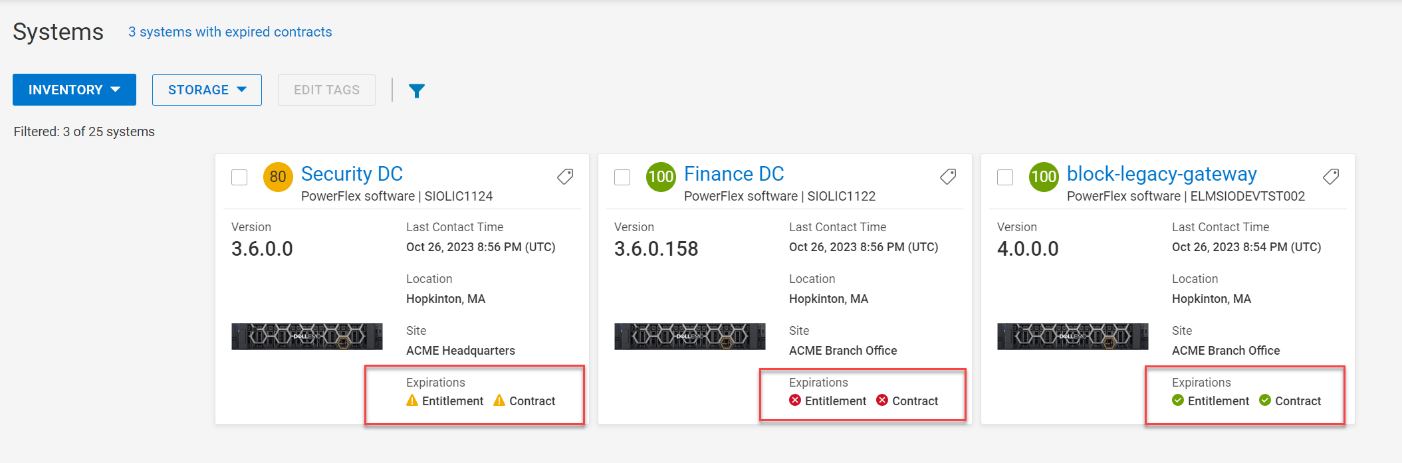
Figure 9. Three entitlement and contract statuses in PowerFlex Systems tile
MDM cluster information was added to CloudIQ in July of this year. To view the MDM information, go to the system details page for the PowerFlex system and select the RESOURCES tab, shown in figure 10. You can view a list of the MDMs, MDM role, ID, management IP addresses, and software version.
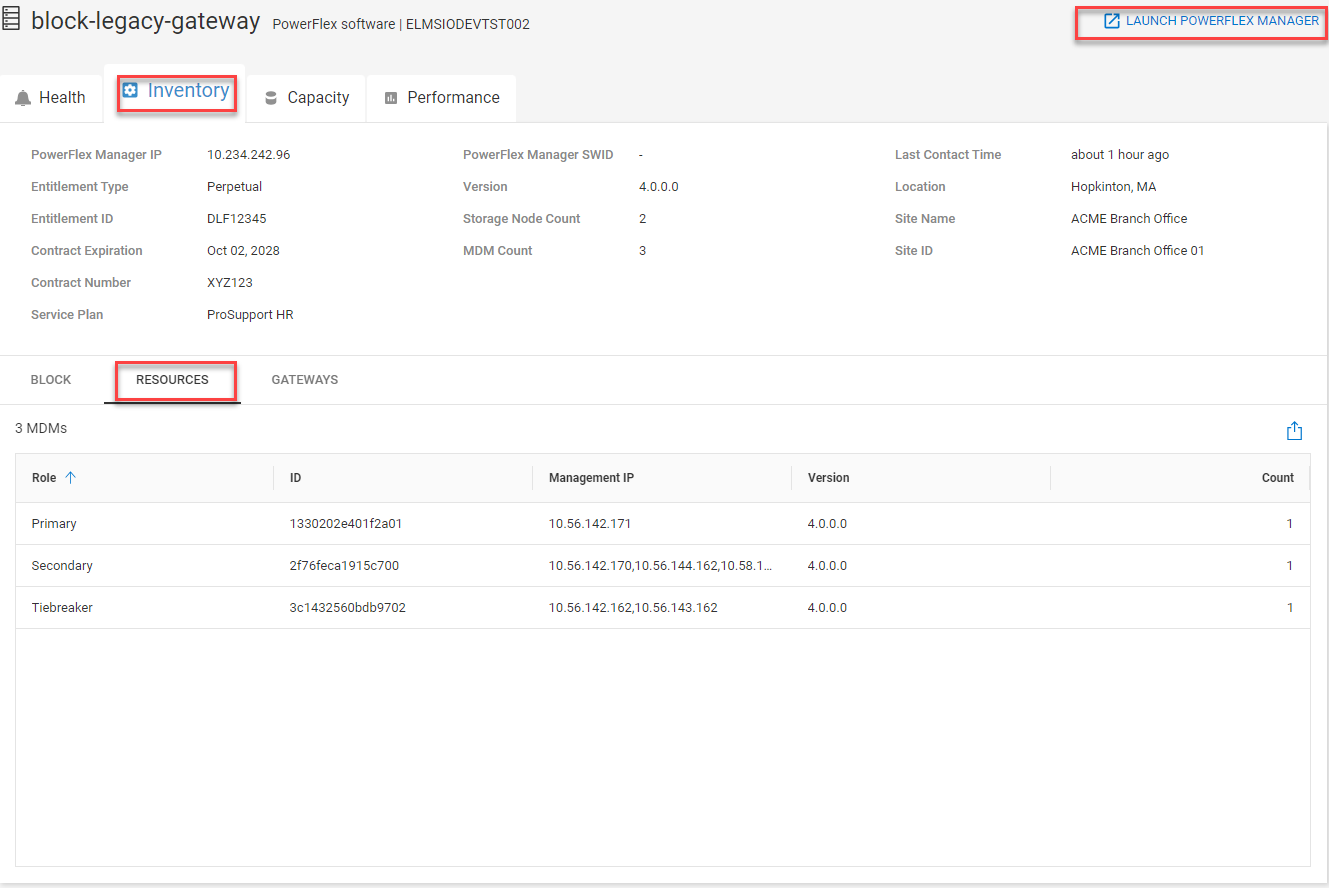
Figure 10. PowerFlex system details page highlighting the RESOURCES tab under Inventory and the PowerFlex Manager launch
Another addition to the system details page is a link to PowerFlex Manager, making it convenient to launch the PowerFlex Manager UI for the specified system. A BLOCK tab provides details on PowerFlex components, including protection domains, fault sets, SDSs, devices, storage pools, volumes, and hosts. The views may feel familiar to you because they are based on the Block menu in PowerFlex Manager.
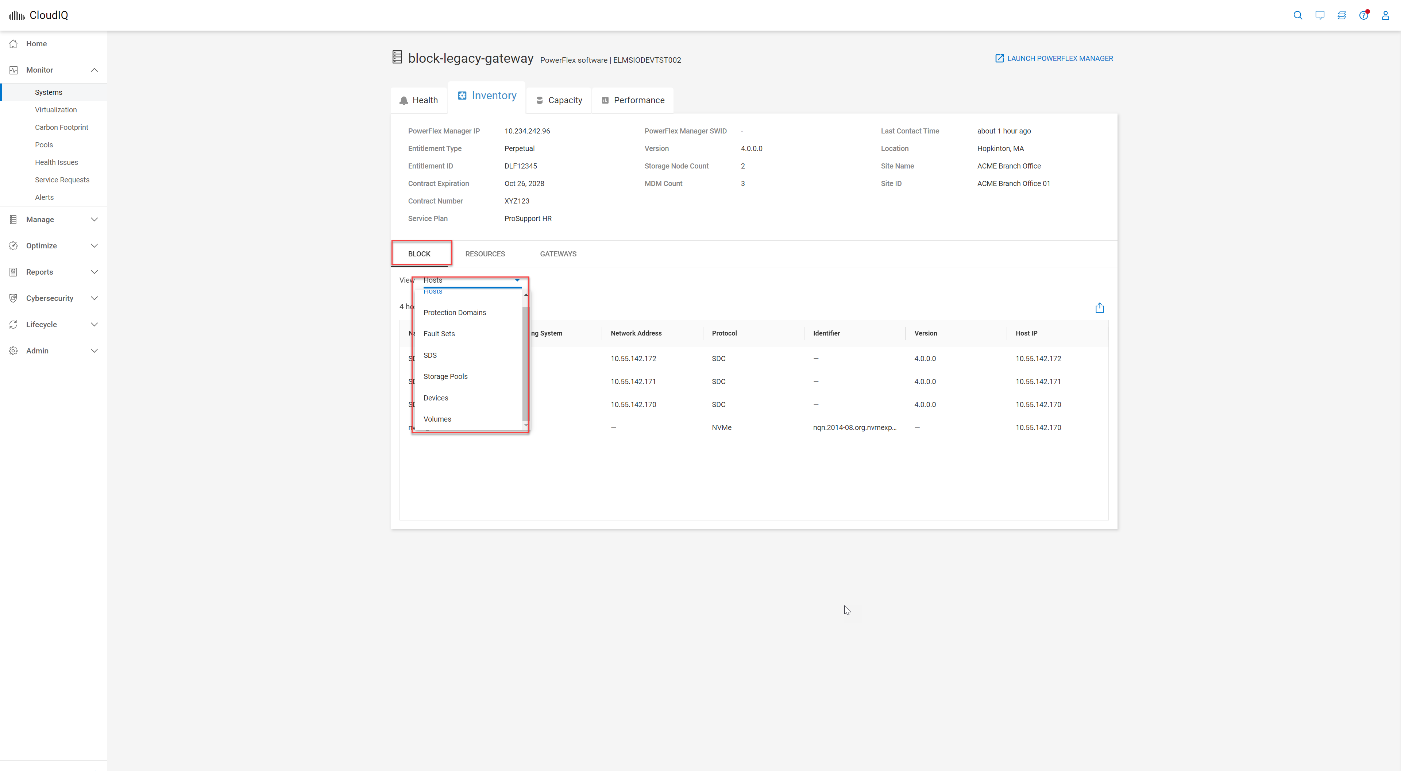
Figure 11. BLOCK tab within PowerFlex system details page
Planning on adopting APEX Block Storage for Public Cloud as part of your Multicloud strategy? CloudIQ has you covered on-prem and in the cloud.
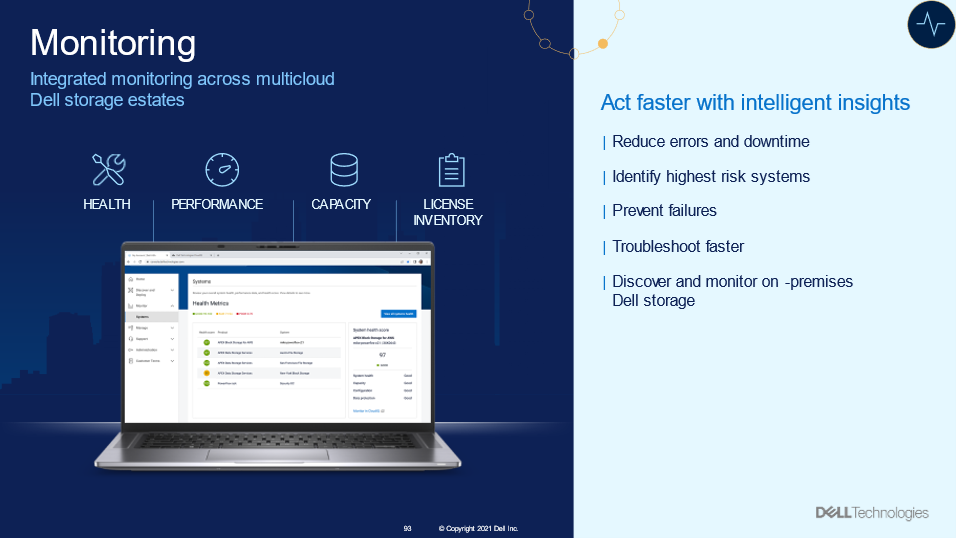
Figure 12. CloudIQ Monitoring overview
Onboarding your APEX Block Storage for Public Cloud into CloudIQ brings visibility into the cloud infrastructure.
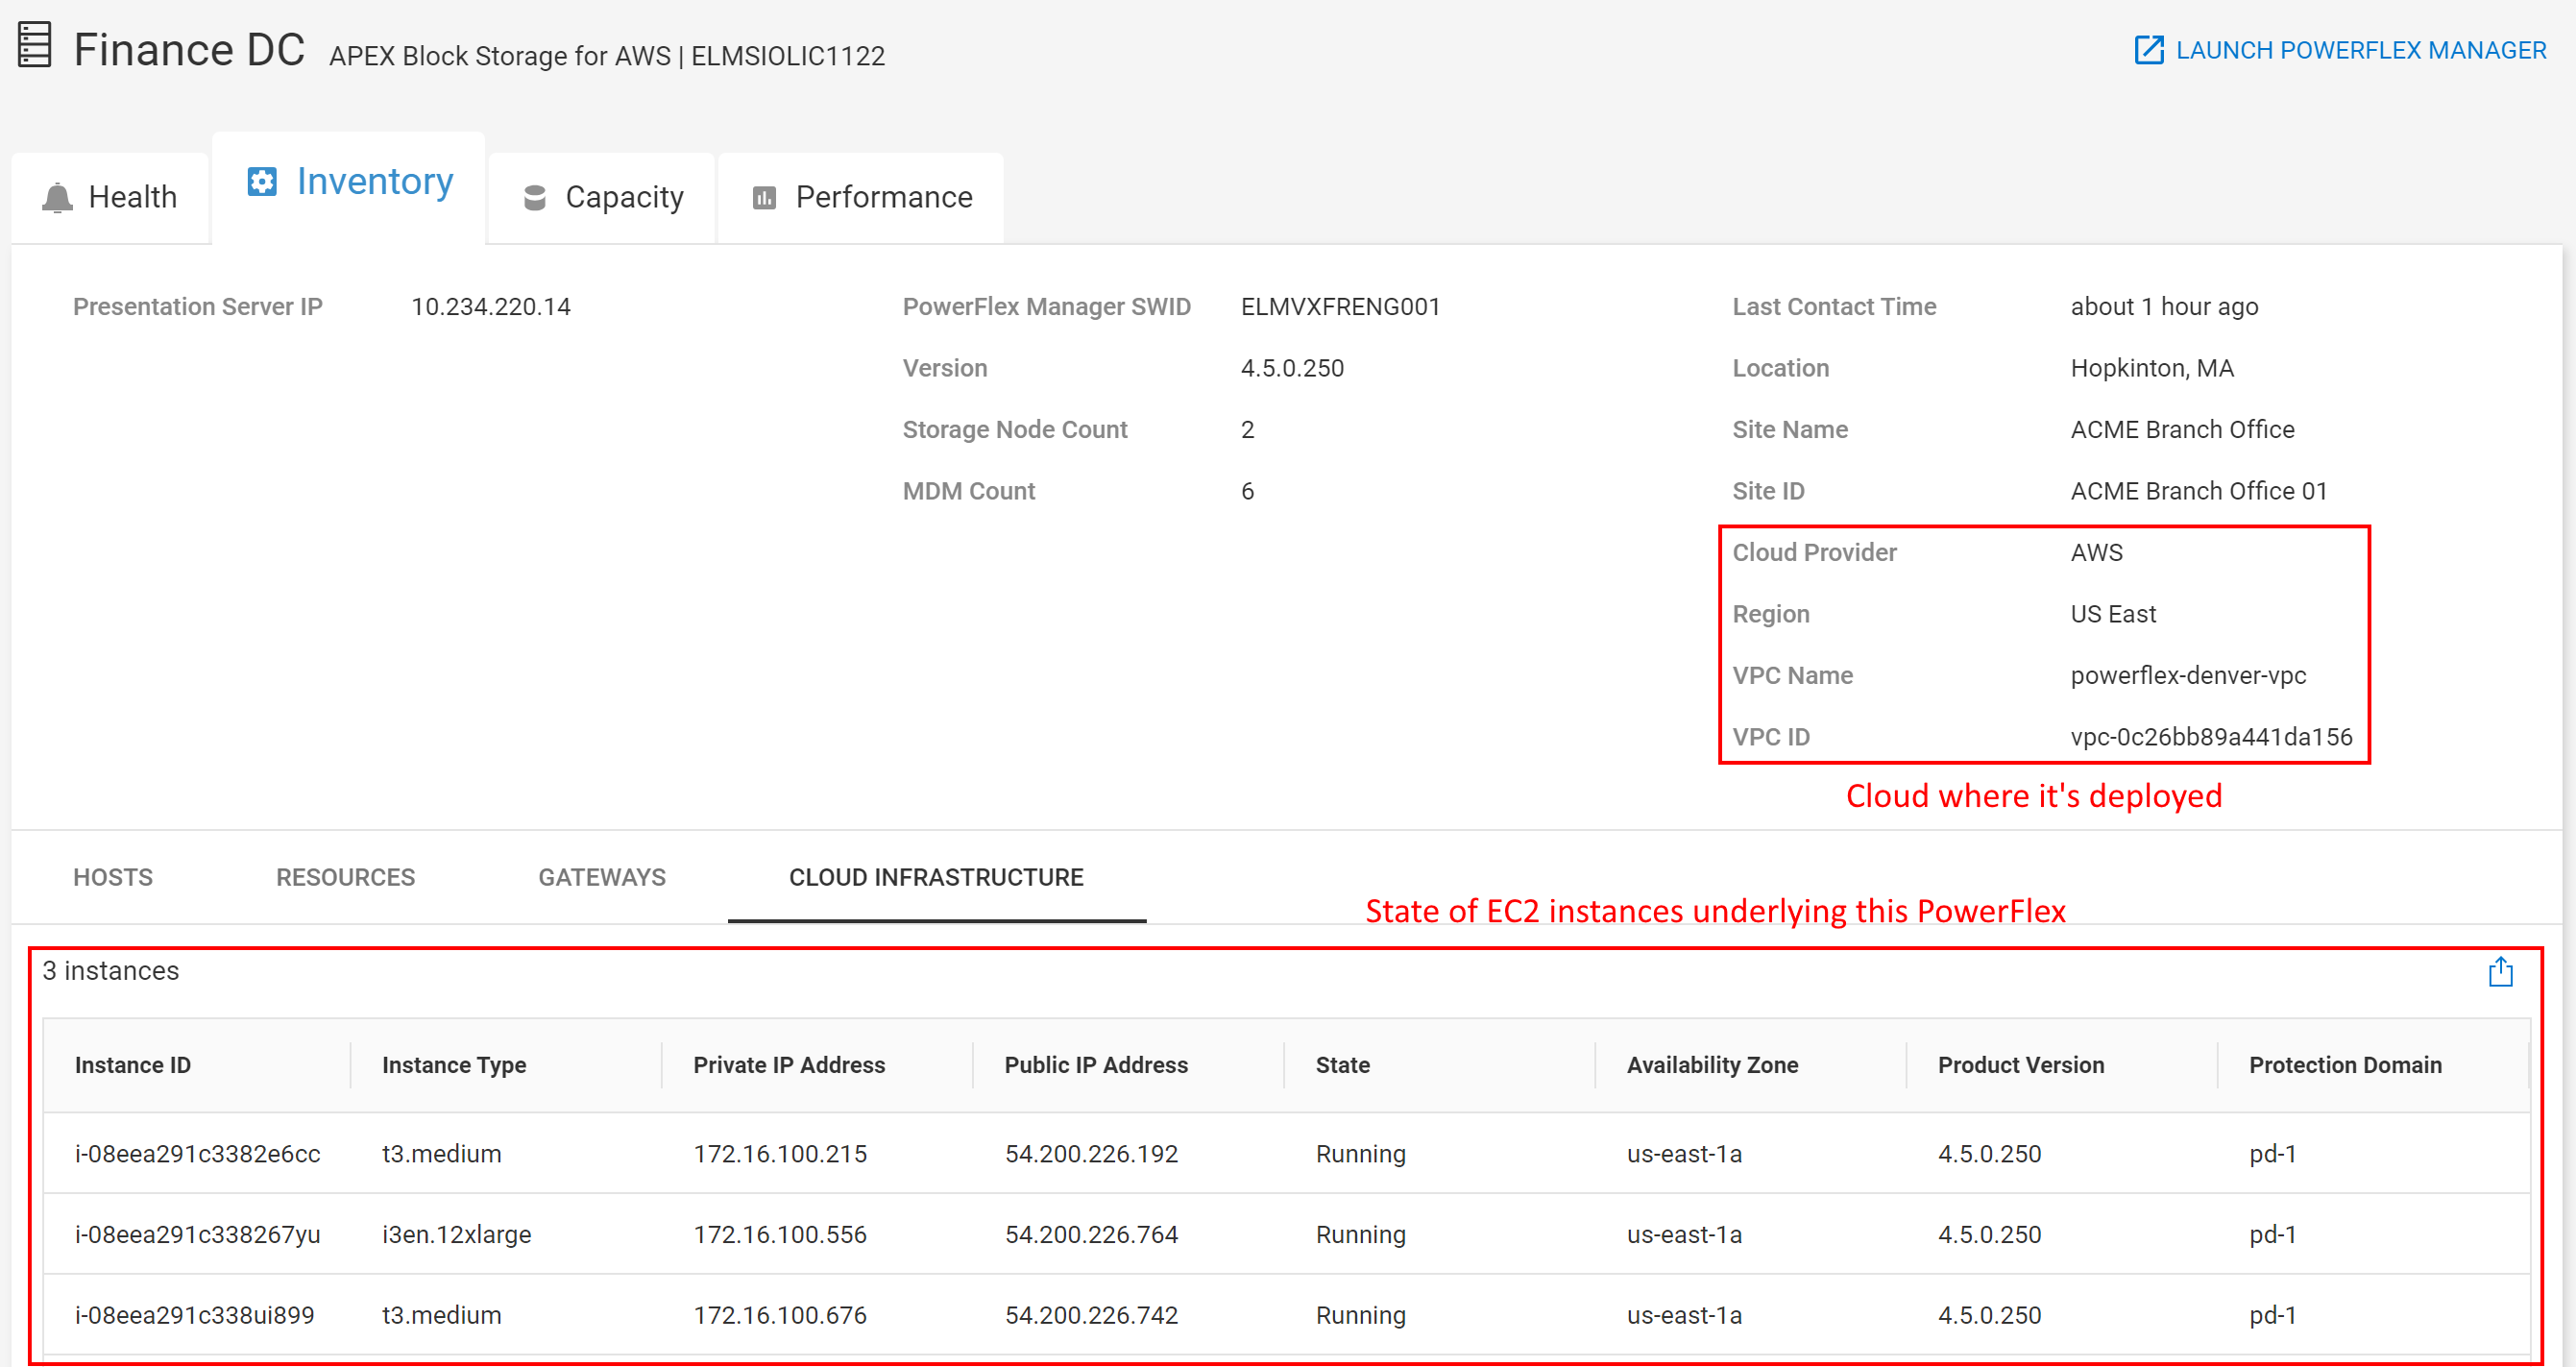
Figure 13. Inventory page for APEX Block Storage for AWS
The last enhancement that I will highlight is the addition of PowerFlex in custom reports. This update provides three report types, including anomaly charts, line charts, and table reports.
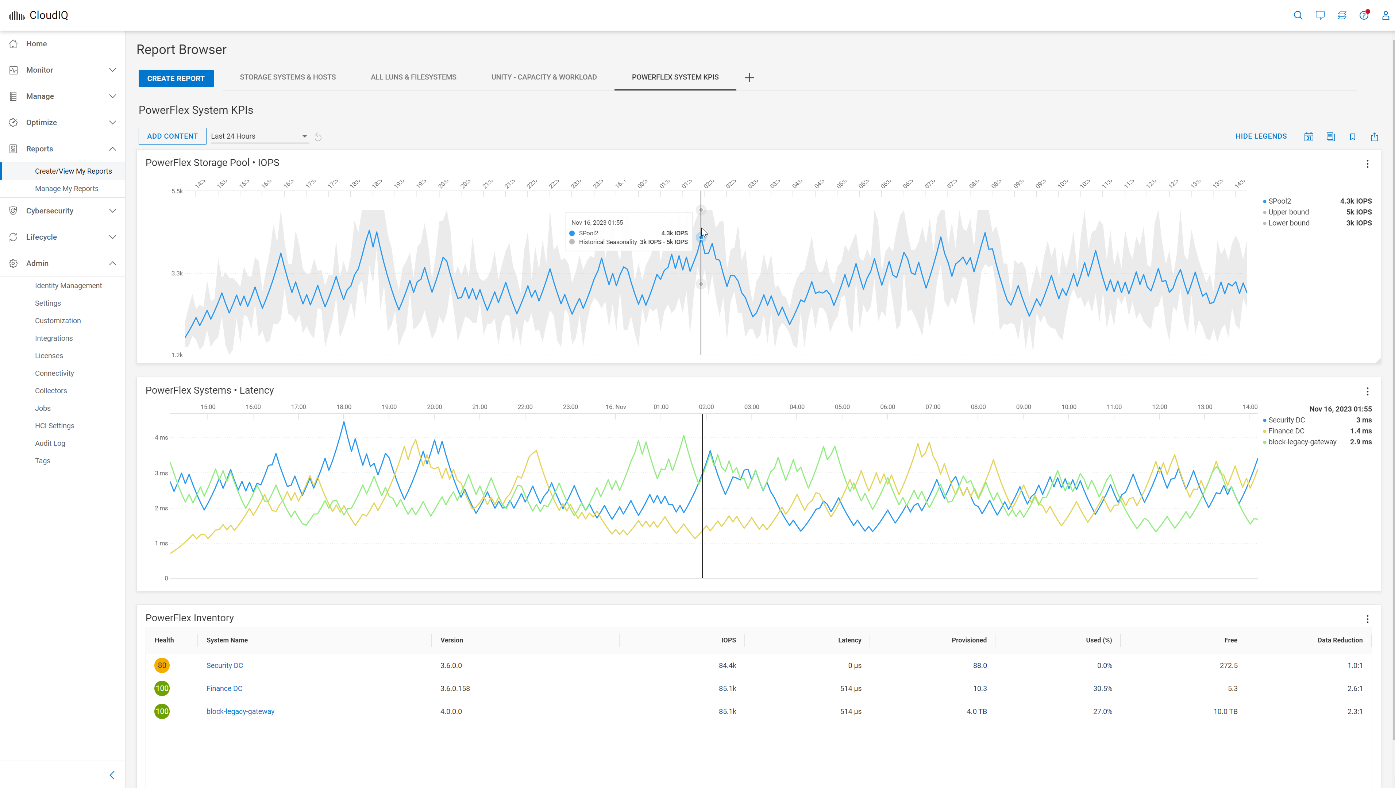
Figure 14. Three report types in a custom report for PowerFlex
The anomaly chart consists of a single performance metric overlaid on the gray historic seasonality value boundaries. The upper and lower bounds establish the normal behavior for the specific metric. The bounds are based on an analysis of the prior three-week history. Historical values that exceed the upper or lower bounds are shaded in light blue to highlight that the value of the metric during this time was outside the historical range. Anomaly charts, at most, display the last 24 hours of data. The line chart allows you to display more than one metric from one or more systems. The example in figure 14 shows system latency from three PowerFlex systems. The table displays metrics and properties, such as system name and code version.
The next time you are working with CloudIQ, keep an eye out for the latest enhancements. If you have not onboarded your PowerFlex systems into CloudIQ, check out the PowerFlex CloudIQ onboarding article to get started.
Resources
Procedure to Onboard PowerFlex Systems to CloudIQ
Author: Roy Laverty, Principal Technical Marketing Engineer
Twitter: @RoyLaverty
LinkedIn: https://linkedin.com/in/roy-laverty