


Dell Technologies Has the Storage Visibility You’re Looking For!

It’s no secret that high-performance storage is crucial for demanding database workloads. Database administrators (DBAs) work diligently to monitor and assess all aspects of database performance -- and storage is a top priority. As database workloads grow and change, storage management is critical to meeting SLAs.
How do you manage what you can’t see?
As a former DBA, one of the challenges that I faced when assessing storage performance and troubleshooting storage latency was determining root cause. Root cause analysis requires an end-to-end view to collect all data points and determine where the problem lies. It’s like trying to find a water leak, you must trace the route from beginning to end.
This becomes more complicated when you replace a single disk drive with a drive array or modern storage appliances. The storage is no longer part of the host, so from an operating system (OS) perspective, storage visibility is lost beyond the host. Popular third party monitoring tools don’t solve the problem because they don’t have access to that information either. This is where the finger pointing begins between storage administrators and DBAs because neither has access (or understanding) of the other side.
Stop the finger pointing!
Dell Technologies heard the need to provide end-to-end storage visibility and we have listened. Kubernetes brings a lot of production-grade capabilities and frameworks, and we are working to leverage these wherever possible. One of these is storage visibility, or observability. Now, everyone who works with Kubernetes (K8s) can view end-to-end storage metrics on supported Dell Storage appliances! DBAs, storage administrators, and developers can now view the storage metrics they need, track end-to-end performance, and communicate effectively.
How does it work?
The Dell Container Storage Module (CSM) for Observability is an OpenTelemetry agent that provides volume-level metrics for Dell PowerStore and other Dell storage products. The Dell CSM for Observability module leverages Dell Container Storage Interface (CSI) drivers to communicate with Dell storage. Metrics are then collected from the storage appliance and stored in a Prometheus database for consumption by popular monitoring tools that support a Prometheus data source such as Grafana. Key metrics collected by CSM observability include but are not limited to:
- Storage pool consumption by CSI Driver
- Storage system I/O performance by Kubernetes node
- CSI Driver positioned volume I/O performance
- CSI Driver provisioned volume topology
Let’s take a look
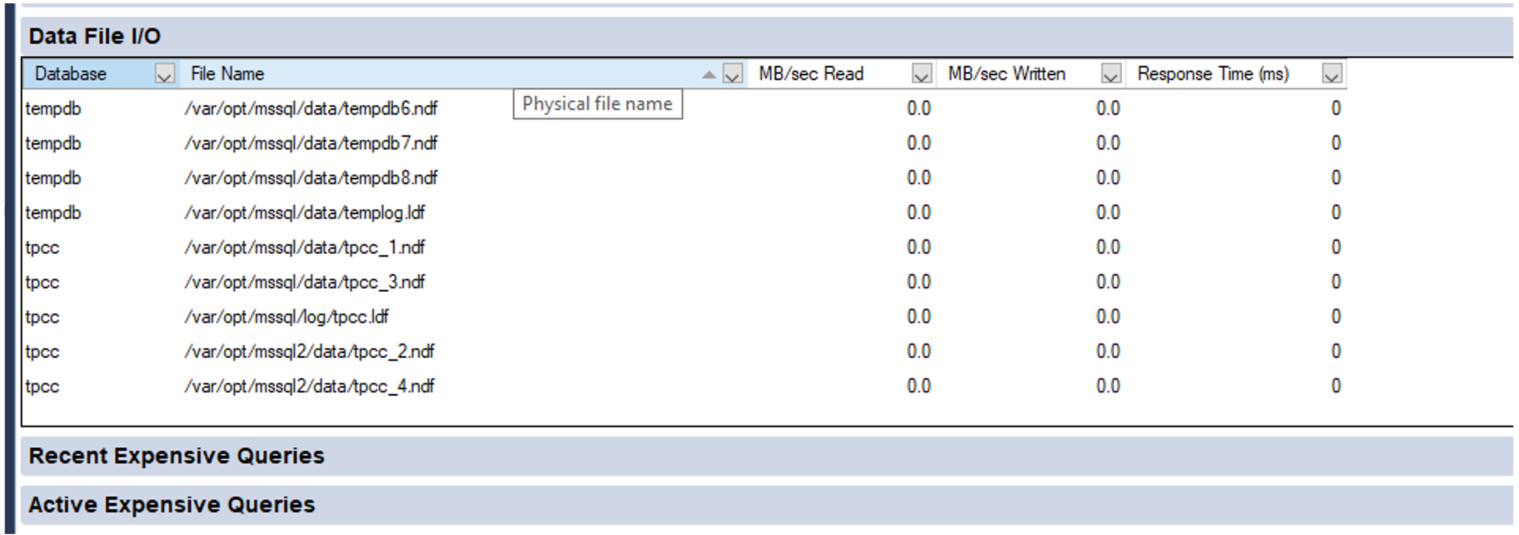
Let’s walk through a quick end-to-end example. A familiar display from SQL Server Management Studio shows the files and folders that comprise our tpcc database:
Now we need to translate that into K8s storage terms. Using meaningful naming standards for Persistent Volume Claims will negate a lot of this process, but it’s good to know how it all ties together!
A SQL Server pod will contain one or more Persistent Volume Claims (unless you don’t want to persist data 😊). These represent storage volumes and are presented to the SQL Server instance as a mount point.
The following example shows the deployment definition for our SQL Server pod with one of the mount points and Persistent Volume Claims highlighted. By examining the pod deployment, we can see that the folder/mount point /var/opt/mssql presented to SQL Server is tied to the K8s volume mssqldb and the underlying persistent volume claim mssql-data.
apiVersion: apps/v1
kind: Deployment
metadata:
  name: mssql-deployment
spec:
  replicas: 1
  selector:
     matchLabels:
       app: mssql
  template:
    metadata:
      labels:
        app: mssql
    spec:
       terminationGracePeriodSeconds: 30
      hostname: mssqlinst
      securityContext:
        fsGroup: 10001
      containers:
      - name: mssql
        image: mcr.microsoft.com/mssql/server:2019-latest
        ports:
        - containerPort: 1433
        resources:
          limits:
            cpu: "28"
            memory: "96Gi"
          requests:
            cpu: "14"
            memory: "48Gi"
        env:
        - name: MSSQL_PID
          value: "Developer"
        - name: ACCEPT_EULA
          value: "Y"
        - name: SA_PASSWORD
          valueFrom:
            secretKeyRef:
              name: mssql
              key: SA_PASSWORD
        volumeMounts:
        - name: mssqldb
          mountPath: /var/opt/mssql
        - name: mssqldb2
          mountPath: /var/opt/mssql2
        - name: mssqllog
          mountPath: /var/opt/mssqllog
      volumes:
      - name: mssqldb
         persistentVolumeClaim:
          claimName: mssql-data
      - name: mssqldb2
         persistentVolumeClaim:
          claimName: mssql-data2
      - name: mssqllog
         persistentVolumeClaim:
          claimName: mssql-log
Following that example, you can see how the other Persistent Volume Claims, mssql-data2 and mssql-log are used by the SQL Server database files. The following figure shows one of the Grafana dashboards that makes it easy to tie the Persistent Volume Claims for the mssql-data, mssql-data2, and mssql-log used by the SQL Server pod to the Persistent Volume name.
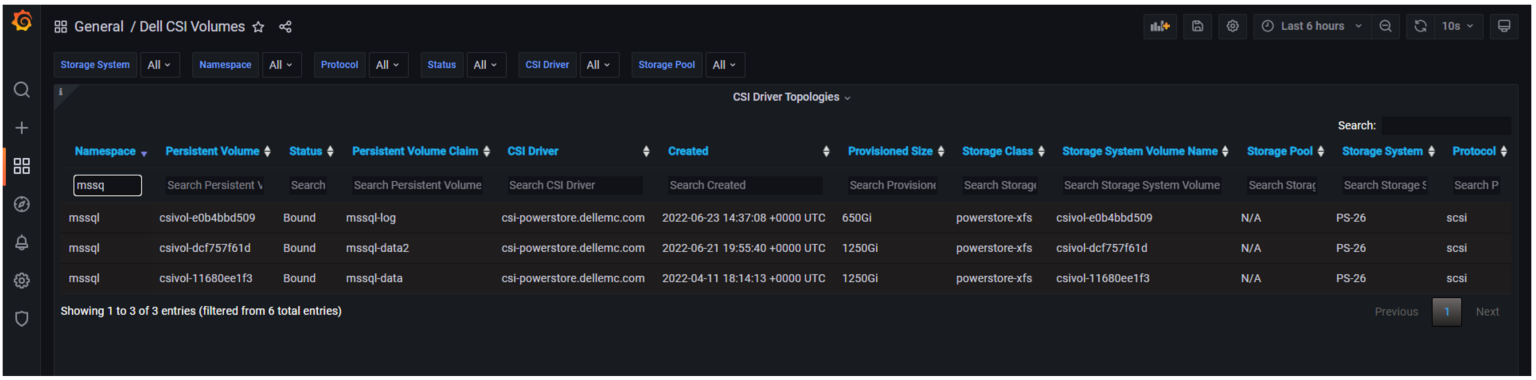
From here, we can use the Persistent Volume name associated with the Persistent Volume Claim to view metrics on the storage appliance, or better yet, in another Grafana dashboard.
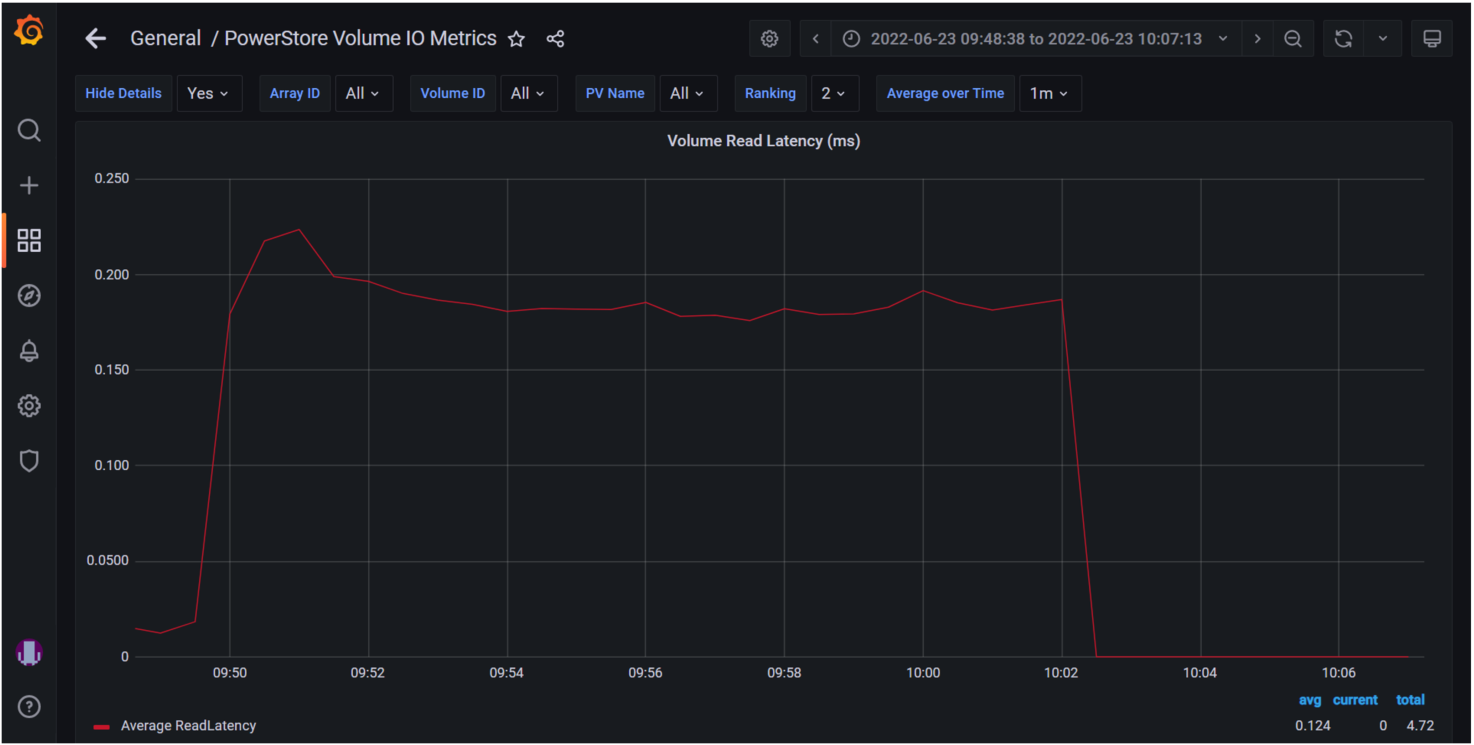
The following example shows the PowerStore Volume I/O Metrics dashboard. The key storage metrics (IOPS, latency, and bandwidth) are displayed as reported by the Dell PowerStore storage appliance.

You can select any of the charts for expanded viewing. The Volume Read Latency chart is selected below.
Rapid Adoption
These Kubernetes frameworks are becoming popular, and adoption is happening rapidly. Microsoft SQL Server Big Data Clusters and their latest offering Azure Arc-enabled SQL Managed Instance both display SQL statistics in Grafana as well. This allows single pane of glass viewing for all your key SQL metrics!

Kubernetes and cloud-native design are here to stay. They bridge the gap between cloud and on-premises deployments and the wealth of capabilities provided by K8s make it impossible to ignore.
Dell Technologies is leading the way with PowerStore capabilities as well as the full Dell portfolio of products. We are working diligently with partners such as Microsoft to prove out new technologies so you can modernize your data estate with confidence!
For more information about Azure Arc-enabled SQL Managed Instance and PowerStore, see:
- Our latest joint white paper: Dell PowerStore with Azure Arc-enabled Data Services which highlights performance and scale.
- The Microsoft blog post: “Performance benchmark of Azure Arc-enabled SQL Managed Instance.”
- The Microsoft digital events Microsoft Build and Azure Hybrid, Multicloud, and Edge Day.
Author: Doug Bernhardt
Sr. Principal Engineering Technologist