
Direct from Development: Tech Notes

Upgrading To OpenManage Enterprise 4.0

Thu, 07 Dec 2023 17:39:47 -0000
|Read Time: 0 minutes
Upgrading To OpenManage Enterprise 4.0
Authors: Mark Maclean, PowerEdge Technical Marketing Engineering / Manoj Malhotra, Product Manager, OME
Summary
Dell OpenManage Enterprise is an infrastructure management console for Dell PowerEdge Servers offering a full lifecycle management solution plus many other features. Since its initial release OpenManage Enterprise (often abbreviated to OME) has continued to develop adding new features every release. Customers on older versions of OME 3.x can migrate to OME 4.0 to leverage the new features, such as iDRAC credentials rotation and multi-faction authentication with RSA SecurID.
Migation
Overview
Unlike earlier versions, OME 4.0 does not offer an in-place upgrade, rather a transfer of existing data to a new instance of the appliance.
The upgrade is achieved through:
- Deploy a new instance of OME 4.0 virtual appliance
- Migrate data from OME 3.10.x to OME 4.0
- Decommission old OME 3.10.x virtual appliance
The migration is only required when you need to upgrade from OME 3.10.x (CentOS-based) to OME 4.0 (SLES-based). In the future, when upgrading (for example, from OME 4.0 to OME 4.1) the in-place upgrade will be supported.
This transfer of existing OME data such as discovered servers, deployment templates, policies, logs and credentials is achieved via the migration feature built in to OME. This migration wizard is step-based to export data from the OME 3.10.x appliance and import into a fresh OME 4.0 appliance. In order to migrate, customers must have OME 4.0 installed and configured with a new IP address and administrator account. Also, the existing OME 3.10.x and new OME 4.0 instances must be able to communicate with each other over the network.
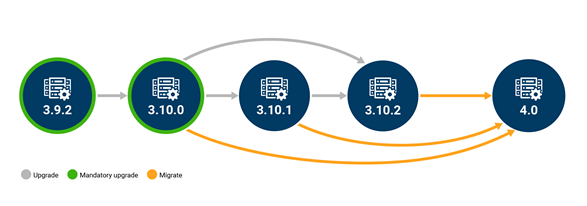
Figure 1 Possible upgrade paths to OME 4.0
This migration feature is only supported when going from OME 3.10.x to OME 4.0. Customers on early versions must apply in-place upgrades to reach OME 3.10.x before migrating to OME 4.0, see figure 1.
Enablement
As with previous versions, OME 4.0 is delivered as a virtual appliance. The virtual appliance is offered in three formats to be deployed on VMware or Microsoft Hyper-V or KMV. Once commissioned the OME appliance will manage any Dell PowerEdge host regardless of operating system. All three versions of the appliance can be downloaded from the Dell support site and detailed installation instructions for the virtual appliances are included in chapter 2 of the OME user guide. See link to the OME support page at the bottom of this document. Migration should run in a maintenance window period or a quiet time to lower the risk of critical alerts bring missed.
Once a new OpenManage Enterprise version 4.0 virtual appliance has been installed and the basic configuration has been applied, migration can begin. The logical steps are shown in figure 2. Starting with the existing source host, that needs to be OME version 3.10.x. The migration overseer needs local administrator/backup administrator rights to access backup/restore menu. From the drop-down backup/restore menu the migration wizard can be started. The steps include: checking SSL certificate match using the default Dell or customer supplied certificate for secure access, checking network access to the new OME 4.0 virtual appliance, supplying a passphrase to secure the backed-up data, checking for the completion of or stopping non-migration tasks. Backup encryption passphrase needs to be a minimum of 8 charters, certain characters such as commas full stops/periods and several other characters are not supported as special characters. At the end of the process the 3.10.x appliance will then automatically transition in to “maintenance mode pending” status.
Note: For customer supplied certificate client and server authentication are required from issuing CA.
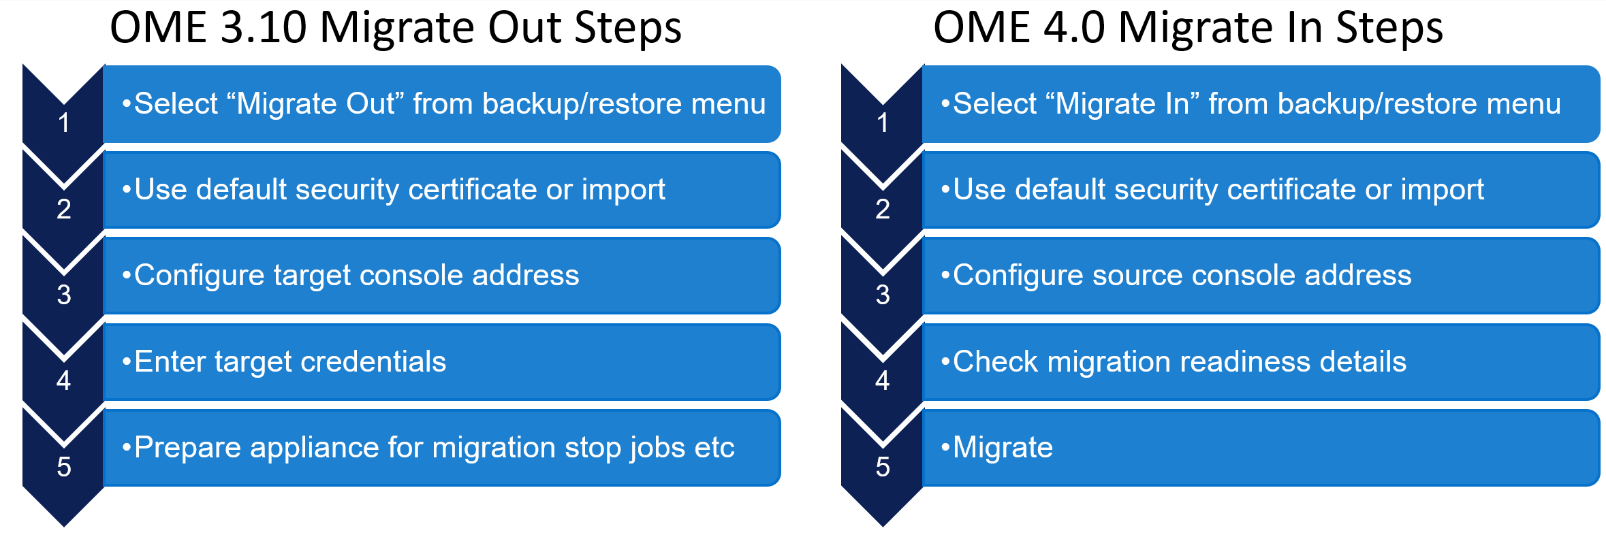
Figure 2 OME high level migration step
Then on the new OME 4.0 appliance, the first time an administrator logs into OME, an initial onboarding wizard starts automatically. There is no need to install any plugins, because the automation built into the migration tool handles this task. As part of this onboarding wizard, the migration feature can be selected to be run.
Note: This migration feature can also be run from the drop-down backup/restore menu post completion of the initial wizard if required, see figure 3.
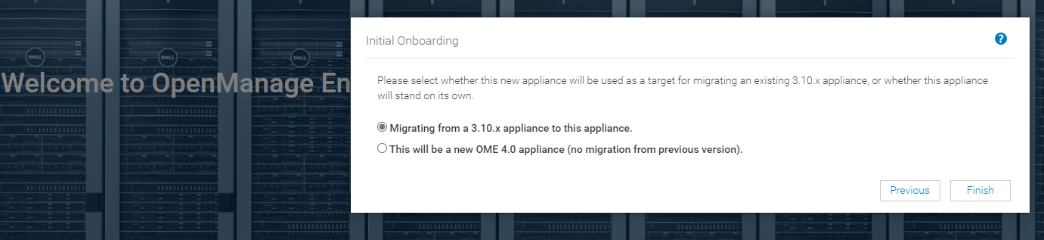
Figure 3 Initial OME onboarding wizard – Migration step
The “migrate-in” steps to import data are as follows: once communications have been established via the supplied IP address and credentials, the migration engine automatically checks the plugin status and appliance status. If all is ready, then the backup passphrase used during “migrate-out” is re-entered and the “migrate-in” task is started via the import button, see figure 4.
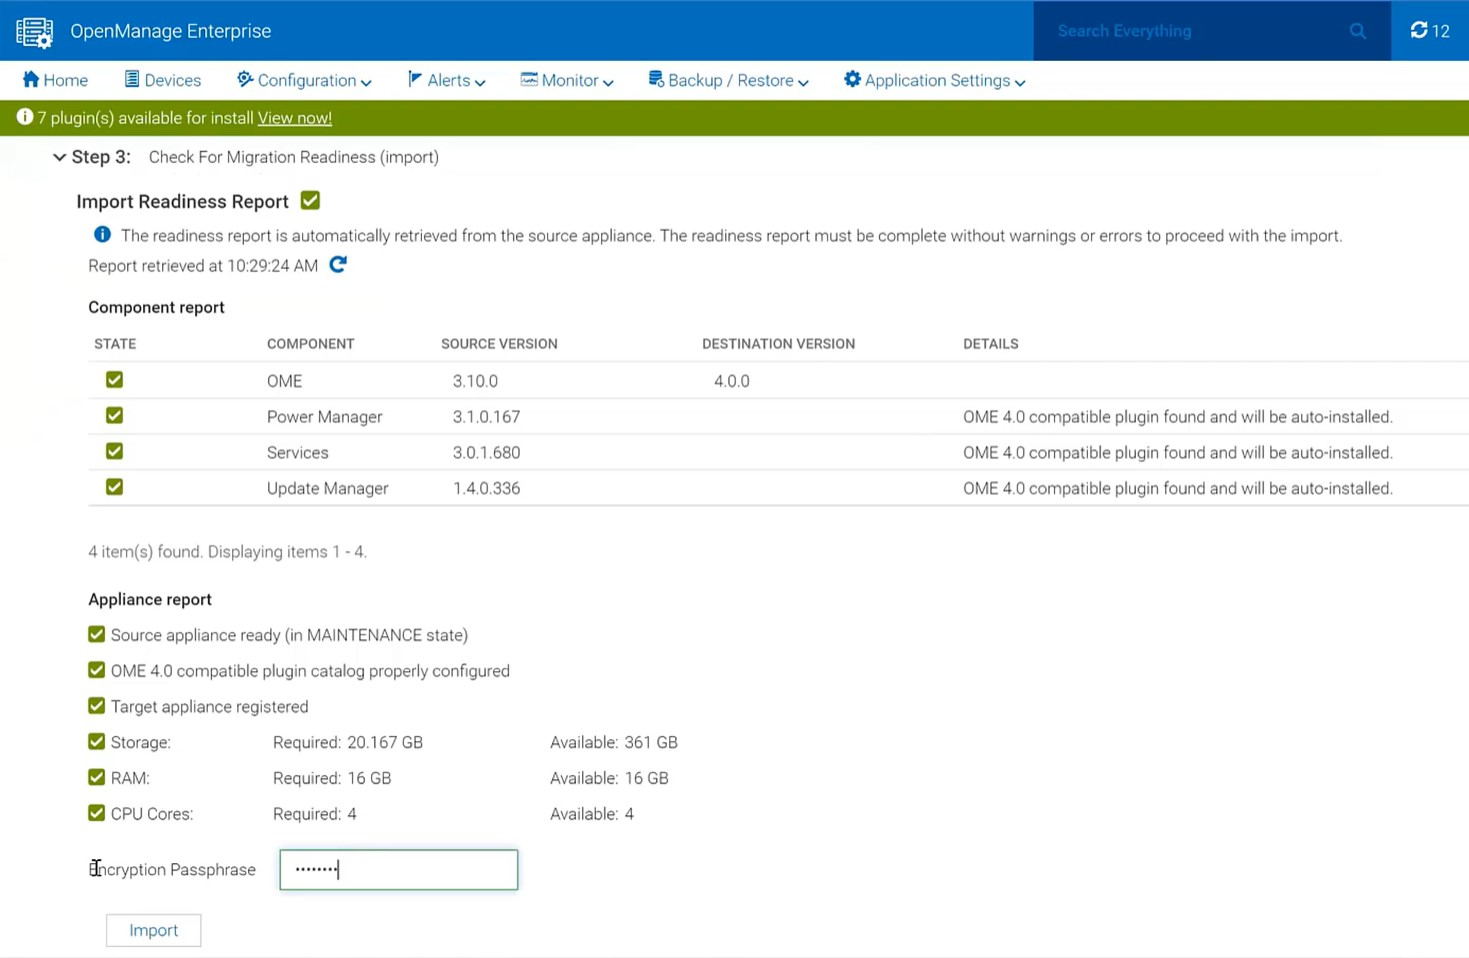
Figure 4 Migrate in wizard showing import steps
The wizard displays migration status and the various steps as they run and complete, see figure 5. These steps are also recorded in the migration log and can be viewed post-migration. As the IP address of the OME 3.10 appliance is not migrated across, post successful migration the OME 4.0 appliance executes a task to configure all the known iDRAC that have SNMP enabled with the IP details of the new management console as a trap destination.
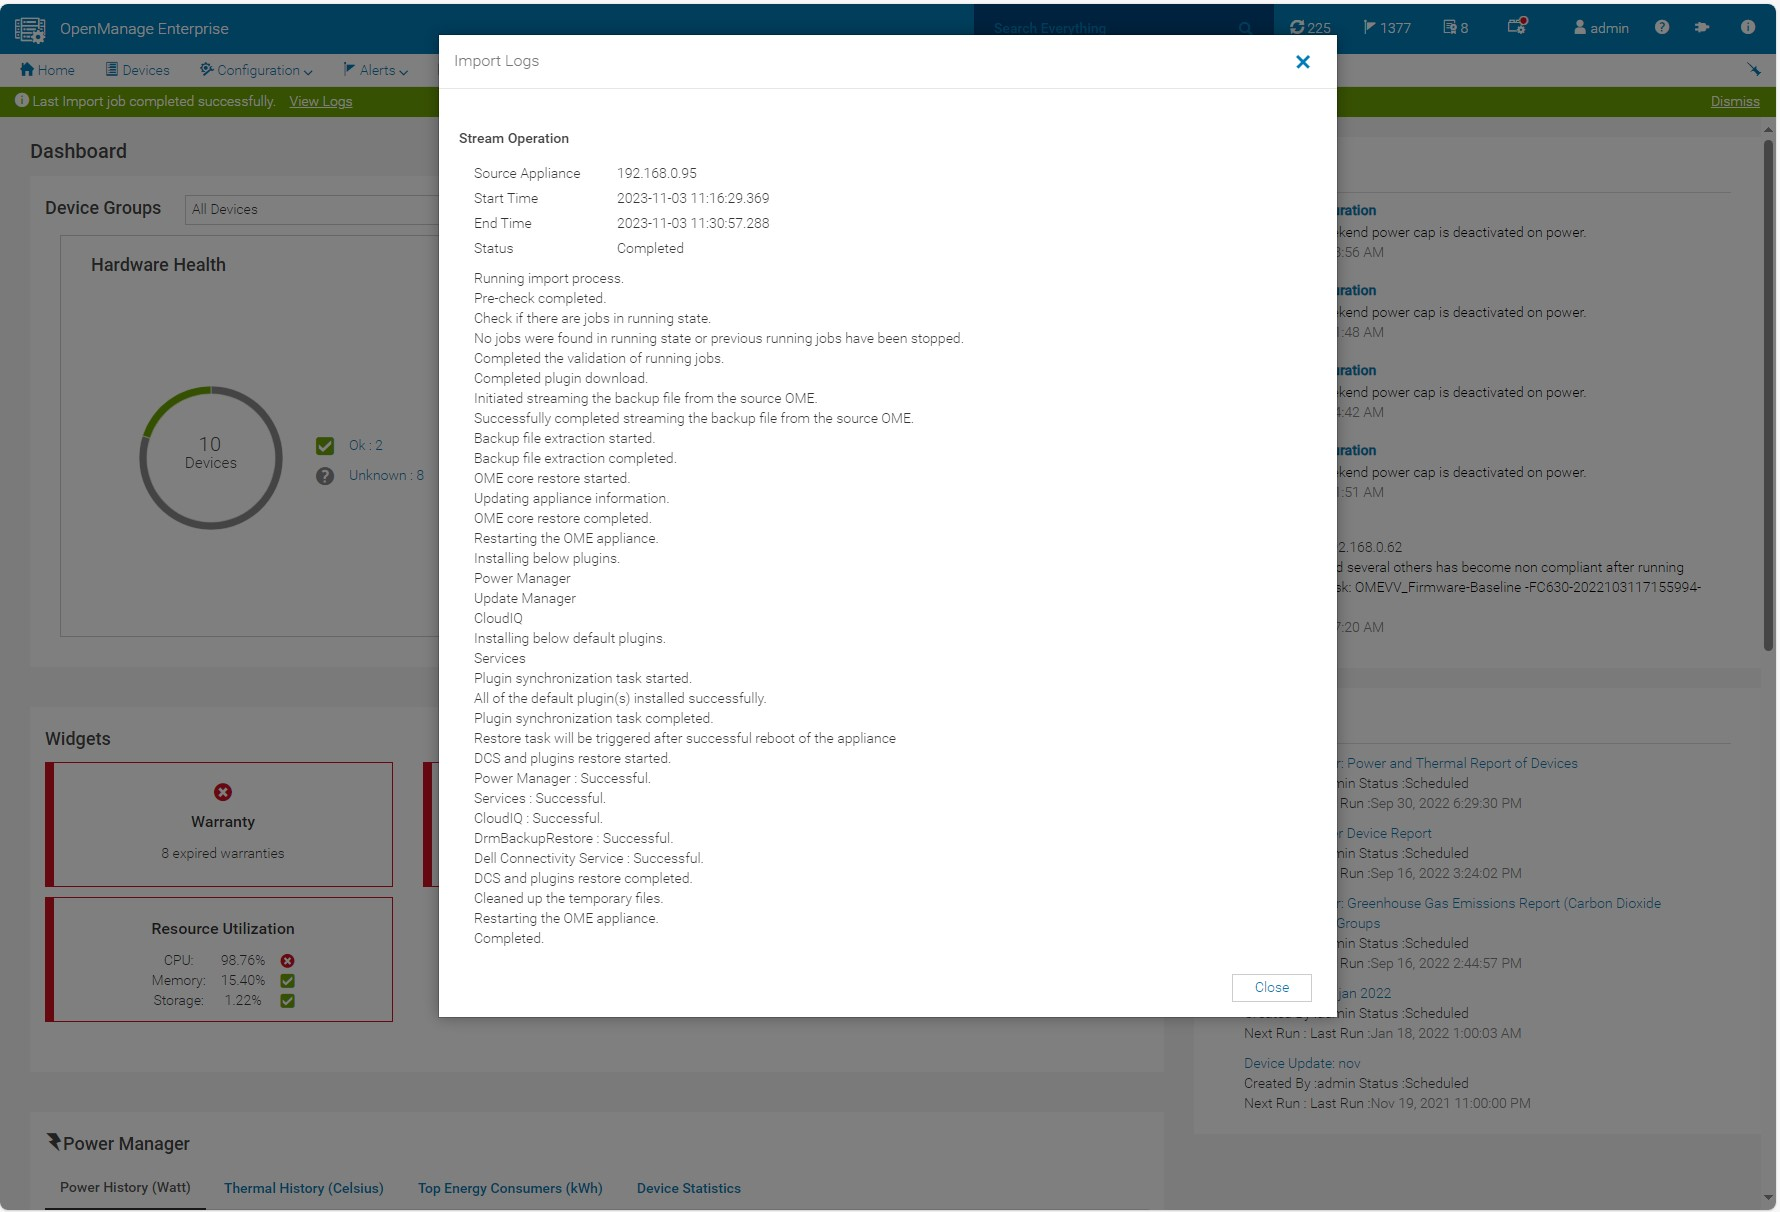
Figure 5 Log displaying successful migration
If necessary, the administrator can cancel the migration at the source using the Cancel migration hyperlink in the wizard. This will take the source appliance out of maintenance mode and back into working mode.
At the end of a successful migration, the source migrate-out appliance automatically enters the Decommission Ready status. The login GUI color changes to burgundy and text is modified to warn that the appliance is decommissioned.
NOTE: Only an admin can login to the console.
Instead of the dashboard, a message is displayed declaring that the appliance is ready to be decommissioned. At this point, the administrator recommended action is to power down and archive the virtual appliance. The admin can bring the appliance back to the running state however, this is highly discouraged, see figure 6. Finally, it is recommended to take a backup of the newly commissioned OME 4.0 appliance post migration before any further operations.
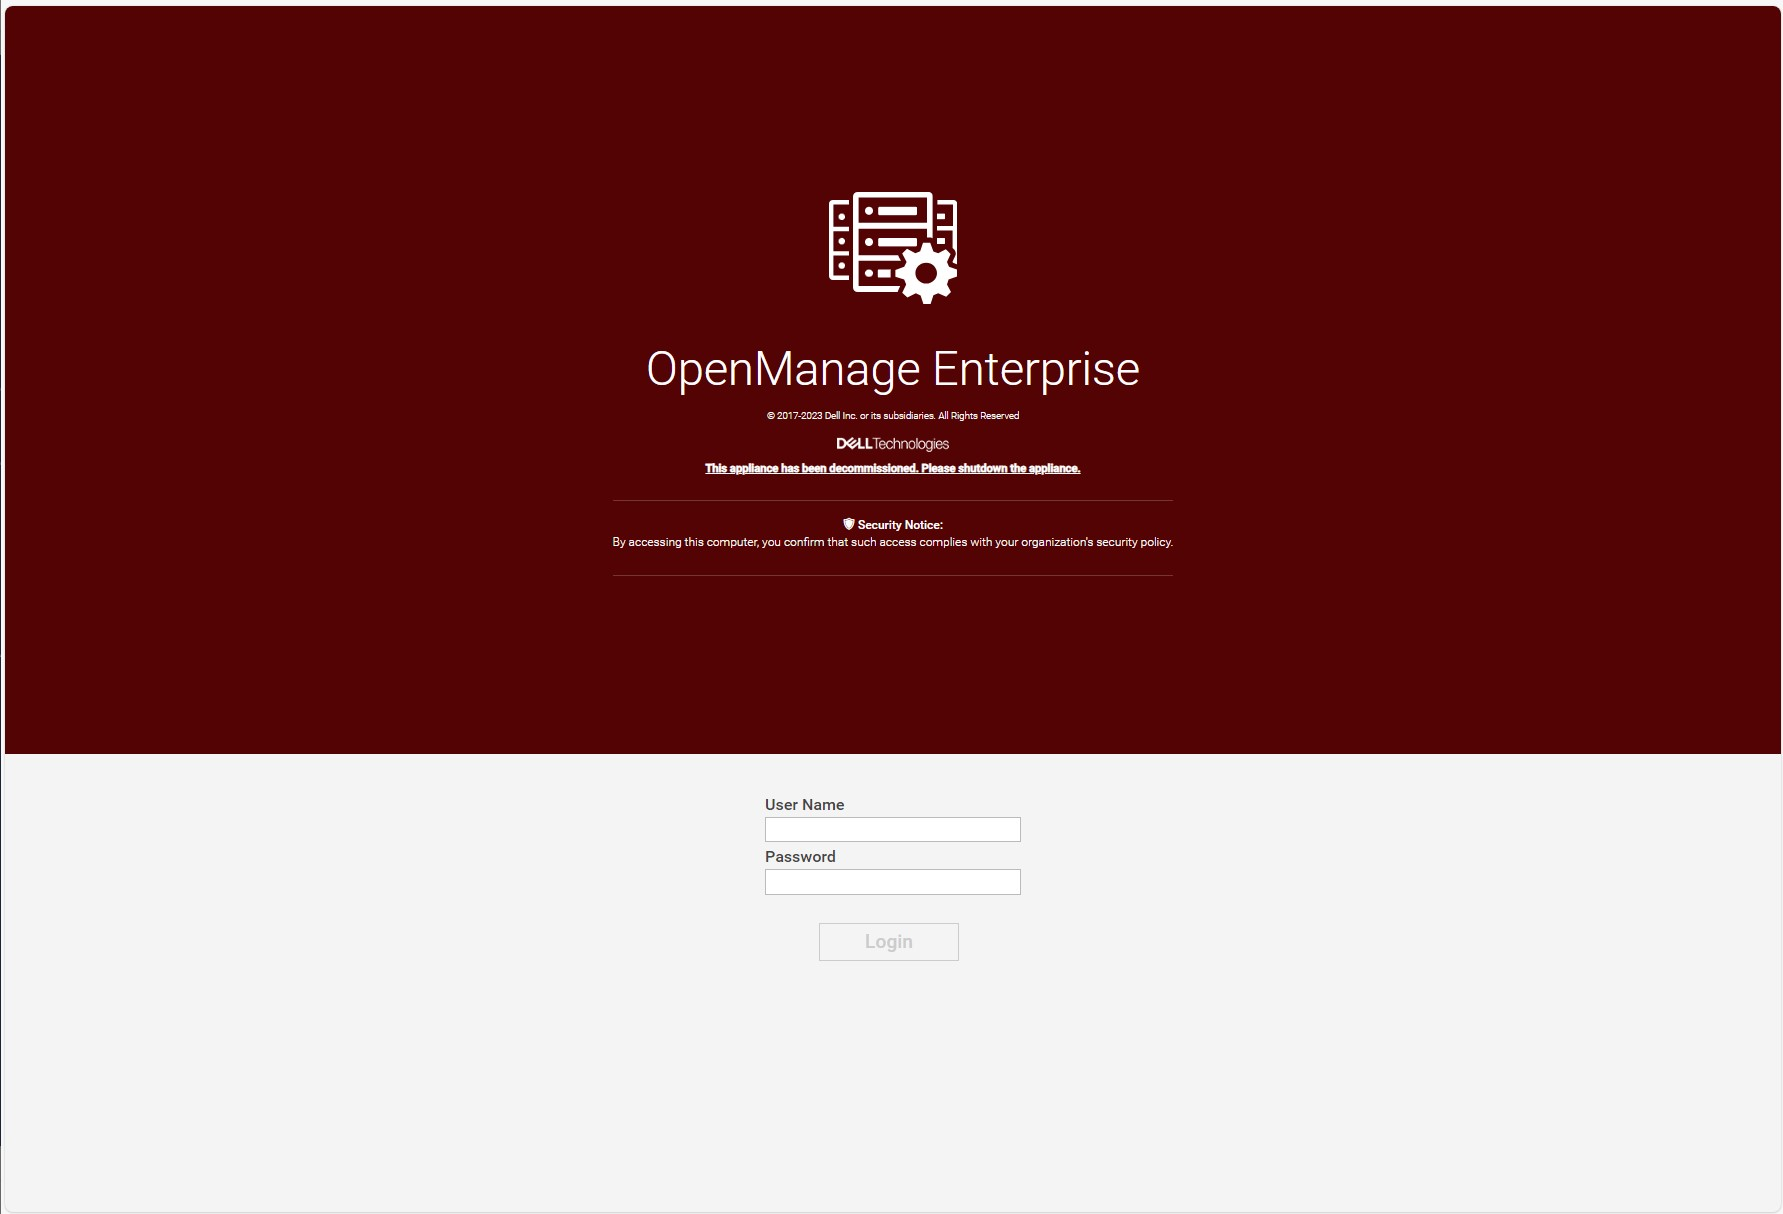
Figure 6 Example of a decommissioned OME 3.10.x login screen
Migration will move data such as application settings, device inventory, and plugin data, see table 1 for more details. For example, the Site ID details used by the OME CloudIQ plugin is migrated across to ensure continuation of server management traffic movement and the historic power data held by power manager is also transferred. Only one backup, restore or migrate process is supported at a time. Running more than one backup/restore process at a time can lead to unexpected system behavior.
Table 1 Data Considered During Migrate Jobs
Item | Description |
Database
|
|
Configuration files
|
|
Auto install plugins |
|
Plugin data restore |
|
Conclusion
Using the built in migration feature, customers can upgrade to OME 4.0 quickly and easily. Using the step-based wizard with integrated pre-transfer checks, and automated data streaming makes migration simple and hassle free. For more details, see chapter 18 of the OpenManage Enterprise 4.0 User's Guide.
References
- OpenManage Enterprise migration video : https://youtu.be/uckcVIKr3xo?si=ZuMgsm_XHgZJgzsv
- OpenManage Enterprise white papers / videos / links Support page
- OpenManage Enterprise Documentation User Guide, API Guide and support matrix etc
- OpenManage Enterprise API Dell Technologies Developer
- OpenManage Ansible Modules and example API scripts GitHub Dell OpenManage Ansible Modules
- Dell System Management Info Hub Tech notes, videos, infographics

Announcing iDRAC Credential Management in OpenManage Enterprise 4.0
Wed, 01 Nov 2023 15:25:10 -0000
|Read Time: 0 minutes
Summary
Dell OpenManage Enterprise is an infrastructure management console that offers a full lifecycle management solution for Dell PowerEdge Servers and provides many other features. Since its initial release, OpenManage Enterprise (or OME for short) has continued to add new features with every release. Among the list of new features, OME release 4.0 now supports optional iDRAC credential management. iDRAC credentials are required by OME for server management tasks. This new feature offers customers support for either internal OME iDRAC password rotation or iDRAC credential retrieval from CyberArk Central Credential Provider, an external third-party credential provider solution.
iDRAC password rotation
Overview
Many customers have a password rotation policy for iDRACs. OME 4.0 can now support this requirement by removing the need for administration accounts with static credentials on managed iDRACs. This feature is supported on iDRAC 7, 8, and 9. The internal password rotation feature in OME 4.0 can create and then update credentials on a scheduled basis for the managed iDRACs. The frequency of rotation can be set in the OME password management section and can range from daily to annual, as shown in the following figure.
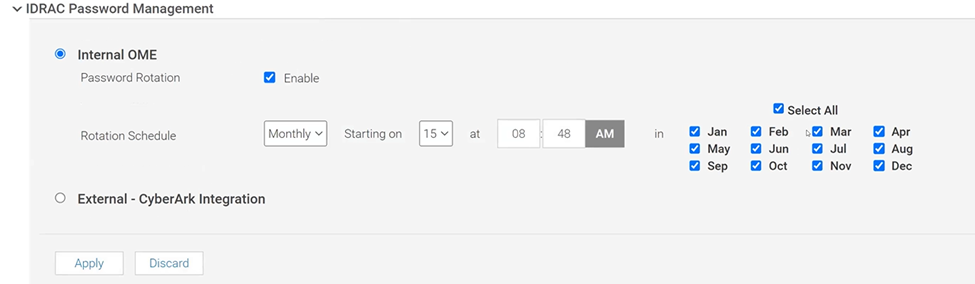
Figure 1. OME iDRAC Password Management with Internal rotation selected
Enablement
After the OpenManage Enterprise version 4.0 virtual appliance has been installed, and the basic configuration has been applied, the first time an administrator logs into OME, an initial onboarding wizard executes. As part of this wizard, the iDRAC password rotation feature is enabled by default. Note: This rotation feature can only be disabled/enabled during this initial onboarding.
After the feature is enabled, the process to implement a rotation policy starts with the standard OME device discovery job, using an existing administrator level iDRAC account such as root / Calvin. To enable support for password rotation, an OME Advanced or OME Advanced+ license is required to be present on each iDRAC. During the server onboarding task, as OME discovers the new servers, OME automatically creates a unique OME service account with OME specific user account IDs and strong passwords on each iDRAC.
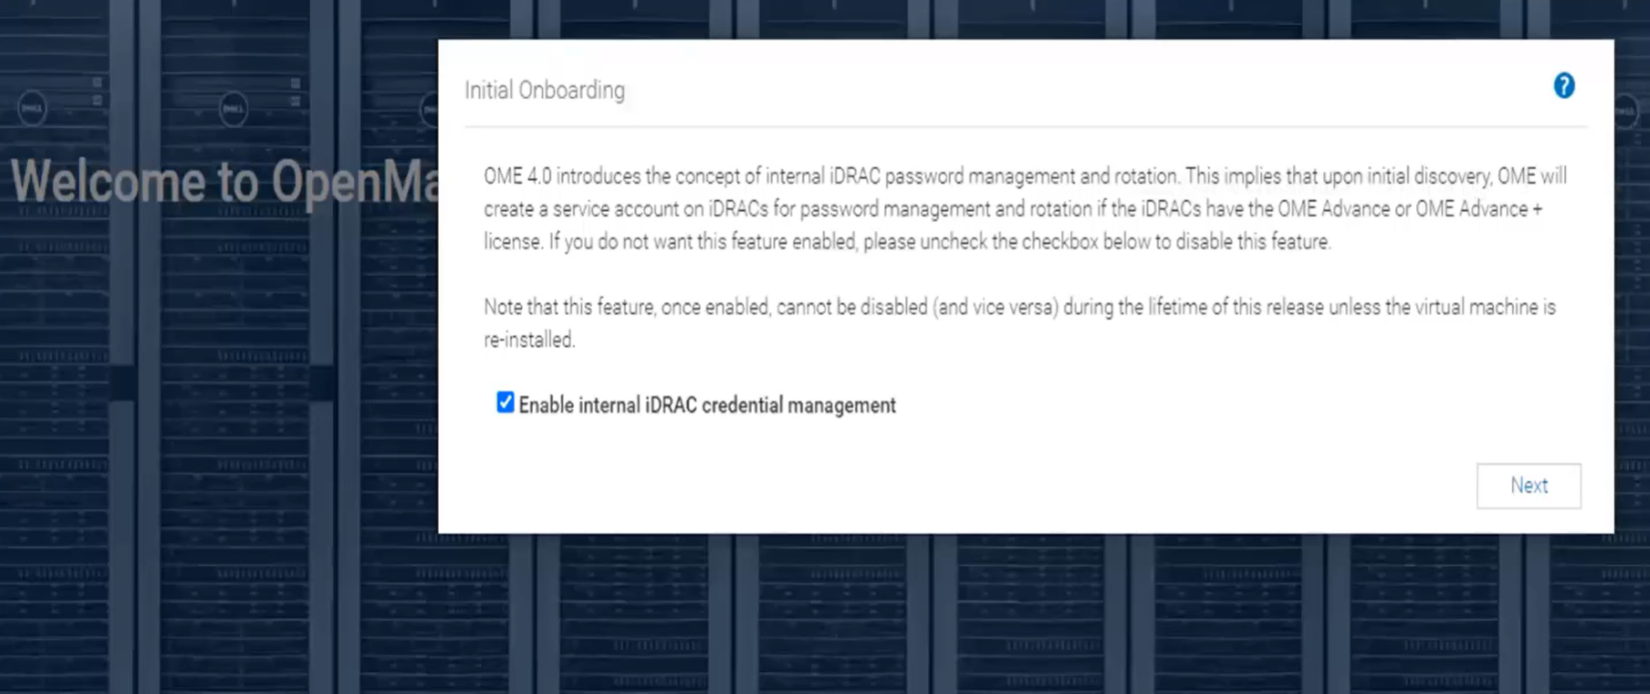
Figure 2. Initial OME onboarding wizard - One-time credential management enablement
After one or more servers are onboarded and the OME service accounts have been automatically created on each iDRAC, the credential type used for each server is displayed in OME on the All Devices page. Any server where password rotation is enabled is reported as credential type “Internal”. Servers for which rotation is not supported, for example where there is no OME Advanced license, are reported as “Discovery” (which means that OME will continue to use the credentials set at discovery). See Figure 3.
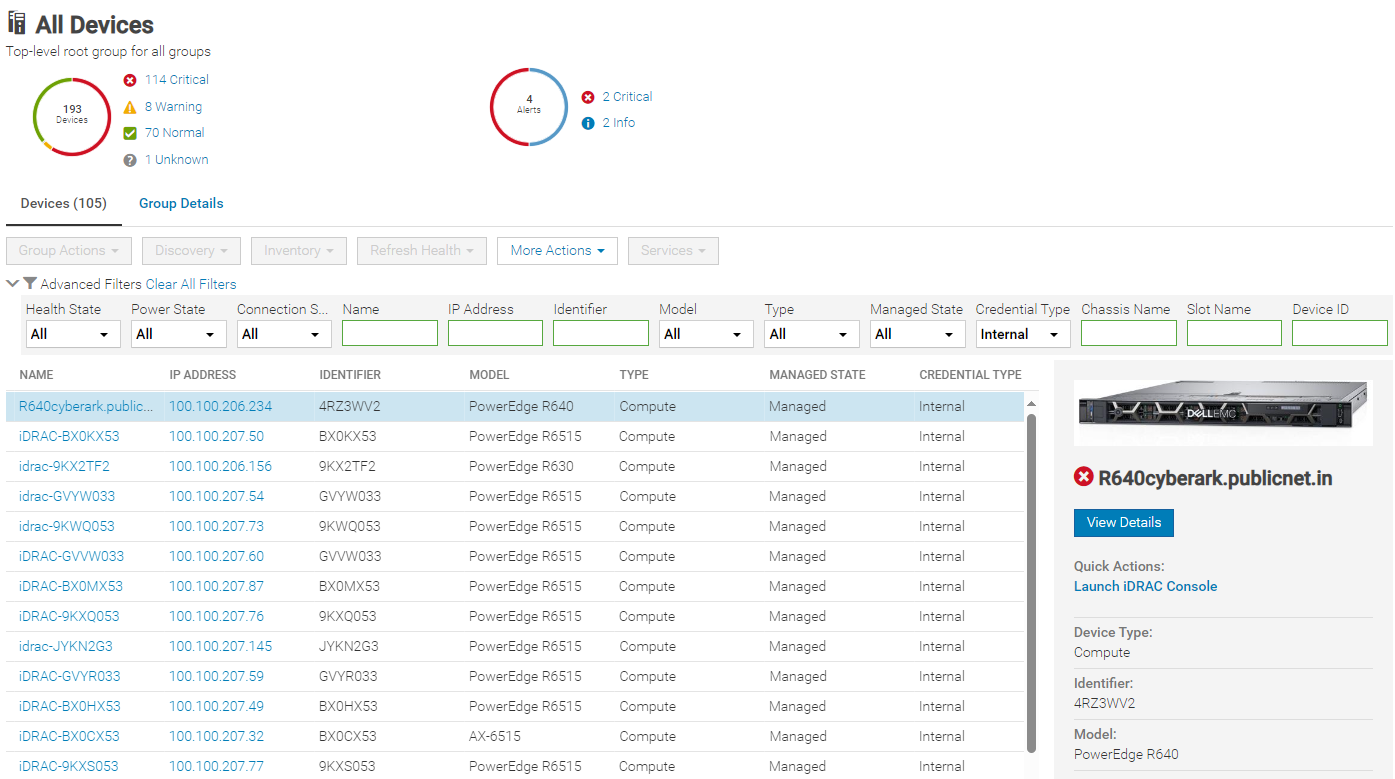
Figure 3. Credential type reporting
Using CyberArk for iDRAC credential retrieval
Overview
CyberArk is a third-party Identity and Access Management (IAM) security tool that offers comprehensive solutions to store and manage passwords across organizations. OME can be configured to interface with the CyberArk Central Credential Provider for managing iDRAC credentials.
Enabling CyberArk
To enable CyberArk, you must configure support details about the CyberArk vault on the iDRAC Password Management page in OME (Figure 4). An OME Advanced+ license is required to be present on each iDRAC.
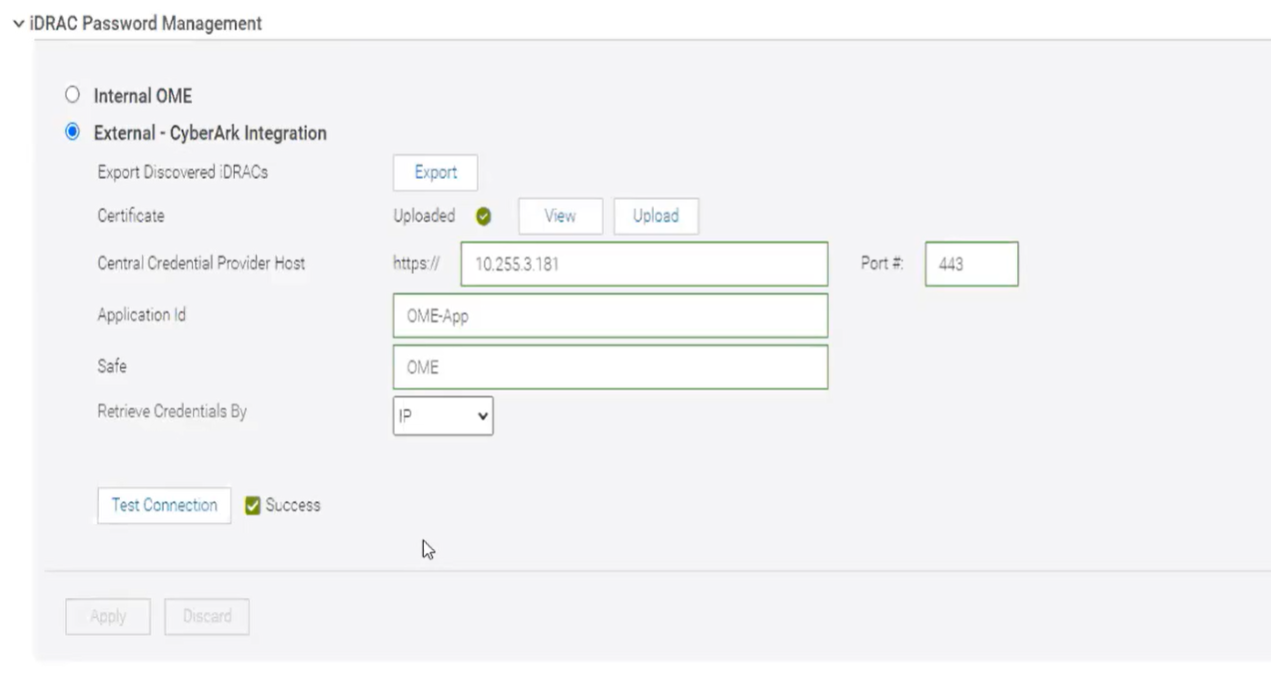
Figure 4. CyberArk enablement
Servers with iDRAC CyberArk support enabled are reported as credential type “CyberArk” (Figure 5).
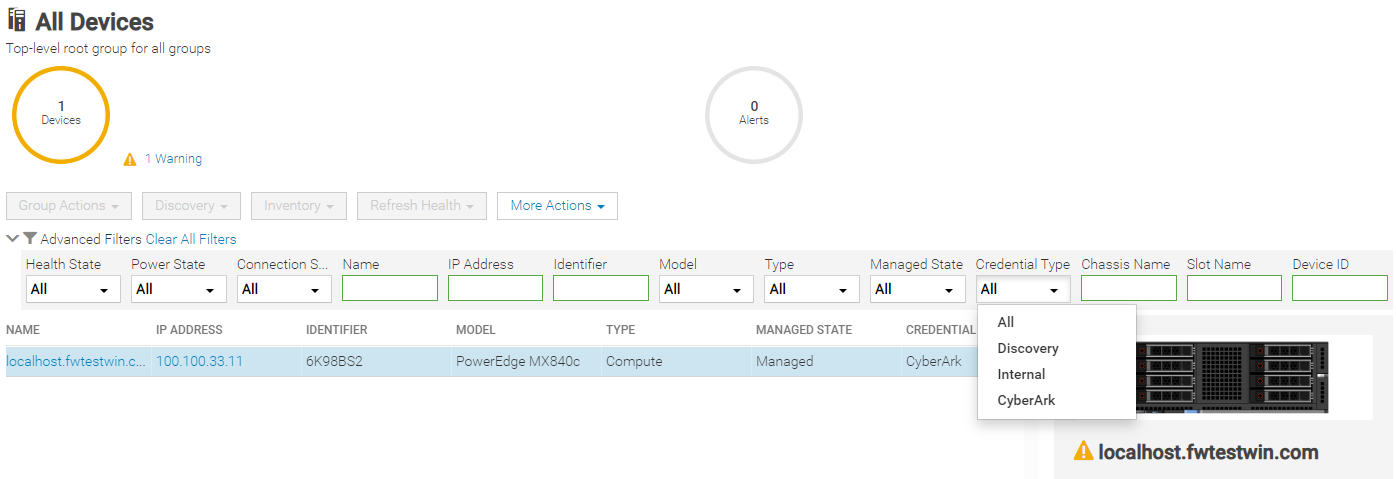
Figure 5. Credential type CyberArk reporting with drop down filter by type
Conclusion
With the new credentials features now available in OpenManage Enterprise release 4.0, Dell has added additional security features to OME that can support customers’ password rotation policies.
References
- Support page for OpenManage Enterprise (includes white papers and videos)
- OpenManage Documentation (User Guide, API Guide, and support matrix)
- OpenManage Enterprise API - Dell Technologies Developer
- GitHub Dell OpenManage Ansible Modules and example API scripts
- Dell Systems Management Info Hub (for white papers, tech notes, videos, and infographics)
- CyberArk.com

Good, Better, Best Automation of Bare Metal Server Deployment using OpenManage Enterprise
Wed, 01 Nov 2023 15:01:08 -0000
|Read Time: 0 minutes
Introduction
Customers looking for a simple method to automate Dell PowerEdge server deployment at scale need to review the use of Dell OpenManage Enterprise (OME). During a typical server deployment, customers need to configure firmware settings such as boot order, RAID storage configuration details, iDRAC settings, and security standards, in addition to loading a server operating system. All these manual tasks can be repetitive and time-consuming.
Customers can save a substantial amount of administration time by leveraging automated deployment mechanisms. Dell offers many deployment solutions the choice of which depend on customer requirements and elements such as network environment and server operating system. OME offers its own solution and can also integrate into many popular third-party tools such as Ansible, Terraform, Microsoft System Center, or VMware vCenter.
This Direct from Development (DfD) tech note describes the capabilities and results that customers can expect when using OME to deploy bare metal servers. This document covers the deployment features and how to streamline server deployment when using OpenManage Enterprise orchestration controlling the iDRAC that is built into each Dell PowerEdge server.
OpenManage Enterprise – bare metal deployment
OpenManage Enterprise (OME) is Dell's on-premises server lifecycle management console. Its capabilities include discovery, monitoring, updating firmware, reporting, and of course configuration/deployment. During deployment, OME can discover a bare metal server and install both a firmware configuration setting and an operating system.
There are two typical approaches:
- The first: A previously discovered server gets a configuration template manually pushed from OME.
- The second is more automated: OME is configured with a list of tag numbers of arriving servers. OME then regularly examines an IP address range. When OME identifies a new server by its unique service tag, OME pushes the template to the new server's iDRAC for deployment. The customer can either obtain a list of service tag numbers associated with an order from Dell by email at the time of shipping, or collect the service tag numbers from external labels on the packaging or from the actual servers as they are being physically installed.

Each method supports an optional delivery of a bootable ISO file. This is an industry standard image file that contains all the required the files and configuration information to install an operating system. To automate the OS install, the operating system ISO is configured for an automated unattended install. All these features require no PXE boot support and no additional DNS/DHCP customization.
Server template
Let’s look at configuration settings first. This is based on iDRAC’s “server configuration profile” concept. A template encapsulates the server’s BIOS, iDRAC, and components’ firmware configuration settings as a machine-readable file. A template can consist of hundreds of firmware configuration values including iDRAC, BIOS, PERC RAID, NICs, and FC HBA settings. OME can create a template by obtaining these settings from a reference server. A customer can also clone and edit a template for simple updates, or OME can import a template exported from another OME instance.
Testing and results
To understand the profound impact of the automation of this process, we have tested it against a manual process for 1, 10*, and 100* servers[1]. Based on the testing of the OME auto deploy approach for a customer with 100* servers, we found significant differences between automation and the manual process. The following graph illustrates the considerable time savings when using automation.
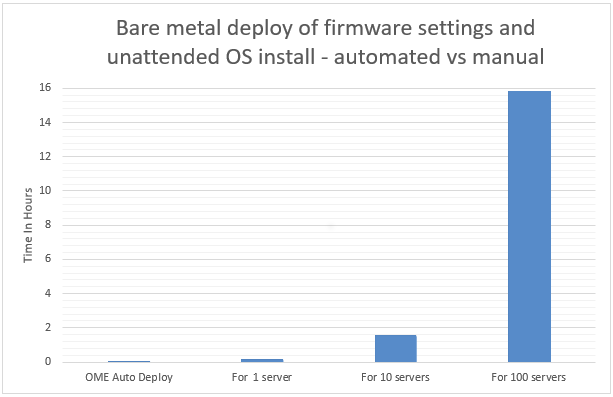
In internal testing at the Dell TME server lab, we found that manually importing the server configuration profile (SCP or deployment template), and then starting the unattended OS install ISO using virtual media in the iDRAC GUI, took 9 minutes 31 seconds. However, creating an auto deployment and importing a list of target server(s) took only 13 steps in 2 minutes 11 seconds. In addition, whether creating an auto deployment job for 1, 10, or 100 servers, this task took the same amount of time. However, when using the manual process, each additional server added a further 9 minutes 31 seconds.
Testing overview
To demonstrate both the ease of use and the impact of automation, we tested two different approaches: manual versus automated. Both methods used a template approach to configure firmware settings using previously collected data. The testing was conducted using a PowerEdge R540 server with an iDRAC 9 as the target server and OME 3.10 as a deployment solution. Testing results do not include any pre-work such as exporting the server SCP server configuration profile from the iDRAC, creating file shares, collecting Dell Service Tag information, setting the initial IP address on the iDRAC, or installing OME.
Steps for a manual approach to server deployment using SCP and ISO
Included are all installation steps until the server is booting from the OS ISO that contains the OS unattended installation information.
Starting from the iDRAC home page after signing in:
- Select configuration from the main tabs
- Select server configuration profile sub-tab
- Select import
- Select network share
- Enter XML SCP file name
- Enter IP address of file share
- Enter share name of file share
- Enter user account / password
- Select All for Import Components
- Select Off for Power state after import
- Click Import
- Click Job to watch configuration task running
- Wait for status to be completed (100%)
- Select Virtual Media sub tab
- Scroll down the page to remote file share
- Enter Image File Path for the file share for the ISO file
- Enter user account / password
- Click Connect
- Once connected click OK
- Select Dashboard from the main tabs
- Select Start the Virtual Console
- Click boot
- From the boot controls menu click Virtual CD/DVD/ISO
- Click Yes to confirm boot action
- Click Power
- Click Power on System
- Confirm Power action
Steps for an automated approach to server delopyment using OME
Starting from the iDRAC home page after signing in:
- From Configuration drop down menu select Auto Deploy
- Click Create
- In the auto deploy template wizard select the required server template
- Select Import CSV
- Click Import CSV
- Select required CSV file contain list of new server tag numbers
- Select Target Group Information
- Select Boot to Network ISO
- Enter ISO path and file name
- Enter IP address of file share
- Enter user account / password
- For target IP setting leave as Don’t change IP settings
- For Target attributes leave unchanged
Test results data
Table 1. Results of testing
Number of servers
| OpenManage Enterprise auto deploy | Manual Config Using iDRAC |
1 | 2 Min 11 Sec | 9 mins 31 secs |
10 | 2 Min 11 Sec | 1 hour 35 mins 10 secs* |
100 | 2 Min 11 Sec | 15 hours 51 mins 40 secs* |
*Projected outcomes based on analysis of results of 1. Customer results may vary.
Advanced features
In addition to the template and ISO deployment, OME offers many advanced features, such as Server-initiated discovery in which new servers are automatically registered with OME through a DNS entry. This negates the need for OME to have a discovery job running to search for new bare metal servers. OME also offers support for stateless servers with the concept of a pool of MAC and WWN addresses that can be allocated and moved as required. This means that zoning and any storage LUN allocation done using MAC addresses and address related based rules becomes mobile between physical servers.
To support the demand for further automation and integration, OpenManage Enterprise provides a RESTful API.
This fully documented API supports all features found on the GUI. Dell also maintains a collection of example PowerShell and Python scripts in the Dell repository on GitHub.
One size does not fit all
Given Dell Technologies’ open approach to servers and the large number of PowerEdge customers, Dell has developed other methods to streamline server configuration, such as:
- Deeper VMware deployment customization available from the OME plugin OpenManage integration with VMware vCenter (OMEVV)
- OME plugin for Microsoft System Center and Config Manager
- Zero touch provisioning built into iDRAC that uses DHCP provisioning options 43 and 60. This method uses an iDRAC SCP xml file that can include OS unattended installation information.
- Integration for ServiceNow, Terraform, and Ansible
- PXE support
- A Dell embedded lifecycle management GUI is included with iDRAC for 1-to1 deployments
A word about unattended OS installs
Using OME to install an OS on the target server(s) requires a level of OS installation automation. This is commonly referred to as an unattended OS installation. For example, Windows Server requires including a bootable ISO image with the unattended installation information contained in an autounattend.xml file to automate the installation. Microsoft’s Windows System Image Manager (WSIM), part of Windows Assessment and Deployment Kit ADK, can be used to create this answer file. A fresh bootable ISO is then created with the answer file in the root and OS install files copied from a standard Microsoft ISO image. You can use the OSCDIMG command line utility, which is shipped as part of ADK, to create a new customized bootable Windows OS unattended installation ISO. OME controls and automates the mounting and booting of this ISO on the target servers’ iDRACs during the deployment task.
Summary
Customers can realize the benefits of the deployment automation built into OpenManage Enterprise with ease. These benefits multiply as the number of servers you are deploying increases. Taking the 100-server example, it takes over 15 hours of administrator time to complete the task manually, but only 2 minutes 11 seconds of administrator time to perform the deployment using OME. Our testing showed that using automation brought major benefits, not only in administration time saved but also in accuracy, repeatability, predictability, and of course, efficiency.
References
- Support page for Dell OpenManage Enterprise
- List of OME Documentation including User Guide, API Guide, and Support Matrix
- Support Page for OpenManage Enterprise Integration for VMware vCenter (OMEVV)
- Support page for Integrated Dell Remote Access Controller 9 (iDRAC9)
- GitHub Dell OpenManage Ansible Modules
- Dell Technologies Developer
- Zero-Touch Bare-metal-Server Provisioning Using iDRAC9 with Auto Config
- Dell iDRAC9 v4 SCP OS deployment (video)
[1] Based on internal testing at the Dell TME server lab, October 2023.

Dell PowerEdge is uniquely positioned for IPv6 game changer

Fri, 04 Aug 2023 12:00:13 -0000
|Read Time: 0 minutes
Introduction
The complexity of today’s infrastructure along with recent government regulations is driving major changes in infrastructure deployment. One such change is the transition from Internet Protocol version 4 (IPv4) to Internet Protocol version 6 (IPv6).
With the rapid growth of the Internet and the increasing number of connected devices, IPv4 addresses are becoming scarce. This scarcity is referred to as address exhaustion. As a result, service providers have started charging a premium price for continued use of IPv4 and in some cases leasing the network addresses. This practice is encouraging the transition to IPv6.
Address exhaustion particularly affects vertical industries such as telecommunications where the need for network addresses continues to grow. At the close of 2021, mobile service subscriptions reached 5.3 billion individuals, equivalent to 67 percent of the world’s population. From now until 2025, there will be more than 400 million new mobile subscribers[1].
While IPv4 allows for about 4.3 billion unique IP addresses, IPv6 expands this number to an almost limitless and astonishing number of possible addresses using 128-bit addresses (2128), allowing 340 undecillion, or approximately 3.4 x 1038, unique IP addresses. To illustrate the size of this number, if every square meter of the earth’s surface was assigned an IPv6 address, there would be enough addresses to cover the entire surface of the earth more than seven billion times. Therefore, we do not anticipate running out of IPv6 addresses anytime soon.
Many organizations, including communication solution providers, are upgrading their network infrastructure to support IPv6.
Security and performance benefits of IPv6
In addition to providing more network addresses, IPv6 provides many other benefits over IPv4. IPv6 provides customers with better end-to-end connectivity, simplified network management, and improved security:
- Improved network performance—IPv6 provides numerous benefits that can improve network performance. For example, the reduced need for fragmentation of packets helps reduce latency and improve network performance. Additionally, IPv6 supports larger packets that help reduce overhead and improve network throughput.
- Simplified network management—IPv6 simplifies network management through multiple features, including:
- Route aggregation—IPv6 can be deployed using a hierarchical address allocation method. This method facilitates route aggregation across the Internet, which limits the growth of routing tables.
- Autoconfiguration—IPv6 devices can independently autoconfigure themselves when connected to other IPv6 devices. This action simplifies network configuration. IPv6 includes multiple autoconfiguration options, including support for stateless address autoconfiguration (SLAAC) and Dynamic Host Configuration Protocol (DHCP) v6, which can help simplify managing an address. In addition, it can add security by preventing attacks such as DHCP spoofing.
- Enhanced security—IPv6 provides enhanced security features that are not available in IPv4. For example, IPv6 has integrated support for Internet Protocol Security (IPsec), and when enabled it provides end-to-end encryption and authentication.
Government mandates accelerate the adoption of IPv6
Some governments and regulatory bodies have mandated the use of IPv6 in various sectors, such as telecommunications, government networks, and critical infrastructure.
In 2020, the US government issued OMB M-21-07 directing all federal agencies to enable IPv6-only networks and services starting in 2023, with the goal of 80 percent completion by 2025. The directive also acknowledges that IPv6 offers significant benefits such as improved network performance, enhanced security, and future-proofing. The latest National Cybersecurity Strategy Paper from March 2023 specifically states that steps must be taken to mitigate the slow adoption of IPv6.
The United States government has strongly advocated for IPv6 adoption and uses the USGv6 program for strategic planning and acquisition policies. The program requires OEMs and product vendors to test their products according to the USGv6-r1 specifications at accredited test labs.
USGv6 validated RFC 2460 at Layer 3, which had a denial-of-service vulnerability. USGv6r1 provides many improvements over USGv6. These improvements include addressing the denial-of-service vulnerability by validating RFC8200/8201, and IPv6-only support within the application. By testing on Dell hardware, Dell Technologies also validates Layer 2 NIC compliance for devices that provide IP off-loading functionality. USGv6-r1 went into effect as of November 2022.
The drive to adopt IPv6 is not just restricted to North America; task force-like groups are emerging worldwide. To help with the global adoption, the IPv6 Forum, a worldwide consortium focused on providing technical guidance for the deployment of IPv6, launched a single worldwide IPv6 Ready Logo Program. This conformance and interoperability testing program is intended to increase user confidence by demonstrating that IPv6 is now available and ready to use. India and Malaysia also have IPv6 certification programs for telecommunication equipment compliance. The specifics of these programs, including their focus, certification authority, requirements, and target audience vary depending on the guidelines and objectives set forth by the respective governments.
Table 1. Worldwide IPv6 certification programs
Program | Market | Layer 3 | Dell products |
USGv6-r1 | United States | X |
Note: See the InterOperability Laboratory (iol) USGv6-r1 Product Registry at https://www.iol.unh.edu/registry/usgv6?name=dell&test_lab=All |
USGv6 | United States | X |
|
IPv6 Ready Logo | Worldwide | X |
|
TEC MTCTE | India | X |
|
MCMC IPv6 | Malaysia | X |
|
Dell’s industry-first certification
To uphold these standards and help organizations achieve their adoption goals, Dell PowerEdge servers now offer IPv6-only support. This support enables federal agencies and critical infrastructures to comply with the government’s directive and take advantage of the many benefits of IPv6.
Dell Technologies is proud to be the first company to provide USGv6r1 capabilities with our PowerEdge servers and Unity-XT storage products. These capabilities are a significant milestone for Dell Technologies and the industry. We are excited to see the positive impact on our customers’ networks.
Dell Technologies provides key features with both our PowerEdge servers and our Unity-XT storage products, offering a fully capable solution to Dell customers from the operating system, base management controller (BMC), and storage.
- The Dell PowerEdge server is the first server in the industry to be USGv6r1- and IPv6 Ready Logo 5.1.2-compliant while running the
- Red Hat Enterprise Linux 8.4 and greater operating system
- Applicable versions of the Windows 2019 operating system
- Applicable versions of the Windows 2022 operating systems
- Dell PowerEdge iDRAC9 with 5.10.00.00 firmware is the first BMC to be “IPv6-only” compliant and validated on the USGv6R1 register, and Ready Logo 5.1.2 compliant.
- Unity-XT is the first storage product to meet the USGv6r1 profile capability requirement IPv6-Only Functional v1.1.
Conclusion
Although IPv6 has been available for more than two decades, it is still a relatively new technology. Some customers might not be ready to transition. However, our responsibility as a technology leader is to push the industry forward and to offer our customers the latest and most advanced technologies. In addition to the benefits of IPv6-only support, Dell PowerEdge servers offer exceptional performance, reliability, and security features. With PowerEdge servers, Dell customers can be confident that they are getting the best of both worlds: the latest and most advanced technology combined with the exceptional quality and performance for which Dell Technologies is known.

OpenManage Enterprise Integration for VMware Virtual Center Overview
Thu, 27 Apr 2023 19:52:10 -0000
|Read Time: 0 minutes
Summary
OpenManage Enterprise Integration for VMware vCenter (OMEVV) offers extensive functionality to manage Dell PowerEdge server hardware and firmware from within VMware vCenter. Delivered as a simple virtual appliance, OpenManage Enterprise, with its integration for VMware vCenter plugin architecture, has no dependence on local software agent installations on the managed hosts. This tech note highlights the key features of the plugin which provides deep level details for inventory, monitoring, firmware updating, and deployment of Dell servers, all from within the vCenter console GUI.
IT administrators face many challenges managing physical servers in VMware environments. This process can be complex and time-consuming. VMware vCenter provides a scalable platform that forms the foundation for VMware software management of these environments. The addition of OpenManage Enterprise Integration for VMware vCenter allows IT administrators to manage both their virtual and physical infrastructure from within vCenter, thus dramatically simplifying overall management. Additional PowerEdge menu options are added in vCenter, alongside Dell server data, to monitor and manage physical servers. These options also include semi-automated updates of server firmware and bare-metal deployment of ESXi hypervisor on Dell PowerEdge servers, including modular systems.
OpenManage integration architecture
OpenManage Enterprise Integration for VMware vCenter is a plugin to the OpenManage Enterprise virtual appliance for server management. The OpenManage Enterprise virtual appliance is a virtual machine image that can be deployed easily containing Dell’s server management software. It can be installed on any ESXi, Microsoft Hyper-V, or Red Hat Linux KVM host.
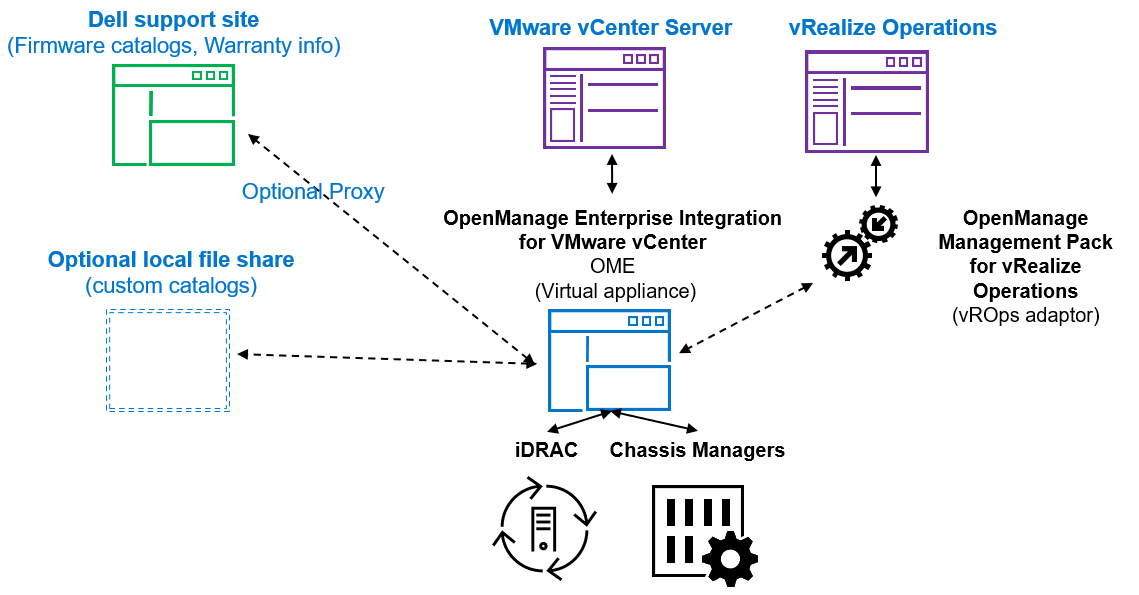
Figure 1. High level architecture (vRealize Aria, previously known as vROps or vRealize Operations, integration is expected to be released 2nd half 2023)
The OpenManage integration provides native integration into the vCenter Server console interface. It helps make the vCenter console the single pane of glass to manage both the virtual and physical environments. The integration goes beyond a simple “link and launch” to existing Dell system management tools. Instead, it brings server management tasks and server data natively into the vCenter console. An API interface is also supported for customers who want to automate or integrate with additional tools. VMware administrators do not need to learn to use additional tools for many of the PowerEdge management tasks because these are integrated into the menus that they are already familiar with within vCenter.
Managing Dell hosts
OpenManage Integration provides deep level details for inventory, monitoring, and alerting of Dell hosts (that is, physical servers) within vCenter and recommends or performs vCenter actions based on Dell hardware events. From the OpenManage Enterprise Plugin, administrators can view details of managed servers.
The dashboard view provides the health status of the monitored clusters and physical servers alongside host information, including warranty status. It also provides appliance information, such as the number of vCenters monitored, baseline compliance status, and OMEVV job status.
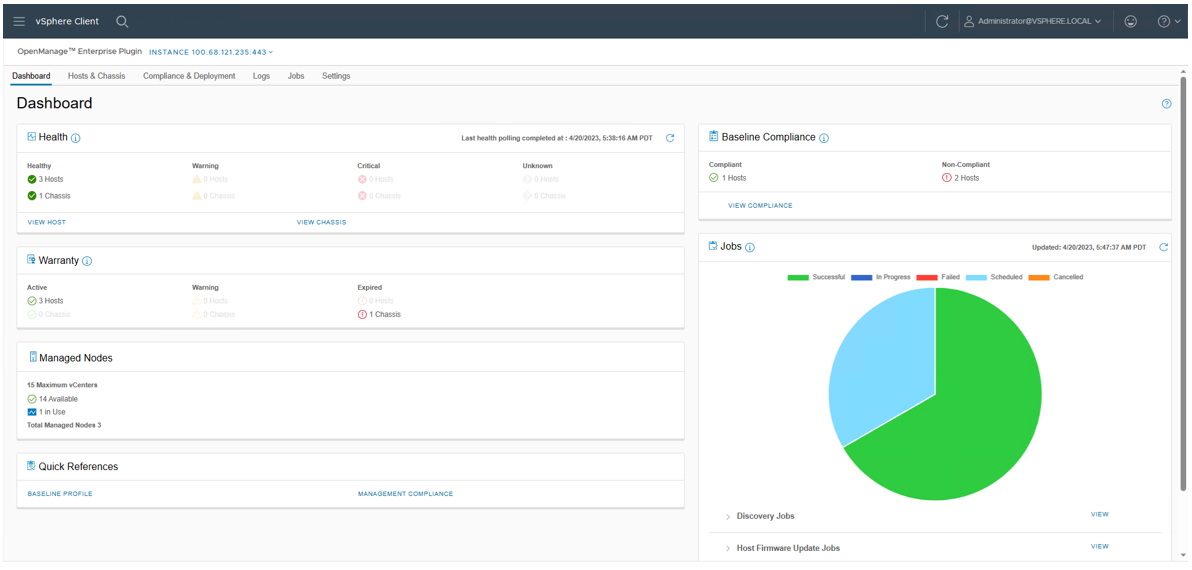
Figure 2. OMEVV Dashboard
At the Hosts & Chassis level, the view provides the health status of the physical server. It also displays server details including power status, iDRAC IP, model name, service tag, asset tag, warranty data, last inventory scan, ESXi Hypervisor version, and core firmware versions.
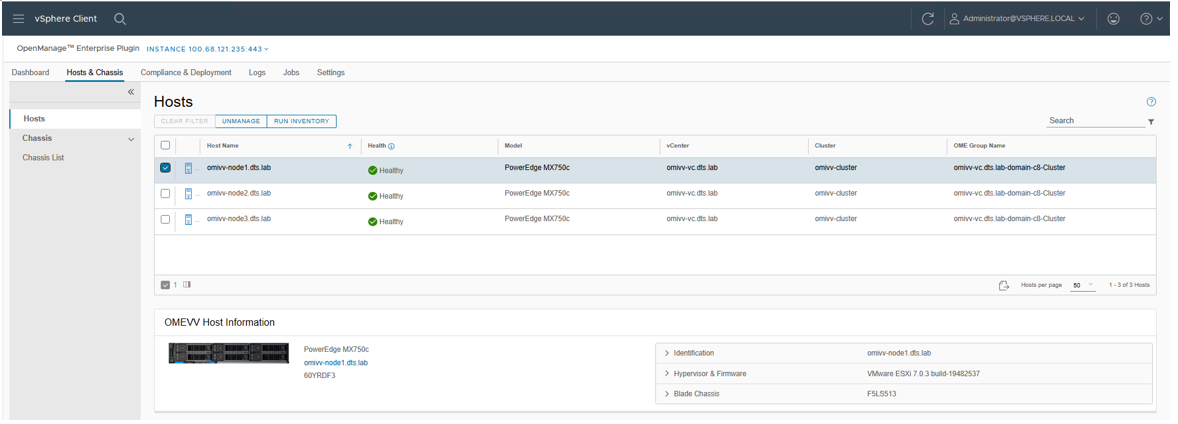
Figure 3. OMEVV list of managed hosts
The vSphere inventory view provides additional details. At the host level, the OMEVV host information view provides deeper server and component details, along with data, about local storage. It also includes server information, such as comprehensive firmware version reporting, power usage data, iDRAC IP address, Service Console IP, warranty type with expiration information, and recent system event log entries. The System Event Log (SEL) provides details such as iDRAC login events, firmware update jobs, and server reboots. Host subsystem health is displayed in the host summary area; detailed component health is available in OpenManage Enterprise.
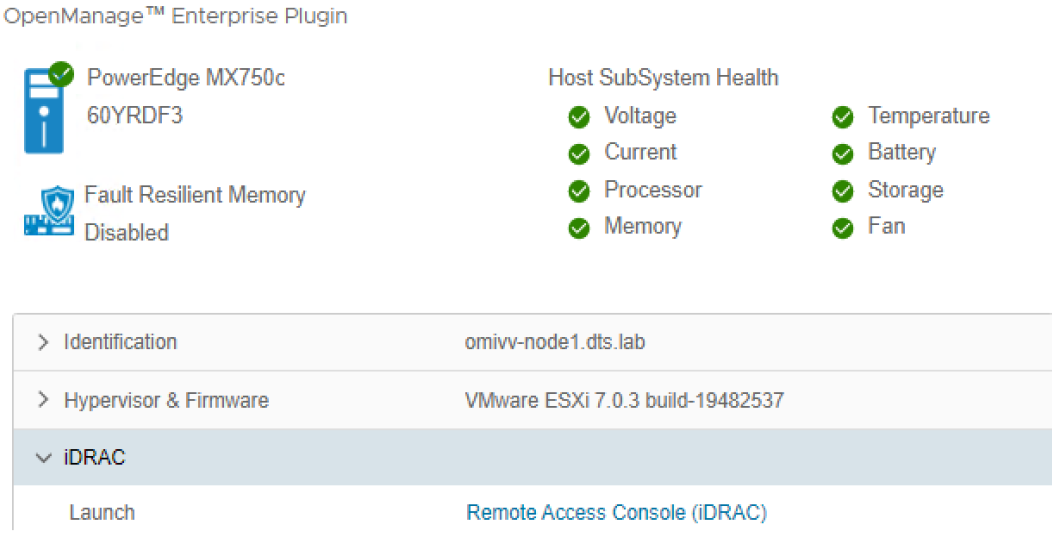
Figure 4. OMEVV server and component health
There are a few prerequisites to meet for a Dell server to be managed by OMEVV, such as licensing requirements and minimum firmware versions. The OMEVV management compliance wizard ensures that the hosts have met these requirements. After it is discovered and selected as a managed host, a server will appear in the OpenManage Enterprise plugin group for OMEVV and in the list of managed hosts in the OMEVV plugin (see Figure 5).
For detailed steps about how to use the configuration wizard, see the OpenManage Integration User Guide. Although VxRail monitoring is supported by the core OME console, and the power manager plugin will manage VxRail power and thermal data, OMEVV does not support VxRail because VxRail has its own life cycle management solution. For more information about supported server models and iDRAC versions, see the OMEVV support matrix and the OpenManage Enterprise support matrix.
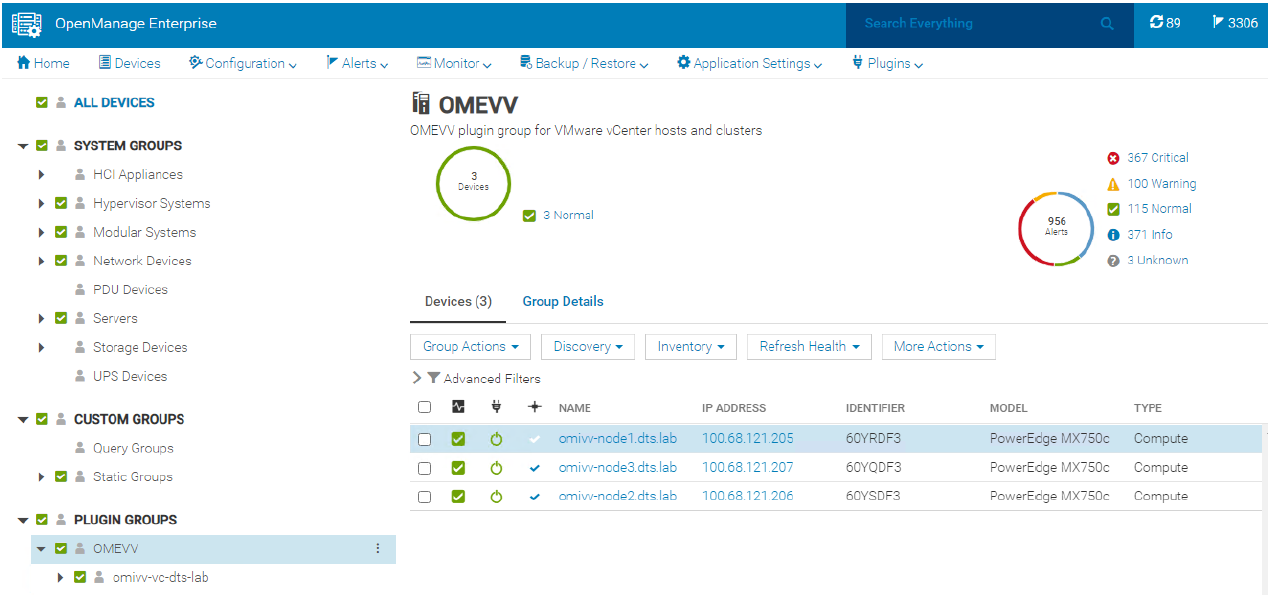
Figure 5. OMEVV managed server group in OME
Proactive automated actions to hardware alerts
The OpenManage Integration contains a predefined list of hardware events with recommended actions within vCenter which are triggered by Dell hardware events. Critical hardware alarms, such as loss of redundant power, can be enabled to put the affected host into VMware maintenance mode. If VMware DRS is configured, the VMs are evacuated by vMotion to another VMware host in the cluster. (Note: By default, all Dell alarms are disabled.) This is called VMware proactive High Availability (PHA) and is a vCenter feature that works with OMEVV. Customers can override the default severity assigned by Dell for these events to allow them to be tailored.
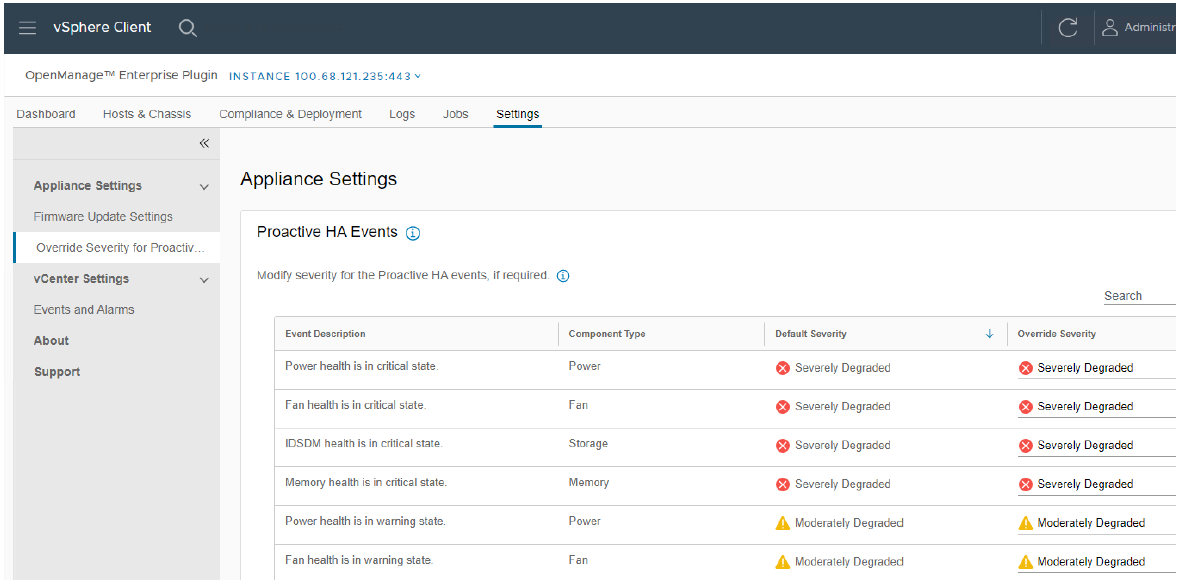
Figure 6. Example server event alarms severity
Updating Dell server BIOS and firmware
Within the vCenter console, users can view BIOS / firmware versions, compare them to desired versions, and perform updates at the host or cluster level. This feature supports Dell 13G, 14G, 15G, 16G, and future generation servers with either iDRAC express or iDRAC enterprise. OMEVV offers cluster aware firmware updates where updates run sequentially one host at a time across the entire cluster, putting the target host into maintenance mode and using DRS to migrate virtual machines hot to ensure workloads are kept running. This firmware update feature can run tasks concurrently in parallel on up to 15 different VMware clusters simultaneously. This functionality is also supported by registering OMEVV as a Hardware Support Manager (HSM) for VMware vSphere Life Cycle Manager vLCM. vLCM is a VMware supplied tool that coordinates the OMEVV firmware updates in conjunction with ESXi software updates, including drivers and hypervisor patches, offering administrators an easier way to update the entire cluster.
The integrated firmware update process is wizard-based, allowing the selection of the new firmware level(s), targeting all or selected component(s), and scheduling the update. A baseline profile contains the location of the catalog/repository detailing required firmware versions and the target host(s) to be associated with the profile. If the host does not have internet access to the Dell support site, you can use Dell Repository Manager to create a local repository for use with OMEVV within the firewall or in air gapped environments.
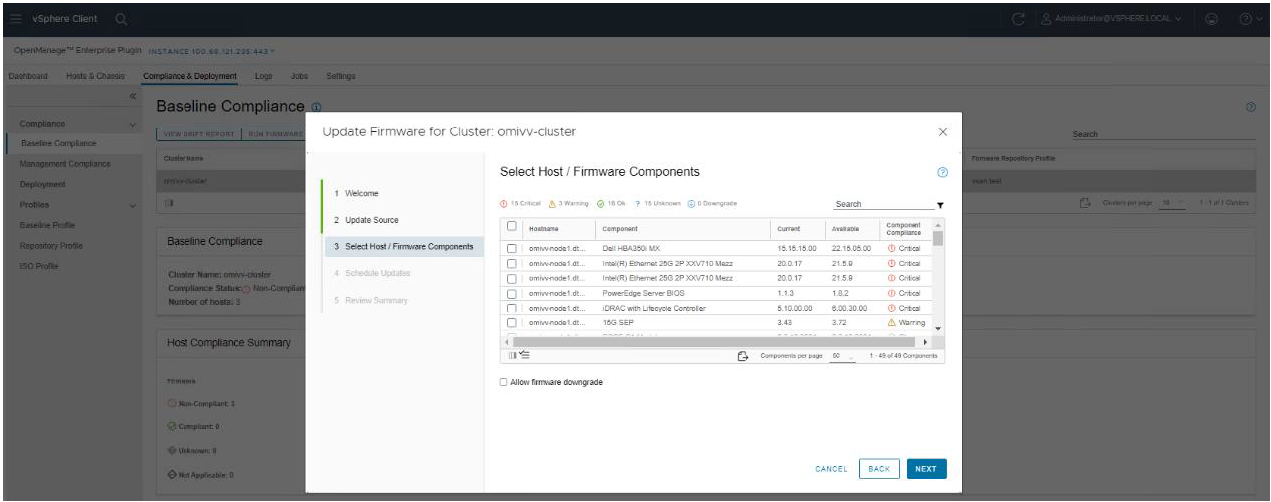
Figure 7. Firmware compliance / available upgrades
Dell publishes:
- Default firmware catalogs containing the latest released firmware. When using this, customers should check compatibility with the installed version of ESXi.
- Firmware catalogs for the Dell customized ESXi image non-vSAN (IOS file) to streamline deployments.
- Firmware catalogs specific for vSAN that support the VMware compatibility matrix. The vSAN firmware catalog has the specific firmware versions for supported vSAN components, such as HBAs when used with the corresponding Dell customized ESXi image. When OMEVV discovers a host running vSAN, OMEVV prevents the use of the default Dell firmware catalog for updates.
Together these three elements provide an easy path to the desired cluster state.
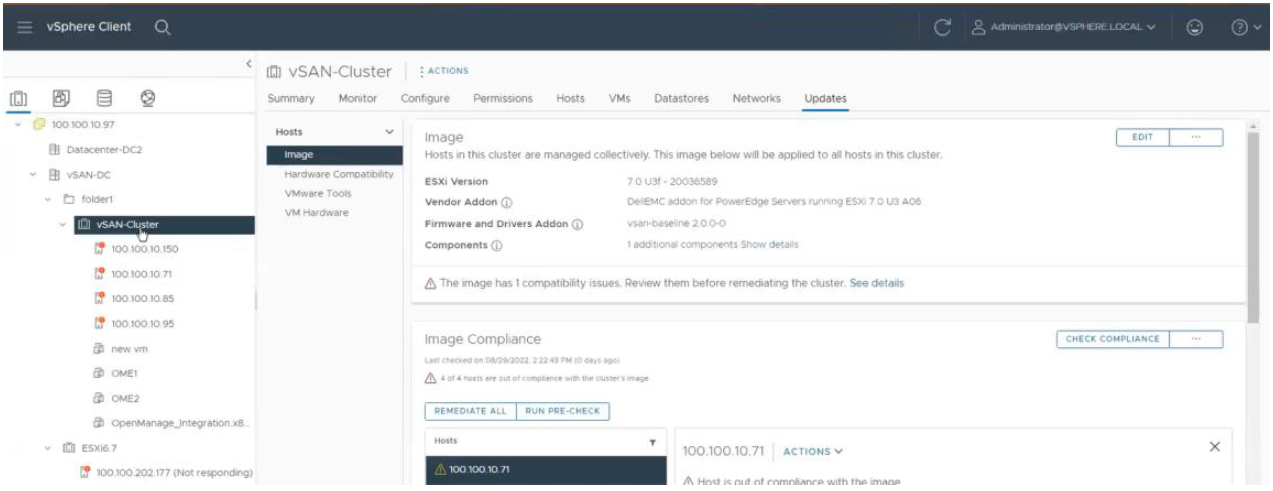
Figure 8. vLCM using OMEVV integration to patch Dell firmware as part of a VMware host update
Deploying the ESXi Hypervisor on new bare metal servers
Another key feature of the OpenManage Integration provides deployment of ESXi on Dell servers without using PXE. It includes the initial discovery, the optional deployment of the ESXi hypervisor with optional vSphere Host Profile, and registration of the host with a selected vCenter. It leverages the iDRAC9 enterprise hardware supported by 14G, 15G, and 16G generation Dell servers.
The deployment feature separates the deployment preparation steps from the actual hypervisor deployment. After a bare metal server(s) has been discovered and appears in the list as compliant, it is ready for the hypervisor deployment. The deployment wizard collects details of the target servers, the ISO OS image file, the vCenter Destination Container, and the optional VMware ESXi host profile. This optional host profile encapsulates deeper configuration template of the ESXi install. The deployment information includes details such as the settings of vCenter instance, host name, host IP address, new password, NIC for management tasks, is collected by the wizard with common data being applied across all target hosts. A deployment job can be run immediately or scheduled.
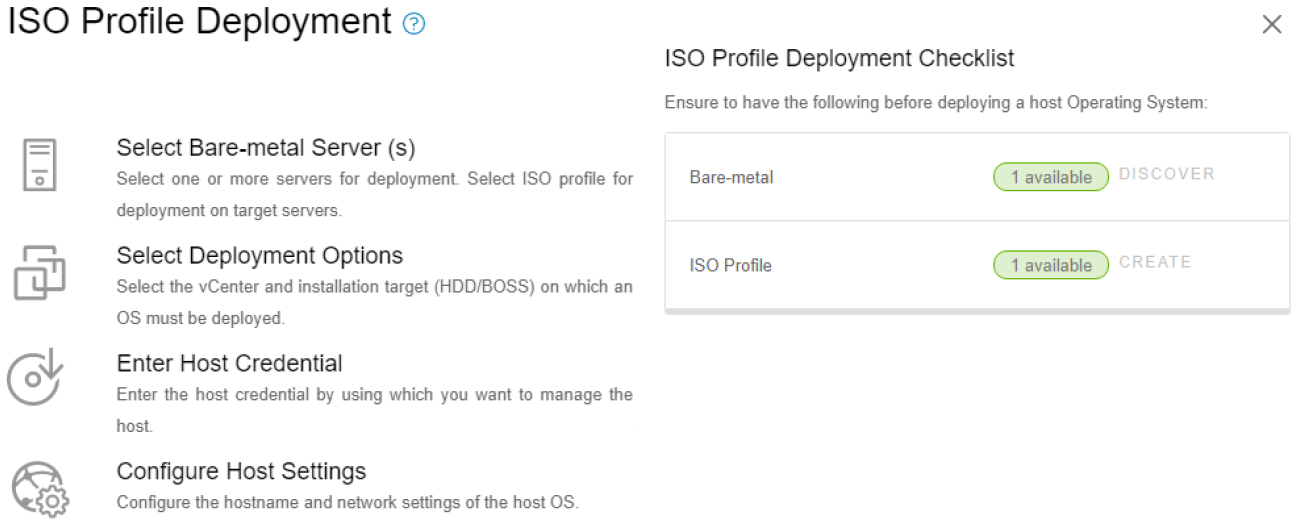
Figure 9. Bare metal server deployment wizard
Dell chassis discovery and monitoring
OMEVV allows administrators to discover and monitor chassis details including hyperlinks to OME-M, related hosts, inventory, firmware, and warranty.
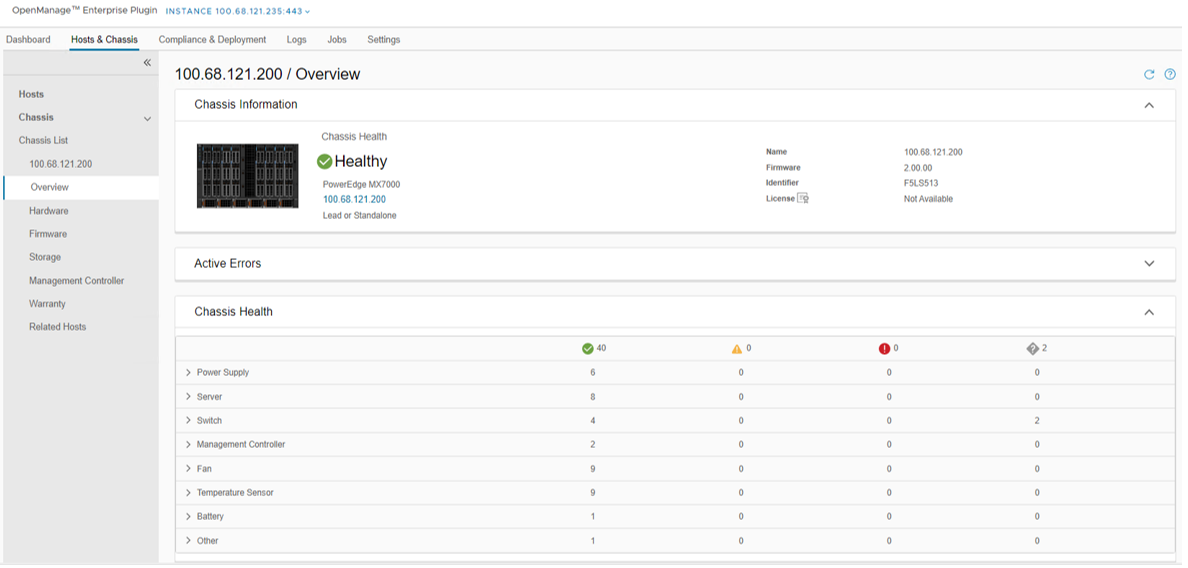
Figure 10. MX chassis management information
Conclusion
The integration of OpenManage Enterprise with VMware vCenter provides a comprehensive, highly automated, end-to-end combined physical and virtual system management platform. OMEVV replaces the legacy standalone OMIVV, with only the new OMEVV supporting vSphere 8 and the latest server hardware. It enables host health monitoring, firmware update and bare metal deployment from within vCenter. It removes the complexities associated with manual processes and helps to avoid shuffling between multiple tools. This integration assists customers to reduce cost through a centralized, scalable, and customizable approach which is designed to enable and significantly simplify the management of Dell PowerEdge servers and modular chassis in a VMware environment.
References
- OMEVV manuals, including User Guide, Support Matrix, and API Guide Documentation
- API interactive explorer Developer Hub
- OpenManage Enterprise Support Site
- OpenManage Enterprise 3.10 Support Matrix
- Temporary OMEVV trial licenses can be downloaded here
- A downloadable catalog of supported and certified Dell firmware for VMware:

Non-Dell Server Support in OpenManage Enterprise Power Manager
Wed, 12 Apr 2023 14:19:03 -0000
|Read Time: 0 minutes
Summary
The monitoring and management of power consumed by servers has become a priority for many organizations, whether due to cost of energy, carbon emission reduction commitments, or facility limitations. In January 2023, Dell released OpenManage Enterprise Power Manager version 3.1. One major feature of this release was the addition of support for a limited number of non-Dell servers. This Direct from Development tech note describes the new capabilities that customers can access to support HPE iLO5 and Lenovo XCC enabled servers.
Market positioning
OpenManage Enterprise is Dell’s server lifecycle management console, with the ability to discover, deploy, monitor, update, manage, and report. Power Manager is a plug-in that adds additional power and thermal capabilities to the core management console. The Dell Product Group recognizes that not all customers have a 100 percent PowerEdge fleet and so need to monitor more than just Dell servers.
Discovery and reporting
Non-Dell servers are discovered through their baseboard management controllers—iLO5 or XCC. An IP address and login credentials are all that is required. All non-Dell servers discovered in OpenManage Enterprise are automatically listed under the Non-Dell Servers group, as shown here:
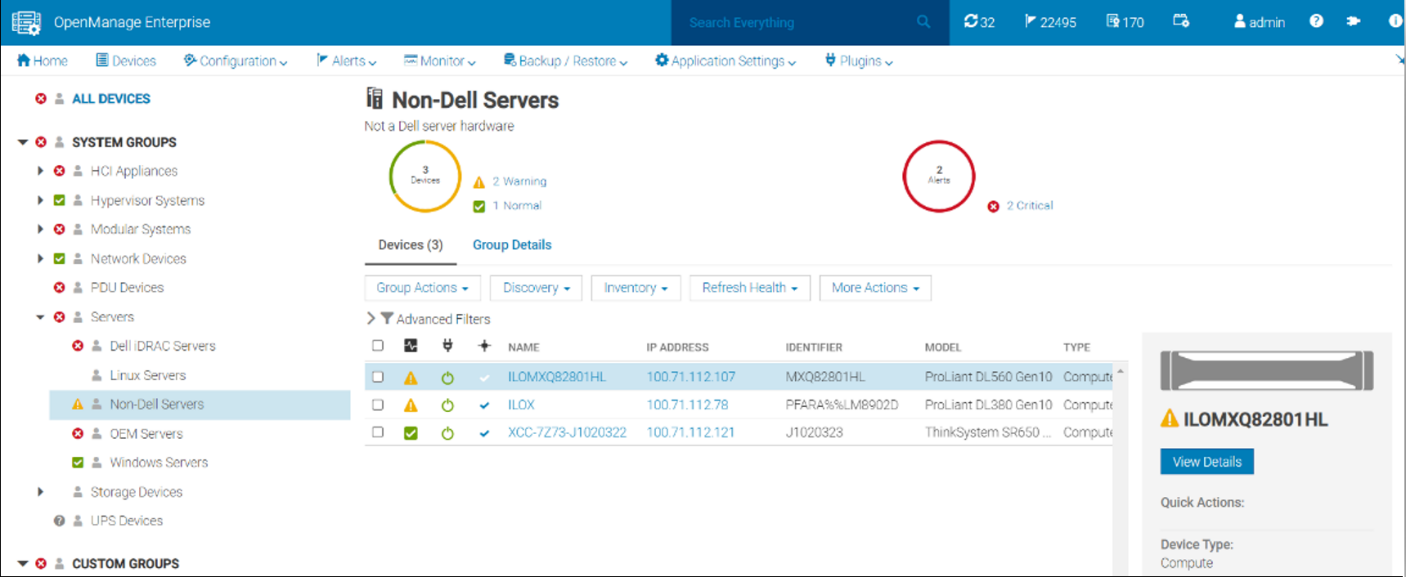
Figure 1. Example of the Non-Dell Servers group showing HPE ProLiant DL and Lenovo ThinkSystem servers
Once the servers are discovered, Power Manager can monitor the power and thermal telemetry. This data is processed and then displayed through “applets,” as shown in Figure 2 and Figure 3. A RESTful API enables customers to build additional automation and report tools if required. Sample code is posted by Dell on GitHub.
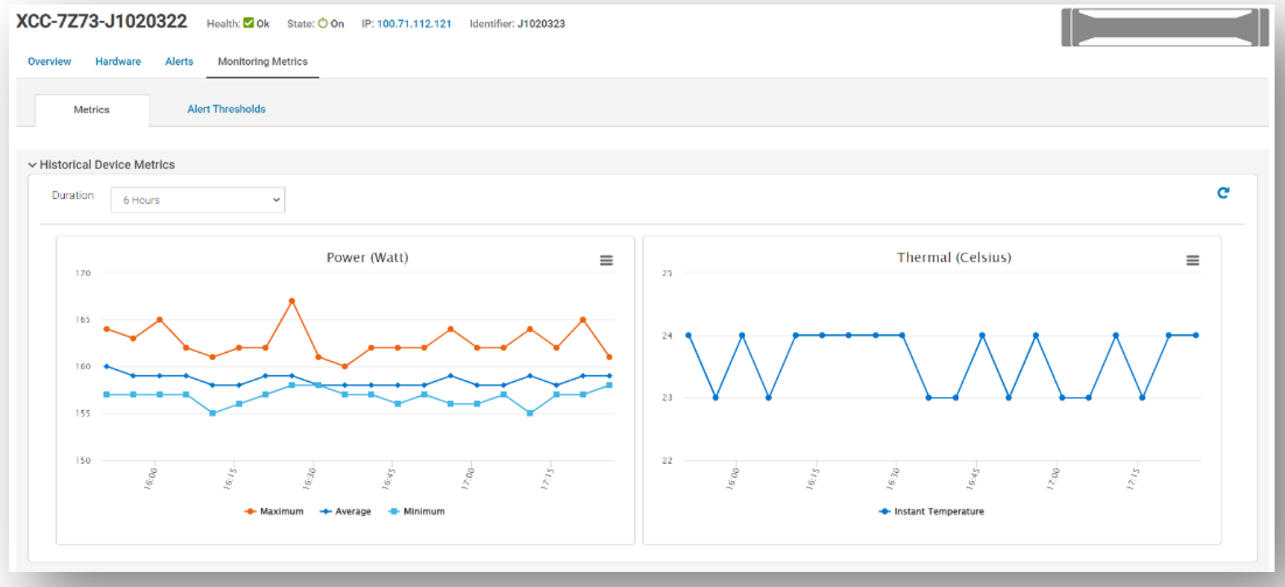
Figure 2. Example of power and thermal metrics for a non-Dell server
There are numerous prebuilt reports that now include this non-Dell server data, such as maximum power (watts). This data is also available in the custom report builder. These reports can be run ad hoc or scheduled to be emailed on a regular basis. These reports support export in HTML, CSV, PDF, and XLS formats.
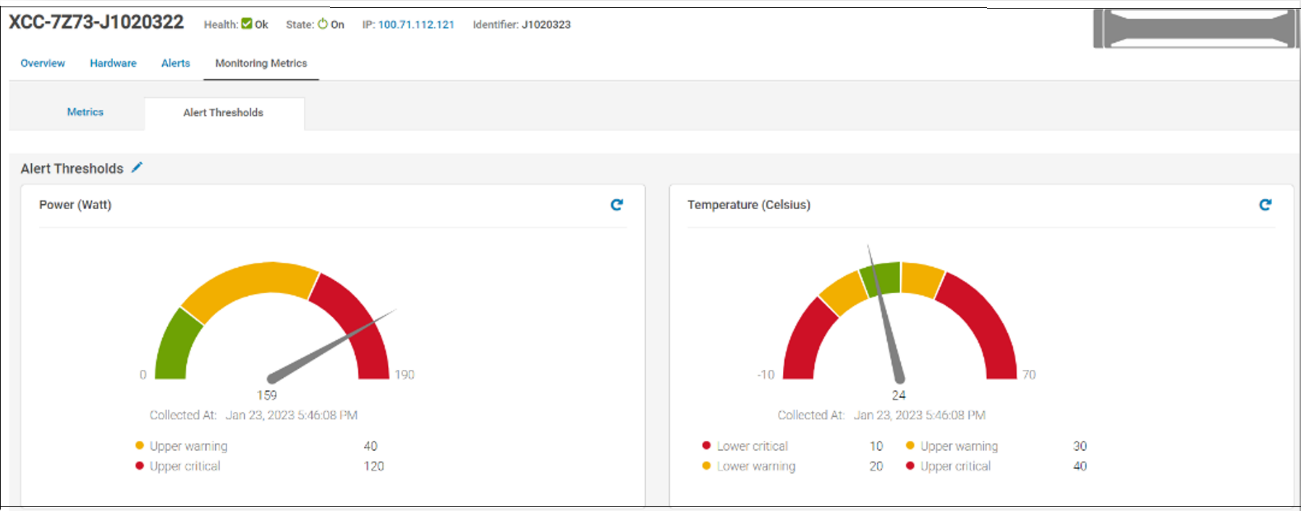
Figure 3. Example of alert thresholds for non-Dell servers
References
- Power Manager documentation: Support for Dell OpenManage Enterprise Power Manager
- Interactive API explorer: Dell API Catalog Guide

Reduce Server Power Usage and Save Money with Power Manager
Mon, 16 Jan 2023 18:41:07 -0000
|Read Time: 0 minutes
Summary
Between the substantial rise in energy costs and organizations’ sustainable initiatives to reduce global warming, lowering data center power usage is a key strategy for many IT teams. This Direct from Development Tech Note describes the capabilities of Dell OpenManage Enterprise Power Manager version 3.0, which is a fully integrated extension to Dell OpenManage Enterprise. Power Manager provides increased visibility of server power data, including consumption, anomalies, and utilization. Customers can use this tool to discover and then proactively manage server power consumption plus server thermals while also assessing their carbon footprint.
Introduction
The phrase “you can’t manage what you can’t measure” is often attributed to W. Edwards Deming, the statistician. In terms of server power usage, this adage means that organizations need data plus tools to manage and lower server power usage, resulting in a reduced carbon footprint. With Dell OpenManage Enterprise Power Manager, PowerEdge customers can both monitor and actively manage server power usage. In addition to reporting power and thermal data, Power Manager can also cap server power consumption and manage thermal events. Version 3.0 also introduces a new carbon usage calculation feature for customers who want to understand their server estate emissions.
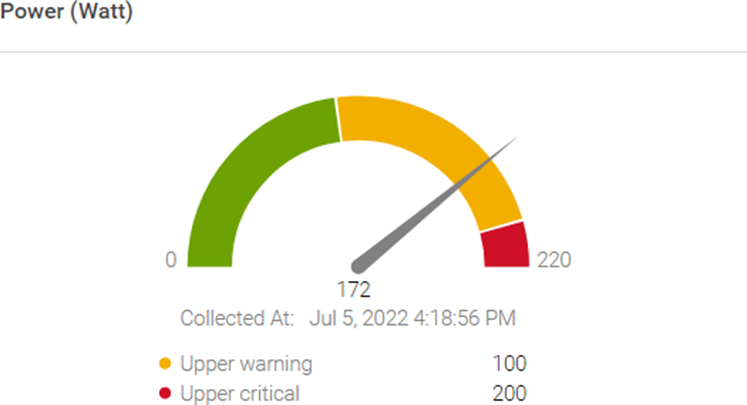
Figure 1. Server power usage data and threshold
Power reduction strategy
OpenManage Enterprise Power Manager supports creating a power reduction strategy easily and efficiently through several key elements.
Current usage
Discovering the current usage across an entire server estate is simple. Each managed server’s iDRAC gathers various metrics, such as power consumption, thermal utilization, and server utilization. OpenManage Enterprise collects and displays the data in dashlet graphs (mini dashboards), such as Power History (Watt) (shown in Figure 2). Within the tool, administrators can place servers into racks, aisles, and then data center collections to reflect the real-world environment to assist with reporting and actions. These dashlets offer powerful visualization of the data, from one server to an entire server fleet, for the last few hours or up to an entire year. If required, customers can add power values for unmonitored devices for a more complete view of data center power usage. An OpenManage Enterprise Advanced or Advanced+ license is required on each server to enable Power Manager.
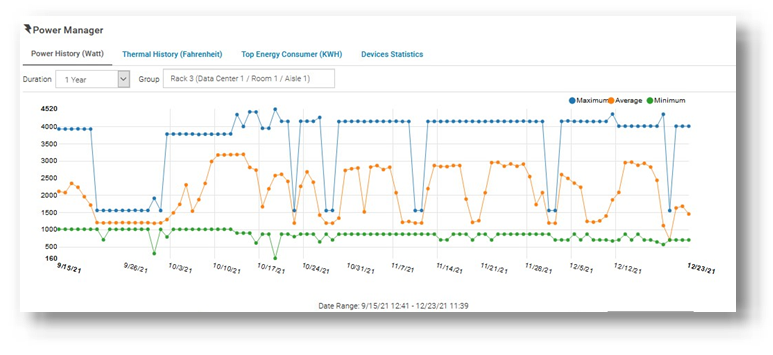
Figure 2. Power history for one group of servers
Review and analyze
Through its dashlets, Power Manager accelerates customers’ understanding by providing relevant data that highlights servers that should be reviewed. These include top energy consumers (kWh), as shown in Figure 3.
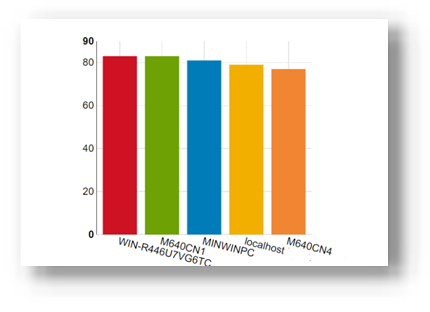
Figure 3. Top energy-consuming servers (kWh)
This data is also consolidated into reports and is available in the custom report builder as well. The prebuilt library contains numerous useful reports, including Power Manager: Server Utilization Report and Power Manager: Power and Thermal Report (shown in Figure 4). These reports highlight underutilized and idle servers that could be candidates for consolidation or decommissioning.
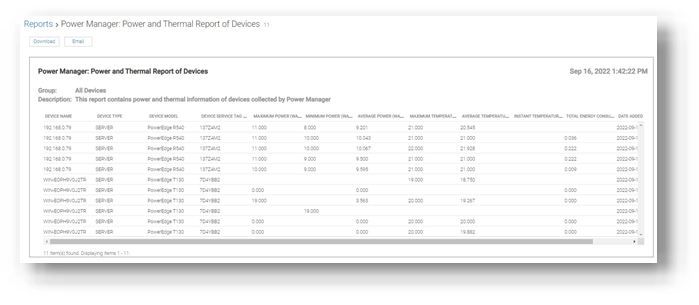
Figure 4. Power and thermal report
Administrators can assess power draw by virtual machines (VMware ESXi and Microsoft Hyper-V hosts) as well as power draw by key components such as CPU, RAM, server fans, and local storage.
Customers who want carbon footprint data can use the integrated greenhouse gas emissions reports that detail energy consumed (kWh) and greenhouse gas emissions per server and per group. All report data can be exported as HTML, PDF, CSV, or XLS, and any report can be run ad hoc or automatically delivered by email on a regular basis through the OpenManage Enterprise report schedule.
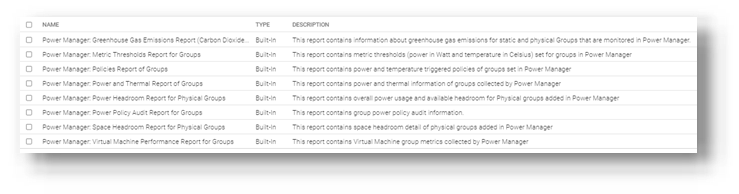
Figure 5. List of power-related reports
Take action
Administrators can consider using power capping during hours that are outside of normal operations or in test and development environments. Modern servers are relatively efficient when idling; however, the introduction of power capping can guarantee low power usage. Administrators can use Power Manager’s static policies to set budget power for a device or group, or even the entire server estate, as shown in Figure 6. Power caps can be set in watts or percentage.
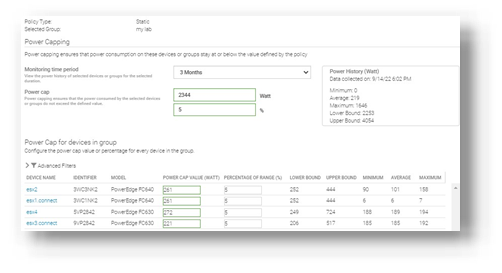
Figure 6. Creating a power-capping policy for multiple servers
For example, an administrator might have no power capping policies during the day when full server performance is required and configure a lower power cap for evenings and weekends when server workload is less.
Additional suggestions to decrease power consumption and carbon footprint include:
- Review and change the server BIOS system profile. For example, change Maximum Performance to Performance Per Watt. Expect Power Manager to manage this profile setting in future releases.
- Replace or consolidate older servers that use outdated CPU technology. Those older servers are not as power- efficient as the latest generation of PowerEdge. Tools such as Dell Live Optics, through which you can review current server operating system performance data such as RAM capacity and storage performance, and Dell Enterprise Infrastructure Planning Tool (EIPT) can help with further investigation and “what-if” migration modeling.
- Improve the overall efficiency of data center cooling, thereby improving power usage effectiveness (PUE). For example, review air flow for more effective cooling, resolving data center hot spots/cold spots, or implement highly efficient liquid-cooled Dell servers.
- Move to renewable energy sources/suppliers to aid in decreasing carbon emissions.
References
- Dell OpenManage Enterprise Power Manager Support site
- Usage of Reports in Data Center through Dell OpenManage Enterprise Power Manager
- iDRAC, CMC, OpenManage Enterprise, OpenManage Integration with Microsoft Windows Admin Center, OpenManage Integration with ServiceNow, and DPAT trial licenses

Server Power Consumption Reporting and Management
Mon, 16 Jan 2023 18:31:46 -0000
|Read Time: 0 minutes
Summary
Between customers’ sustainability initiatives to reduce carbon emissions, and demands to control energy consumption and costs, the ability to report, analyze and action server power usage data has become a key initiative. This DfD tech note explores the rich server power usage data available from Dell PowerEdge servers and the various methods to collect, report, analyze, and act upon it.
What is server power consumption?
A wide variety of server power information is offered by the iDRAC. The amount and frequency of information varies by iDRAC version and licensed features and the choice of optional tools and consoles.
One-to-one and one-to-many
There are multiple ways to view power consumption data from the iDRAC, depending on needs and preferences. One way is to open the web interface GUI. Another way is using scripts, either Racadm or Redfish, to retrieve the data. iDRAC can also send data to the OpenManage Enterprise Power Manager Plugin. OpenManage Enterprise can also forward this information to CloudIQ for PowerEdge. For those customers looking for the ultimate solution, iDRAC9 can stream these power statistics as telemetry data to analytics solutions such as Splunk or ELK Stack for real-time in-depth analysis.
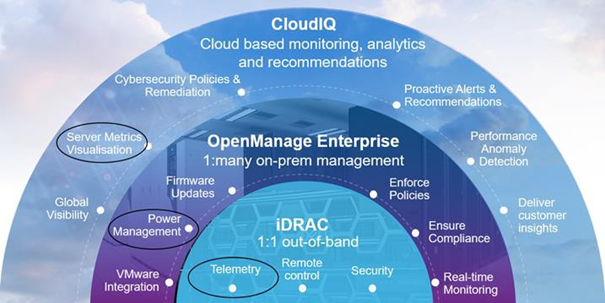
Figure 1. PowerEdge management stack, with power management and data reporting highlighted
PowerEdge server power data
Embedded with every Dell PowerEdge server, the integrated Dell Remote Access Controller (iDRAC) enables secure and remote server access for out-of-band and agent-free server management tasks. Features include BIOS configuration, OS deployment, firmware updates, health monitoring, and maintenance. One key set of data that iDRAC provides is power usage. IT admins have used iDRAC data to view and react to power issues for over 10 years. The iDRAC engineering teams have continued to expand the capabilities within the iDRAC UI as well as the information available to “one to many” consoles such as OpenManage Enterprise. iDRAC9 with Datacenter feature set enabled extends the solution even further with telemetry streaming.
iDRAC
iDRAC monitors the power consumption, processes, and reports continuously at the individual server level. The browser user interface displays the following power values:
- Power consumption warning and critical thresholds
- Cumulative power, peak power, and peak amperage values
- Power consumption over the last hour, last day, or last week
- Average, minimum, and maximum power consumption with historical peak values and peak timestamps
- Peak headroom and instantaneous headroom values (for rack and tower servers)
iDRAC9 provides a graphical view of these power metrics such as the power consumption example shown here.
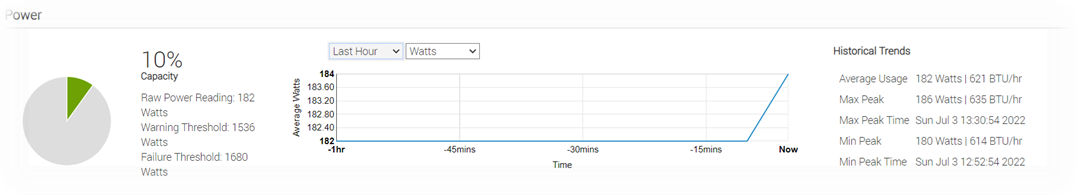
Figure 2. iDRAC9 GUI power consumption data
iDRAC9 connects to all critical server components and, in conjunction with the Datacenter license, can collect over 180 server metrics in near-real-time. These metrics include granular, time-stamped data for critical functions such as processor and memory utilization, network card, power, thermal, and more. iDRAC9 can stream this telemetry data in real time.
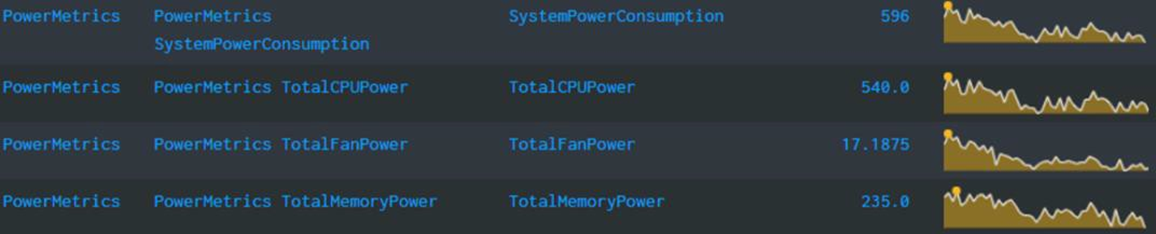
Figure 3. iDRAC power telemetry data collected by Splunk
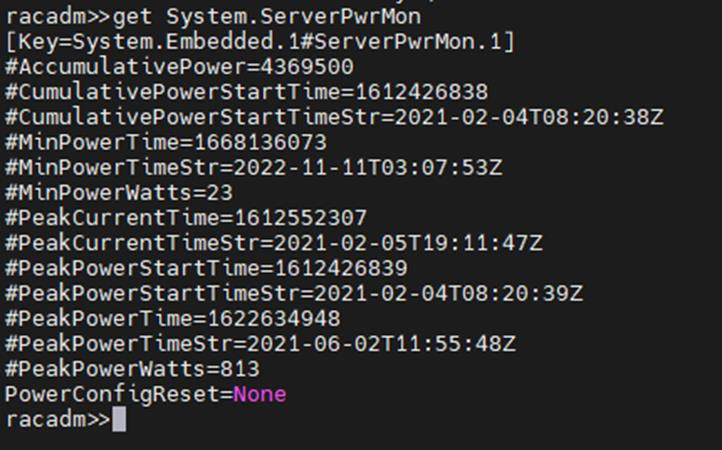
Get Server Power – RACADM CLI Examples
The RACADM command-line provides a basic scriptable interface that enables you to retrieve server power either locally or remotely. In addition to the CLI interface, iDRAC also supports the Redfish RESTful API. Example Powershell and Python scripts that can be used to collect power data can be download from the Dell area in github.com. The RACADM CLI can be access from the following interfaces:
- Local - Supports running RACADM commands from the managed server's operating system (Linux/Windows). To run local RACADM commands, install the OpenManage DRAC Tools software on the managed server.
- SSH or Telnet (also known as Firmware RACADM) - Firmware RACADM is accessible by logging into iDRAC using SSH or Telnet.
- Remote - Supports running RACADM commands from a remote management station such as a laptop or desktop running Windows or Linux. To run remote RACADM commands, install the OpenManage DRAC Tools software on the management station.
Here are some examples using the remote iDRAC9 SSH CLI method, post authentication.
- Instantaneous server power usage:

- Server power stats:
OpenManage Enterprise Power Manager
The Power Manager Plugin for OpenManage Enterprise uses the power data securely collected from iDRACs to observe, alert, report, and, if required, place power caps on servers. For ease of management, servers can be logically grouped together, such as in a rack, a row, or in custom grouping, such as a workload. Using this data, customers can drive data center efficiency in several ways, such as by easily identifying idle servers for repurposing or retirement. Using built in reports or creating a custom report, customers can identify server racks not using their full available power capacity to deploy new hardware without needing additional power. Customers can mitigate risk by detecting when groups of servers are nearing their power capacity during specific timeframes. Using automated policies, customers can maximize power available to business-critical applications by reducing noncritical consumption by using scheduled or permanent power capping.
Important in today’s climate concerns are reports on carbon emissions based on server usage. Power Manager provides reports on the carbon emissions for individual servers as well as racks and custom groups of servers. This information can be used to identify areas of concern and to show progress in carbon emission reductions based on power policies, removal of idle servers, and other initiatives such as consolidation and refresh.
The power data is displayed by applets integrated into OpenManage Enterprise. (See examples in the following figure.) There are also several predefined reports built into the report library designed around power usage. Power Manager automates actions driven by specific power or thermal events, including running scripts, applying power caps, and forwarding alerts. Power Manager collects this power data and stores it for up to 365 days.
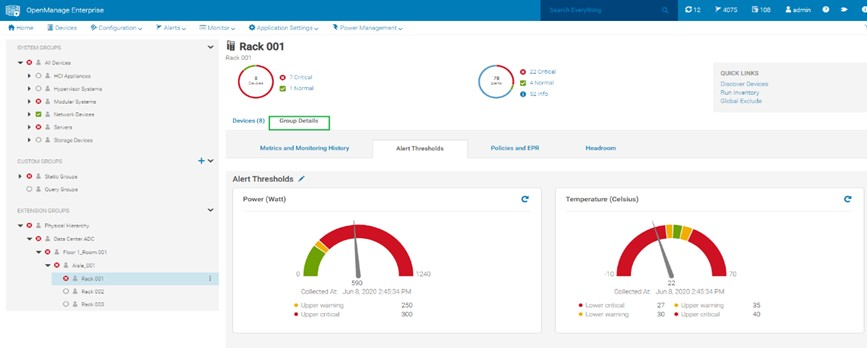
Figure 4. View of a rack group alert threshold graphic for power and thermal
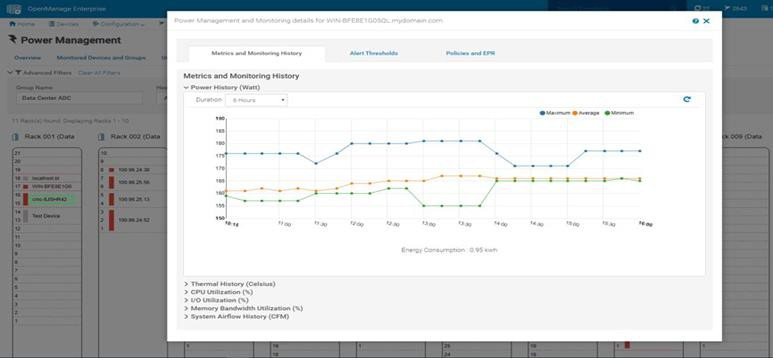 Figure 5. Rack view showing max/min/avg power for the last six hours
CloudIQ for PowerEdge – Reporting Server Power
Another method to visualize and report the power data is by CloudIQ. Utilizing the OpenManage Enterprise CloudIQ Plugin, customers can connect their PowerEdge servers to the Dell hosted CloudIQ secure portal. This is a cloud based software-as-a-service portal, hosted in the Dell data centers, that provides powerful analytic, health, and performance monitoring for servers. CloudIQ can consolidate multiple OpenManage Enterprise instances, providing a truly global view of an organization’s server estate. Within CloudIQ, power data can be graphed and reported on over time. These graphs can easily be exported or emailed as PDFs and the raw data exported as CSV for further reviews. In fact, in addition to collecting power metrics, CloudIQ can track and collect over 50 server metrics for users to review. CloudIQ also interfaces with other elements of Dell’s infrastructure, including storage and networking, giving customers the ability to correlate data, events, and trends across multiple technologies. CloudIQ is offered at no additional cost for all PowerEdge servers with ProSupport or higher contracts.
When power data is collected in CloudIQ, advanced AI algorithms process this data and automatically flag whether the server power usage behavior is outside normal parameters, based on historic data from that particular server.
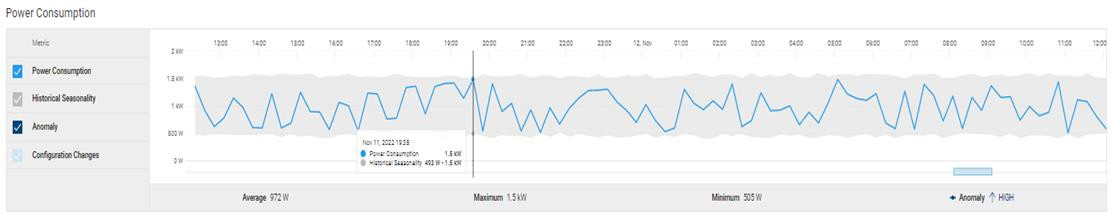
Fiure 6. individual server power data with historical seasonality – no anomaly
Multiple servers can be put onto the same graph, making it easy to identify any rogue behavior by individual servers.
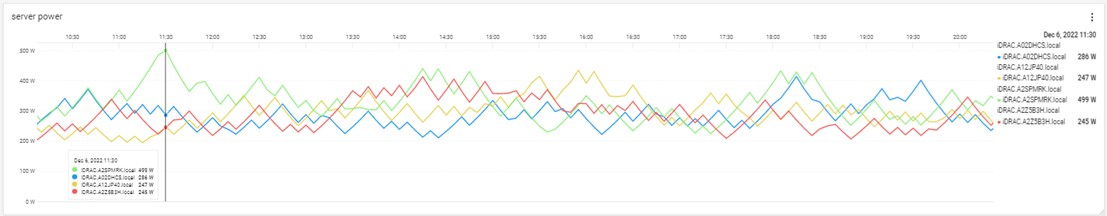
Figure 7. Multi server power usage report
The visualization of this data can be displayed from just hours to a whole year, with the ability to zoom in on a particular time.
Conclusion
Dell PowerEdge servers offer an extensive amount of data about power consumption by the advanced capabilities of the iDRAC. This power information is available on the iDRAC UI, as is telemetry information ready to be consumed by analytic solutions such as Splunk. This information is also accessible from the RACAMD CLI and RESTful API. Dell Technologies’ own one to many management solutions can also collect, collate, and report this information. Dell lets server admins select from a wide variety of tools and methodologies to meet the needs of their datacenter server power management requirements.
References
iDRAC
- Documentation, white papers and videos www.dell.com/support/idrac
- Transform datacenter analytics with iDRAC9 Telemetry Streaming
- iDRAC9 Telemetry Streaming Visualization with Splunk (a Tolly report)
- iDRAC Telemetry and Splunk Video Overview
- How to Integrate iDRAC9 Telemetry Data into the Splunk Platform
- Integrated Dell Remote Access Controller 9 - CLI Guide
OpenManage Enterprise Power Manager
- Documentation, white papers and videos Support for Power Manager
- Reduce Server Power Usage and Save Money with Power Manager
- Improve sustainability through energy insights (a Principled Technology study)
- Guide to OpenManage Enterprise Power Manager API
CloudIQ for PowerEdge
- Documentation, white papers and videos Support for CloudIQ For PowerEdge
- CloudIQ Provides Data Driven Server Management Decisions
GitHub for Dell Technologies, including iDRAC and OME/ Power Manager examples Dell Technologies · GitHub
API guide and landing page for developers including iDRAC & OME/ Power Manager https://developer.dell.com/

The Future of Server Cooling- Part 1. The History of Server and Data Center Cooling Technologies
Mon, 16 Jan 2023 18:15:45 -0000
|Read Time: 0 minutes
Summary
Today’s servers require more power than ever before. While this spike in power has led to more capable servers, it has coincidentally pushed legacy thermal hardware to its limit. The inability to support top- performance servers without liquid cooling will soon become an industry-wide challenge. We hope that by preparing our PowerEdge customers for this transition ahead of time, and explaining in detail why and when liquid cooling is necessary, they can easily adapt and get excited for the performance gains liquid cooling will enable.
Part 1 of this three part series, titled The Future of Server Cooling, covers the history of server and data center thermal technologies - which cooling methods are most commonly used, and how they evolved to enable the industry growth seen today.
The Future of Server Cooling was written because the next-generation of PowerEdge servers (and succeeding generations) may require liquid cooling assistance to enable certain (dense) configurations. Our intent is to educate customers about why the transition to liquid cooling is inevitable, and to prepare them for these changes.
Integrating liquid cooling solutions on future PowerEdge servers will allow for significant performance gains from new technologies, such as next-generation Intel® Xeon® and AMD EPYC™ CPUs, DDR5 memory, PCIe Gen5, DPUs, and more.
Part 1 of this three part series reviews some major historical cooling milestones to help explain why change has always been necessary. It also describes which technologies have evolved over time to advance to where they are today - the historical evolution of thermal technologies for both the server and the data center.
Data centers cannot exist without sufficient cooling
A data center comprises many individual pieces of technology equipment that work together collectively to support continuously running servers within a functional facility. Most of this equipment requires power to operate, which converts electrical energy into heat energy as it is used. If the heat generated grows too large, it can create undesirable thermal conditions, which can cause component and server shutdown, or even failure, if not managed properly.
Cooling technologies are implemented to manage heat build-up by moving heat away from the source (because heat cannot magically be erased) and towards a location where it is safely dispersed. This allows technology equipment within the data center to continue to work reliably and uninterrupted from the threat of shutdown from overheating. Servers from Dell Technologies can automatically adjust power consumption, but without an effective cooling solution the heat buildup within the data center would eventually exceed the capability of the server to operate, creating enormous financial losses for business.
Two areas of coverage
Cooling technologies are typically designated to two areas of coverage - directly inside of the server and at the data center floor. Most modern data centers strategically use cooling for both areas of coverage in unison.
- Cooling technologies located directly inside of the server focus on moving heat away from dense electronics that generate the bulk of it, including components such as CPUs, GPUs, memory, and more.
- Cooling technologies located at the data center floor focus on keeping the ambient room temperature cool. This ensures that the air being circulated around and within the servers is colder than the hot air they are generating, effectively cooling the racks and servers through convection.
Legacy Server Cooling Techniques
Four approaches have built upon each other over time to cool the inside of a server: conduction, convection, layout, and automation, in chronological order. Despite the advancements made to these approaches over time, the increasing thermal design power (TDP) requirements have made it commonplace to see them all working together in unison.
Conduction was the first step in server cooling evolution that allowed the earliest servers to run without overheating. Conduction directly transfers heat through surface contact. Historically, conduction cooling technologies, such as heat spreaders and heat sinks, have moved heat away from server hot spots and stored it in isolated regions where it can either reside permanently, or be transferred outside of the box through an air or liquid medium. Because heat spreaders have limited capabilities, they were rapidly replaced by heat sinks, which are the industry standard today. The most effective heat sinks are mounted directly to heat producing components with a flush base plate. As development advanced, fins of varying designs (each having unique value) were soldered to the base plate to maximize the surface area available. The base plate manufacturing process has shifted from extrusion to machine or die-cast, which reduces production time and wasted material. Material changed from solely aluminum to include copper for use cases that require its ~40% higher thermal conductivity. The following figure provides an example:
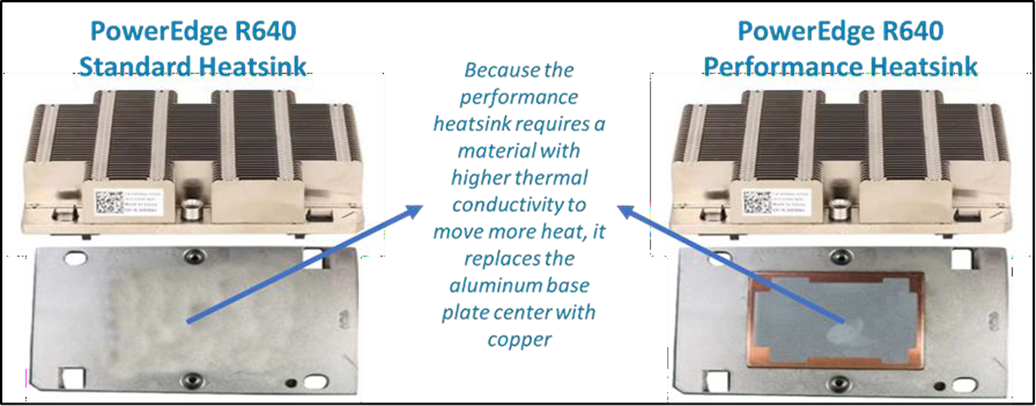
Figure 1. Heat sink base plate uses copper to support higher power
Convection cooling technologies were introduced to server architecture when conduction cooling methods could no longer solely support growing power loads. Convection transfers heat outside of the server through a medium, such as air or liquid. Convection is more efficient than conduction. When the two are used together, they form an effective system - conduction stores heat in a remote location and then convection pushes that heat out of the server.
Technologies such as fans and heat pipes are commonly used in this process. The evolution of fan technology has been extraordinary. Through significant research and development, fan manufacturers have optimized the fan depth, blade radius, blade design, and material, to present dozens of offerings for unique use cases. Factors such as the required airflow (CFM) and power/acoustic/space/cost constraints then point designers to the most appropriate fan. Variable speed fans were also introduced to control fan speeds based on internal temperatures, thereby reducing power usage. Heat pipes have also undergone various design changes to optimize efficiency. The most popular type has a copper enclosure, sintered copper wick, and cooling fluid. Today they are often embedded in the CPU heatsink base, making direct contact with the CPU, and routing that collected heat to the top of the fins in a remote heatsink.
Layout refers to the placement and positioning of the components within the server. As component power requirements increased at a faster rate than conduction and convection technologies were advancing, mechanical architects were pressed to innovate new system layout designs that would maximize the efficiency of existing cooling technologies. Some key tenets about layout design optimization have evolved over time:
- Removing obstructions in the airflow pathway
- Forming airflow channels to target heat generating components
- Balancing airflow within the server by arranging the system layout in a symmetrical fashion
Automation is a newer software approach used to enable a finer control over the server infrastructure. An autonomous infrastructure ensures that both the server components and cooling technologies are working only as hard as needed, based on workload requirements. This lowers power usage, which reduces heat output, and ultimately optimizes the intensity of surrounding cooling technologies. As previously mentioned, variable fan speeds were a cornerstone for this movement, and have been followed by some interesting innovations. Adaptive closed loop controllers have evolved to control fan speed based on thermal sensor inputs and power management inputs. Power capping capabilities ensure thermal compliance with minimum performance impact in challenging thermal conditions. For Dell PowerEdge servers, iDRAC enables users to remotely monitor and tackle thermal challenges with built-in features such as system airflow consumption, custom delta-T, custom PCIe inlet temperature, exhaust temperature control, and adjustment of PCIe airflow settings. The following figure illustrates the flow of these iDRAC automations:
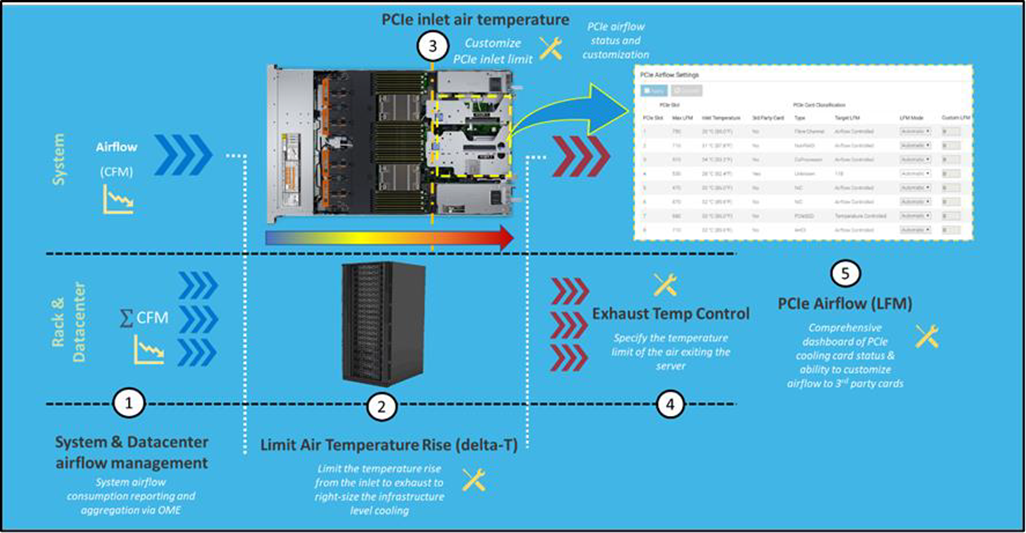
Figure 2. Thermal automations enabled by Dell proprietary iDRAC systems management
Legacy data center cooling techniques
Heat transfer through convection is rendered useless if the intake air being moved by fans is not colder than the heated air within the server. For this reason, cooling the data center room is as important as cooling the server: the two methods depend on one another. Three main approaches to data center cooling have evolved over time – raised floors, hot and cold aisles, and containment, in chronological order. Raised floors were the first approach to cooling the data center. At the very beginning, chillers, and computer room air conditioning (CRAC) units were used to push large volumes of cooled air into the datacenter, and that was enough.
However, the air distribution was wildly unorganized and chaotic, having no dedicated paths for hot or cold airflow, causing many inefficiencies such as recirculation and air stratification. Because adjustments were required to accommodate increasing power demands, the data center floor plan was redesigned to have raised floor systems with perforated tiles replacing solid tiles. This provided a secure path for the cold air created by CRAC units to stay chilled as it traveled beneath the floor until being pulled up the rack by server fans.
Hot and cold aisle rack arrangements were then implemented to assist the raised floor system when the demands of increasing heat density and efficiency could not be met. This configuration has cool air intakes and warm air exhausts facing each other at each end of a server row. Convection currents are then generated, which helped to improve airflow. However, this configuration was still unable to meet the demands of growing data center requirements, as airflow above the raised floors remained chaotic. Something else was needed to maximize efficiency.
Containment cooling ideas propagated to resolve the turbulent nature of cool and hot air mixing above raised floors. By using a physical barrier to separate cool server intake air from heated server exhaust air, operators were finally able to maintain tighter control over the airstreams. Several variants of containment exist, such as cold aisle containment and hot aisle containment, but the premise remains the same – to block cold air from mixing with hot air. Containment cooling successfully increased data center cooling efficiency, lowered energy consumption, and even created more flexibility within the data center layout (as opposed to hot and cold aisle rack arrangements, which require the racks to be aligned in a certain position). Containment cooling is commonly used today in conjunction with raised floor systems. The following figure illustrates what a hot aisle containment configuration might look like:

Figure 3. Hot aisle containment enclosure diagram, sourced from Uptime Institute
What’s Next?
Clearly the historical evolution of these thermal techniques has aided the progression of server and data center technology, enabling opportunities for innovation and business growth. Our next-generation of PowerEdge servers will see technological capabilities jump at an unprecedented magnitude, and Dell will be prepared to get our customers there with the help of our new and existing liquid cooling technologies. Part 2 of this three part series will discuss why power requirements will be rising so aggressively in our next generation PowerEdge servers, what benefits this will yield, and which liquid cooling solutions Dell will provide to keep our customers’ infrastructure cool and safe.

Dell PowerEdge Monitoring using Redfish API to Determine Boot State

Mon, 16 Jan 2023 18:04:41 -0000
|Read Time: 0 minutes
Summary
Dell integrated Dell Remote Access Controller (iDRAC) firmware Redfish API functionality supports using a POST code to determine the stage of the boot process.
Introduction
The Dell integrated remote access controller (iDRAC9) Redfish API is a next- generation systems management interface standard that enables scalable, secure, and open server management. When used for PowerEdge server monitoring, it can be useful to understand the state of the managed server. The most basic information is whether the server is ON or OFF. The next logical set of questions when the PowerEdge server is ON, is what sub-state is the server in, for example, at what stage is the server within the booting process?
The iDRAC9 Redfish API supports the POST code attribute that gives you valuable information on sub-state operation. POST is useful in monitoring your server, in combination with the health status of various components of the server. This data is useful in creating dashboards and reports. It will give you insights on the stages of configuration of items such as the BIOS and storage configurations.
Server boot process stage
The Customer can leverage the Dell OEM action
DellLCService.GetRemoteServicesAPIStatus
This action output lets the customer know whether the server is in POST, and when the server is out of POST.
Server last reboot
For information about the server’s last reboot, refer to iDRAC Life Cycle (LC) logs (URI “redfish/v1/Managers/iDRAC.Embedded.1/Logs/Lclog”), then look for the latest entry logged about server reboot. You can also run a GET on URI:
/redfish/v1/Managers/iDRAC.Embedded.1/Oem/Dell/DellAttributes/S ystem.Embedded.1?$select=Attributes/SystemInfo.1.BootTime
This will report the last boot detected.
Run-level prior to the last reboot
Unfortunately, the iDRAC9 does not know what run level the Linux OS is in. This would be logged within the OS logs.
How do I use the POST code to determine system information on the stage of the server’s boot process?
Using a GET command on the following URI:
Sysinfo1.POSTCode attribute./redfish/v1/Managers/iDRAC.Embedded.1/Attributes gives the Sysinfo.1.POSTCode attribute.
This POST code will show you info on the following stages:
0x00, "Unrecognized Post Code.", 0x01, "System Power On.",
0x02, "CPU Microcode load.", 0x03, "Chipset Initialization.", 0x04, "Memory Configuration.", 0x05, "Shadow BIOS.",
0x06, "Multiprocessor Initialization.", 0x07, "POST processing start.",
0x08, "System Management Mode (SMM)initialization.", 0x09, "PCI bus enumeration & video initialization.", 0x0A, "iDRAC is ready.",
0x0B, "Extended Memory test started.", 0x0C, "Extended Memory test running \\", 0x0D, "Extended Memory test running /", 0x0E, "Extended Memory test completed.", 0x40, "Display sign-on.",
0x41, "PCI configuration.",
0x50, "An issue was detected. System at boot F1/F2 prompt. Requires entry to continue. 0x51, "No bootable devices.",
0x52, "In BIOS Setup Menu.", 0x53, "In BIOS Boot Menu.",
0x54, "Automated Task application.", 0x55, "Performing CSIOR.",
0x56, "In Lifecycle Controller.", 0x57, "Initializing iDRAC.", 0x58, "Preparing to Boot.",
0x7D, "The system BIOS is about to start a boot option.", 0x7E, "Giving control to UEFI aware OS.",
0x7F, "Given control to OS.", 0x80, "No memory is detected.",
0x81, "Memory is detected but is not configurable.", 0x82, "Memory is configured but not usable.", 0x83, "System BIOS shadow failed.",
0x84, "CMOS failed.",
0x85, "DMA controller failed.", 0x86, "Interrupt controller failed.", 0x87, "Timer refresh failed.",
0x88, "Programmable interval timer error.", 0x89, "Parity error.", 0x8A, "SIO failed.",
0x8B, "Keyboard controller failed.",
0x8C, "System management interrupt initialization failed.", 0x8D, "QuickPath Interconnect (QPI) fatal error.",
0x8E, "MRC fatal error.",
0x8F, "Intel Trusted Execution Technology (TXT) fatal error.", 0x90, "Unable to load required BIOS files.",
0xC0, "Shutdown test failed.",
0xC1, "BIOS POST memory test failed",
0xC2, "Remote access controller configuration failed.", 0xC3, "CPU configuration failed.",
0xC4, "Incorrect memory configuration.", 0xD0, "System BIOS has halted.",
0xD1, "System BIOS has halted due to Non-Maskable Interrupt (NMI).", 0xFE, "General failure after video."
Conclusion
The Redfish RESTful API describes many useful open system attributes that provide details about systems monitoring and management of your PowerEdge server. These attributes with Dell specific features, as described above, can increase your overall systems knowledge and efficiency.
References
Dell now has an API documentation site that can be found on developer.dell.com. This site features tiles on various products, including the iDRAC9 Redfish API.
iDRAC RESTful API resources:
- Dell.com Redfish portal
- Dell EMC PowerEdge Redfish API Reference Guide 14G and 15G (iDRAC9 5.00 release)
- iDRAC OEM schema for developer reference
iDRAC RESTful API with Redfish automation tools:
iDRAC RESTful API with Redfish automation videos. These videos provide details about scripting the iDRAC RESTful API with Python and PowerShell:
DMTF materials on Redfish. These documents and videos explain the basics of the Redfish standard:

iDRAC9 Virtual Power Cycle: Remotely power cycle Dell EMC PowerEdge Servers
Mon, 16 Jan 2023 17:55:02 -0000
|Read Time: 0 minutes
Summary
Dell EMC PowerEdge servers stand out for offering the ability to remotely invoke an A/C power cycle to the Baseboard Management Controller. With distributed and scaled-out IT environments, the means of restoring or resetting power states in as little time as possible takes on added importance.
Introduction
On those occasions when it’s necessary for an IT admin to reboot a server, whether due to a faulty hardware component or an operating system ‘stuck’ in an unresponsive state, it may be necessary to drain all power to the server. This step is rare but could be the essential means to drain auxiliary power from capacitors to recover a device in a hung state and reboot the physical device’s firmware stack.
Since it is increasingly unlikely that a server room is located ‘down the hall’, and more likely across town within a ‘lights out’ co-location datacenter, the means of restoring or resetting power states in as little time as possible takes on added importance.
iDRAC9 enables remote power cycles
With the integrated Dell Remote Access Controller (iDRAC), standard on all Dell EMC PowerEdge servers, IT administrators can mimic a power cycle and restore the system without having to go to the datacenter, find the server in the hot aisle, and pull the plug. The following solutions will work for either AC or DC power supplies.
Invoking Virtual A/C Power Cycle
Dell EMC PowerEdge servers with iDRAC9 offer 2 options for invoking a virtual A/C (vAC) power cycle:
- Use of iDRAC9 out-of-band capabilities
- Use of an iDRAC Service Module (iSM) installed on Windows, Linux, or ESXi
Both options eliminate the need for physical presence, to locate the correct server in a hot aisle, and pull out the power cord before plugging it back in.
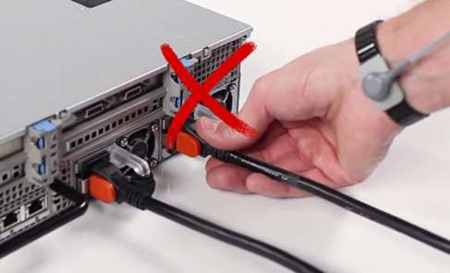
The path chosen is likely predicated on situation particulars:
- Using iDRAC, assuming no operating system dependencies:
- Set “Full Power Cycle” using GUI/Redfish/RACADM
- ‘Power Cycle’ – perform a power cycle of the server via iDRAC
- To note, the virtual A/C power cycle is always available and can be performed regardless of the host state; indeed, it may be required if the host operating system is not responding properly
- Of further note, this process applies to rack/tower systems, whereas for modular systems, it’s best to use the “virtual reseat” of the server option.
- iSM – sending commands to an agent through the operating system or hypervisor:
- Two commands are issued, one to activate the vAC, and one to perform a graceful power-down of the host
- May be necessary whenever the iDRAC is in an unresponsive state
- Requires PowerEdge servers with iDRAC9
Invoking a remote virtual A/C power cycle
With iDRAC, via the:
- GUI – navigate to Configuration > BIOS Settings > Miscellaneous Settings > Power Cycle Request
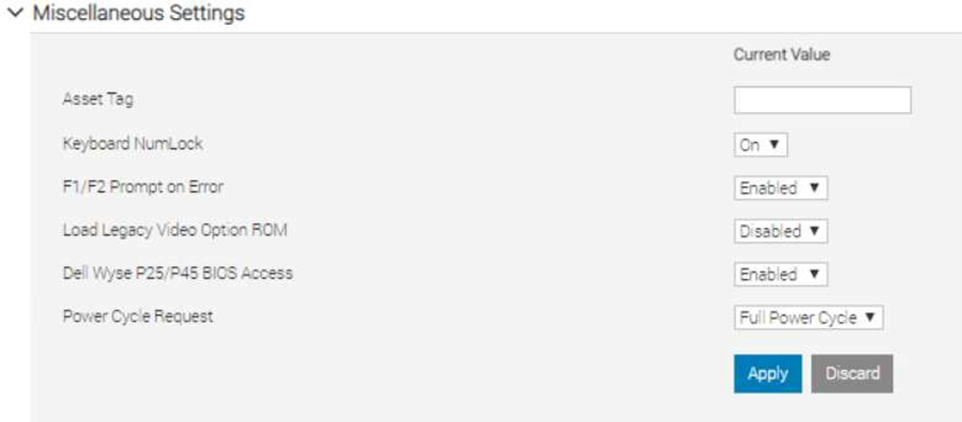
RACADM
- racadm set BIOS.MiscSettings.PowerCycleRequest FullPowerCycle
- racadm jobqueue create BIOS.Setup.1-1
- reboot host when ready.
Redfish
- PATCH / redfish/v1/Systems/System.Embedded.1/Bios/Settings with
{
“Attributes”: {
“PowerCycleRequest”: “FullPowerCycle:
},
"@Redfish.SettingsApplyTime": {
"@odata.type": "#Settings.v1_1_0.PreferredApplyTime", "ApplyTime": "OnReset"
}
}
When the patch command has successfully completed, a 202 “Accepted” status message will be returned along with the Task URI for newly created job.
- POST /redfish/v1/Systems/System.Embedded.1/Actions/ComputerSystem.Reset
{
"ResetType":"On" /// If Powered Off
}
or
{
"ResetType":"GracefulRestart" /// If already Powered On
}
This will restart the Host and start the Task/Job, wait for it to complete.
- iSM
- For Windows operating system – Shortcut menus are available for the FullPowerCycle Activate (request), FullPowerCycle Cancel and FullPowerCycle get status operations.
- To request FullPowerCycle on your system, type Invoke-FullPowerCycle –status request cmdlets in power shell console
- To get the status of the Full Power Cycle on your system, type Invoke-FullPowerCycle –status Get cmdlets in power shell console
- To cancel the Full Power Cycle on your system, type Invoke-FullPowerCycle –status cancel cmdlets in power shell console
- For Windows operating system – Shortcut menus are available for the FullPowerCycle Activate (request), FullPowerCycle Cancel and FullPowerCycle get status operations.
- For Linux operating system –
- To request Full Power Cycle on your system, type /opt/dell/svradmin/iSM/bin/Invoke-FullPowerCycle request
- To get the status of the Full Power Cycle on your system, type /opt/dell/svradmin/iSM/bin/Invoke-FullPowerCycle get-status
- To cancel the Full Power Cycle on your system, type /opt/dell/svradmin/iSM/bin/Invoke-FullPowerCycle cancel
Note: After running the command, a host power cycle (cold boot) is necessary for FullPowerCycle to take effect.
Conclusion
With servers increasingly managed remotely, a means of performing the virtual equivalent of pulling out the power cord and pushing it back in is a necessary capability in order to occasionally ‘unstick’ the operating system. With the Dell EMC PowerEdge iDRAC9 virtual power cycle feature, IT admins have access to console or agent-based routines to restore or reset power states in minutes rather than hours. This remote capability is essential to keeping distributed and scaled- out IT environments running smoothly.
Resources
iDRAC9 whitepapers and videos www.dell.com/support/idrac
iDRAC Manuals and User Guides www.dell.com/idracmanuals
iDRAC Service Module
www.dell.com/idracmanuals (select iDRAC Service Module)

iDRAC9 Telemetry Enhancements: Customizable Reports and Multiple Consoles
Mon, 16 Jan 2023 17:42:47 -0000
|Read Time: 0 minutes
Summary
iDRAC9 telemetry enhancements include the ability to create user- defined custom reports and balance volume of streamed telemetry across more than one collection point. iDRAC9 data streamed to an external ingress collector, from which tools like Splunk or ELK Stack can be used to aggregate data, examine trends, issue alerts, and generate timely reports.
Introduction
The iDRAC9 firmware v4.40.10 in conjunction with the Datacenter license, now includes feature enhancements to the telemetry streaming function. These include the ability to create user-defined custom reports and direct data streams to more than one collection point.
Embedded with every PowerEdge server, the integrated Dell Remote Access Controller 9 (iDRAC9) enables secure and remote server access, regardless of operating system state or presence of hypervisor, and makes possible a range of server management tasks, including configuration, OS deployment, firmware updates, health monitoring and maintenance.
The iDRAC9, while providing out-of-band and agent-free systems management, connects to all critical server component and collects over 180 server metrics in near-real-time. These metrics include granular, time-stamped data for critical functions such as processor and memory utilization, network card, power, thermal, memory, and graphics processing, and more; they enable consistency and scaling as infrastructure needs grow.
iDRAC9 data is streamed to an external ingress collector, from which tools like Splunk or ELK Stack can be used to aggregate data, examine trends, issue alerts, and generate timely reports. Data collected from iDRAC9 by server administrators can be used to make better data center performance decisions and prioritize proactive maintenance.
Customized Reporting
Building on prior capabilities, which included exposed time-series sensor data and JSON-enabled streaming telemetry data, version 4.40.10 of the iDRAC9 firmware has moved the DMTF Redfish schema-based reporting beyond default reports and values, to include the creation of user-defined custom reports. This flexibility helps to potentially cut down the size of data sets and reports, whether by changing the collection time interval, using additional aggregation functions within reports (beyond average/maximum/minimum), eliminating unwanted metrics, using 24 custom report definitions (in addition to 24 existing report definitions), or limiting report content to a subset of the maximum 2,400 values per report.
Support for Multiple Consoles
New iDRAC9 features also include, in response to customer feedback, the ability to send iDRAC9-streamed telemetry from one or many Dell EMC PowerEdge servers, to more than one collection console, for use by one or many organizations charged with overseeing data center operations. A total of eight separate collection consoles can be specified, which allows for reducing the rate and volume of telemetry data flowing to any one particular collector, and avoiding any “thundering herd” effect when formerly thousands of iDRAC9 servers could potentially fire off data at a particular collector on a non-randomized schedule. This feature improvement also allows for variations in data sampling rates and reporting schedules, tied to custom reports that drive requirements for sampling interval, metrics collected, and configuration parameters set. Through better distribution of streamed telemetry at the collector level, the greater the number of iDRAC9 servers that can be supported.
All changes to all reports are normally global, regardless of whether a report is a legacy report or a custom report, as all collectors see the changes, regardless of which particular collector initiated the change. By using specific report definition names, however, a particular collector can lay claim to that particular report definition.
New reports are created using functions supported by HTTP, including PATCH, POST, PUT, and DELETE, whereby a web server accepts enclosed data or a request to make partial changes or deletions to an existing resource. ‘Pre-canned’ reports included with iDRAC9 can be changed using the PATCH function. They cannot be deleted, however, using DELETE, as this merely resets the report back to factory default values. Standard DMTF Redfish semantics apply to all of these operations, as does Report URI, used for monitoring security policies. Report definitions can be deployed using the Server Configuration Profile feature (SCP). SCP enables changes to configuration, firmware and redeployment of the operating system through a single XML or JSON template; The SCP template can then be applied to multiple servers.
Conclusion
As data centers grow in importance, servers proliferate, and differences between poorly-run and well-run facilities become readily apparent and thus consequential, iDRAC9, standard with all PowerEdge servers, provides an effective means of monitoring, analyzing, and acting upon data streamed from 180 or more monitored server performance indicators. The addition of feature enhancements to the latest iDRAC release make it now possible to create custom reports and balance the volume of streamed telemetry across more than one collection point.
These tools and more underscore how Dell EMC PowerEdge servers are compelling compute solutions. The inclusion of custom reports and support for multiple collectors, ease-of-monitoring, managing, updating, troubleshooting, and remediation of server performance, make for seamless and integrated server data collection, a key enabler of any well-run datacenter.

iDRAC9 System Lockdown: Preventing Unintended Server Changes
Mon, 16 Jan 2023 17:38:11 -0000
|Read Time: 0 minutes
Summary
Enabling system lockdown mode is part of Dell Technologies’ cyber resilient architecture of Protect, Detect and Recover. System Lockdown helps prevent change or “drift” in system firmware images and critical server configuration settings. Dell Technologies is the only vendor to offer the ability to dynamically enable and disable system lockdown once your server is provisioned and in production without having to reboot.
Introduction
Running the latest firmware on datacenter servers helps keep up with security and performance improvements, maintain optimal operating parameters, and leverage new features. All are critical to the bottom line, to getting the most from your datacenter investment. When unplanned or unforeseen changes occur to server configurations, whether benign or malicious, these can propagate across a datacenter with a corresponding loss in productivity or extra cost.
iDRAC9 System Lockdown Benefits
To prevent unintentional changes, the iDRAC9 Enterprise and Datacenter licenses now include a feature “System Lockdown,” a virtual lock for firmware and hardware configurations. Even those with full admin privileges are limited to read-only access—unless the lock is first disabled. This prevents server ‘drift’, the unintentional migration of firmware and configuration settings across servers.
The lock does, however, allow for continued access to key operations, such as power capping and power cycling, health monitoring and virtual console access, while keeping server workloads running. All hypervisor and OS functionality are also fully accessible.
When accessed via a web GUI, Redfish REST APIs, or RACADM command-line utility, systems administrators are prevented from making changes that could impact servers in production. Additionally, the lockdown status is evident via a padlock icon and greyed out settings in the iDRAC GUI.

Even before logging in, the admin is notified the system is in Lockdown mode.
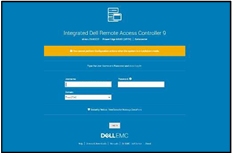
iDRAC9 System Lockdown is Part of Dell’s Cyber Resilient Architecture
The lockdown mode is part of Dell’s PowerEdge cyber resilient architecture, with its emphasis on Protect, Detect and Recover. It protects by preventing firmware downgrades as a possible vector of attack, adding or removing users as a means of circumventing settings, or modifying lockout policies. System Lockdown enables detecting changes outside a maintenance window by creating alerts in the iDRAC lifecycle log that can be configured to send notifications, and it potentially cuts recovery time spent re-imaging or re-configuring servers.
System lockdown now offers native lockdown support in select NICs which prevents malware in the OS from installing firmware updates using altered versions of vendor tools. This also addresses concerns for cloud providers of end customers installing their own firmware versions on the server hardware they are using. As a result, subsequent users of a cloud server can be assured that the networking adaptor firmware is secure and version consistent.
System Lockdown Drives Datacenter Efficiencies
The system lockdown fits well with standard server maintenance window methodologies, the unlocking and locking of servers serving as ‘bookends’ at the start or end of maintenance work. Once operationalized, it helps drive good maintenance behavior, cuts unforced errors, and prevent server ‘drift’.
In Conclusion
Enabled in iDRAC Enterprise and Datacenter licenses, the lockdown feature is another important tool available from Dell Technologies to manage and maximize your investment in your PowerEdge servers.

OpenManage Enterprise Boosts Data Center Staff Productivity
Mon, 16 Jan 2023 17:26:48 -0000
|Read Time: 0 minutes
Summary
Many necessary tasks performed by IT Admins aren’t complex, but are repetitive, time-consuming, and can deflect attention from other, long-term initiatives. The Dell EMC OpenManage Enterprise systems management console delivers powerful automation capabilities that simplify the workflow of the IT Administrator, saving valuable time and reducing the potential for error and downtime. This tech note summarizes the results of recent testing to prove out the benefits of OpenManage Enterprise, and points interested users to a no-charge trial copy.
Introduction
Dell EMC OpenManage Enterprise (OME) is an intuitive infrastructure management console that allows IT staff to discover, deploy, update, and monitor Dell EMC PowerEdge™ servers. It also enables IT administrators to view and make changes to other equipment in the data center infrastructure, including chassis, storage, and network switches on the enterprise network. OME helps users to:
- Simplify: OpenManage Enterprise brings the ability to handle a wide range of IT administration tasks into a single, intuitive systems management solution, thereby greatly reducing complexity.
- Unify: OME is a one-to-many systems management console, built to scale: With a single instance of OME, IT Administrators can manage up to 8,000 devices regardless of form factors, such as Dell EMC PowerEdge rack-, tower-, or modular servers, or PowerVault MD and ME storage systems, or third-party devices. Have more than 8,000 devices in your infrastructure? Just add additional instances of OME.
- Automate: OME helps to boost IT Admin productivity by automating tasks throughout the server lifecycle. For example, OME can speed server discovery and deployment; streamline BIOS and firmware update processes; and produce customized reports.
- Secure: Security is a top priority with Dell EMC OpenManage solutions, including the OpenManage Enterprise console. For example, OME can detect drift from a user-defined configuration template, alert users, and remediate misconfigurations based on pre- setup policies.
Measuring Benefits
With the recent release of OpenManage Enterprise v3.4, we were interested in measuring just how much OME capabilities can benefit IT Administrators, easing demands on their scarce time and freeing up energies for higher priority and strategic tasks. To do the evaluation, we engaged with Principled Technologies, an independent testing and evaluation organization. (Readers can learn more about Principled Technologies at www.principledtechnologies.com). Testing and evaluation were performed in May/June 2020.
At our request, Principled Technologies evaluated several systems management tasks, and documented their findings in a summary report, “Boost data center staff productivity with OpenManage Enterprise”, which readers can find at http://facts.pt/sq2w04k. In each test, Principled Technologies measured the time and effort required to complete each task using OpenManage Enterprise and compared those results to completing the same tasks manually. In this brief tech note, I’ll call out just one of the results, and encourage readers to go to the report at the link above for a longer discussion.
Firmware Update
Since updating firmware is a critical, recurring IT Admin task, and one which can consume a good deal of time, we were interested in what benefit OME could deliver here. Principled Technologies testing showed that, updating a single server using OME was 8 seconds faster than performing the update manually, or 20% faster. Saving 8 seconds doesn’t sound like a big deal, and it’s not, if all the IT Admin has to do is update one server. But again, the power of OpenManage Enterprise comes in when scaling the capability and applying the same task to large numbers of servers. Using OpenManage Enterprise, an IT Admin needs only the same amount of time and effort for multiple servers as they did for a single server.
By contrast, the administrator would require more time and effort, over and over and over again, with each additional server when using the manual method (i.e. time scales linearly when using the manual method). Thus, as shown in the Principled Technologies report, for a data center with 1,000 servers, updating firmware using OME eliminates 2,996 steps and performs the task 99% faster, saving 11 hours 6 minutes 8 seconds off the clock (i.e. saves more than one full work day, just to perform one of the many tasks that fall on an IT Admin). Since a single instance of OpenManage Enterprise supports eight times as many servers as in this test case (8,000 vs. 1,000), one can see that the potential time savings are enormous.

Figure 1: When applying firmware updates to a server infrastructure of 1,000 servers, OpenManage Enterprise can save IT Administrators over 11 hours of their time, compared to performing the same task manually.
Additional Capabilities
Other systems management tasks evaluated in the study include: initial deployment of servers; repurposing server hardware; reconfiguring hardware and deploying servers; and completing urgent data center recovery. Readers are encouraged to view the Principled Technologies report at the link above or in the Notes section below, for the results of those tests. Beyond those tasks, OpenManage Enterprise delivers even more capabilities that benefit users:
With multi-homing, administrators can connect OpenManage Enterprise to public and out-of-band networks simultaneously, enabling them to concurrently manage test and production servers without needing to switch networks. This feature is available for OpenManage Enterprise versions 3.3 and higher and setting it up is quite straightforward: It takes only 18 steps and 4 minutes 5 seconds to implement. Readers can see the aforementioned Principled Technologies report for details.
New to OpenManage Enterprise 3.4 is server-initiated discovery. Dell EMC provides the option for new servers to ship with unique login credentials for enhanced security. Server-initiated discovery in OpenManage Enterprise 3.4 provides a method to discover these servers without needing to scan the network for each new server using complex, unique management credentials. As the testing at Principled Technologies showed, it takes only 5 steps and 15 seconds to set up this capability, yet it could potentially save large amounts of deployment time, while also reducing potential for human error (which could lead to downtime).
OpenManage Enterprise 3.4 also delivers thermal event detection capabilities, which allow IT Administrators to set power policies for thermal budgeting. Every 15 minutes, OpenManage Enterprise checks each target server in the thermal-managed group. If it detects servers running an abnormally high temperature, it can use event triggering to place those servers in a low-power state to cool them down, which could prevent damage to critical internal components. Setting this up is a one-time event, which takes only 16 steps and 1 minute 37 seconds.
Trial Copy
Use of Dell OpenManage Enterprise to monitor devices is free. Use of advanced features requires that the OpenManage Enterprise Advanced license is installed on the target server. Users interested in experiencing these advanced features in their own data centers can download a no-charge, 30-day trial copy. The free download is available on the OpenManage Enterprise support site: https://www.dell.com/support/article/en- us/sln310714/support-for-openmanage-enterprise?lang=en
At that site, scroll down a bit to the section entitled, “Evaluate, Purchase and Download of the OpenManage Enterprise Advanced license”.
In Conclusion
As data centers of all sizes continue to grow and transform, more and more demands are placed on the scarce time of IT Administrators. Many of the tasks performed by Admins are simple, but are tedious and time- consuming, and can deflect attention from other initiatives that are more important in the long run. The OpenManage Enterprise systems management console delivers powerful automation capabilities that can be applied to those repetitive, time-consuming tasks, thereby simplifying the workflow of the IT Administrator, saving valuable time, and reducing the potential for error and downtime.
Notes:
- Comprehensive information about OpenManage Enterprise can be found here: https://www.delltechnologies.com/en-us/solutions/openmanage/enterprise.htm
- A brief, 3-minute video summarizing the results of testing performed at Principled Technologies is available here: http://facts.pt/0jwglja
- This crisp, 3-minute video describes how the OpenManage Enterprise console simplifies management by providing powerful automation capabilities, enabling IT Administrators to extend their span of control and use of time: https://www.youtube.com/watch?v=YXu5j7wVwp4&feature=youtu.be
- A brief, animated video about OpenManage Enterprise is available here: https://www.youtube.com/watch?list=RDCMUClWVI6vuTSuGO5OtOgG_UEw&v=xd0dt-0SctI&feature=emb_rel_end

OpenManage Mobile Brings the Power of Augmented Reality to PowerEdge MX
Mon, 16 Jan 2023 17:14:53 -0000
|Read Time: 0 minutes
Summary
Dell EMC OpenManage Mobile, a unique Android or iOS app, helps IT Administrators track data center issues and respond rapidly to unexpected events. Anytime. Anywhere. OpenManage Mobile (OMM) is a powerful tool inside the data center also, perhaps especially with regard to the PowerEdge MX chassis. With OMM’s Augmented Reality capabilities, IT Admins can simply point the camera of their mobile device at the front of the MX chassis, tap the screen, and get a visual health overlay of the MX platform. Tapping the screen again drills down into lower-level health messages. Many systems management actions can similarly be taken directly from the mobile device, using OMM. These capabilities greatly boost the efficiency of IT Admins, helping them to save time, gain better understanding of their data center, and reduce potential for error and downtime.
Introduction
Dell EMC OpenManage Mobile (OMM) is a mobile application for monitoring and managing Dell EMC PowerEdge servers, the PowerEdge MX7000 chassis and other datacenter equipment, from Android and iOS mobile devices. OpenManage Mobile enables IT Administrators to perform a subset of server configuration, monitoring, troubleshooting, and remediation tasks from anywhere. Thus, whether the IT Admin is in the data center or away from it, he or she can monitor and manage their infrastructure from their mobile device. They can also receive proactive notifications from OpenManage Enterprise consoles and take appropriate actions, as needed.
Quick Sync 2
When the IT Admin is in the data center, OpenManage Mobile can communicate directly with a PowerEdge server or an MX chassis with Quick Sync 2, an optional wireless module embedded in the server or MX chassis. The Quick Sync 2 module eliminates the need for mobile device to be on management network. The IT Admin uses the OpenManage Mobile app on their mobile device and taps the Quick Sync button on the hardware to connect with the app via Bluetooth. The Admin can now access information about their PowerEdge server or PowerEdge MX platform from the app. Users can browse the screens to view inventory, view health status, or even do basic configuration and take action, e.g. change the IP address, change the password, or change key BIOS settings.
Remote management – in the data center
Even though in this scenario these actions are being performed in the data center (rather than remotely, away from the data center), this does not minimize the benefits of flexibility and efficiency brought to the data center itself by OpenManage Mobile: The IT Admin is no longer tied to a console on a desk - instead, he or she can roam the data center at will. And, when roaming the data center, he or she is no longer dragging a crash cart along with them – all the functionality of the crash cart is right in the IT Admin’s hand, on their smart device.
Augmented Reality
With a PowerEdge MX7000 chassis, OMM utilizes Augmented Reality to make monitoring even simpler. The IT Admin simply views the chassis through their mobile device camera in the OMM app and is able to see the chassis image with health overlays on top of individual components.
This capability is activated in just a few simple steps:
- In the OpenManage Mobile app with Quick Sync activated, focus your camera on an MX chassis.
- The OMM app identifies the MX chassis.
- The OMM app places health overlays on top of every component in the MX image, as shown in Figure 1 below.
- Clicking on any health overlay provides more details.
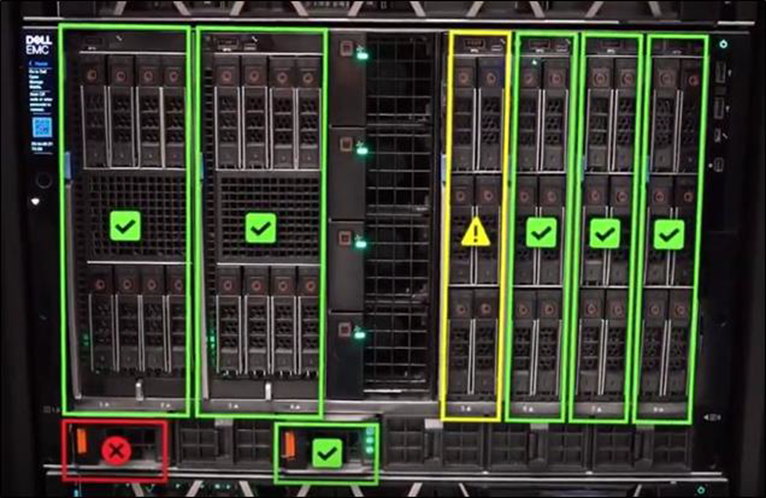
Figure 1: OpenManage Mobile with Augmented Reality provides visual overlays to give IT Admins at-a-glance health status of their PowerEdge MX platform, right on the camera of their mobile device.
A brief, 1-minute video, Manage your PowerEdge MX with Augmented Reality https://youtu.be/TSiNRmX2H60, shows this technology in action.
How does Augmented Reality on PowerEdge MX work?
OpenManage Mobile uses Augmented Reality (AR) to provide an overview of health updates by looking at the MX chassis through the mobile device camera. By calculating the plane of the chassis’ front face and identifying key shapes that make up important components, such as the fan or power button, OpenManage Mobile creates a 3D boundary of where the chassis exists in the real world and overlays a blueprint of all the chassis parts and components on top of the boundary.
How does Quick Sync feed into AR?
In order to draw meaningful data onto the detected chassis, OpenManage Mobile reads details about the chassis health status from the Quick Sync 2 module on the chassis. Quick Sync 2 utilizes Bluetooth Low Energy to wirelessly host its health and component data, allowing OpenManage Mobile to connect and read the server. All Quick Sync 2 communications are encrypted with a secure handshake like what is available in HTTPS connections. If OpenManage Mobile has connected to the chassis at least once before working with augmented reality, the broadcast address and chassis certificate will quickly and automatically match and validate the Quick Sync 2 connection.
In Conclusion
Dell EMC OpenManage Mobile (OMM) liberates IT Admins by allowing them to perform many management functions without having to be physically present at a console in the data center. With OMM, IT Admins don’t need a crash cart anymore; the OMM app on a mobile device is the crash cart. With OMM’s powerful Augmented Reality capabilities, IT Admins can learn the health status of their PowerEdge MX platforms within seconds, by simply aiming the camera of their mobile device at the MX chassis and tapping the screen. This not only saves time and greatly simplifies the day of the IT Admin, it also boosts efficiency, productivity, and reduces the potential for error and downtime.
Notes:
- View the brief video, Manage your PowerEdge MX with Augmented Reality, available at https://youtu.be/TSiNRmX2H60
- Read the white paper Understanding Augmented Reality Monitoring in OpenManage Mobile
- Find still more information at the OpenManage Mobile website, https://www.delltechnologies.com/en- us/solutions/openmanage/mobile.htm
- Download OpenManage Mobile for iOS or Android

“Thermal Manage” Features and Benefits

Mon, 16 Jan 2023 17:06:35 -0000
|Read Time: 0 minutes
Summary
This Tech Note covers the features and benefits of using the “Thermal Manage” features within the iDRAC Datacenter license.
Introduction
With increasing server densities and the desire to maximize compute power per unit area at the datacenter level, there is an increasing need for better telemetry and controls related to power and thermals to manage and optimize data center efficiency.
“Thermal Manage” includes features of the iDRAC Datacenter license and provides key thermal telemetry and associated control features that facilitate deployment and customization challenges.
Thermal Manage – Feature Overview
Thermal Manage allows customers to customize the thermal operation of their PowerEdge servers with the following benefits:
- Optimize server-related power and cooling efficiencies across their datacenters.
- Integrates seamlessly with OpenManage Enterprise Power Manager for optimized management experience.
- Provides a state-of-the-art PCIe cooling management dashboard.
Represented in the following diagram (See figure 1) and listed below is a summary of the features and its utilities.
- System Airflow Consumption: Displays the real-time system airflow consumption (in CFM), allowing airflow balancing at rack and datacenter level.
- Custom Delta-T: Limit air temperature rise from inlet air to exhaust to right-size your infrastructure level cooling.
- Exhaust Temperature Control: Specify the temperature limit of the air exiting the server to match your datacenter needs.
- Custom PCIe inlet temperature: Choose the right input inlet temperature to match 3rd party device requirements.
- PCIe airflow settings: Provides a comprehensive PCIe device cooling view of the server and allows cooling customization of 3rd party cards.
Details and Use Cases
By default, Dell server thermal controls algorithm works to minimize system airflow consumption and maximize exhaust air temperature.
The higher the air exhaust temperature going into the HVAC (CRAC units) – the higher capacity they exhibit.
- It is directly proportional to the temperature difference between return air (exhaust) and the cooling coil for a given coil flow rate.
- This could result in lower CRAC capital costs if you can cool more with fewer CRAC units and an operational savings of cooling with less equipment.
Some customers, however, have challenges with high exhaust temperatures in the hot aisle, namely:
- Technicians don’t like the extra heat while working in the hot aisle.
- Components in the hot aisle (PDUs, cables, network switches) may have exceeded their ambient temperatures.
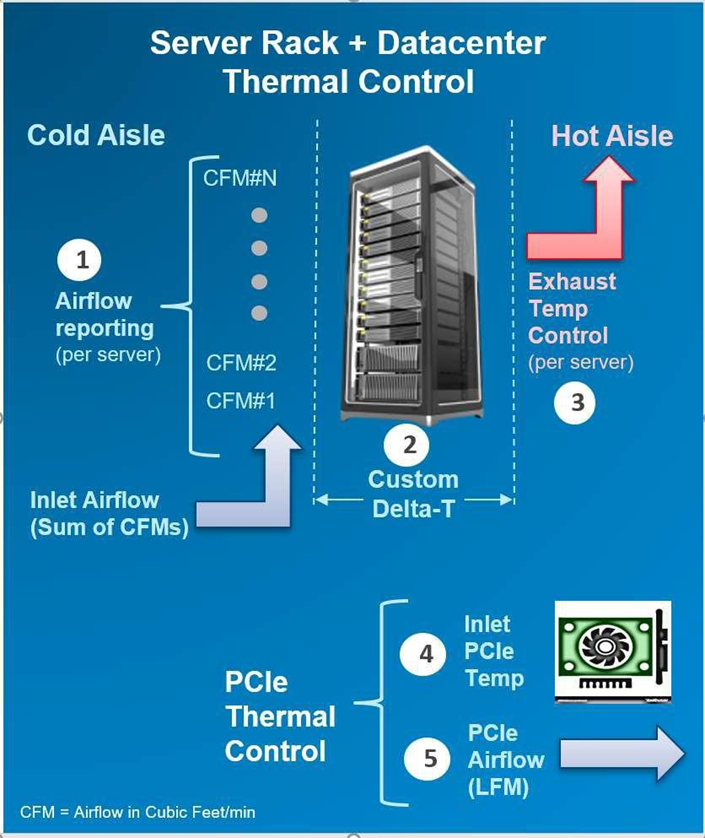
Figure 1 displays the features and its utilities.
In either case, we allow customization of this exhaust temperature via iDRAC interfaces.
Using the real-time airflow telemetry, a datacenter can create a good balance of airflow delivery vs. airflow demand at the server. A reduction in CFM also can be monetized on a dollar/CFM basis.
- In an example analysis using a 17 KW rack, a drop in CFM by 10% could result in capital savings (CRAC costs of $257/rack) and an annual operational savings of $93 per rack based on the typical energy cost and data center efficiencies assumed.
- However, the greater benefit is the potential ability to fit more racks on the floor (or more servers in a rack), if airflow balancing is achieved by closely matching the server/rack airflow consumption.
iDRAC Thermal Manage features require an iDRAC Datacenter license. Here is an image from the iDRAC GUI showing the thermal telemetry and customization options:
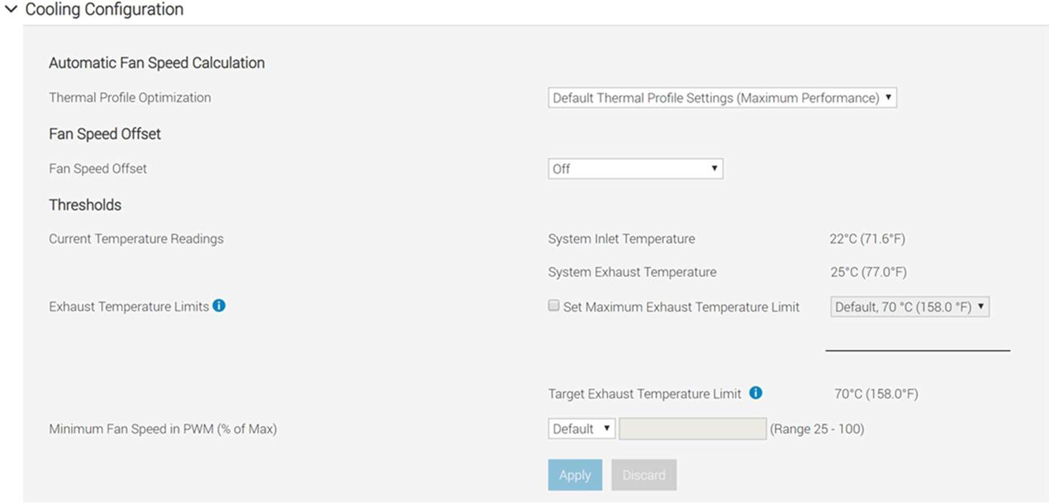
Deploying 3rd party PCIe cards in PowerEdge servers is a common practice. The PCIe airflow settings feature allows a better understanding of the cooling state of the PCIe devices. This helps customers protect their high-value PCIe card with the right amount of cooling. Additionally, this optimizes system airflow, which ties into the earlier point of data center airflow management.
By default, the presence of a 3rd party card may cause the system fan speeds to increase based on internal algorithms. However, this additional cooling may be more or less than required and hence the need for allowing customers to customize airflow delivery to their custom card.
In the iDRAC GUI under PCIe Airflow Settings (Dashboard » System » Overview » Cooling » Configure Cooling – see example snapshot below), the system displays high-level cooling details for each slot in which a card is present. It also displays the max airflow capability of each slot. This airflow information is provided in units of LFM (Linear Feet per Minute), which is industry standard for defining the airflow needs for a card. Only for the 3rd Party Card, customers can see min LFM value delivered to the card and either disable the custom cooling response for that card or disable and then set custom LFM value desired (based on card vendor specifications).
NOTE: For Dell standard devices, the correct power and cooling requirements are part of the iDRAC code, which allows for the appropriate airflow.
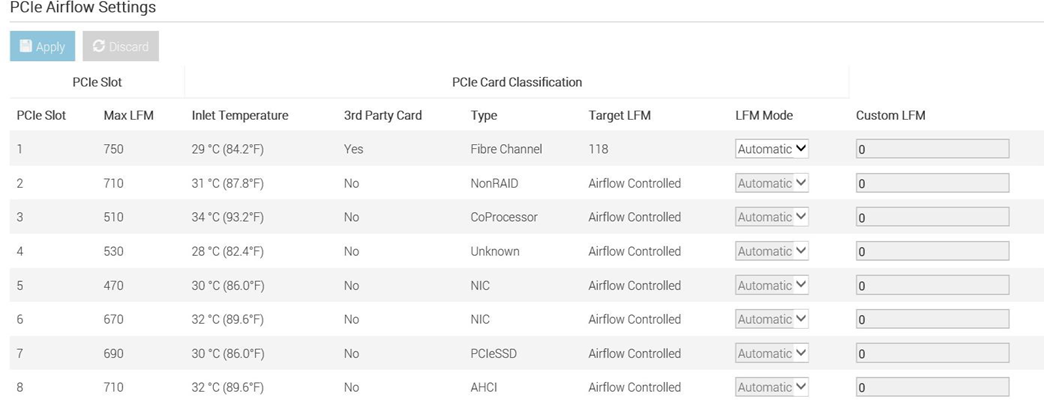
In Conclusion
Thermal Manage features within the iDRAC Datacenter provides industry-leading custom thermal control options that provides valuable custom cooling and efficiency optimization options for both the system and data center level.

Dell PowerEdge – iDRAC Automatic Certificate Enrollment
Mon, 16 Jan 2023 16:59:18 -0000
|Read Time: 0 minutes
Summary
In the latest generation of Dell EMC PowerEdge Servers, iDRAC v4.0, has implemented a new automated security feature to keep your iDRAC SSL/TLS certificates current. The iDRAC’s Automatic Certificate feature automatically assures SSL/TLS certificates are in place and up-to-date for both bare-metal and previously installed systems.
Introduction
Dell EMC PowerEdge server’s Integrated Dell Remote Access Controller (iDRAC) v4.0 offers a new security feature, Secure Sockets Layer (SSL)/ Transport Layer Security (TLS) Automatic Certificate Enrollment that helps the Data Center Manager maintain security with less effort.
Data Center Managers need to be vigilant to make sure that their compute environment is protected from a range of threats and attacks. Monitoring and assuring that all security measures are current and in place is time- consuming and imperative to prevent unauthorized access and manipulation of your servers.
iDRAC Web User Interface and SSL/TLS Certificates
The iDRAC enables remote system management and reduces the need for physical access to the system. The iDRAC Web User Interface can be reached with any supported browser and uses an SSL/TLS certificate to authenticate itself to web browsers and command-line utilities running on management stations thereby establishing an encrypted link.
If the Certificate Authority that issued the certificate is not trusted by the management station, warning messages will be displayed on the management station. Having an iDRAC SSL/TLS certificate in place ensures a validated and secure connection.
Previously, creating and renewing iDRAC SSL/TLS certificates required a mostly manual, time-consuming effort. Monitoring approaching expiration dates and arranging for new certificates to be generated from a CA authority is just one aspect. IT admins then had to update scripts to deploy the certificates to embedded devices like the iDRAC.
iDRAC SCEP Client Support - Automatic Certificate Enrollment
iDRAC has added a client for Simple Certificate Enrollment Protocol (SCEP) support. SCEP is a protocol standard used for managing certificates to large numbers of network devices using an automatic enrollment process. The iDRAC can now integrate with SCEP-compatible servers like Microsoft Server’s NDES service to maintain SSL/TLS Certificates automatically. This feature can be used to enroll and refresh a soon-to-be-expired web server certificate.
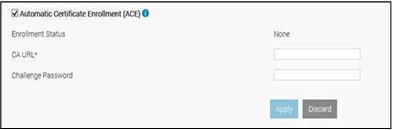
ACE- Automatic Certificate Enrollment
Automatic Certificate Enrollment will enroll and monitor the iDRAC web server SSL/TLS certificate. It enrolls to the specified Certificate Authority (CA) credentials provided. This can be done 1x1 in the iDRAC GUI, set via Server Configuration Profile, or scripted via tools such as Racadm.
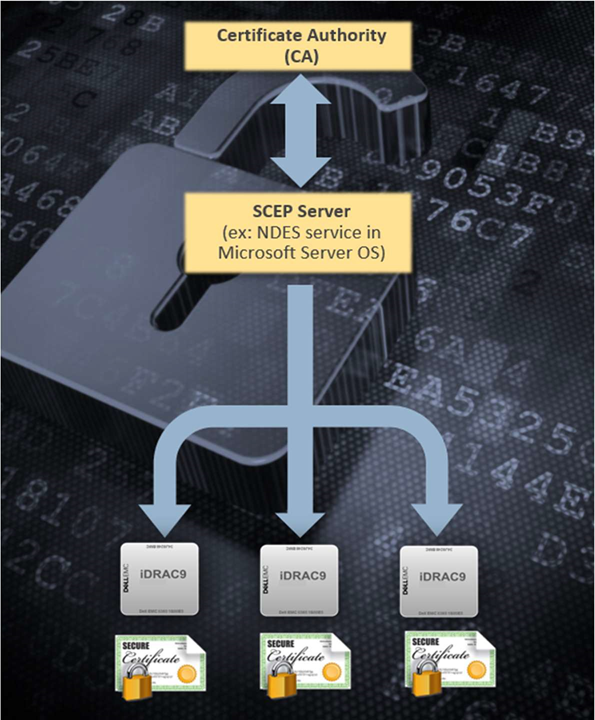
iDRAC Integration with MS-NDES over SCEP
In Conclusion
Monitoring and assuring that all security measures are current and in place is both time-consuming and essential to prevent unauthorized access and manipulation of your servers. The Automatic Certificate Enrollment feature in iDRAC9 v4.0, is just another way Dell EMC is helping you to keep your data center secure.

Transform Datacenter Analytics with iDRAC9 Telemetry Streaming
Mon, 16 Jan 2023 16:51:18 -0000
|Read Time: 0 minutes
Summary
Telemetry Streaming, a new feature in iDRAC9 v4.0 enabled by the new Datacenter License, can produce more high-value (comprehensive and accurate) data faster than with previous versions. There is a huge amount of untapped machine data in your IT infrastructure: use iDRAC9 Telemetry Streaming and analytics to leverage that data to optimize your server management and operations.
Introduction
With the advent of the new iDRAC9 v4.00.00.00 firmware release and the Datacenter license, IT managers can now integrate advanced telemetry about the server hardware operation into their existing analytics solutions. This telemetry is provided as granular, time-series data that can be streamed versus using inefficient, legacy polling methods. The advanced agent-free architecture in iDRAC9 provides over 180 data metrics (with more coming) related to server and peripherals operations that are precisely time-stamped and internally buffered to allow highly efficient data stream collection and processing with minimal network loading. This comprehensive telemetry can be fed to popular analytics tools to predict failure events, optimize server operation, and enhance cyber-resiliency.
Telemetry and Analytics
Telemetry has been around for decades and has been used in various business applications, from hospitals monitoring patients to oil and gas drilling systems to weather balloons transmitting meteorological data. The definition of Telemetry is an “automated communications process by which measurements are made, and other data collected at remote or inaccessible points are transmitted to receiving equipment for monitoring.”
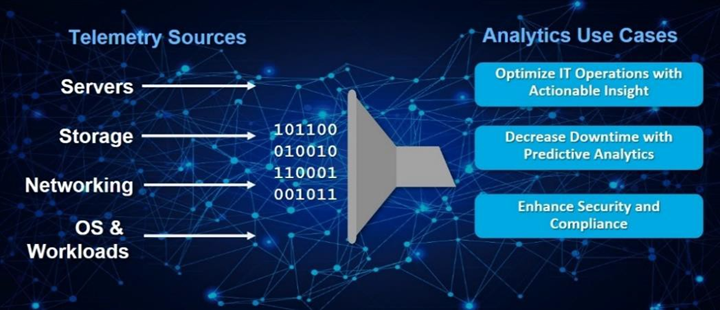
Figure 1. Telemetry Monitoring in a Typical Data Center
In the era of “Big Data,” IT managers leverage a wide range of telemetry from their infrastructure in their monitoring tools, as shown in Figure 1. However, increasingly that telemetry is also used in AI-based analytics to gain operational insight into their datacenter operations. This is far more powerful than using simple alerting and monitoring techniques that typically only report health and status via SNMP alerts or IMPI traps.
Using analytics tools, IT managers can more proactively manage by analyzing trends and discovering insightful relationships between seemingly unrelated events and operations. A recent survey found that 61% of IT decision-makers considered data and analytics very important to their business growth strategy/digital transformation efforts.1
Some of the use cases for data center analytics are:
- Predictive analytics: Customers can perform an in-depth analysis of server telemetry, including device parametric data to proactively replace failing devices. In one case, an IT team used analytics on telemetry from memory devices to develop an algorithm that predicted eventual failure. This allows proactive replacement of suspect devices during scheduled maintenance windows, significantly improving uptime and SLA quality.
- Optimized IT operations: You can perform time-series analysis of vital server metrics to gain insights into optimizing server operation, including tracking of power, temperature, CPU, and I/O performance, etc. One industry that makes extensive use of analytics is High-Frequency Trading, where every millisecond of compute counts in accelerating automated trades. Detailed telemetry is commonly used to discover ways to squeeze out more performance from servers, which becomes a key competitive advantage in this industry.
- Security: AI-based analytics can respond far faster to security events. You can enhance security AI and forensics by monitoring the say of unusual user login activity or physical intrusion events on your servers.
However, to perform effective analytics, you need data: lots and lots of it to feed Machine or Deep Learning techniques effectively. The larger the data set, the more accurate the analysis becomes as evidenced by the petabytes of data that social media uses in analytics of user attributes and buying behaviors.
The Streaming Advantage in iDRAC9
Telemetry streaming’s big performance advantage is in reducing the overhead needed to get the complete data stream from a remote device. Retrieving telemetry using polling can result in an enormous number of discrete commands being issued, which is very challenging in scaling across a large datacenter. With iDRAC9 Telemetry Streaming, you get time-series and detailed statistics reports delivered directly to a variety of analytics collection tools with higher efficiency by removing the need for issuing individual commands for each piece of data. The streaming configuration is flexible so users can modify the number of metrics they require, the report interval (30 seconds for example), and enable reports to be sent immediately upon detection of critical events in the server (like a PSU failure say).
In summary, the advantages of Streaming over Polling are:
- Better Scalability: Polling requires a lot of scripting work and CPU cycles to aggregate data and suffers from scaling issues when we are talking about 100’s or 1000’s of servers. Streaming data, in contrast, can be pushed directly into popular analytics tools like Prometheus, ELK stack, InfluxDB, Splunk without the overhead and network loading associated polling.
- More Accuracy: Polling can also lead to data loss or “gaps” in sampling for time series analysis; it is usually only a snapshot of current states, not the complete picture over time. You might miss critical peaks or excursions in data.
- Less Delay: Data can be severely delayed in time due to needing multiple commands to get a complete set of data and the inability to poll simultaneously from a central management host. Streaming more accurately preserves the time-series context of data samples.
Consequently, streaming is a far more efficient and accurate way to gather telemetry.
Telemetry Excellence with the iDRAC9 Datacenter License
iDRAC9 v4.0, with the Datacenter license, offers over 180 telemetry metrics on various server devices and sensors. These metrics also form the basis of our SupportAssist Collection Report, an incredibly useful tool that captures over 5,000 pieces of diagnostic data and log files for troubleshooting server issues. iDRAC9 Telemetry Streaming does all the heavy lifting for you by internally sampling and storing all the data points and then streaming them out in reports at a frequency that fits your needs. iDRAC9 can deliver almost 3 million metrics a day to transform the accuracy of analytics processing for your data center!
Telemetry can be delivered via the following methods:
- Redfish Server-Sent Events (SSE), a DMTF standard for streaming data2
- Redfish subscription for pushing events, another DMTF standard
- Remote Syslog, a protocol for pushing logs for centralized monitoring
- Non-streaming, scripted polling via the iDRAC9 RESTful API (though not as efficient as streaming as discussed earlier)
The data is formatted using JSON (JavaScript Object Notation) and can be easily adapted to connect many analytics solutions on the market, as shown in Figure 2.
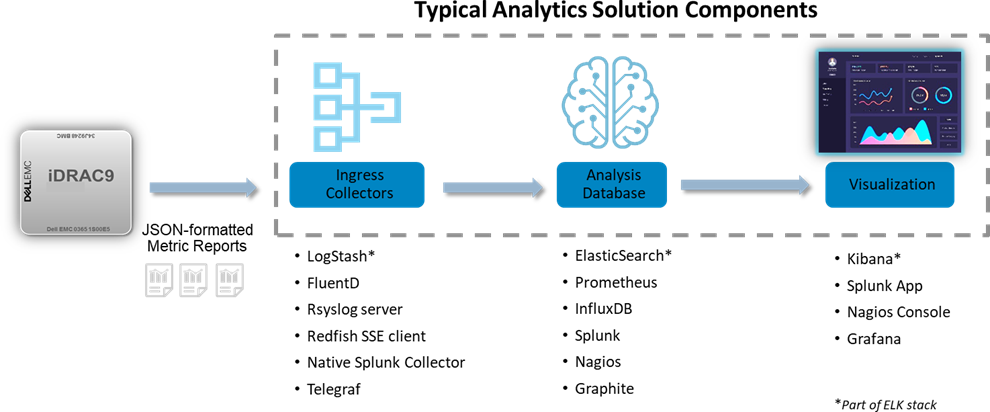
Figure 2. Integrating iDRAC9 Telemetry Streaming with Popular Analytics Solutions
Types of Telemetry Data
A summary of the types of telemetry that iDRAC9 has are:
New Telemetry Data with iDRAC9 4.0:
- Serial Data Log messages
- GPU Accelerator Inventory & Monitoring
- Advanced CPU Metrics
- Storage Drive SMART logs
- Advanced Memory Monitoring
- SFP+ Optical Transceiver Inventory & Monitoring
Existing Telemetry Data:
- Configuration – comprehensive settings for all devices (BIOS, iDRAC, NICs, RAID, etc.)
- Inventory: comprehensive server hardware and firmware reporting
- Performance: CPU, memory bandwidth and I/O usage (Compute Usage Per Second or CUPS)
- Performance and diagnostic statistics: PERC, NICs, Fiber Channel
- Sensors: voltage, temperature, power, connectivity status, intrusion detection
- Logs: SEL log, iDRAC diagnostics, Lifecycle Controller Log
Figure 3 illustrates an external analytics solution capturing and visualizing iDRAC9 Telemetry Streaming. In this case, CUPS performance data was streamed to InfluxDB for the data analysis, and Grafana then used for the visualization.
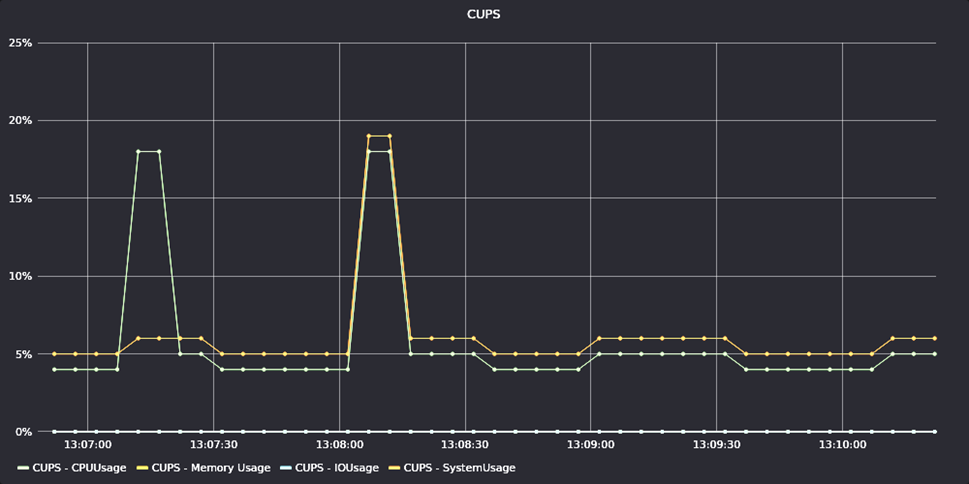
Figure 3. Example of iDRAC9 Telemetry for CUPS Performance Data
In Conclusion
Dell EMC continues to introduce innovations that help our customers automate the management of their IT infrastructure. iDRAC9 Telemetry Streaming represents a huge step forward in helping our customers leverage the extensive data available in their PowerEdge servers. Customers can easily stream this telemetry into their analytics tools and leverage advanced AI techniques to automate their IT systems management and operations further.
- “2020 Global State of Enterprise Analytics”, published by MicroStrategy.
- Server-Sent Events (SSE) is a server push technology (part of HTML5) enabling a client to receive automatic updates from a server via an HTTP/S internet connection.

Update Manager Plugin for OpenManage Enterprise Using Solution Catalogs
Mon, 16 Jan 2023 16:43:07 -0000
|Read Time: 0 minutes
Summary
Dell EMC Update Manager plugin brings Dell Repository Manager functionality to OpenManage Enterprise. Update Manager provides easy access to solution catalogs for:
- ESXi
- vSAN
- Microsoft HCI
Update Manager Plugin is provided Free of Charge.
Introduction
Dell EMC Update Manager is a plugin to the Dell EMC OpenManage Enterprise console that enables IT Administrators to create and manage repositories of update packages for PowerEdge devices managed by OpenManage Enterprise. This plugin is a vital piece of the OpenManage portfolio and provides seamless integration.
Update Manager provides easy access to solution catalogs that are tuned to the requirements of ESXi, vSAN, and Microsoft HCI environments.
It is easy to create a custom repository using a solution catalog by simply selecting the corresponding catalog when creating a new repository.
During the repository creation, select a schedule to check for new updates. The Update Manager Plugin will then automatically refresh the repository with the latest content to ensure that it has the latest updates available from Dell when a system is updated.
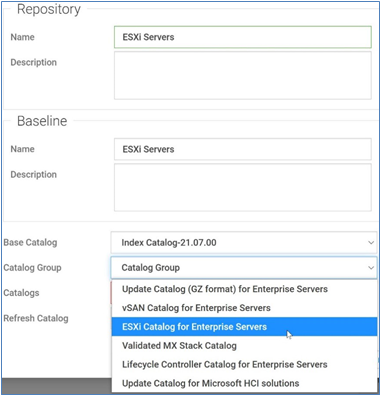
Benefits of using a solution catalog
Solution catalogs are created and maintained by teams within Dell Technologies that are knowledgeable about each solution—ensuring that the update packages are compatible with the corresponding solution. Solution catalogs are refreshed on a quarterly basis, with content that meets or exceeds the corresponding solution Hardware Compatibility List.
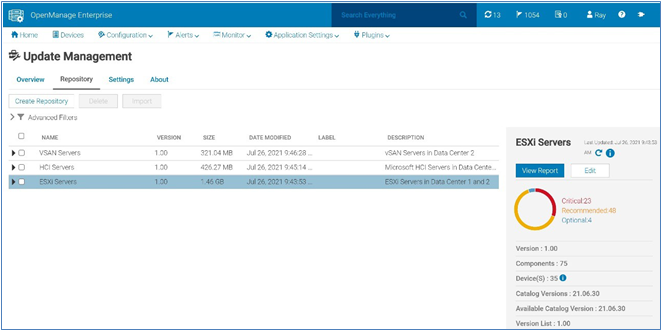
Solution catalogs are refreshed on a quarterly basis, with content that meets or exceeds the corresponding solution Hardware Compatibility List.
In Conclusion
Keeping Servers up to date with the latest firmware and BIOS is essential to minimize the potential vulnerabilities to systems. Update Manager streamlines and automates the identification, gathering, and staging of update packages to ensure that the PowerEdge devices you manage are updated.

Update Manager Plugin for OpenManage Enterprise Overview
Mon, 16 Jan 2023 16:36:04 -0000
|Read Time: 0 minutes
Summary
Dell EMC Update Manager plugin brings Dell Repository Manager functionality to OpenManage Enterprise. Update Manager. Update Manager Plugin is provided Free of Charge.
Introduction
Dell EMC Update Manager is a plugin to the Dell EMC OpenManage Enterprise console that enables IT Administrators to create and manage repositories of update packages for PowerEdge devices that are managed by OpenManage Enterprise. This plugin is a vital piece of the OpenManage portfolio and provides seamless integration.
Update Manager is provided free of charge and supports OpenManage Enterprise v3.5 and newer.
- Plugin to the Dell EMC OpenManage Enterprise
- Create custom repositories/Catalogs/Baselines
- Import or delete components/bundles to and from a repository
- Refresh repositories when new content is available
- Automatically download required update packages from Dell.com
- Configure maximum storage size.
- GUI or API
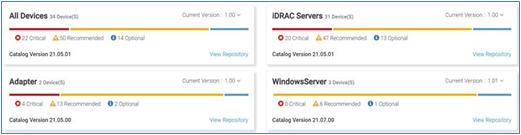
Benefits of using Dell EMC Update Manager Plugin
Using Update Manager keeps your systems up to date with the latest firmware and software by:
- Streamlines the identification and gathering of PowerEdge update packages
- Keeps the repositories up to date for updating the systems
- Allowing manual or automatic updates of a catalog present in a repository
- Customizing a repository by importing or deleting update packages
- Generating a baseline for a repository that can be used to update the firmware of the components in the repository
- Access View Report directly from UMP to initiate an update job
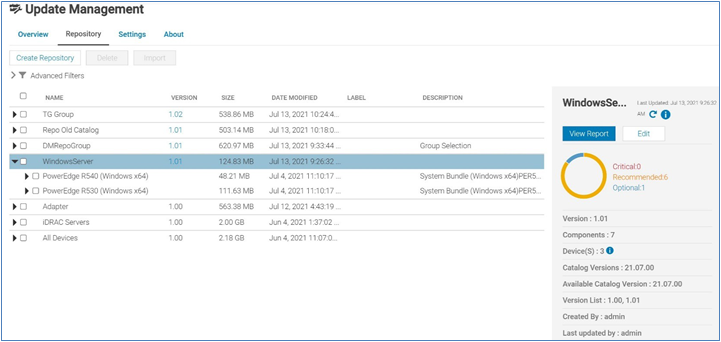
In Conclusion
Keeping Servers up to date with the latest firmware and BIOS is essential to minimize the potential vulnerabilities to systems. Update Manager streamlines and automates the identification, gathering, and staging of update packages to ensure that the PowerEdge devices you manage are updated.

Improved iDRAC9 Security using TLS 1.3 over HTTPS on Dell PowerEdge Servers
Mon, 16 Jan 2023 16:30:31 -0000
|Read Time: 0 minutes
Summary
The iDRAC is designed for secure local and remote server management and offers industry-leading security features. iDRAC9 5.10.00.00 supports TLS 1.3 over HTTPS, to encrypt data and authenticate connections for moving data over the internet. TLS 1.3 uses advanced encryption algorithms, fewer cipher suites, and more secure handshakes.
Features supported by iDRAC9 over HTTPS using TLS 1.3 include:
- iDRAC9 Web Server
- Firmware Updates
- Export SupportAssist
- Import/Export Server Configuration File
- Export Inventory
- Export Lifecycle Log
Introduction
Data Center Managers rely on remote server management to deploy, update, and monitor their servers to extend their reach without having physical access to them. Securing your remote connection with encryption and secure login credentials is one way to prevent malicious actors from gaining access to your server. A secure connection prevents the deletion of critical data, ability to apply malware, or alter the system configuration
Embedded within every Dell PowerEdge server is a powerful leading-edge remote server management processor, the Integrated Dell Remote Access Controller (iDRAC). The iDRAC is designed for secure local and remote server management and offers industry-leading security features. iDRAC9 establishes an encrypted connection over HTTPS using an SSL/TLS certificate to authenticate to web browsers and command line utilities. iDRAC9 version 5.10.00.00, now supports TLS v1.3 over HTTPS.
Secure communications with SSL/TLS
The iDRAC Web User Interface can be reached with any supported browser. iDRAC uses an SSL/TLS certificate to authenticate itself to web browsers and command line utilities, establishing an encrypted link. Transport Layer Security (TLS) is one of the most widely used security protocols.
When a user goes to a website, their browser checks for a TLS certificate on the site. If a certificate is present, their browser performs a TLS handshake to check its validity and authenticate the server. Once a link has been established between the two servers, TLS encryption and SSL decryption enable secure data transport.
There are several options available to secure the network connection using an TLS/SSL certificate. iDRACs web server has a self-signed TLS/SSL certificate by default. The self-signed certificate can be replaced with a custom certificate, a custom signing certificate, or a certificate signed by a well- known Certificate Authority (CA). Automated certificate upload can be accomplished by using Redfish scripts. The iDRAC9 Automatic Certificate Enrollment and Renewal feature automatically assures SSL/TLS certificates are in place and up to date for both bare-metal and previously installed systems. The Automatic Certificate Enrollment and Renewal feature requires the iDRAC9 Datacenter license.
TLS 1.3
TLS 1.3 offers several advantages over TLS 1.2. TLS version 1.3 uses advanced encryption algorithms, fewer cipher suites and, faster and more secure handshakes. Enabling TLS 1.3 results in better network connection performance.
Many new operating systems and browsers support TLS 1.3. Web browsers and command-line utilities, such as RACADM and WS-Man, use this TLS/SSL certificate for server authentication and to establish an encrypted connection. If the HTTPS server is configured for TLS 1.3, the clients will automatically detect it and perform the operation over TLS 1.3.
iDRAC9 Web Server can be configured with options to support “TLS 1.3 only.” Use the “TLS 1.3 only” option when the HTTPS client can support it. Older browsers that do not support TLS 1.3 should be configures to “TLS 1.2 and Higher” or “TLS 1.1 and Higher.”
Once iDRAC is configured and the TLS/SSL certificate is installed on the management stations, SSL enabled clients can access iDRAC securely and without certificate warnings.
Conclusion
iDRAC9 continues to support that latest security standards to meet the needs of security focused customers. iDRAC9 5.10.00.00 TLS 1.3 support over HTTPS, enables you to use the most current security stance for remotely managing your PowerEdge servers.

Improve Operational Efficiency Through OME Server Drift Management
Mon, 16 Jan 2023 16:23:05 -0000
|Read Time: 0 minutes
Summary
As they say “drift happens” … Ideally, firmware versions and configuration settings such as for iDRAC and system BIOS set up across a server environment should remain consistent. Configuration drift refers to the phenomenon where server(s) configurations ‘drift’ toward an inconsistent state. This Direct from Development (DfD) tech note describes how capabilities in Dell’s OpenManage Enterprise server management appliance facilitates the simplification of drift management, gives visibility of problems while at the same time reduces the time and effort to resolve.
Introduction
The failure to ensure a consistent server firmware version and configuration settings or not to detect unauthorized changes increases the risk of operational problems, security breaches, and even server outages. Why does this happen? – This situation can have many causes, including poor processes, routine hardware upgrades and replacements, or even attacks from external threats. What is the scope of the impact? – Any number of firmware versions or configuration settings. For example, in a secure environment many elements such as iDRAC user accounts / USB ports / server boot order may be areas of key interest. Dell’s OpenManage Enterprise management console (“OME” for short), provides compliance features that detect, highlight, and remediate issues, with simple processes for both firmware versions and configuration settings. OME also provides easy-to- create baseline configurations, using the intuitive server configuration templates/firmware catalogs, to streamline the capture/creation of required values, analyze multiple servers, and then apply the desired state. To perform any tasks in OME, you must have the correct role-based user privileges and scope-based operational access to the devices.
Managing configuration settings
Let’s look at configuration settings first. This is based on the iDRAC’s “server configuration profile” concept. A compliance template captures the server BIOS, iDRAC, and components’ configuration settings. A template can consist of hundreds of firmware settings, including iDRAC, BIOS, PERC RAID, NICs, and FC HBA configurations.
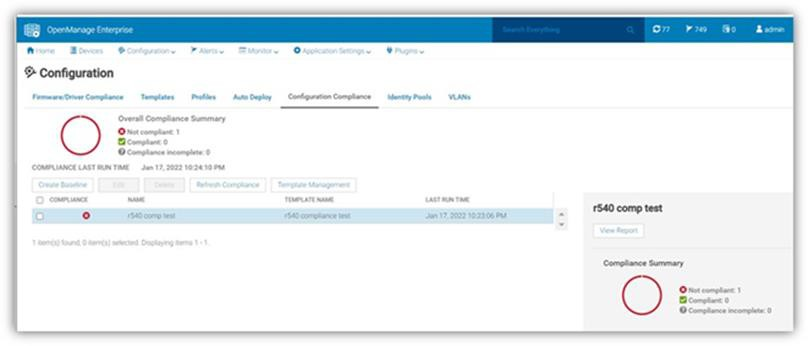 Figure 1: Configuration compliance status of server against configuration baseline
The OpenManage Enterprise Advanced license must be enabled on each server’s iDRAC to use this configuration compliance solution.
There are four basic steps to ensure configuration compliance:
- Create a compliance template to capture all required server configuration settings.
- Associate the compliance template to one or more servers to create a baseline group.
- Compare the template with the actual settings for each server and report.
- Remediate non-compliant servers with a single-click. Customers can create a compliance template from an existing deployment template, either by using OME to extract it from a “reference” server or by importing an existing template from a file. Each server associated with the baseline has its own itemized compliance status.
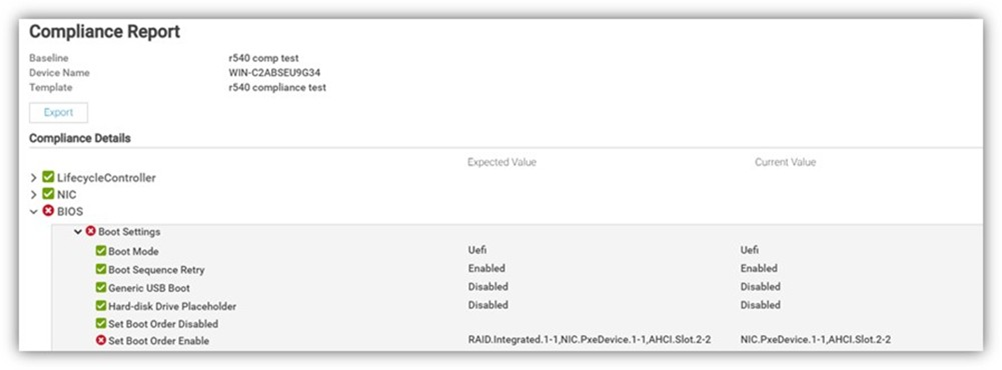
Figure 2. Drill down view of “Compliance Report” screen that shows a compliance failure
When servers appear on the non-compliant list, remediation is simple to accomplish. A “one-click” compliance using the “Make compliant” button can be started immediately or scheduled. Note: a server reboot may be required to make the selected devices compliant.
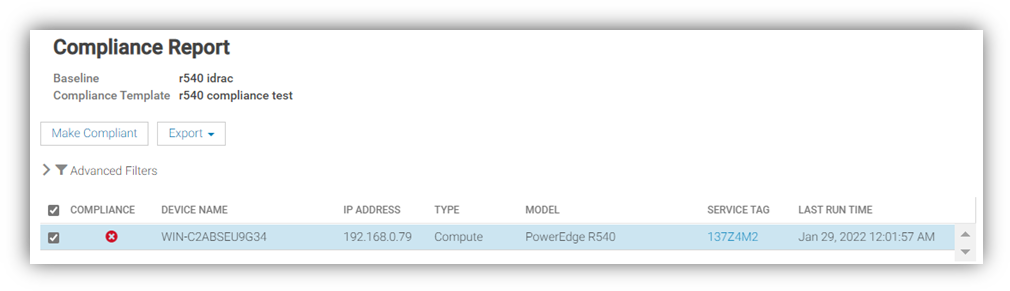
Figure 3. One-click “Make Compliant” button
After this baseline is created, more servers can be added to the baseline at any time, and the corresponding server template can be amended, cloned, or exported to another instance of OME. Finally, in “Reports” there is a pre-defined “Devices Per Configuration Baseline” report, which details the servers associated with each configuration baseline and each device’s compliance status. Using the reporting mechanism, the report can be downloaded or emailed. (In an upcoming release, OME will automate the process of report scheduling and emailing.)
Managing firmware versions
In the modern server there are many components that have firmware, such as system BIOS, iDRAC, NICs, PERC, and hard drives. OME can inventory, report, and update firmware versions. If managing firmware versions is required to deliver consistency across a fleet of servers, this can be achieved by using the “Firmware and Driver Compliance” element of OME.
Managing firmware version compliance, including firmware updating, does not require an OpenManage Enterprise Advanced license.
There are four steps to perform this compliance:
- Build a list of firmware versions to be scrutinized against the servers that require checking. This required server firmware “build” can be created from a default catalog of firmware versions (use OME to download the latest one from Dell Support). You can also build a custom catalog from repository manager or by using the Update Manager plugin for OME that is available with OME 3.5 or higher.
- Select the servers to be compared for compliance to create a baseline group.
- OME compares the catalog against the installed firmware then reports the overall and itemized compliance status of each server in the baseline.
- Remediate non-compliant servers with a single click.
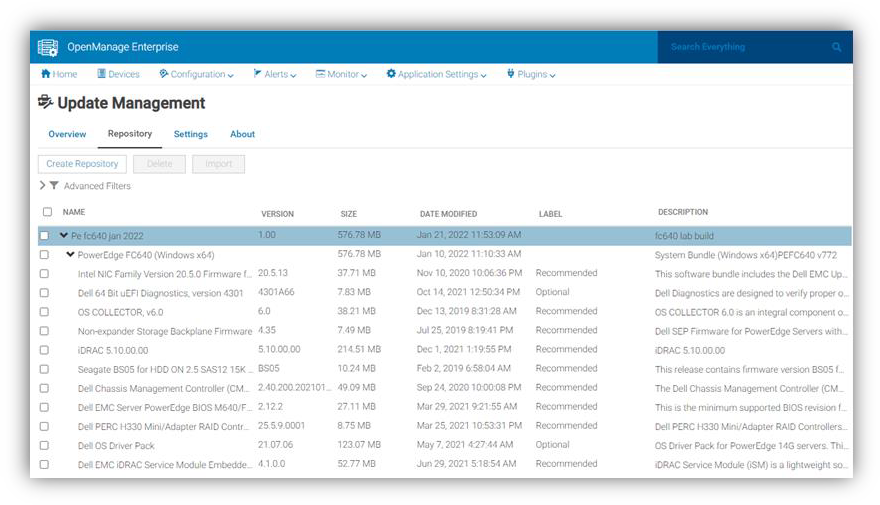
Figure 4. View of firmware versions created in “custom” catalog by Update Manager plugin
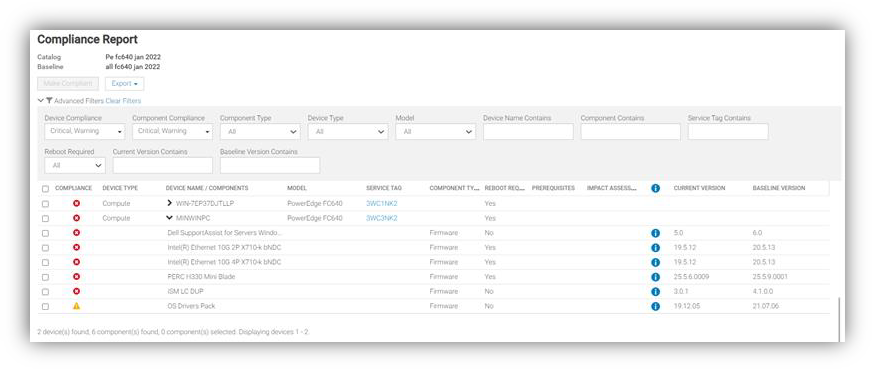
Figure 5. Drill down view of Compliance Report in case of firmware compliance failures
When servers appear as non-compliant, remediation is simple to accomplish. A “one-click” compliance task can be started immediately or scheduled by the “Make compliant” button. Note: a server reboot may be required to make the selected devices compliant. Again, in “Reports” there are pre-defined reports named “Firmware Compliance per Device Report”/”Firmware Compliance Per Component Report”. These reports detail the server’s firmware versions and status. Using the reporting mechanism, these can be downloaded or emailed. As we mentioned earlier, firmware version compliance, including firmware updating does not require an OpenManage Enterprise Advanced license. In addition, driver compliance and updates are available for servers running Microsoft Windows 2016, 2019, or 2022.
Conclusion
Configuration and firmware compliance increases control while decreasing drift related issues and risk. Dell OpenManage Enterprise not only brings advanced feature rich server management to PowerEdge customers -- it also brings the power of automation to reduce effort, decrease time to resolution, and reduce management costs.
References
For additional details see:
- Firmware Baseline Video
- Support for OpenManage Enterprise
- Dell Technologies Developer Portal
- Systems Management community

CloudIQ Provides Data Driven Server Management Decisions
Mon, 16 Jan 2023 16:04:16 -0000
|Read Time: 0 minutes
Summary
CloudIQ for PowerEdge provides a single easy-to-use portal to view the health and information of Dell Servers. CloudIQ’s powerful reporting backend enables customers to visualize and analyze server performance data. Key hardware metrics are collected, regardless of operating system and applications installed. Beyond reporting current server performance data, CloudIQ historical seasonality and anomaly detection accelerates issue detection and resolution for customers. This Direct from Development (DfD) tech note describes both the existing data server metrics reporting capabilities and the new historical seasonality with anomaly detection feature in PowerEdge for CloudIQ.
Introduction
CloudIQ is a cloud based proactive application that delivers insights and recommendations that give customers a consolidated view of PowerEdge servers and other Dell data center infrastructure, including storage, networking, and data protection systems. It can also consolidate multiple OpenManage Enterprise instances into a single portal.
Server Metrics
iDRAC
The advanced agent-free architecture in iDRAC (Integrated Dell Remote Access Controller) incorporated in each PowerEdge server provides data about CPU performance, thermals, and power consumption. In order to collect these server metrics, each iDRAC needs to have at least an Enterprise, or OpenManage Enterprise Advanced license installed. If Data Center licenses are installed on the iDRACs, additional metrics for NIC traffic, Fibre Channel traffic, and SSD/NVMe device data are also available. Server metrics are compiled on individual iDRACs and then collected by OME. OME then consolidates and securely uploads this data to CloudIQ every 15 minutes.
CloudIQ
Within CloudIQ, the performance page displays a summary per server in a dashboard view (Fig. 1). Clicking into a single server, customers can view several ready to use server performance visualizations for significant measurements, such as CPU usage, system thermals, and power consumption. This includes the new ability to track and display historical seasonality data and anomaly detection (Fig. 2). The customer can also create custom graphs in the “report browser” feature (Fig. 3).
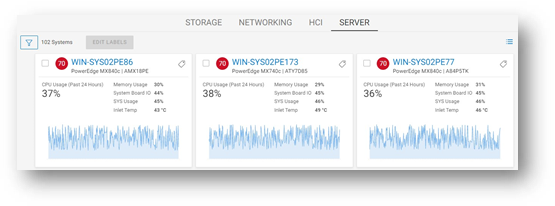
Figure 1 : Server Performance – Summary Dashboard
Anomaly Detection
The new ability based on historic seasonality data lets CloudIQ highlight irregular server behavior. Customers can now view a range of statistically normal behavior for each server’s performance metrics on the performance details page. This is calculated using data from each specific server based on a rolling three-week analysis per metric. The metrics chart visuals now highlight an anomaly any time the metric breaches the normal range within the last 24 hours. Anomaly detection is supported for all metrics that are displayed on the system performance page.
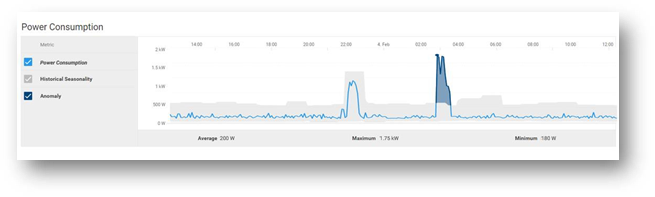
Figure 2: Server Performance – Example “Power Consumption” highlighting anomaly detection
Custom Reports
CloudIQ can create custom reports for up to 55 different server metrics. Customers can schedule reports to be run and emailed on a daily, weekly, or monthly basis. The data can also be exported as a CSV or PDF file.
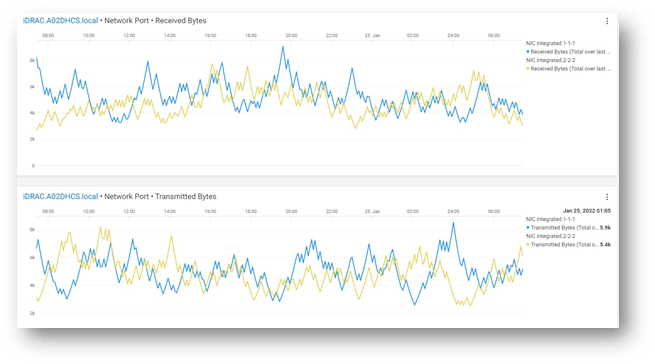
Figure 3 : Server Performance - From Metric Browser – Example custom graph showing NIC data
Example Server Metrics
The following table shows a selection of some server metrics available. For a complete list, see Appendix A2 in the white paper PowerEdge Metrics in CloudIQ using OpenManage Enterprise (OME): An Overview.
Metrics | Sample Timing | License Required |
System Performance |
|
|
CPU Usage % 1 | Avg of 5 minute sample | OME-Advanced or Data Center |
IO Usage (PCI Express traffic) % 1 | Avg of 5 minute sample | OME-Advanced or Data Center |
Memory Usage (channels bandwidth ) % 1 | Avg of 5 minute sample | OME-Advanced or Data Center |
System Usage % (amalgamation of CPU / IO and memory usage) 2 | Avg of 5 minute sample | OME-Advanced or Data Center |
System Power |
|
|
System Power Consumption kWh | Avg, Min and Max of 15 minute sample | Enterprise |
System Thermal |
|
|
Temperature Reading Degrees C 2 | Avg of 5 minute sample | Enterprise |
Sys Net Airflow CFM 2 | Avg of 15 minute sample | OME-Advanced/ Data Center |
NICs |
|
|
TxBytes 2 | Total in 5 minute samples | Data Center |
RxBytes 2 | Total in 5 minute samples | Data Center |
FC HBAs |
|
|
FCRxKBCount 2 | Total in 5 minute samples | Data Center |
FCTxKBCount 2 | Total in 5 minute samples | Data Center |
- – System performance data on 12 and 13 generation servers only require an iDRAC enterprise license.
- – iDRAC9 only
Basic Metrics include Power, Thermal, and CPU. YX5X servers have different Basic Metrics, based on whether they are AMD or Intel:
- Intel model Basic Metrics include Power, Thermal, CPU, IO, and Memory utilization.
- AMD model Basic Metrics include Power, Thermal, and CPU
Conclusion
Some customers say, “slow is the new down”! With in-depth visibility of key performance metrics for servers, storage, and networking infrastructure, CloudIQ allows customers stay on top of all their Dell data center resources, giving them the ability to manage, analyze, and plan proactively.
References
For more details about the available PowerEdge Metrics in CloudIQ, see the full table in Appendix A2 of the white paper PowerEdge Metrics in CloudIQ using OpenManage Enterprise - An Overview.
For more information, see:

Designing for the Edge: PowerEdge and NEBS
Mon, 16 Jan 2023 15:33:02 -0000
|Read Time: 0 minutes
Summary
Compute infrastructures are evolving to meet the demand for low latency, distributed computing outside the data center. These edge environments can present unique challenges that traditional servers do not address. Dell PowerEdge has led the way in designing and delivering reliable servers built for the edge.
Introduction
As computing expands beyond the data center, there is a need for enterprise-grade servers that offer reliable performance in environmentally challenging facilities. A traditional data center can provide power redundancy, climate control, and physical security. However, a server deployed in a telephone network's central office, a manufacturing facility, or in a retail backroom may be more exposed to the effects of natural disasters, extreme temperatures, high humidity, airborne contaminants, high altitude, lightning, impact shock, vibration, or EMI emissions. Dell Technologies understands the unique challenges of these environments, and our engineering teams design our edge servers to be certified rugged for NEBS.
What is NEBS Testing?
The North American telecom industry requires service providers and edge computing providers to be Network Equipment-Building System (NEBS) compliant to ensure network integrity, compatibility, and safety. Being NEBS compliant indicates that the products and equipment operate reliably at the edge. Therefore, network operators need to invest in suppliers who ensure their performance through rigorous testing.
With the adoption of 5G, rapid network expansion, and the need for carriers to successfully manage their infrastructure during extreme weather events, the demand for NEBS-compliant devices is only increasing.
NEBS Test Levels
NEBS compliance ensures that a server meets the GR-63-CORE and GR-1089- CORE standards and is made up of various levels that distinguish certain aspects of testing. Each one verifies a different performance specification with operational requirements. For example, the lowest level of NEBS compliance, Level 1, is used for prototypes in laboratory trials. By contrast, the highest level, Level 3, is typically required for equipment deployed in a communications network.
Many standards fall within the scope of NEBS. The standards most used are:
- GR-1089-CORE - Electromagnetic compatibility and electrical safety
- GR-63-CORE - Physical protection
The NEBS Levels are described below. Note that successive levels incorporate previous level requirements.
- NEBS Level 1: Addresses equipment safety measures and requirements for GR-63-CORE and GR-1089-CORE standards. Typically used by service providers for prototype equipment for trial and limited deployment equipment.
- NEBS Level 2: Addresses equipment operability in controlled environments such as data centers. Level 2 includes all requirements of Level 1 with some added level of operability reliability.
- NEBS Level 3: Determines that the equipment meets all the requirements of GR-63-CORE and GR-1089-CORE. This provides the highest assurance of product operability. Most TCGs require Level 3 before acceptance/installation on the networks.
NEBS Level 1 | NEBS Level 2 | NEBS Level 3 |
GR-63
GR-1089
|
GR-63
GR-1089
|
GR-63
GR-1089
|
Table 1. NEBS Levels
NEBS Testing
NEBS testing is designed to simulate conditions at the edge. The following section shows the test areas in more detail.
Thermal and Altitude Exposure
Servers deployed at the edge can be exposed to extreme temperatures, humidity, or high altitude. These conditions can occur during transport, storage, or operation. This testing ensures that a server functions reliably during and after exposure.
Test | Server State | Test Conditions |
Non-Operational Test | Off |
|
Operational Test | On and running system stress |
|
Simulated Fan Failure | On and running system stress |
|
Altitude Exposure | On and running system stress |
|
Table 2. Thermal and Altitude Testing
Flame Resistance
In rare instances, a server can malfunction and produce sparks or fire. This testing ensures that the flames do not escape from the server chassis and damage adjacent people, equipment, or facilities. The fire must be confined to a failing chassis, and the chassis should self-extinguish and dissipate the smoke. In addition, the server materials must be flame retardant to minimize the spread of flames.
Shipping Impact Survivability
While shipping partners do their best to handle equipment carefully, accidents happen. When a packaged server is dropped, it should not sustain significant damage. NEBS testing ensures the server packaging material protects the server during typical shipping scenarios. This testing includes drops from heights up to 1M (weight dependent) on all axes.
Seismic and Vibration Robustness
A server must withstand transportation vibration and earthquakes up to 8.3 on the Richter Scale. Drives, risers, memory, PCIe devices, and other components should not dislodge, break, become loose, or stop functioning after experiencing seismic or transportation vibrations. A server is subjected to a prescribed motion waveform that simulates typical earthquake motion. This motion occurs in multiple axes over time, and once complete, the server is checked for damage and proper functionality. The server must not sustain permanent damage and should function normally after the test.
Airborne Contaminants
Servers deployed to edge sites such as factory floors or cell towers may encounter contaminants not seen in a clean, climate-controlled data center. In this testing, servers are exposed to various contaminants over approximately ten days and should function properly after the test. The fan filter must block contaminants and allow the server to deliver reliable performance. The filter must be replaceable while the server is operational. The exposure testing includes gas with corrosive material and hygroscopic sand-like contaminants
Acoustic Noise
High-performance fans move an enormous amount of air and can be loud. Therefore, NEBS testing includes checking the sound power while running fans at maximum speed to ensure OSHA compliance. The server should be less than 78dB at max fan speed in Telco Room testing and less than 83dB at max fan speed in Power Room testing.
ESD Robustness
Electrostatic discharge happens. Servers must function as designed after exposure to ESD. This exposure testing includes close and open chassis scenarios that simulate a field repair scenario. ESD testing includes 8kV contact discharge and 15kV air discharge
EMI Emissions and Immunity
Electromagnetic interference, or EMI, is present in areas with electronic equipment. EMI can be exceptionally high when lots of electrical equipment is placed in confined spaces. This testing ensures that a server does not radiate emissions beyond the max allowed and that it can survive exposure to emissions from other devices.
Lightning and Surge Robustness
Edge servers may encounter periodic site lightning. Given proper grounding, the server must survive a power surge from lightning. This test simulates the power surge generated from a lightning strike and the server's ability to function correctly afterward.
Designing for the Edge
Dell works with customers and partners to understand the unique challenges of operating outside the data center. We use this knowledge and experience to build best-in-class, enterprise-grade servers that offer reliable performance at the edge. Some edge servers offered by Dell include the PowerEdge XR11, XR12, and XE2420. The following section highlights some of the design elements of our edge servers.
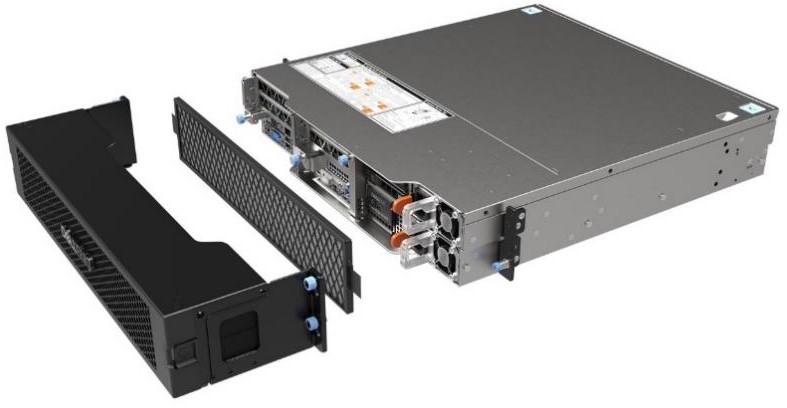
Figure 1. Dell PowerEdge XE2420 with optional bezel filter
Rugged, Flexible, Compact Chassis Options
- Hot and cold aisle access options
- AC and DC power supply support
- Short chassis depth for confined spaces
- Support for full-size PCIe cards
- Individual locking mechanisms prevent dislodging of add-on cards
- Optional bezel air filter to protect against airborne contaminants
Optimized Thermal Performance
- High-performance fans
- Minimal in-chassis airflow obstructions
- Unique chassis designs eliminate preheated air across add-in devices like GPU accelerators
- Configurable thermal management with iDRAC
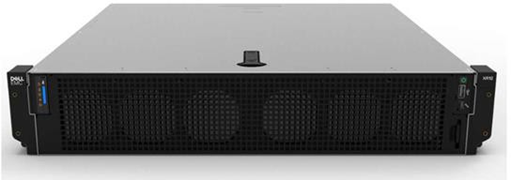
Figure 2. Dell PowerEdge XR12
Conclusion
With the need for organizations to integrate products from many vendors into large, robust systems, they need to be confident that these products are resilient. NEBS testing ensures that these products meet a high standard of reliability and longevity at the edge. So, choosing a Dell PowerEdge server that is certified rugged for NEBS gives you the peace of mind that your server can perform in rough environmental conditions at the edge, with the guaranteed reliability of Dell PowerEdge.
References
- Telcordia. NEBS Requirements: Physical Protection. Generic Requirements, GR-63-CORE, Issue 5, December 2017
- Telcordia. Electromagnetic Compatibility (EMC) and Electrical Safety - Generic Criteria for Network Telecommunications Equipment. Generic Requirements, GR-1089-CORE, Issue 7, December 2017

Advanced Features of the iDRAC9 eHTML Virtual Console
Mon, 16 Jan 2023 15:15:34 -0000
|Read Time: 0 minutes
Summary
The iDRAC9 Virtual Console feature allows users to perform server operations remotely as if they are in front of the server, bringing more flexibility and security. Beginning with iDRAC9 firmware 6.00.00, eHTML5 will be the single option to access virtual console and virtual media.
Introduction
Embedded with every Dell PowerEdge server, the integrated Dell Remote Access Controller (iDRAC) enables secure and remote server access, providing out-of-band and agent-free systems management. One of the most often-used iDRAC features is the virtual console. For well over a decade, IT admins have relied on the ability to remotely access the operating system and perform a variety of features.
The virtual console feature allows users to remotely manage their PowerEdge server using video, keyboard, and mouse from their management system. It allows video- keyboard-mouse redirection over the network and to virtualize the remote server console on management system. The user can perform all operations with the remote host as if they are in front of the server.
As far back as DRAC4, there were two client plug-in options available: Java and ActiveX, to enable the launch of a virtual console to a remote host server. The Java/ActiveX plug-in had features like server power control, mapping first boot device, keyboard macros, performance statistics, and chat client. However, both these native plug-ins are prone to vulnerabilities. Later, HTML5 technologies became popular, having most of the features in Java/ActiveX plug-ins, and are inherently more secure as they are run in the browser. In March of 2016, Dell Technologies added an HTML5 browser-based plug-in option to iDRAC7/8 firmware version 2.30.30.
Enhanced HTML5
To bridge the JAVA/ActiveX and HTML5 feature/security gap, Dell Technologies introduced eHTML5 (enhanced HTML5) with features set on par with the Java plug-in with iDRAC9 4.40.40 in December of 2020. This eHTML5-based solution consists completely of Dell developed code. This brings more flexibility and control in terms of maintainability and future enhancement around this solution.
Beginning with iDRAC9 firmware 6.00.00, eHTML5 will be the single option to access the virtual console and virtual media.
Features offered with eHTML5:
- HTML5 only with video encryption always ON
- Server power control options
- Next boot device menu
- Video logs (up to three BIOS boot logs and OS crash logs) in standard MPEG format
Sessions management:
- Up to six concurrent sessions
- Access sharing handshake among connected clients
- Chat option
- Connected users list Secure solution:
- Video encryption always enabled
- Local video enable/disable option
- Auto lock server while exiting vConsole session Keyboard support:
- Virtual keyboard layout (English, French, German, Spanish, Japanese, Chinese)
- Virtual clipboard
- Keyboard macro menu
- Screen capture, refresh, full screen
- Performance
- Performance statistics display
- Performance tuning knobs
Virtual media solution
The eHTML5 virtual media solution is also completely redeveloped by Dell with all legacy features supported. The new vMedia solution is ~30% faster than the legacy HTML5-based client.
It also has an additional feature of IMG file creation which is useful when a user wants to attach some local file folder to a remote server for transferring data.
The remote file share feature is extended for one more image file attachment. This is very useful in an OS-deployment scenario to attach an additional password file along with an ISO image.
Table 1. Comparison with legacy options
Java/ActiveX | HTML5 | eHTML5 |
Security concerns |
|
|
Conclusion
The iDRAC is designed for secure local and remote server management and helps IT administrators deploy, update, and monitor Dell PowerEdge servers anywhere, anytime. The iDRAC Virtual Console feature enables system administrators to be more productive and improve the overall availability of Dell PowerEdge servers.
References

Harden Your Server Cybersecurity With Dell CloudIQ
Mon, 16 Jan 2023 15:08:21 -0000
|Read Time: 0 minutes
Summary
It can take years for an organization to build a good reputation with its customers and few minutes of a cybersecurity related incident to ruin it. Cybersecurity teams and server administrators must use every tool in their armory to harden infrastructure. Here is a feature of Dell CloudIQ that every Dell PowerEdge customer should know about. This Direct from Development (DfD) tech note describes the cybersecurity capabilities for PowerEdge servers that are built into CloudIQ. CloudIQ is a cloud AI/ML- based monitoring and predictive analytics application for the Dell infrastructure product portfolio. Hosted in the secure Dell IT Cloud, CloudIQ collects and analyzes health, performance, and telemetry to pinpoint risks and to recommend actions for fast problem resolution.
Introduction
Dell CloudIQ offers a cybersecurity feature that now includes Dell PowerEdge servers. The cybersecurity feature built into CloudIQ lets customer server teams build a policy called an evaluation plan. This evaluation plan is built from a number of ready to use “click to pick” configuration criteria tests. This list of configuration settings and values is based on Dell Technologies best practices and the American NIST (National Institute of Standards and Technology) cybersecurity framework.
An approach for rapid results
A specialist with the right skills who understands the exact security configuration settings with correct values could build a server configuration profile “SCP” and use it directly with the iDRAC or OME configuration template feature to set server configurations. However, CloudIQ offers a much quicker and prescriptive method to implement a cybersecurity assessment policy that is built on Dell’s recommended settings and values. To further streamline the cybersecurity process, CloudIQ can aggregate multiple OME instances, offering one consolidated view of servers across many locations. Some organizations may choose to use both OME and CloudIQ to demonstrate the separation of configuration compliance and security management.
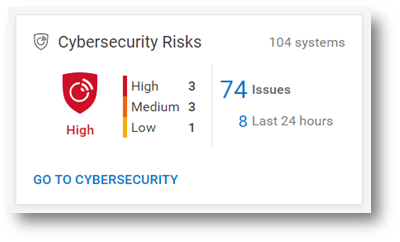
Figure 1. Cybersecurity status summary from the CloudIQ Overview page
This cybersecurity tile on the CloudIQ overview page provides an aggregated risk level status view, breaking down the number of systems in each risk category and the total number of detected issues. The risk is determined by the severity and the number of issues per server.
For example, a server with one or more high risk problems is categorized as high risk. Another server with more than five non-high risks, of which one is a medium issue, would also be categorized as high risk.
Identify risks fast
The system risk dashboard classifies each server with a policy applied, displaying each server in its own card with the cybersecurity risk level status. This helps customers quickly prioritize actions and speed time to resolution.
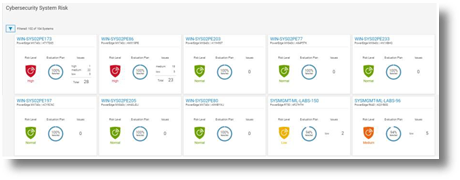
Figure 2. Cybersecurity System Risk all systems dashboard
Beyond the dashboard, the security assessment status displays the details for each server, with recommended action to return any deviated security configuration to the preferred state. The donut chart displays how many rules been selected as a percentage from total tests in the risk evaluation plan that are assigned to the particular server.
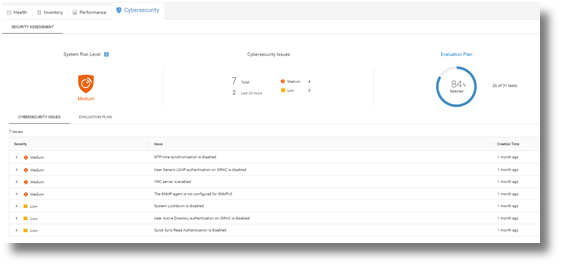
Figure 3. Cybersecurity Risk details and recommendations
On the system detail page, under the cybersecurity tab, are details about the evaluation plan and its status. The bottom of the page has two tabs: Cybersecurity Issues, detailing each non-compliant element with its corrective action, and Evaluation Plan, displaying the entire plan and the selection status of each test.
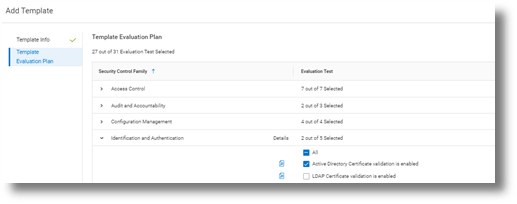
Figure 4. Test selection
CloudIQ users can also select to receive a Daily Digest email, including a Cybersecurity status summary.
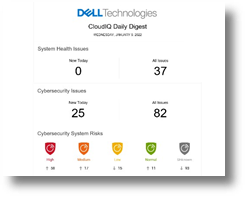
Figure 5. CloudIQ Daily Digest email
Enablement and security
As you would expect, many security access controls are built into CloudIQ around administrator and user accounts. There are two Cybersecurity roles built to CloudIQ: Cybersecurity Admin and Cybersecurity Viewer. These roles can be assigned from accounts that have CloudIQ administrator rights.
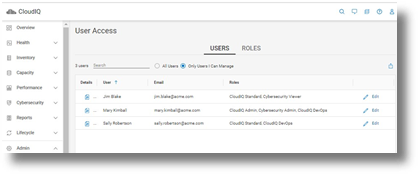
Figure 6. RBAC setup
To support cybersecurity for PowerEdge within CloudIQ, customers must be running OpenManage Enterprise 3.9 or higher, with the CloudIQ plugin 1.1 or higher enabled. All servers require Dell ProSupport coverage and must already be discovered by OME.
PowerEdge cybersecurity evaluation plan test elements
The following table lists each test criteria and the test plan family to which it belongs.
Family | Title |
System & Communications | IPMI over LAN interface is disabled |
System & Communications | IPMI Serial over LAN is disabled |
System & Communications | Virtual Console encryption is enabled |
System & Communications | Virtual Media encryption is enabled |
System & Communications | Auto-Discovery is disabled |
System & Communications | VLAN capabilities of the iDRAC are enabled |
System & Communications | iDRAC Web Server has TLS 1.2 or TLS 1.3 enabled |
System & Communications | iDRAC Web Server HTTP requests are redirected to HTTPS requests |
System & Communications | Virtual Console Plug-in type is enabled |
System & Communications | iDRAC is using the dedicated NIC |
System & Communications | iDRAC Web Server has TLS 1.2 or TLS 1.3 enabled |
Access Control | IP Blocking is enabled |
Access Control | VNC server is disabled |
Access Control | The SNMP agent is configured for SNMPv3 |
Access Control | Quick Sync Read Authentication to the server is enabled |
Access Control | SSH is disabled |
Access Control | User Generic LDAP authentication on iDRAC is enabled |
Access Control | User Active Directory authentication on iDRAC is enabled |
Configuration Management | USB Ports are disabled |
Configuration Management | Telnet protocol is disabled1 |
Configuration Management | System Lockdown is enabled |
Configuration Management | Configure iDRAC from the BIOS POST is disabled |
Audit & Accountability | NTP time synchronization is enabled |
Audit & Accountability | NTP is secured |
Audit & Accountability | Remote Syslog is enabled |
System & information integrity | Local Config Enabled iDRAC configuration on Host system is disabled |
System & information integrity | Secure Boot is enabled |
Identification & Authentication | Password has a minimum score of Strong Protection |
Identification & Authentication | LDAP Certificate validation is enabled |
Identification & Authentication | Active Directory Certificate validation is enabled |
Identification & Authentication | iDRAC Webserver SSL Encryption using 256 bit or higher |
Identification & Authentication | iDRAC Web Server - SCEP is enabled |
|
|
1 Starting with iDRAC firmware release version 4.40.00.00, the telnet feature is removed from iDRAC.
Summary
Unlike the typical IT team member, CloudIQ doesn’t need to eat, sleep, or go on holiday, so organizations can rely on CloudIQ cybersecurity policies to continuously monitor for non-compliant servers. Cybersecurity built into CloudIQ lets customers speed up the delivery of server security through automation of pre-defined tests and status visualization. This provides high levels of flexibility for server administrators, all while maintaining the governance and control that cybersecurity teams need to enforce. CloudIQ further reduces risk and improves IT productivity by displaying cybersecurity, plus the system health status of servers, and the wider Dell infrastructure portfolio—all together in the same convenient, cloud-based portal.
References
CloudIQ on Dell.com - for product information, demo videos and more
Take Control of Server Cybersecurity with Intelligent Cloud-Based Monitoring Blog
Building and Tracking Dell CloudIQ Cybersecurity Policies for PowerEdge Servers Video
Technical Knowledge Page For OpenManage Enterprise CloudIQ Plugin

Dell CloudIQ Cybersecurity For PowerEdge: The Benefits Of Automation
Mon, 16 Jan 2023 15:08:26 -0000
|Read Time: 0 minutes
Summary
There are many server settings that customer infrastructure teams can select to harden servers against growing cyber threats. But how can they find and use Dell’s security configuration settings best- practices? And how can they efficiently and continuously check if the settings are incorrectly configured or have changed? The answer is the cybersecurity feature in the CloudIQ for PowerEdge AIOps solution. It compares the configuration of deployed PowerEdge servers to a security related configuration policy. When CloudIQ identifies a deviation between the actual settings and the recommended configuration settings, it notifies the administrator and recommends remediation steps to correct the issue(s). This Direct from Development (DfD) tech note details the time savings that customers can achieve by using the CloudIQ automated cybersecurity policy engine versus manually examining compliance.
Introduction
In today’s always-on, always-connected environment, all organizations constantly need to enhance their cybersecurity strategy to mitigate the increasing threat of attack. Using the built-in cybersecurity feature of Dell CloudIQ, customers can easily build security policies to protect PowerEdge servers. A policy consists of ready-to-use tests that customers can enable simply by selecting a checkbox. The tests consist of infrastructure security settings that are based on Dell best practices and the American NIST (National Institute of Standards and Technology) cybersecurity framework. Dell CloudIQ Cybersecurity for PowerEdge both enables the easy creation of a policy and automates the policy policing—making it simple, efficient, and predicable.
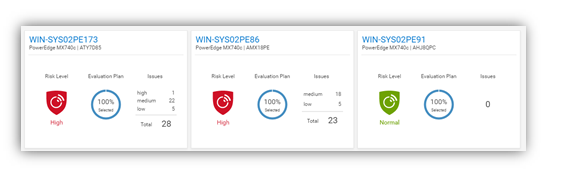
Figure 1. CloudIQ Cybersecurity Dashboard
CloudIQ is the AIOPs proactive monitoring and analytics application that delivers system health insights and recommendations for Dell infrastructure solutions, including storage, data protection, networking, and of course, PowerEdge servers.
The cybersecurity policy engine built into CloudIQ has over 30 security configuration rules for PowerEdge that can be implemented simply. Because CloudIQ is cloud based, it can integrate with any number of OpenManage Enterprise (OME) instances across multiple datacenters, through the OME CloudIQ Plugin. This means that CloudIQ can apply the same policy to multiple OME managed servers, regardless of their location. This feature is delivered by CloudIQ without any additional configuration at the iDRAC or OME level. When a policy is established, CloudIQ continuously checks the desired state of PowerEdge security configuration settings against the current “as is” configuration. If a server is found to be out of policy compliance, it is highlighted. The results are scored by CloudIQ, with the most vulnerable servers being given a “high” risk level. Individual problems can be viewed with recommended remediation. These recommended security configuration corrections can then be executed one-to-one per server using the iDRAC GUI. If multiple hosts are found to be non-compliant, then OME can be used to deliver a configuration update template file or execute a RACADM script to correct the security configurations for multiple servers.
The Benefits Of Automation
To understand the profound impact of the automation of this process, we have tested it against a manual process for 1, 10, 100*, and 1,000* servers. Based on the testing of the CloudIQ Cybersecurity approach for a customer with 1000* servers, we found the following:
- The CloudIQ task completed 99% quicker than a manual review.*
- CloudIQ reduced the time by 98 hours to complete the task once.*
- Using CloudIQ Cybersecurity automation saves over a week of effort immediately versus manual.*
- Once enabled, CloudIQ monitors of all these key security configuration settings continuously.
*Projected outcomes based on analysis of results, results may vary.
In the lab testing, we found that manually checking 15 settings on the iDRAC GUI took 5 minutes 56 seconds. By contrast, creating a CloudIQ cybersecurity policy consisting of 15 active test items and selecting target server(s) only took 2 minutes 58 seconds. In addition, whether creating the policy for 1, 10, 100, or 1000 servers, this task took the same amount of time. However, using the manual process, each additional server added an additional 5 minutes 56 seconds to complete the checks. Also, after the policy is set, CloudIQ continues to check the servers’ as-is settings for compliance.
Results Summary
The following graph highlights the differences between automation and the manual process, showing the time saving advantages.
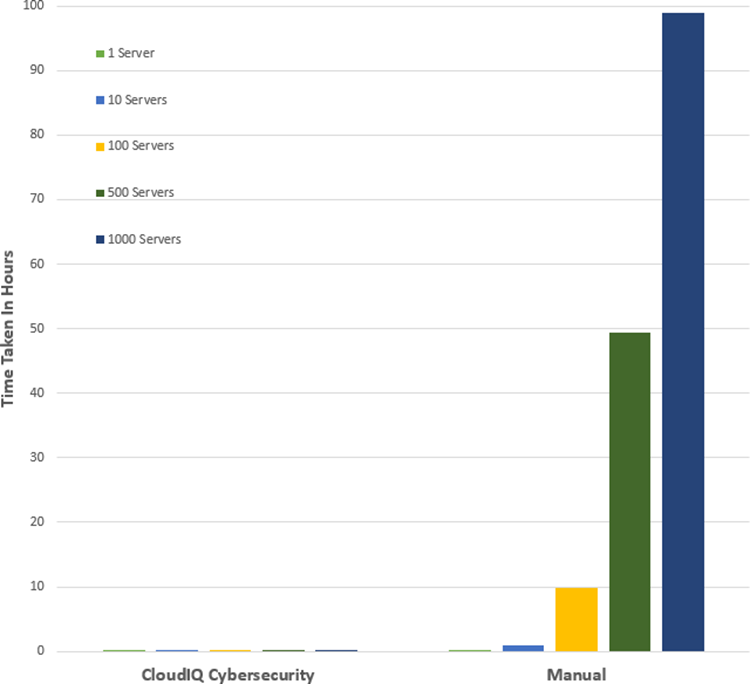
See Table 1 near the end of this document for full results.
Testing Overview
To demonstrate the ease of use and the impact of automation, we tested two different approaches: manual versus automation. To use this Cybersecurity feature of CloudIQ:
- OpenManage Enterprise 3.9 “OME” or higher must be installed, with the CloudIQ Plugin 1.1 or higher enabled
- the PowerEdge server(s) must be covered by Dell Pro Support
- the target servers for the policy must already be discovered by OME
To build the policy, the user must have the CyberSec admin rights assigned in CloudIQ. Some of the configuration rules used in the test security policy are the iDRAC default values. However, any of these values can be changed on an individual iDRAC by administrators with the correct rights, opening a security weakness.
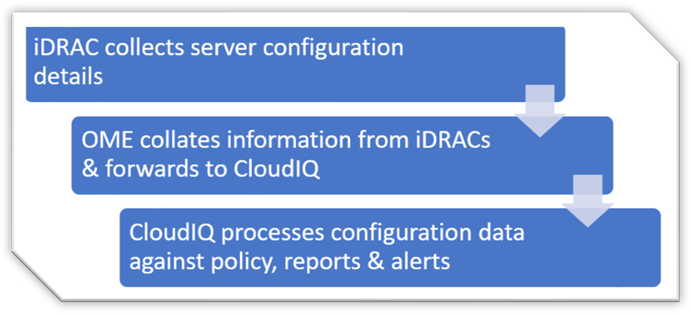
Figure 2. Configuration Data Flow
Testing Procedure
To ensure an accurate comparison of the test approaches, we rigidly tested and documented our testing. We selected 15 common settings, a mixture of BIOS and iDRAC configuration values, and enabled 15 tests in the trial policy.
Tests were conducted in-house on July 6, 2022, at Dell Technologies in Austin TX, in the technical marketing lab facility and online using Dell’s CloudIQ offering.
I. USB ports: Disabled
II. iDRAC active NIC: Dedicated
III. System lock down: Enabled
IV. iDRAC config from host: Disabled
V. IPMI over LAN: Disabled
VI. Secure boot: Enabled
VII. Password policy: Strong
VIII. VNC: Disabled
IX. SNMP version 3: Enabled
X. SSH: Disabled
XI. Syslog: Enabled
XII. Active directory authentication: Enabled
XIII. IP blocking: Enabled
XIV. Virtual media encrypted: Enabled
XV. NTP time synchronization: Enabled
Steps for an automated approach: using CloudIQ PowerEdge Cybersecurity policy
Starting from the CloudIQ “sign in page” https://cloudiq.emc.com:
- Sign into CloudIQ.
2. From the menu down at the left-hand side of the screen. select Cybersecurity.
3. Select Policy.
4. Select the templates tab.
5. Select add template.
6. Name template.
7. Select PowerEdge from product drop down menu, then click next.
8. In the template evaluation plan, configure the following:
9. Access Control – select: IP blocking is enabled/SSH is disabled/The SNMP configured for V3/Active directory authentication is enable / VNC disabled
10. Audit and Accountability – select: NTP time synchronization enabled / Remote Syslog enabled
11. Configuration Management – select: configure iDRAC from Post/System lockdown enabled/USB ports disabled
12. Identification and Authentication – select: Password has minimum strength score of strong
13. System and Coms Protection – select: IPMI over lan disabled / virtual media encryption enabled / dedicated nic
14. System and information – secure boot enabled
15. Select finish.
16. Select the systems tab.
17. Select the required hosts from the list of hosts (in our test we selected a list of 1 or 10 or 100 or 1000).
18. Click assign.
19. Select the required template from the drop down template list menu.
20. From the menu down at the left-hand side of screen, select system risk to view results.
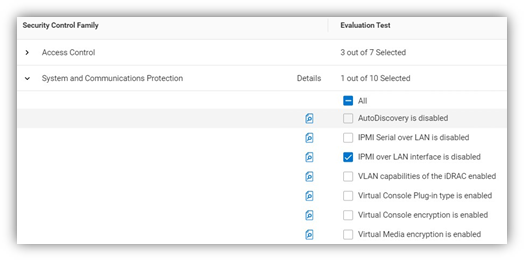
Figure 3. Select rules to build a policy
Steps for the manual approach: checking configuration values in iDRAC GUI
From a browser displaying the iDRAC login screen:
1. Login
2. USB – Configuration/BIOS settings/integrated devices/user accessible USB ports: all ports off
3. Secure boot – Configuration/BIOS settings/TPM advanced /secure boot: enabled
4. VNC – Configuration/Virtual console/VNC server/Enable VNC server: Disabled
5. SNMPv3 – Configuration/System setting/Alert config/SNMP trap/SNMP setting/SNMP Trap format: SNMP v3
6. Syslog – Configuration/System settings/Alert configuration/Remote syslog settings/Remote syslog: Enabled
7. Virtual Media encryption – Configuration/Virtual media/Attached media/Virtual Media encryption: Enabled
8. Dedicated port – iDRAC settings: Active NIC interface: dedicated
9. Local iDRAC Config – iDRAC settings/services/local config/disable iDRAC local configuration: enabled
10. IPMI – iDRAC settings/connectivity/network/IPMI settings/Enable IPMI over lan: disabled
11. Password Policy – iDRAC settings/users/global users settings/Password setting/Policy/Score: Strong1
12. AD authentication – iDRAC settings/Users/Directory services/Microsoft AD: Enabled
13. SSH – iDRAC settings/services/SSH/Enabled: Disabled
14. IP blocking – iDRAC settings/Connectivity/Network/Advanced networking setting/IP blocking/Blocking: Enabled
15. NTP time synchronization – iDRAC settings/settings/Time zone/NTP server/Enable NTP: Enabled
16. Lockdown – check padlock icon on top right of screen is displaying locked mode
These steps were tested using Dell PowerEdge R540 BIOS 2.12.2 and iDRAC9 firmware: 5.10.00
Enforcing the strong password policy manually ensures new password compliance with the password policy, however pre-existing accounts could still have weak passwords waist cloudIQ flags any iDRAC with weak password.
Results
Number of servers | CloudIQ Cybersecurity Policy | Manual Checking |
1 | 2 Min 58 Sec | 5 mins 56 secs |
10 | 2 Min 58 Sec | 59 min |
100 | 2 Min 58 Sec | 9 hours 53 mins |
500 | 2 Min 58 Sec | 49 hours 26 mins |
1000 | 2 Min 58 Sec | 98 hours 53 min |
Summary
Our testing showed that automation using the Dell CloudIQ for PowerEdge cybersecurity policy engine brought major benefits in time efficiency, repeatability, predictability, and of course, peace of mind. The benefits also dramatically increased as we extrapolated the number of servers in the testing data.
References
CloudIQ on Dell.com - for data sheets and demo videos
Take Control of Server Cybersecurity with Intelligent Cloud-Based Monitoring Blog
Building and Tracking Dell CloudIQ Cyber Security Policies for PowerEdge Servers Video
Technical Knowledge Page For OpenManage Enterprise CloudIQ Plugin
Additional Cybersecurity Related Solutions from Dell