

Assets

New Dell SRM 5.0 Hands on Lab
Wed, 10 Apr 2024 18:02:14 -0000
|Read Time: 0 minutes
We are announcing the release of the new SRM hands on lab:
- SRM 5.0 - Automated and Analytics driven Operational Monitoring and Reporting of DataCenter Infrastructure with Dell SRM
Summary
The new SRM hands-on lab is created based on the latest SRM release 5.0 which introduces several new features, enhancements, and new platform supports.
The Lab is located under: https://democenter.dell.com.
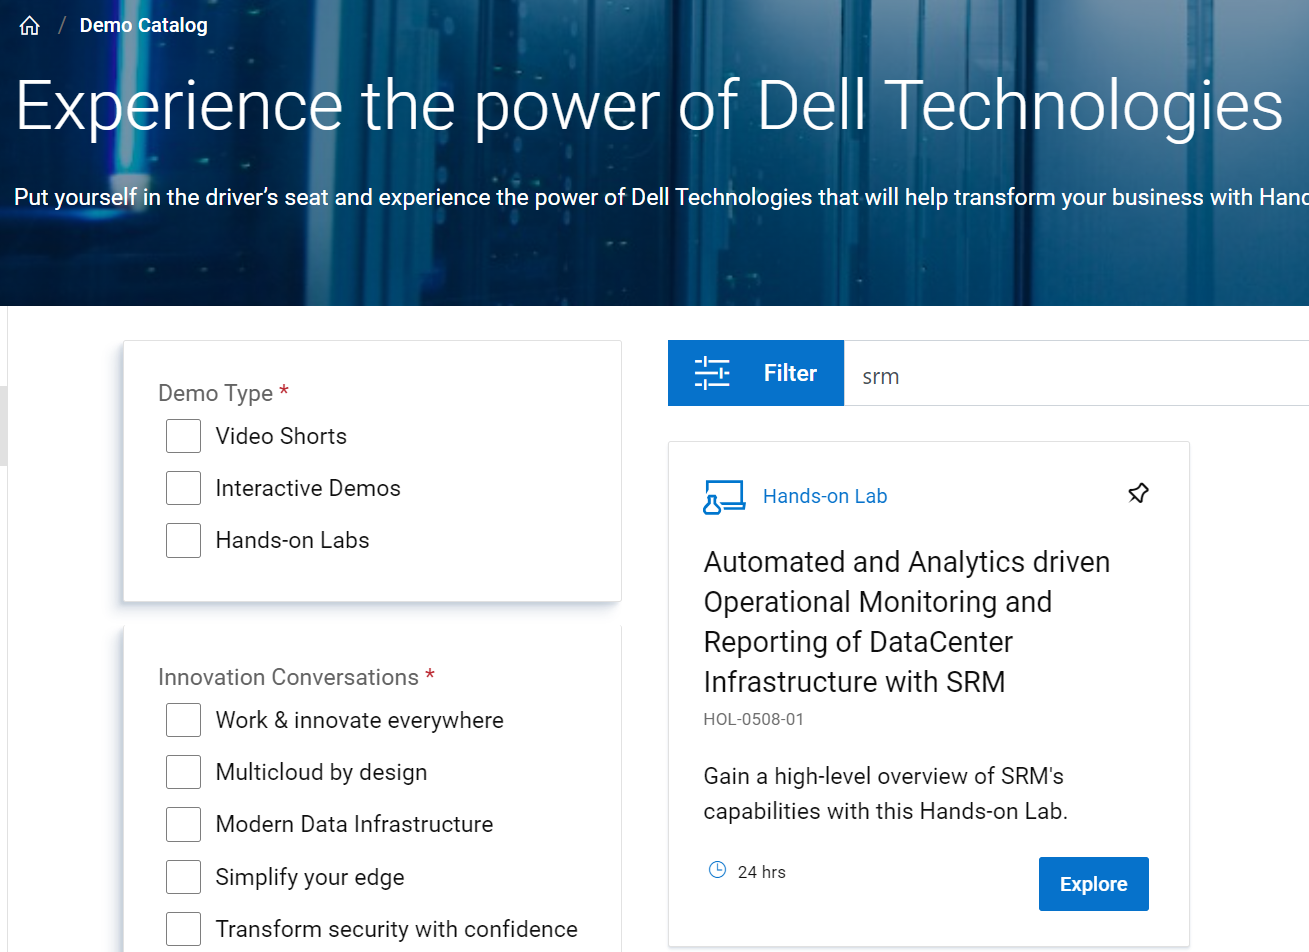
Login, then search for the “srm” or “HOL-0508-01” and the following lab will appear:
Lab Info
Here is what the lab summary looks like before it is deployed:

The focus of the lab is on the new features, enhancements, and newly supported platforms which are covered in Module 1: The Latest Features in SRM 5.0:
- Solution Pack for Kubernetes
- CloudIQ link & launch
- Solution Pack for PowerEdge (iDRAC)
- Power consumption reports: Brocade, PowerScale, PowerVault, PowerEdge, Unity, and Huawei
- Automated anomaly detection for performance KPIs
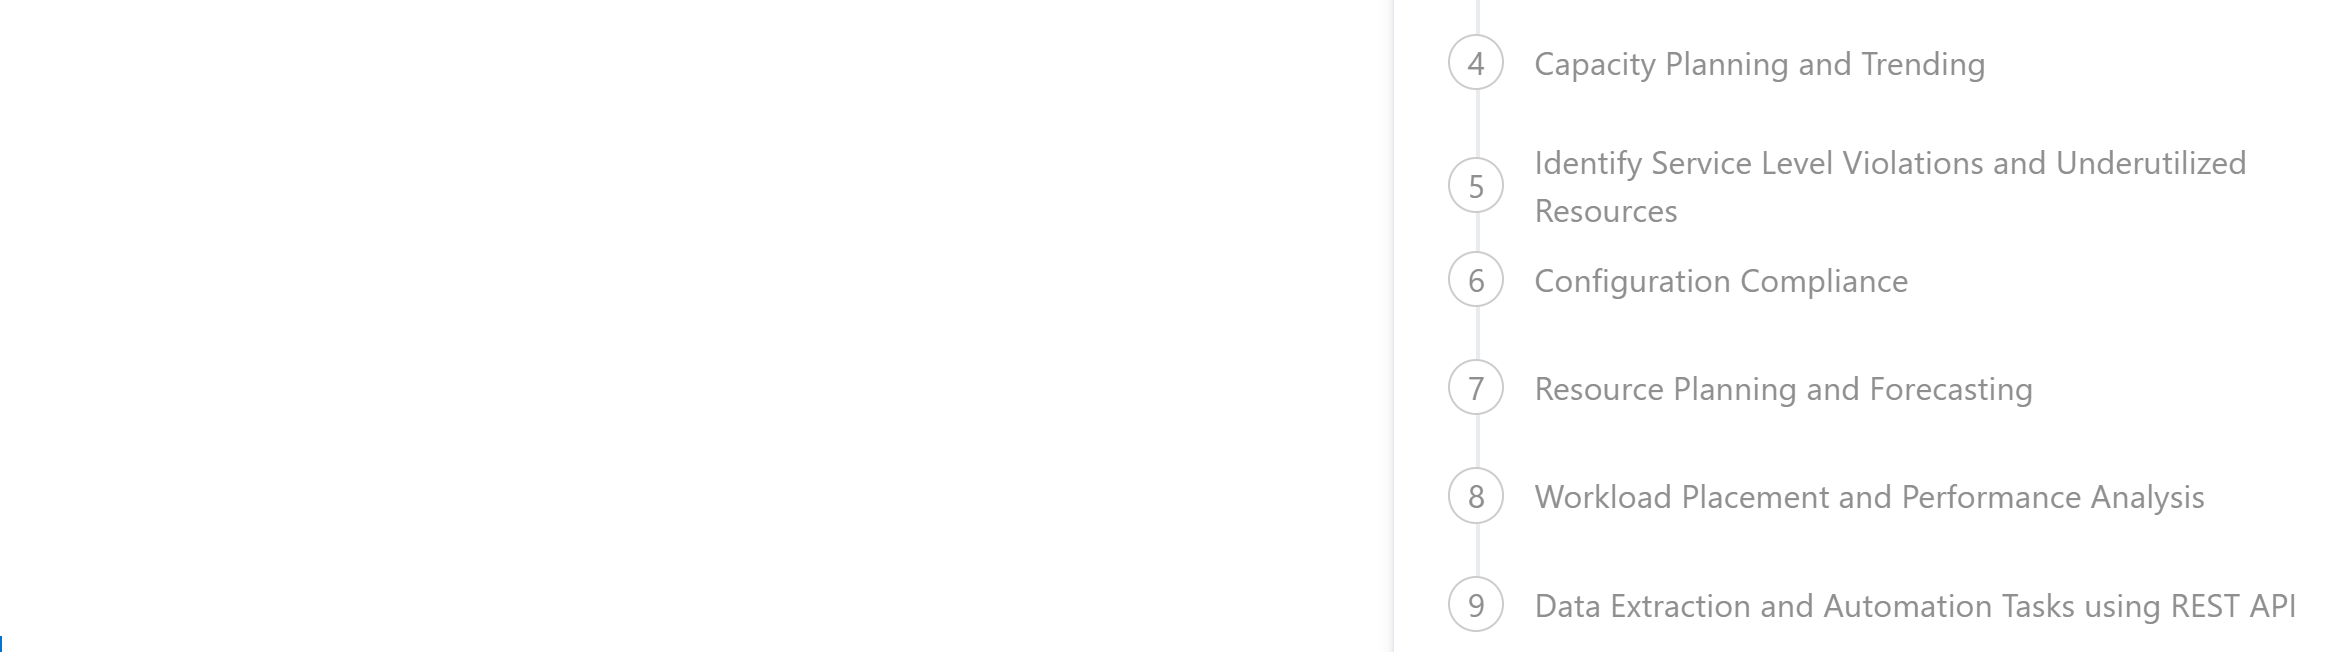
The rest of the modules are covering in-depth SRM use-cases, such as:
- Configuration compliance
- Workload analysis
- Capacity planning
- Performance troubleshooting
- Chargeback reporting
and some of the main SRM features:
- Topology and end-to-end relationships
- Data extraction and automation tasks via REST API
Sample Reports
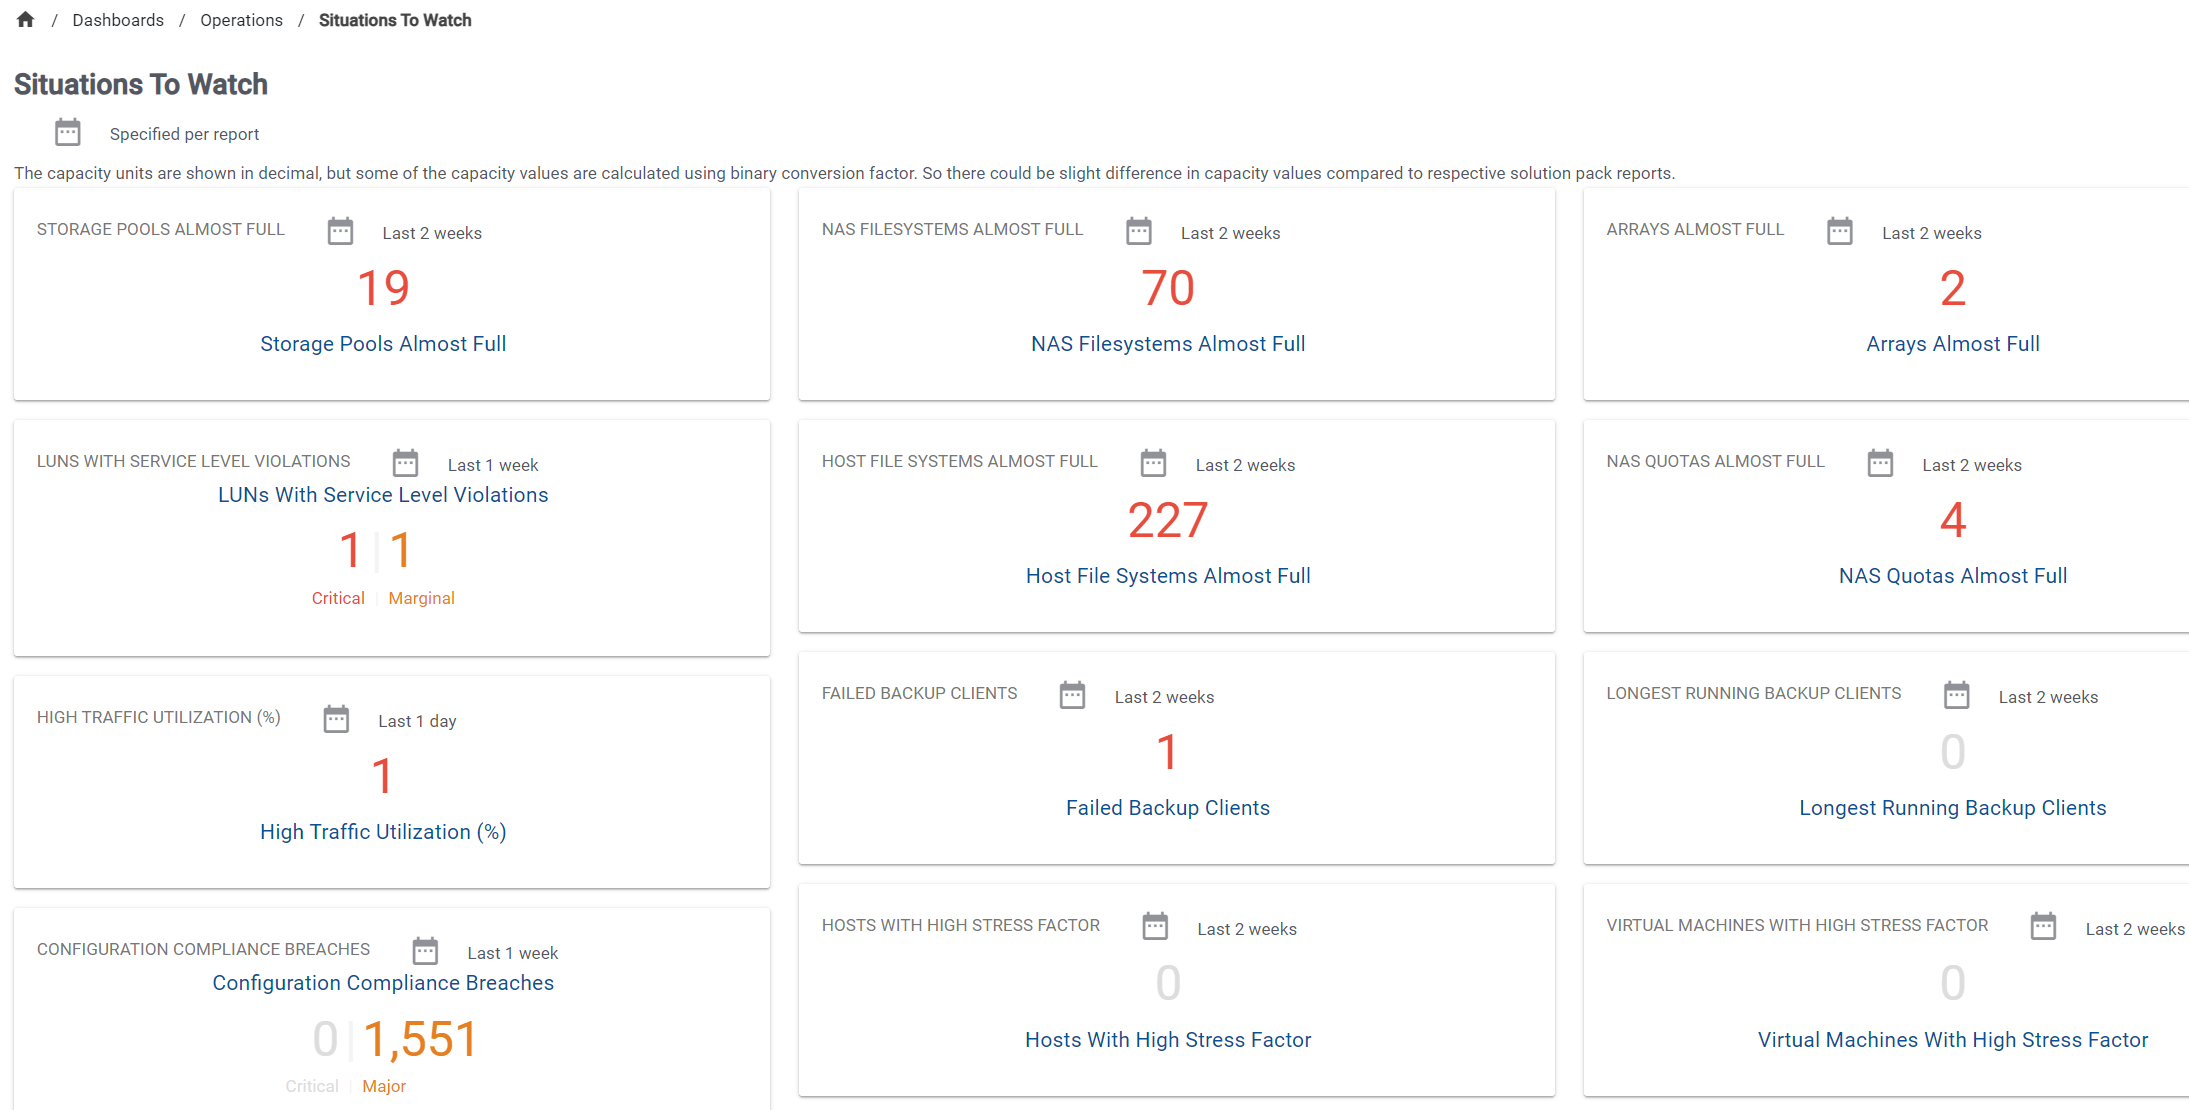
Checkout some of the SRM dashboards and custom reports:
- Situations To Watch dashboard
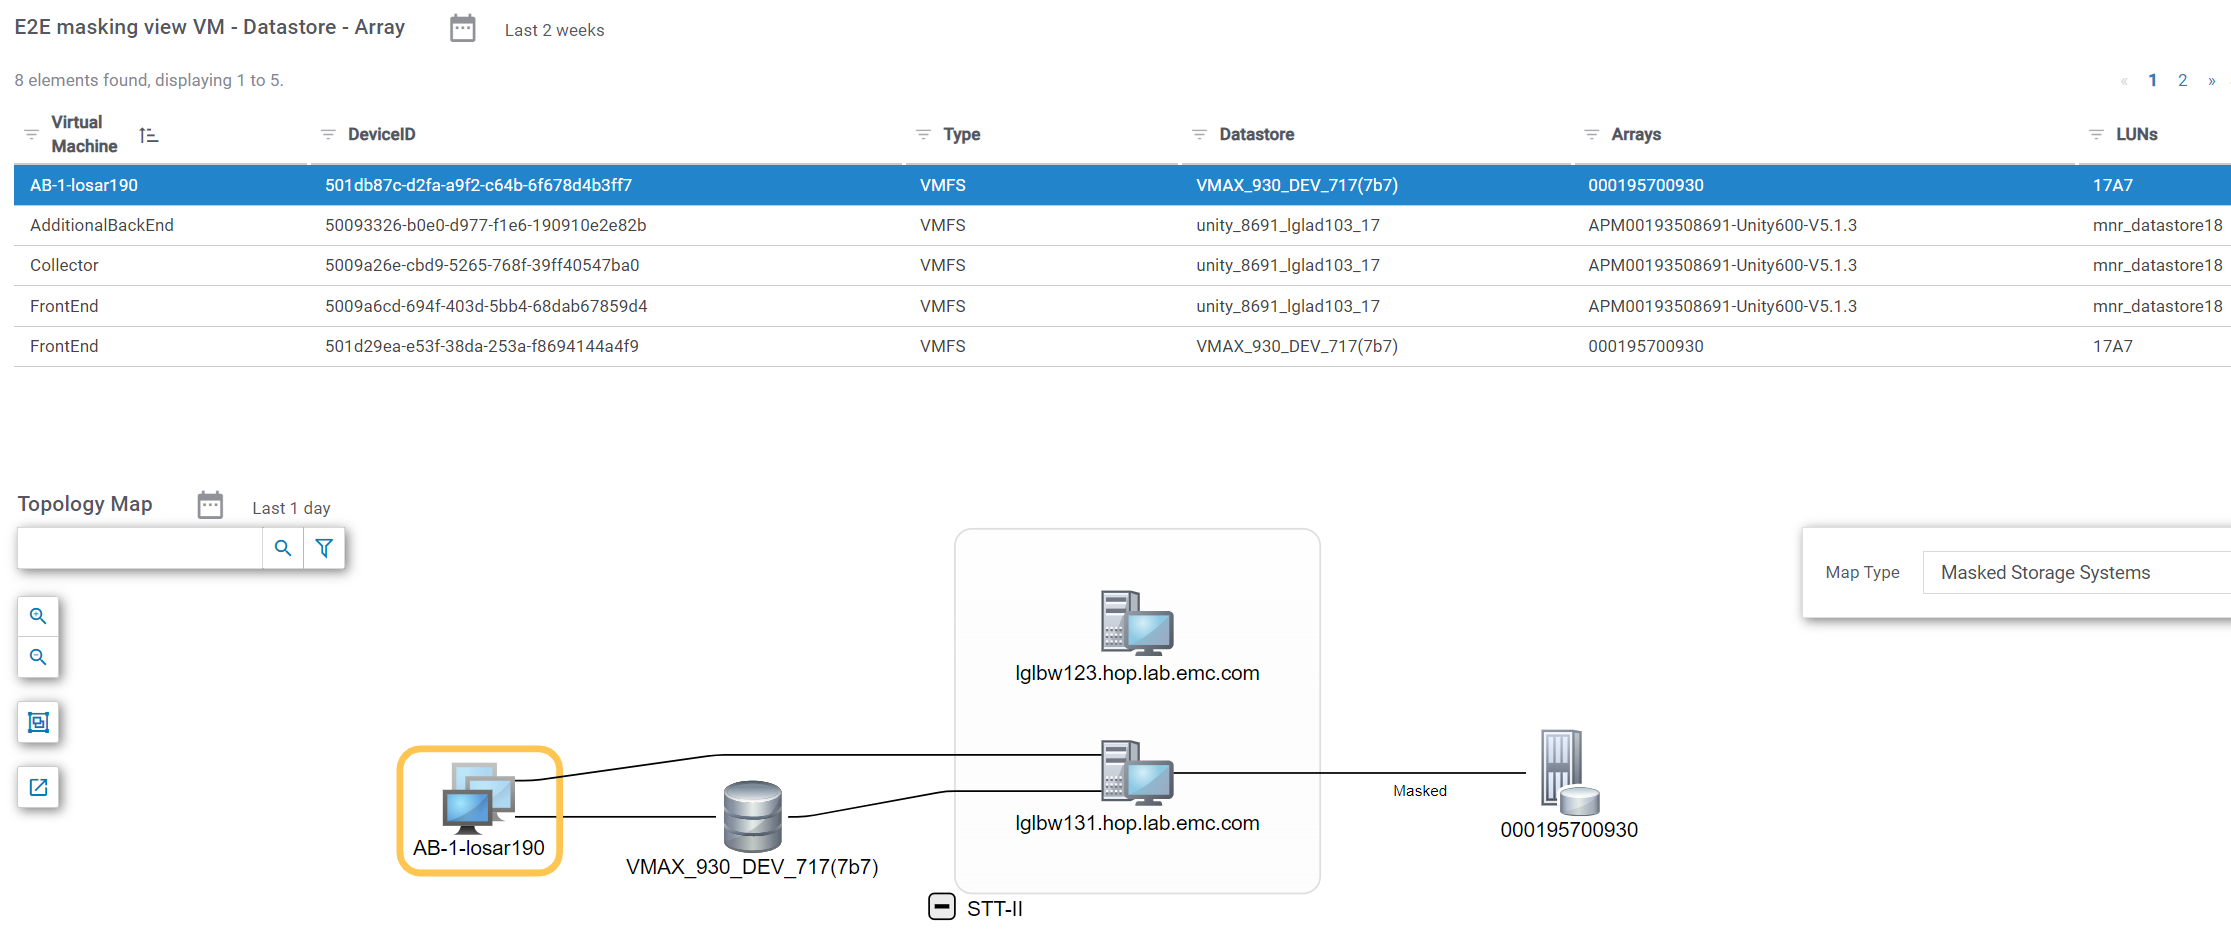
- End-to-end masking view VM -- Datastore -- Array -- LUN report
Supported Platforms
There is a great variety of SRM reports containing data from supported vendors and technologies:
|
|
Author: Dejan Stojanovic

SolutionPack for iDRAC PowerEdge
Wed, 01 Mar 2023 17:16:08 -0000
|Read Time: 0 minutes
Summary
Dell Storage Resource Manager (SRM) provides comprehensive monitoring, reporting, and analysis for heterogeneous block, file, object, and virtualized storage environments. It enables you to visualize applications to storage dependencies, monitor, and analyze configurations and capacity growth. It has visibility into the environment’s physical and virtual relationships to ensure consistent service levels.
To enable storage administrators to monitor their physical and virtual compute environment, Dell provides SRM solution packs. These solution packs include SolutionPack for Physical Hosts, Microsoft Hyper-V, IBM LPAR, Brocade FC Switch and Cisco MDS/Nexus with passive host discovery options, VMware vSphere & vSAN, and Dell VxRail.
With the new SolutionPack for iDRAC PowerEdge, we can monitor the status of server hardware components such as power supplies, temperature probes, cooling fans, and battery. We can also gather historical information about electrical energy usage and other key performance indicators that measure the proper functioning of a server device.
SRM cross-domain functionality
To illustrate SRM’s cross-domain functionality, we examine the most common use case, where Dell PowerEdge physical servers are deployed as part of VMware hypervisor clusters.
SolutionPack for VMware vSphere & vSAN provides capacity, performance, and relationship data for all VMware discovered components, such as VMs, hypervisors, clusters, and datastores, as well as their relationship with fabric and backend storage arrays. Here is one example of the end-to-end topology of the virtualized environment: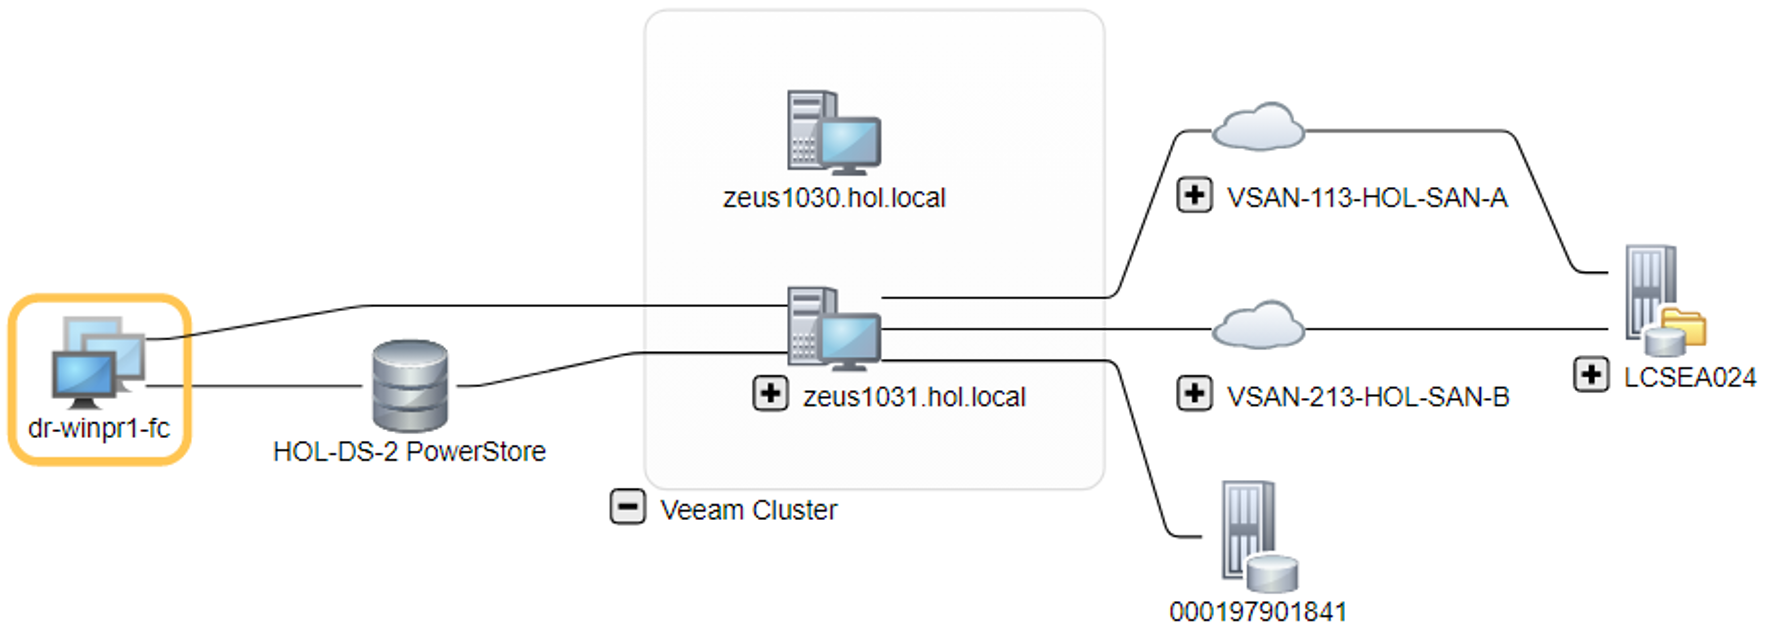
Figure 1. Example of end-to-end topology of a virtualized environment
To gain physical access to the PowerEdge servers and their hardware components, we rely on integrated Dell Remote Access Controller (iDRAC), which is a baseboard management controller that is integrated in PowerEdge servers.
iDRAC exposes hardware components’ data through several APIs, one of them being SNMP. With SRM SNMP collector, which is part of the SolutionPack for iDRAC PowerEdge, we discover iDRACs from which we pull PowerEdge server data. This data includes electrical energy usage (Wh), probes temperature (C), power supply output (W), and cooling devices speed (RPM). It also includes status of power supplies, battery, cooling devices, temperature probes, and server availability. SRM provides historical reports for all the metrics, with a maximum 7-year data retention for weekly aggregates.
With the data available from the iDRAC PowerEdge, VMware vSphere & vSAN, and relevant fabric and storage array solution packs, users can seamlessly navigate from the context of physical server hardware component reports to the context of the physical server reports within the broader SAN environment.
SolutionPack for iDRAC PowerEdge data collection and alerts
Let’s examine the component status data, performance data, and alerts provided by the SolutionPack for iDRAC PowerEdge.
Status and performance data
Initial Card View and Table View
The Summary page Card View and Table View for PowerEdge servers show hardware components status (temperature probes, cooling devices, battery, power supply), server availability, daily electrical energy usage (kWh), energy cost ($), and daily carbon emission (kgCO2e). Energy cost and carbon footprint metrics are calculated based on server location. In the following example, we see significant difference in daily carbon emission between Poland and Germany, even though there is small difference in daily energy usage. The same applies to energy cost prices.

Figure 2. Card view of hardware component status
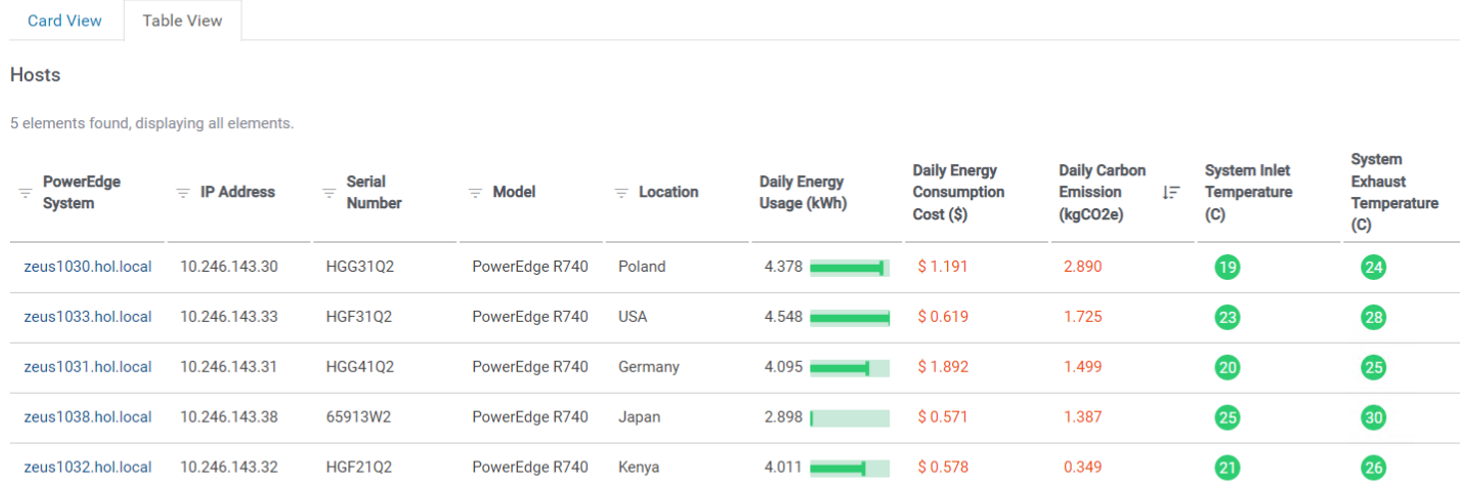
Figure 3. Table view of hardware component status (first 10 columns)
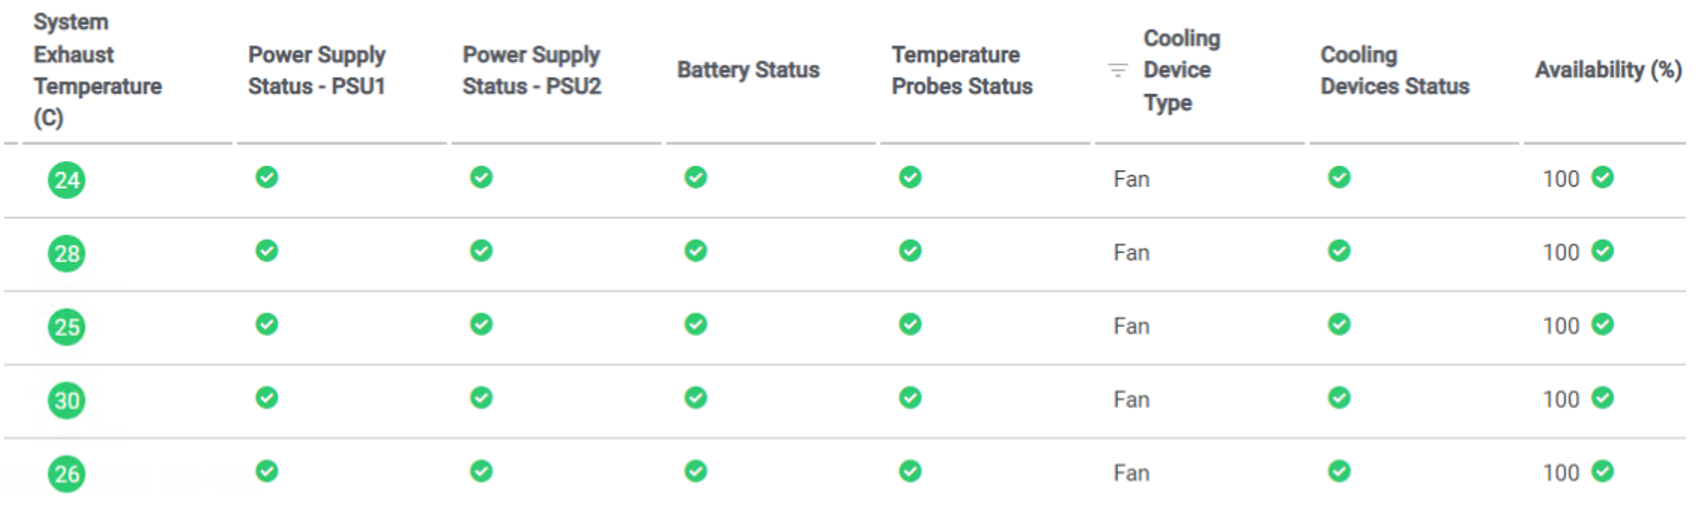
Figure 4. Table view of hardware component status (final columns—continuation of preceding figure)
Energy cost and carbon emissions per country are calculated dynamically based on data enrichment enabled on SRM collectors. Metrics collected from each iDRAC are automatically tagged with location, carbon intensity, and energy cost properties. Here is an example of data enrichment configuration from the SRM admin UI:
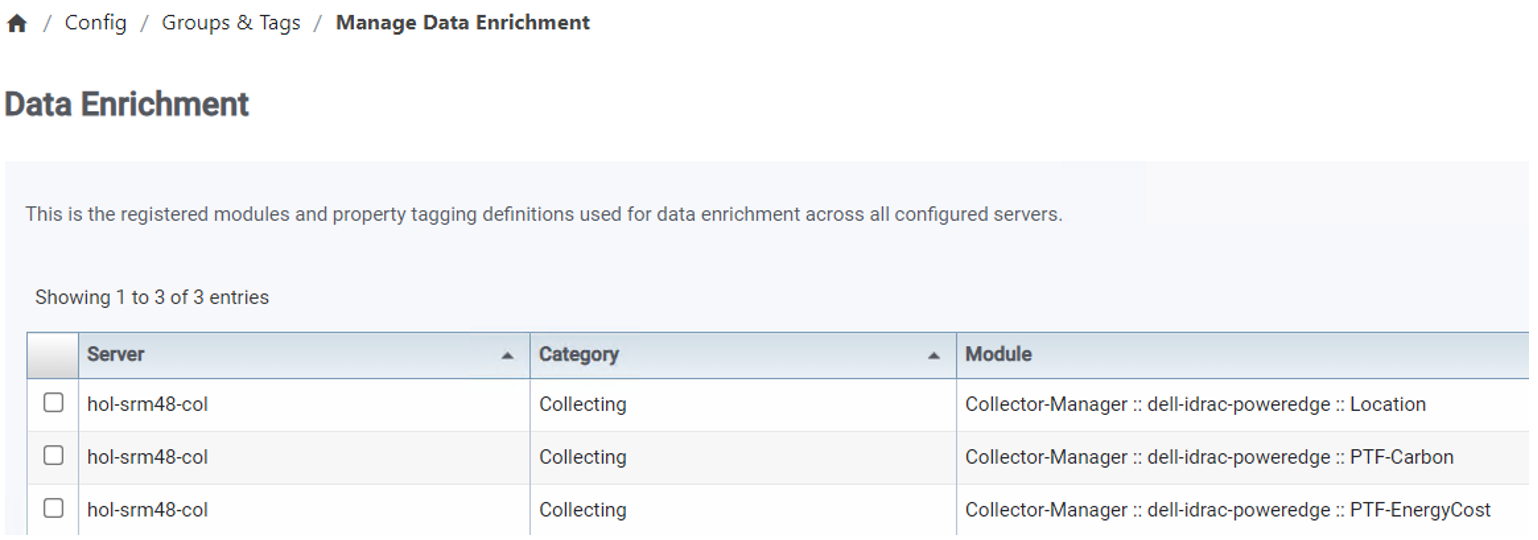
Figure 5. SRM admin UI showing data enrichment configuration
CSV files that contain values for energy cost and carbon intensity per country are available publicly and can be transferred automatically through FTP to SRM collectors as part of the data enrichment process. Here is a CSV file excerpt that contains kWh cost ($) per country: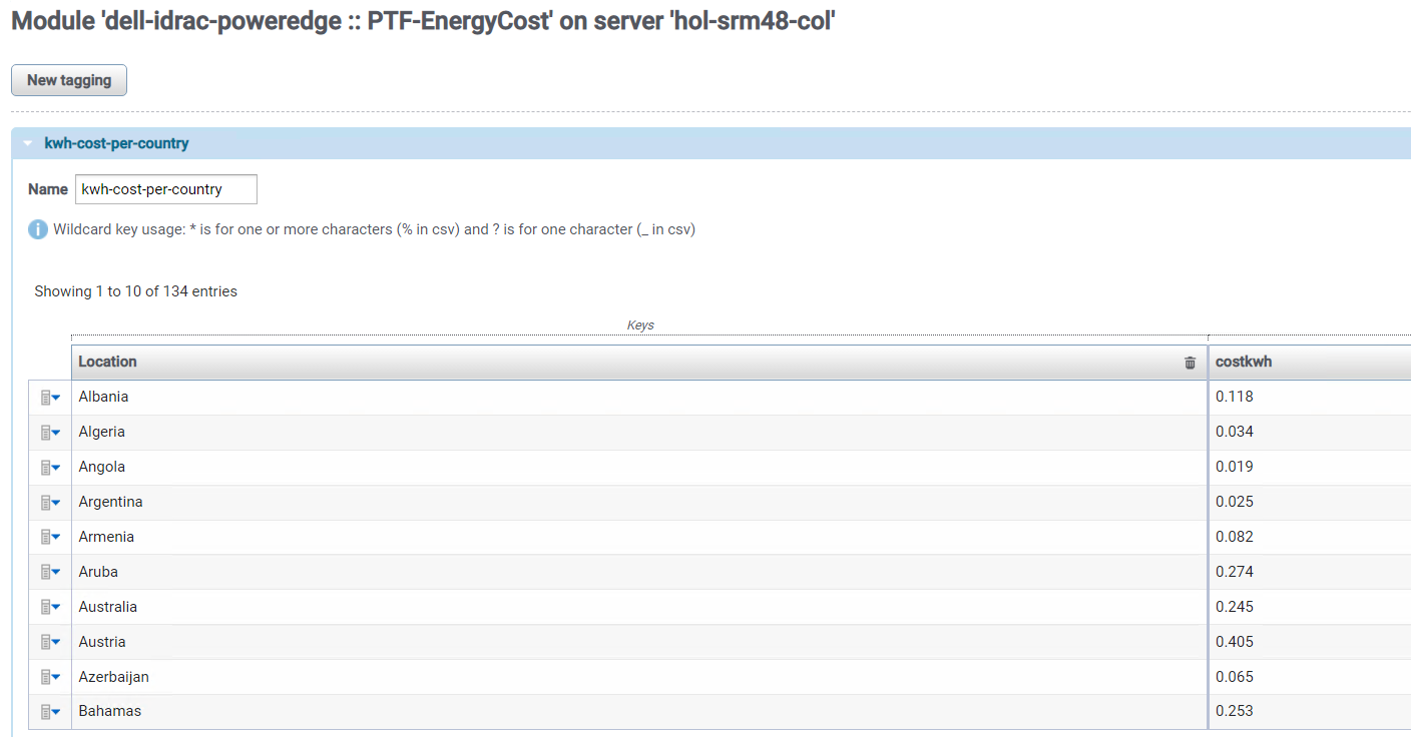
Figure 6. Excerpt of kwh-cost-per-country CSV file
And here is a CSV file excerpt that contains carbon intensity per kWh per country: 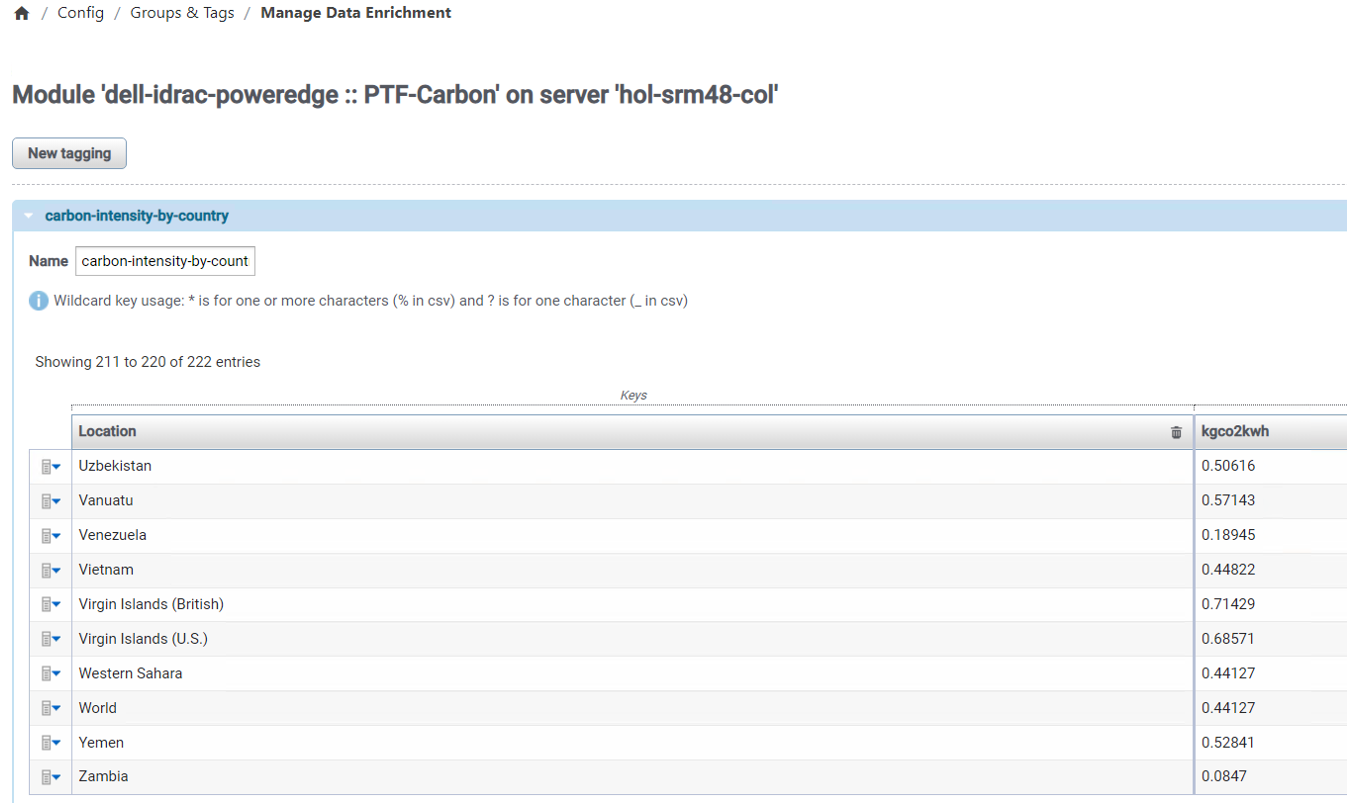 Figure 7. Excerpt of carbon-intensity-by-country CSV file
The CSV file for data enrichment with device,location mapping is specific to every customer.
End-to-end topology map
From the initial Card View or Table View, you can drill down to the PowerEdge server end-to-end topology map. This is a host-based landing page where you can see the server’s relationship with the rest of the SAN components, as well as server attributes, performance, capacity, alerts, and inventory data. This is an example of SRM’s powerful capability to aggregate and visualize data from multiple contexts within the same reporting UI.
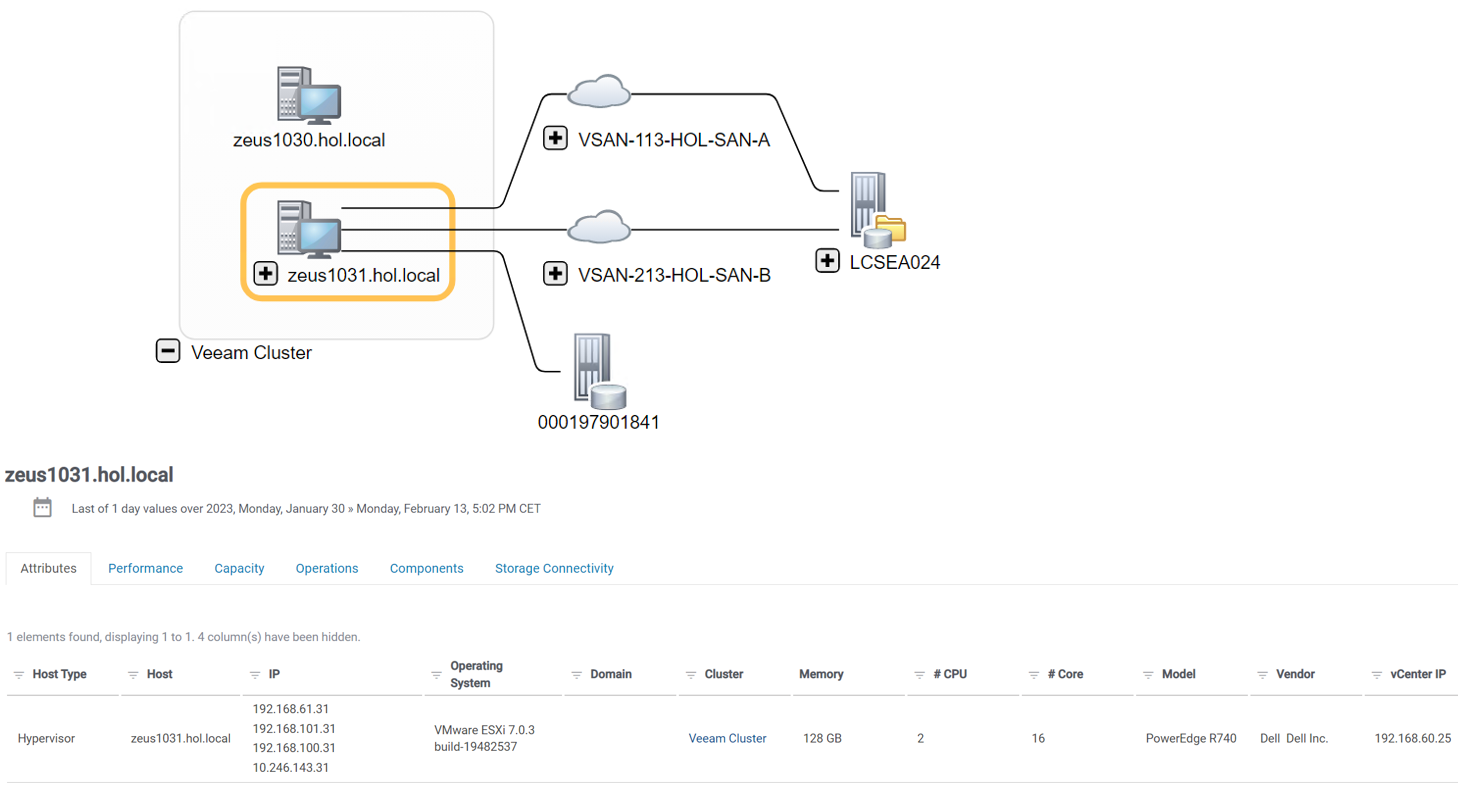
Figure 8. End-to-end topology map
iDRAC PowerEdge Inventory report
The iDRAC PowerEdge Inventory report shows servers’ hardware component names, quantities, server hostname, serial number, operating system version, model, and IP address: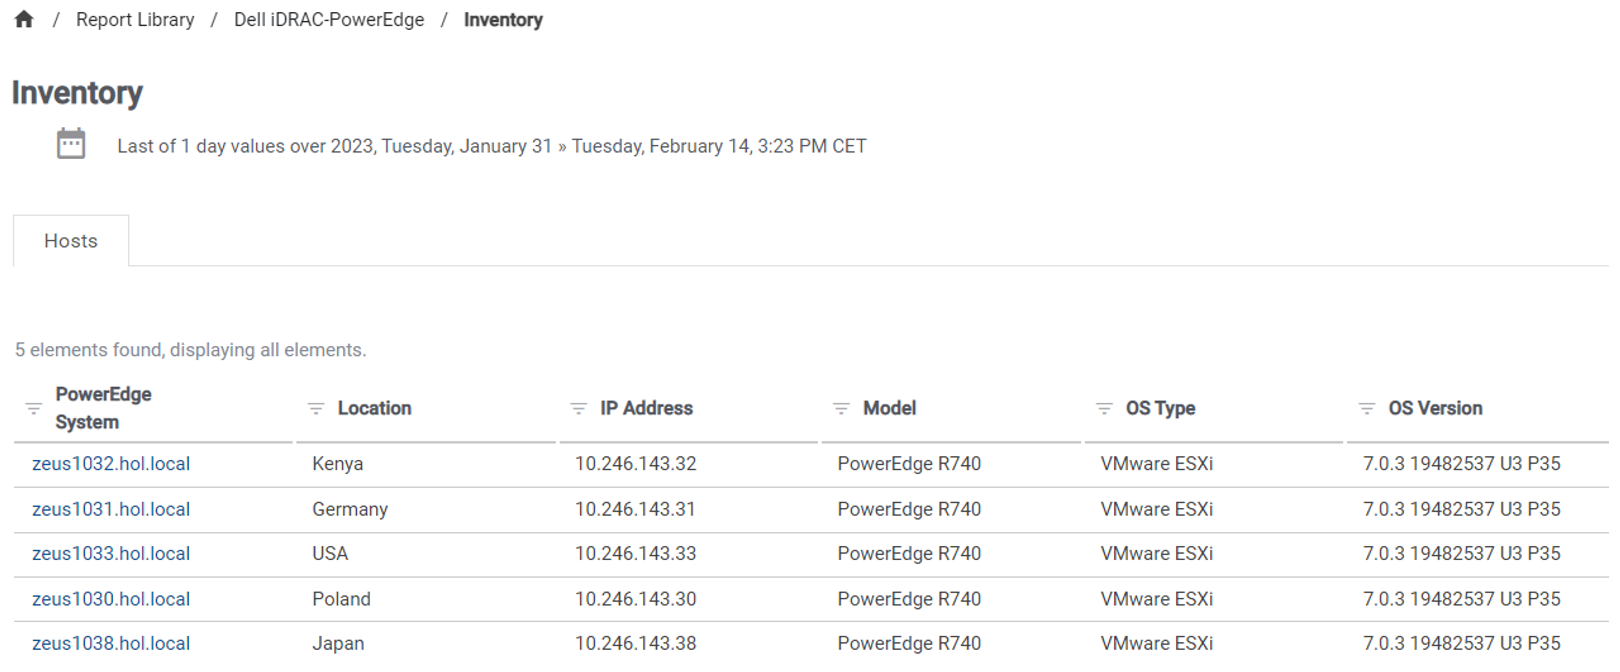
Figure 9. Inventory report (first six columns)
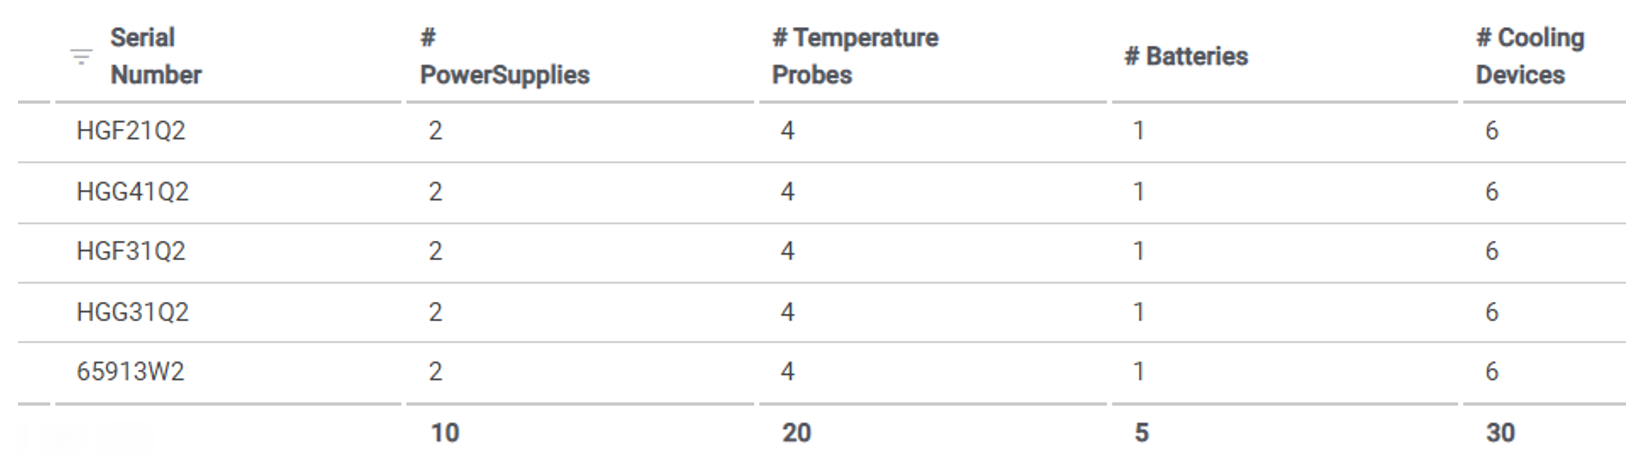 Figure 10. Inventory report (final columns—continuation of preceding figure)
Drilling down from the preceding table leads to the daily status dashboard of a selected server’s hardware components. Here are a few examples:
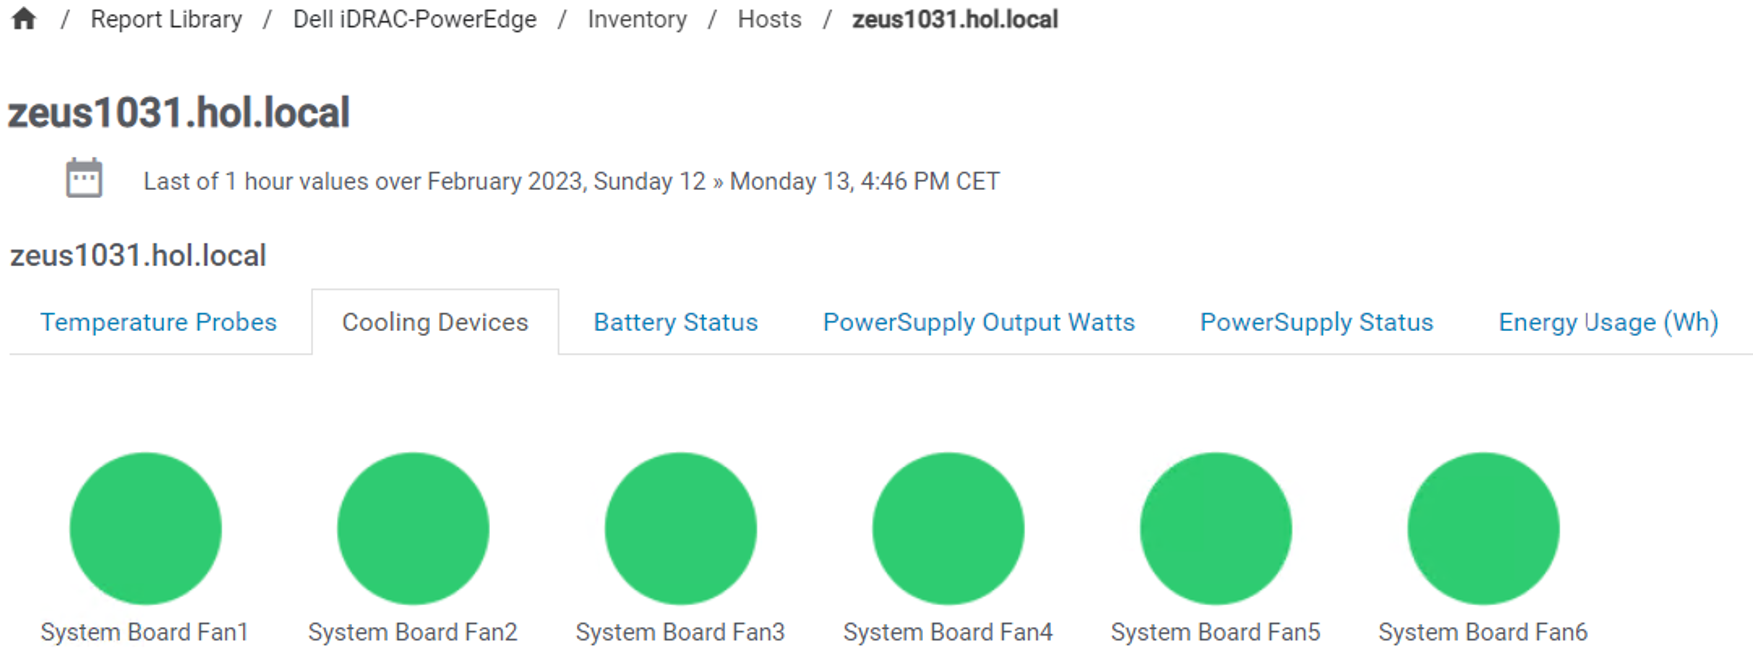
Figure 11. Status of cooling devices
Figure 12. Power supply output watts
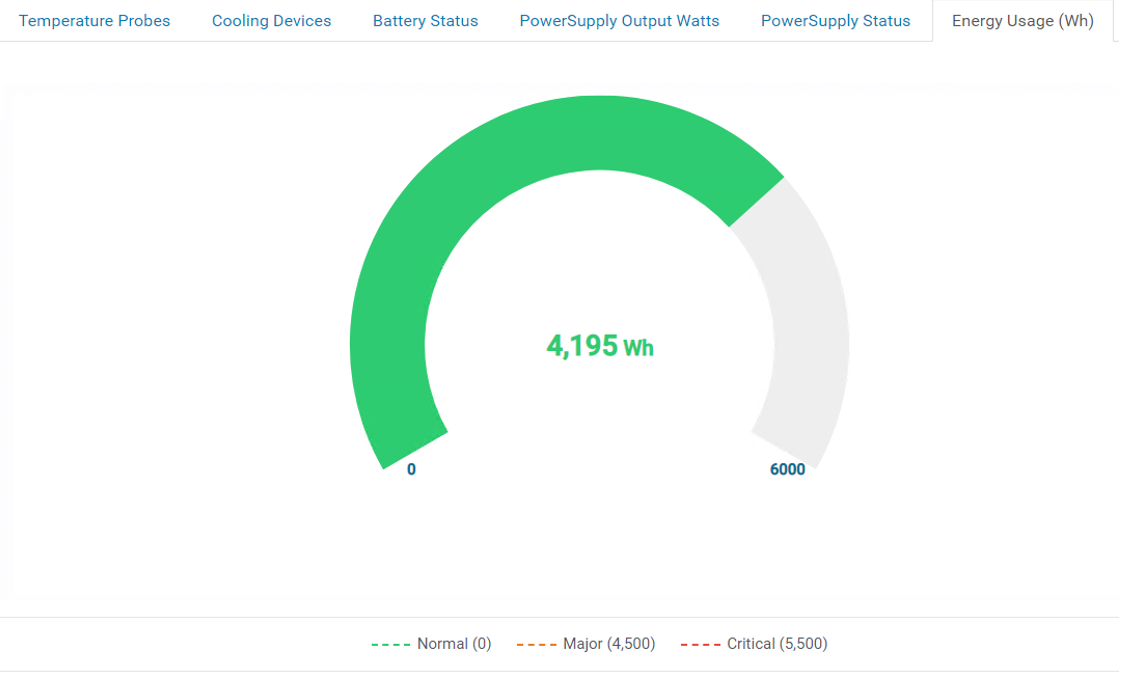 Figure 13. Energy usage (Wh)
iDRAC PowerEdge Performance report
The iDRAC PowerEdge Performance report shows key metric values for servers’ hardware components, such as probes temperature (C), temperature lower and upper thresholds, cooling device (RPM), and cooling device critical and non-critical thresholds. Each selected row plots interactively historical performance data on the charts below the table, including server electrical energy usage (Wh), probes temperature (C), and cooling devices (RPM).
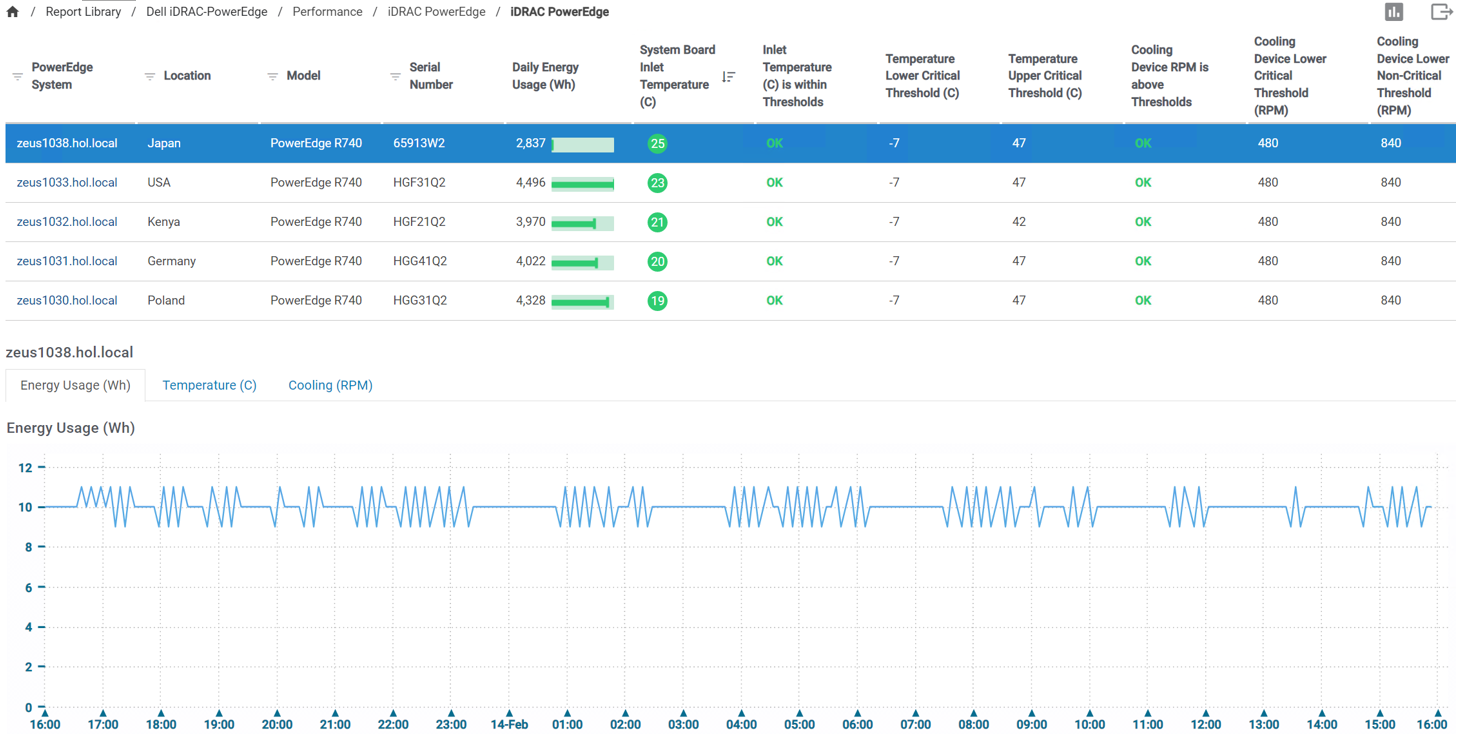
Figure 14. Trend chart—Electrical energy usage (Wh)
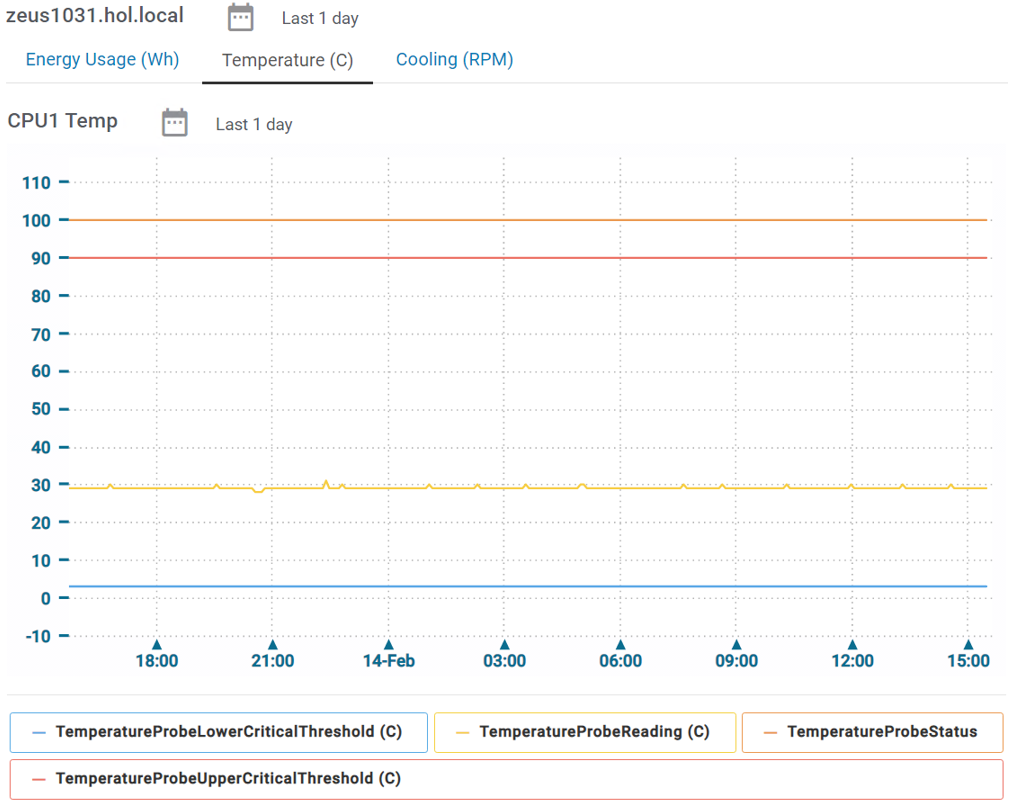
Figure 15. Trend chart—Probes temperature (C) values plotted alongside threshold values
The following trend chart shows cooling device (RPM) values plotted on the same chart with the active alerts relevant to the cooling device. The alert is displayed as a black dot with pop-up details of the issue that caused the alert. This feature greatly improves troubleshooting and is another example of SRM’s powerful capability to aggregate and visualize data from multiple contexts within the same reporting UI.
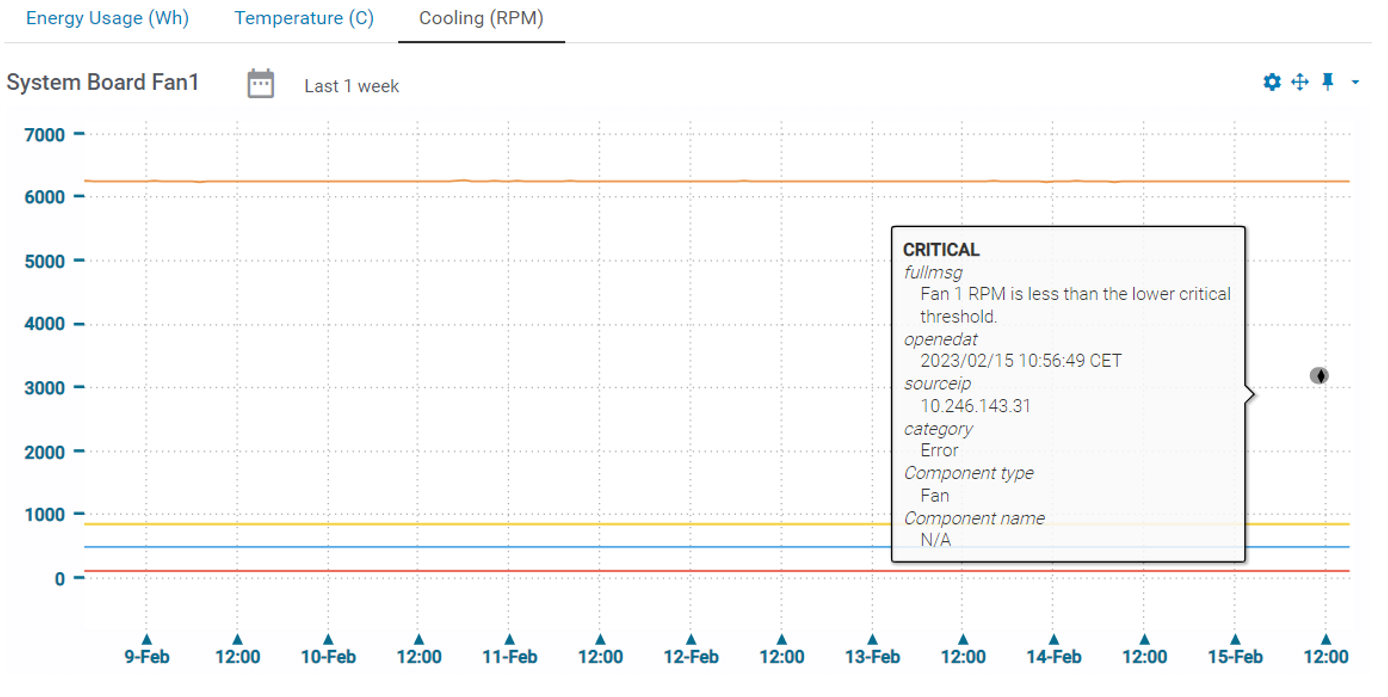 Figure 16. Trend chart—Cooling device (RPM) values plotted on the same chart with the active alerts relevant to the cooling device
The following bar charts show Carbon Emission, Energy Cost ($), Cooling (RPM), Energy Usage (kWh), and Temperature (C) per location during the last month. You can drill down on each bar chart to see reports for each location to analyze the top 10 contributing items per device type (hypervisor, host) and per server.
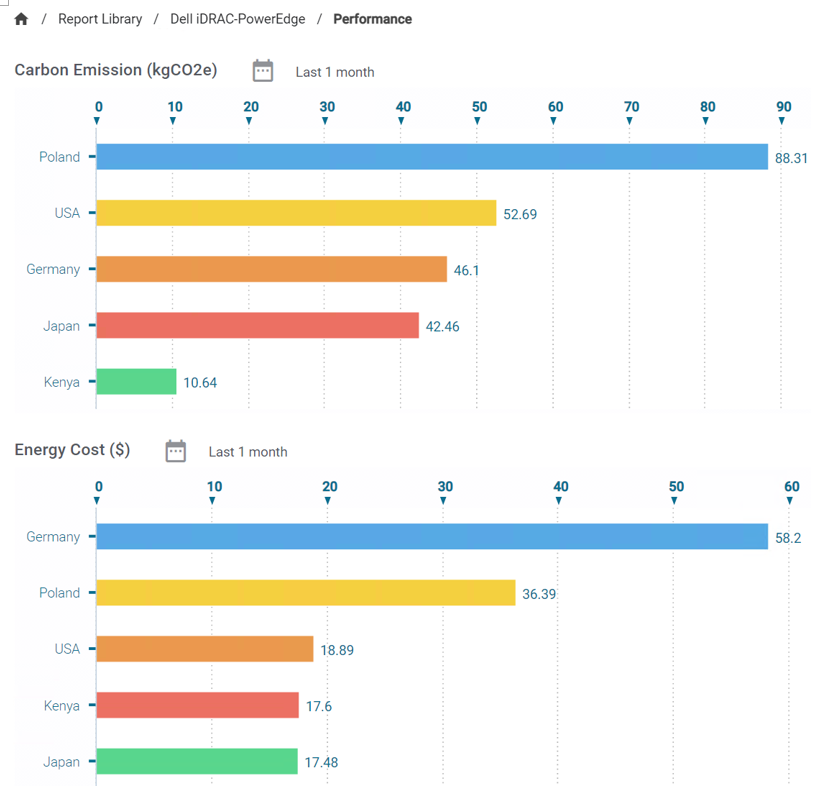
Figure 17. Carbon Emission and Energy Cost bar charts
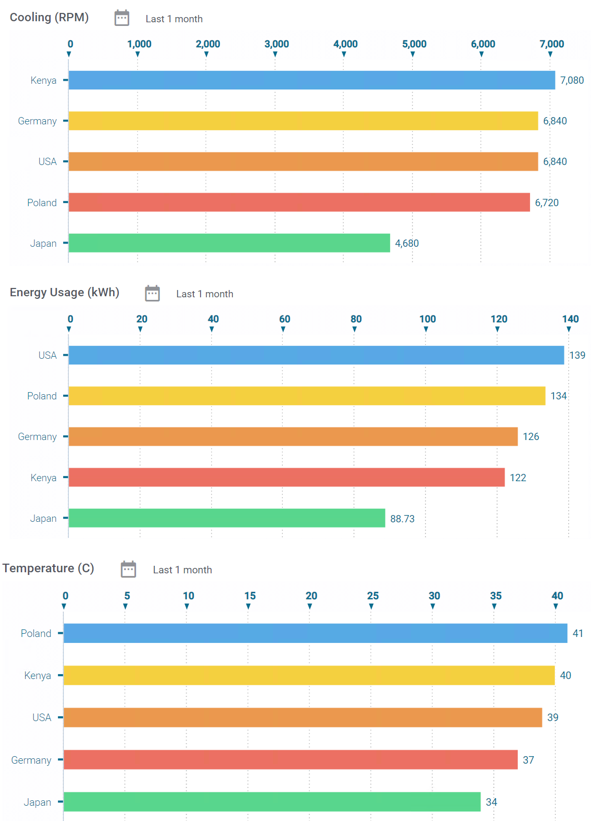
Figure 18. Energy Usage and Temperature bar charts
Alerts
The iDRAC PowerEdge Operations report shows currently active alerts received from iDRAC as SNMP traps. The solution ack contains 80 certified alert definitions that cover iDRAC System Health and Storage category alerts, including AmperageProbe, Battery, Cable, CMC, Fan, FC, LinkStatus, MemoryDevice, Network, OS, PhysicalDisk, PowerSupply, PowerUsage, TemperatureProbe, TemperatureStatistics, VoltageProbe, LiquidCoolingLeak, and others.
You can enable any or all alerts on each iDRAC under Configuration > System Settings > Alert Configuration > Alerts. You can configure SNMP trap receivers under Configuration > System Settings > Alert Configuration > SNMP Traps. In this case, the SNMP trap receiver is the SRM collector server.
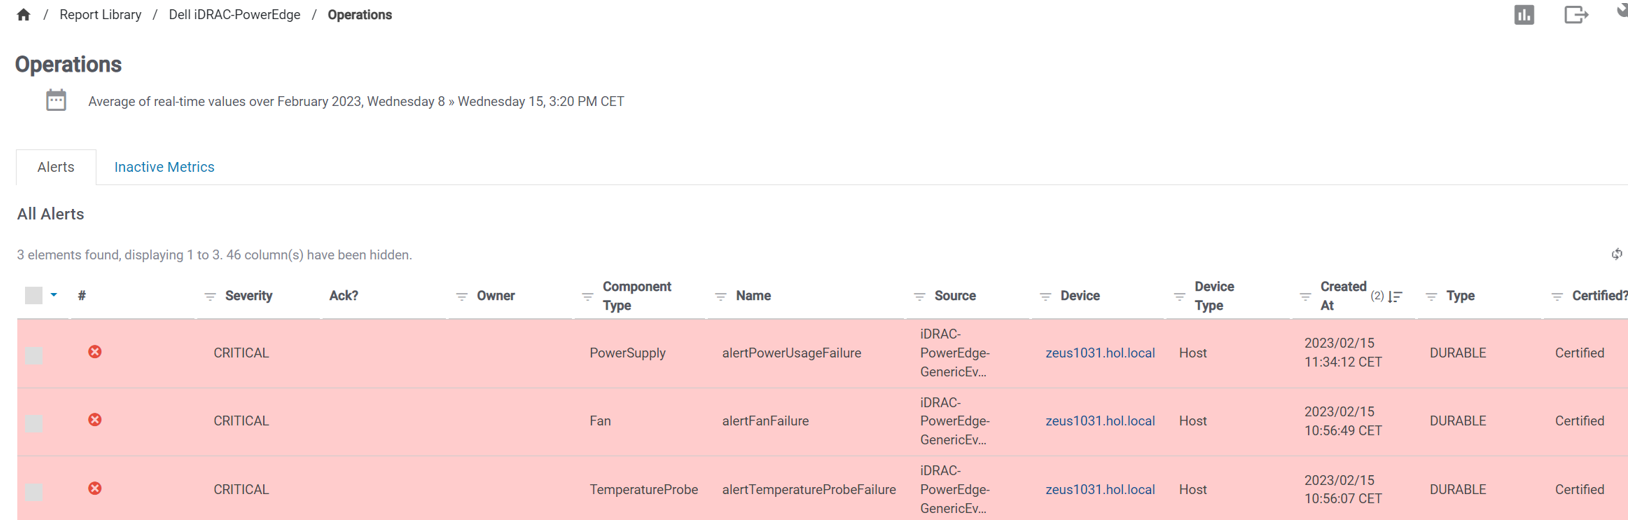
Figure 19. Active alerts on iDRAC PowerEdge Operations report
By right-clicking an alert row, you can acknowledge, assign, close, take ownership of, or assign a ticket ID to the alert.
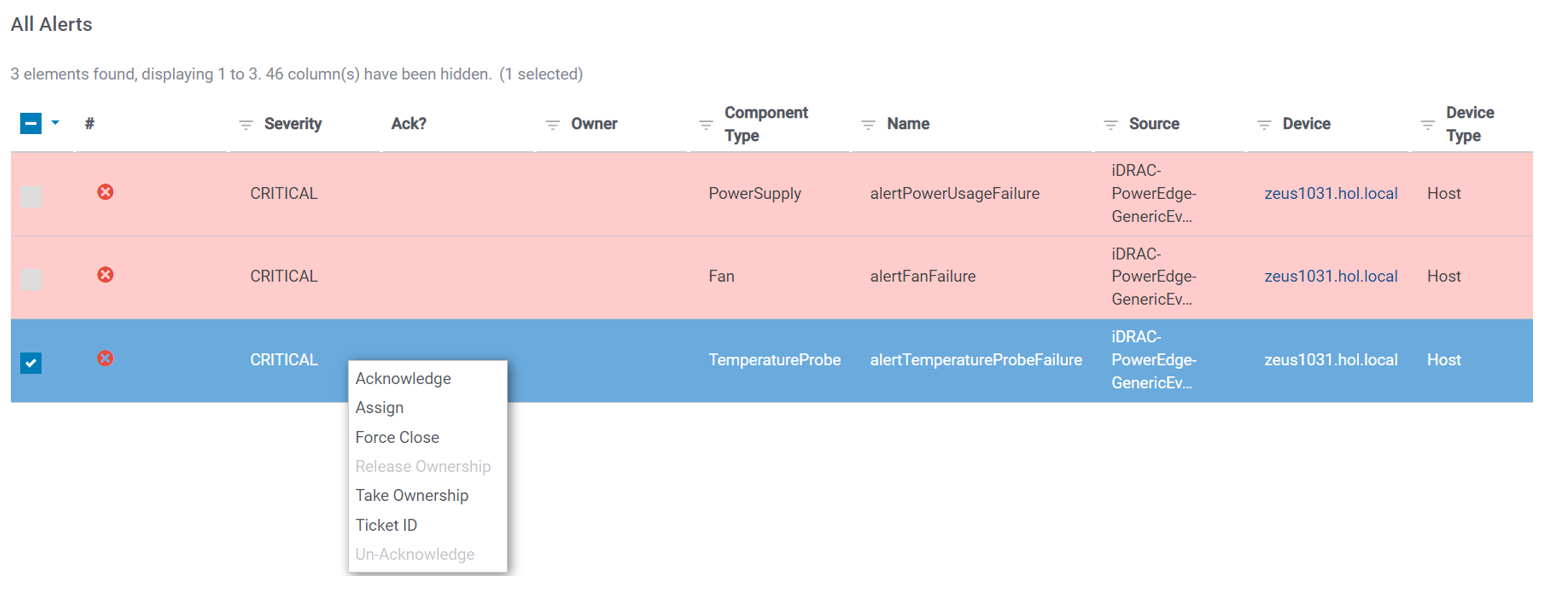
Figure 20. Acting on an alert
By clicking on an alert row, you can see a detailed report about the alert. Also, the SRM alerting module includes functionality to forward selected alerts to external applications, such as ServiceNow ITSM through a Webhook API or fault management applications through an SNMP trap or email.
You can navigate directly from the alerts report to the affected server’s landing page by clicking the device name link in the Device column of the All Alerts report. SRM relates alert-specific data with the time-series data originated from the same device and seamlessly navigates through corresponding reports. The following figure shows an affected server’s summary report with the topology and underlying Operations section showing the server’s active alerts.
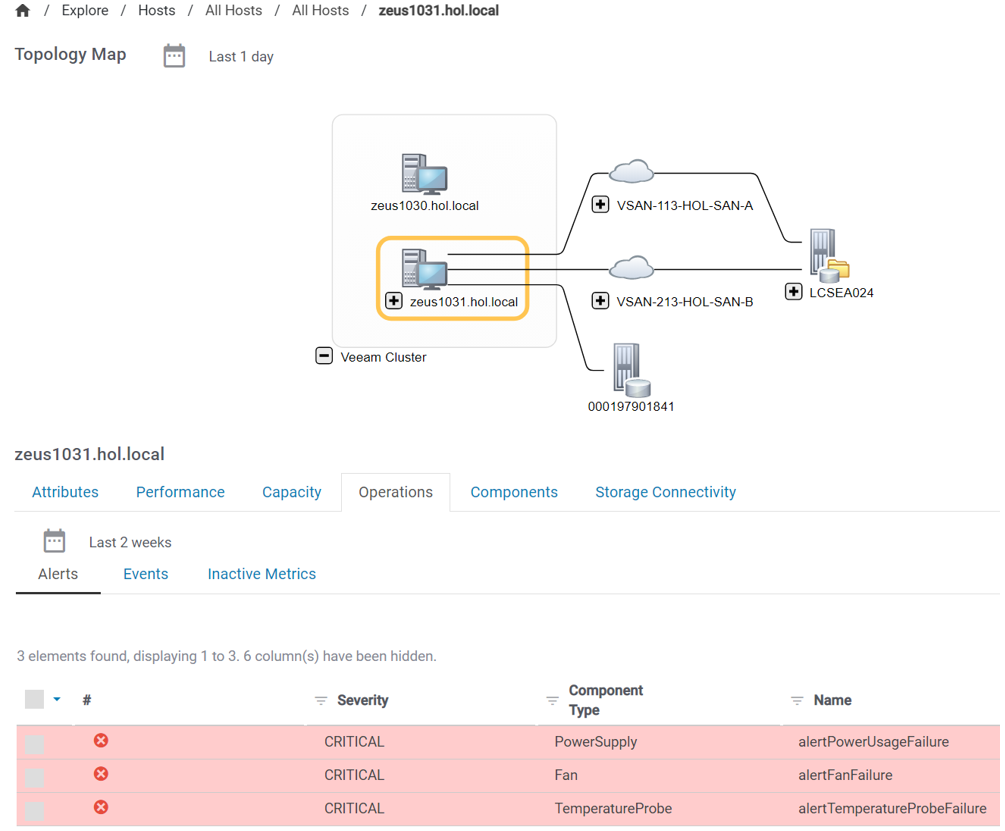
Figure 21. Server summary report with topology and active alerts
Conclusion
SRM’s powerful framework allows storage administrators to easily integrate environmental data for PowerEdge physical servers into the existing end-to-end SAN inventory, performance, capacity, and alert reports. SRM reduces the time that is required to identify the cause of issues occurring in the data center.
With the new SolutionPack for iDRAC PowerEdge, administrators can monitor PowerEdge hardware components and obtain historical information about energy usage and other key performance indicators.
Supported platforms
The iDRAC PowerEdge Solution Pack supports:
- Dell iDRAC MIB v4.3
- Dell PowerEdge models listed at https://www.dell.com/support/home/en-us/drivers/driversdetails?driverid=96cdj#SupportedOs
Author: Dejan Stojanovic

Explore Real-World Cases with the Dell SRM Interactive Demo
Thu, 17 Nov 2022 15:04:10 -0000
|Read Time: 0 minutes
Summary
At Dell Technologies, we are proud to announce a new interactive demo for Storage Resource Manager (SRM), located here:
This interactive demo is based on the SRM release 4.7.0.0, which introduces several new features, enhancements, and platform supports.
Interactive Demo Info
The landing page of the interactive demo provides a summary of the use cases and features covered. This demo has the same look and feel as the actual HTML-based SRM user interface, where you can scroll up and down the page and click on each page object.
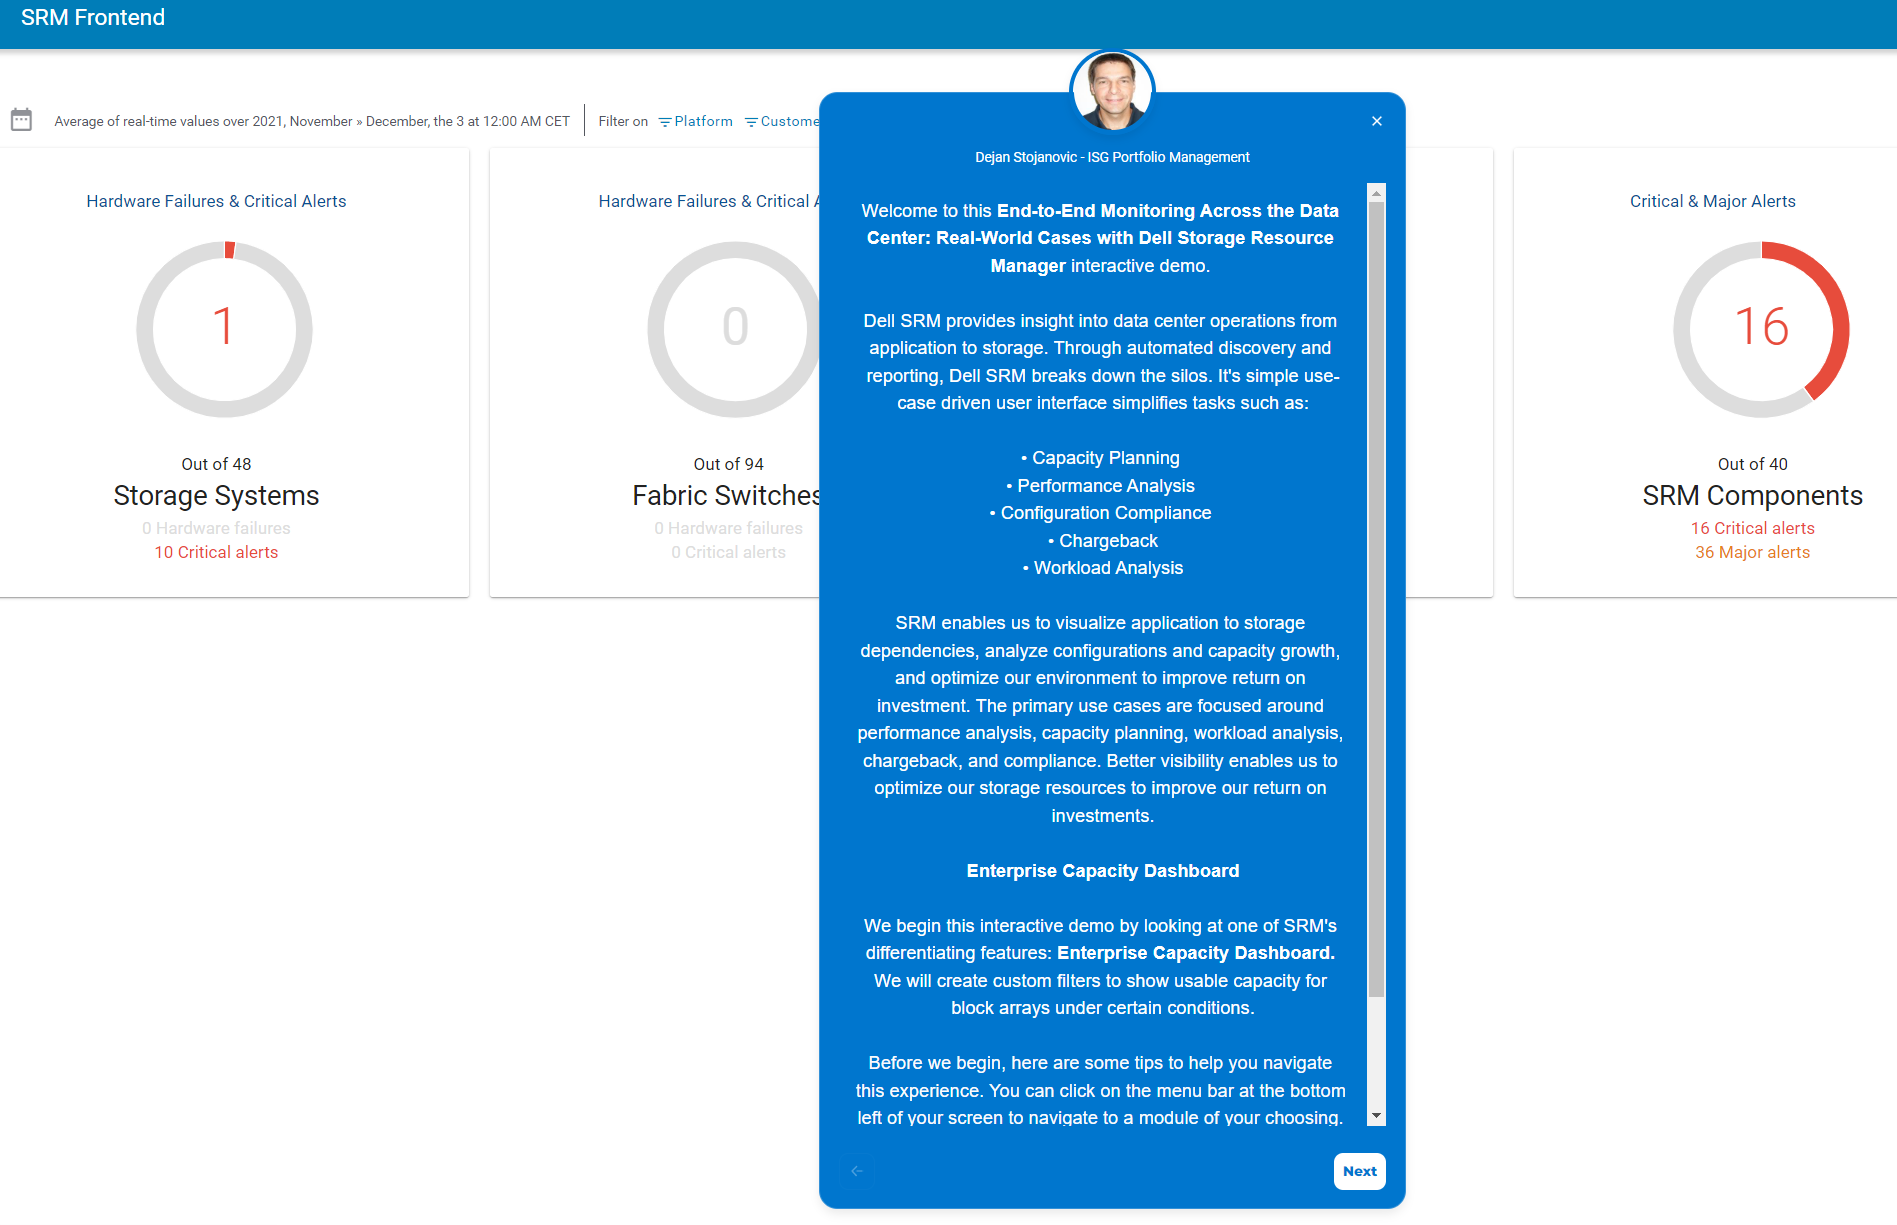
Dell SRM provides insight into data center operations from application to storage. Through automated discovery and reporting, Dell SRM breaks down the silos. Its simple use-case driven user interface simplifies tasks such as:
- Capacity Planning
- Performance Analysis
- Configuration Compliance
- Chargeback
- Workload Analysis
There are eight independent interactive demo modules available, each of which covers a main SRM use case or feature:
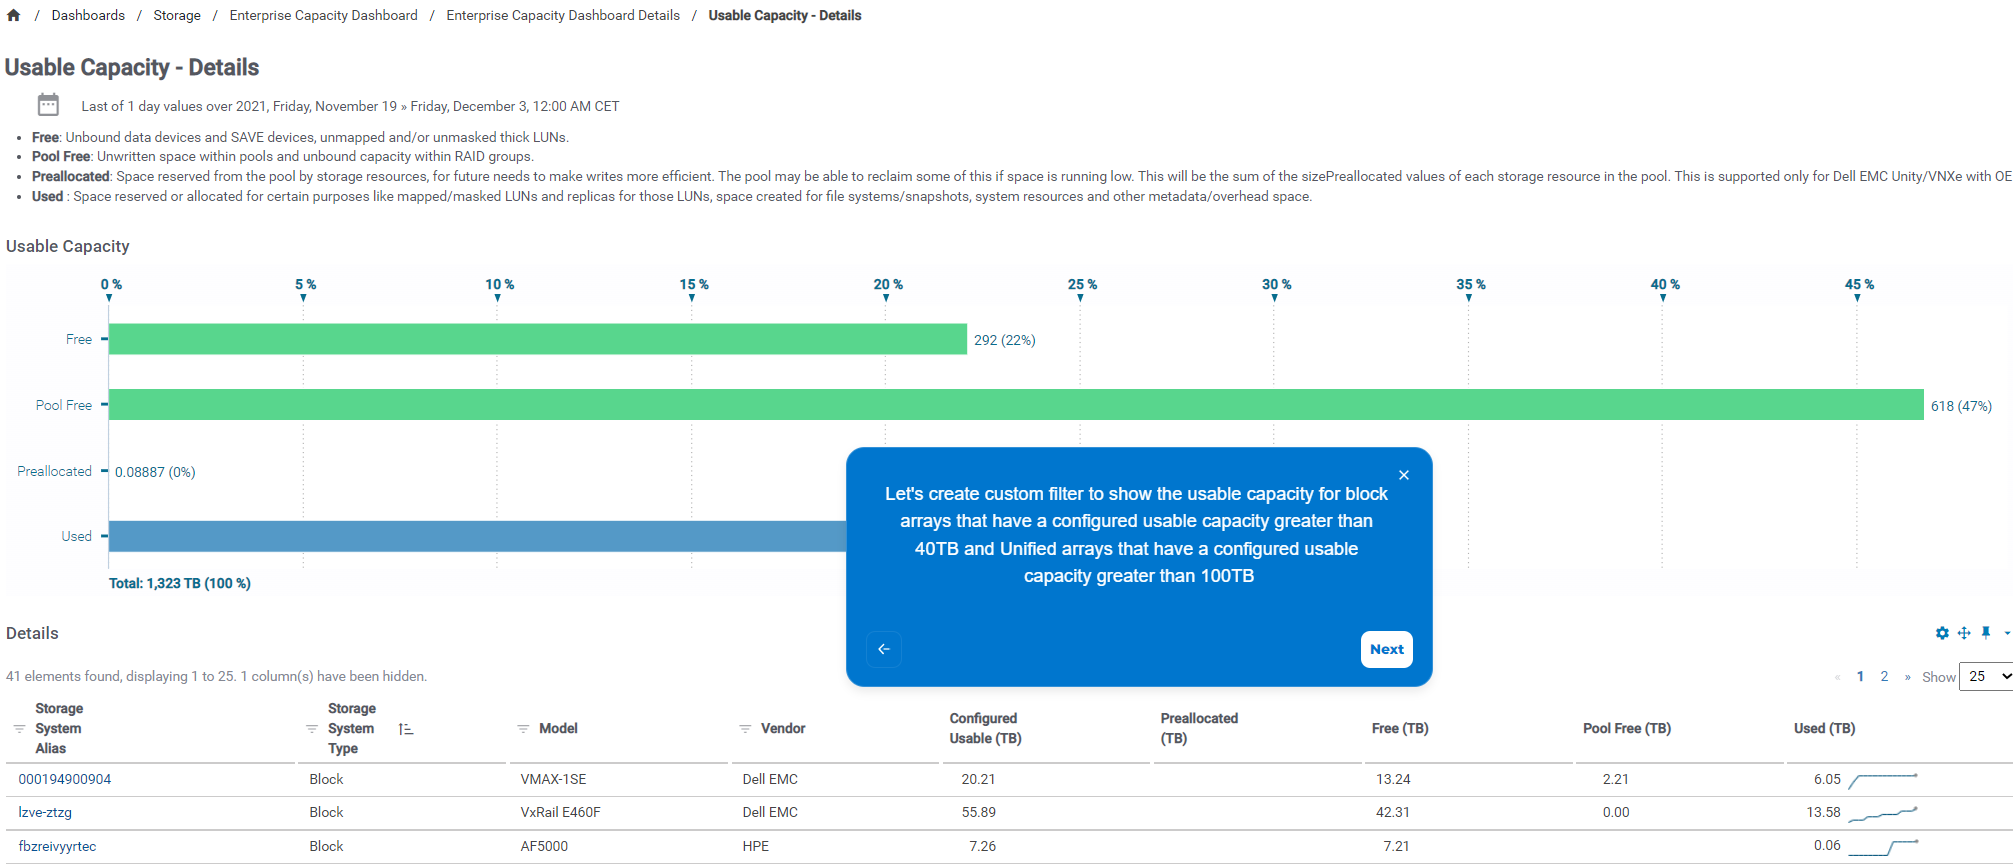
- Enterprise Capacity Dashboard
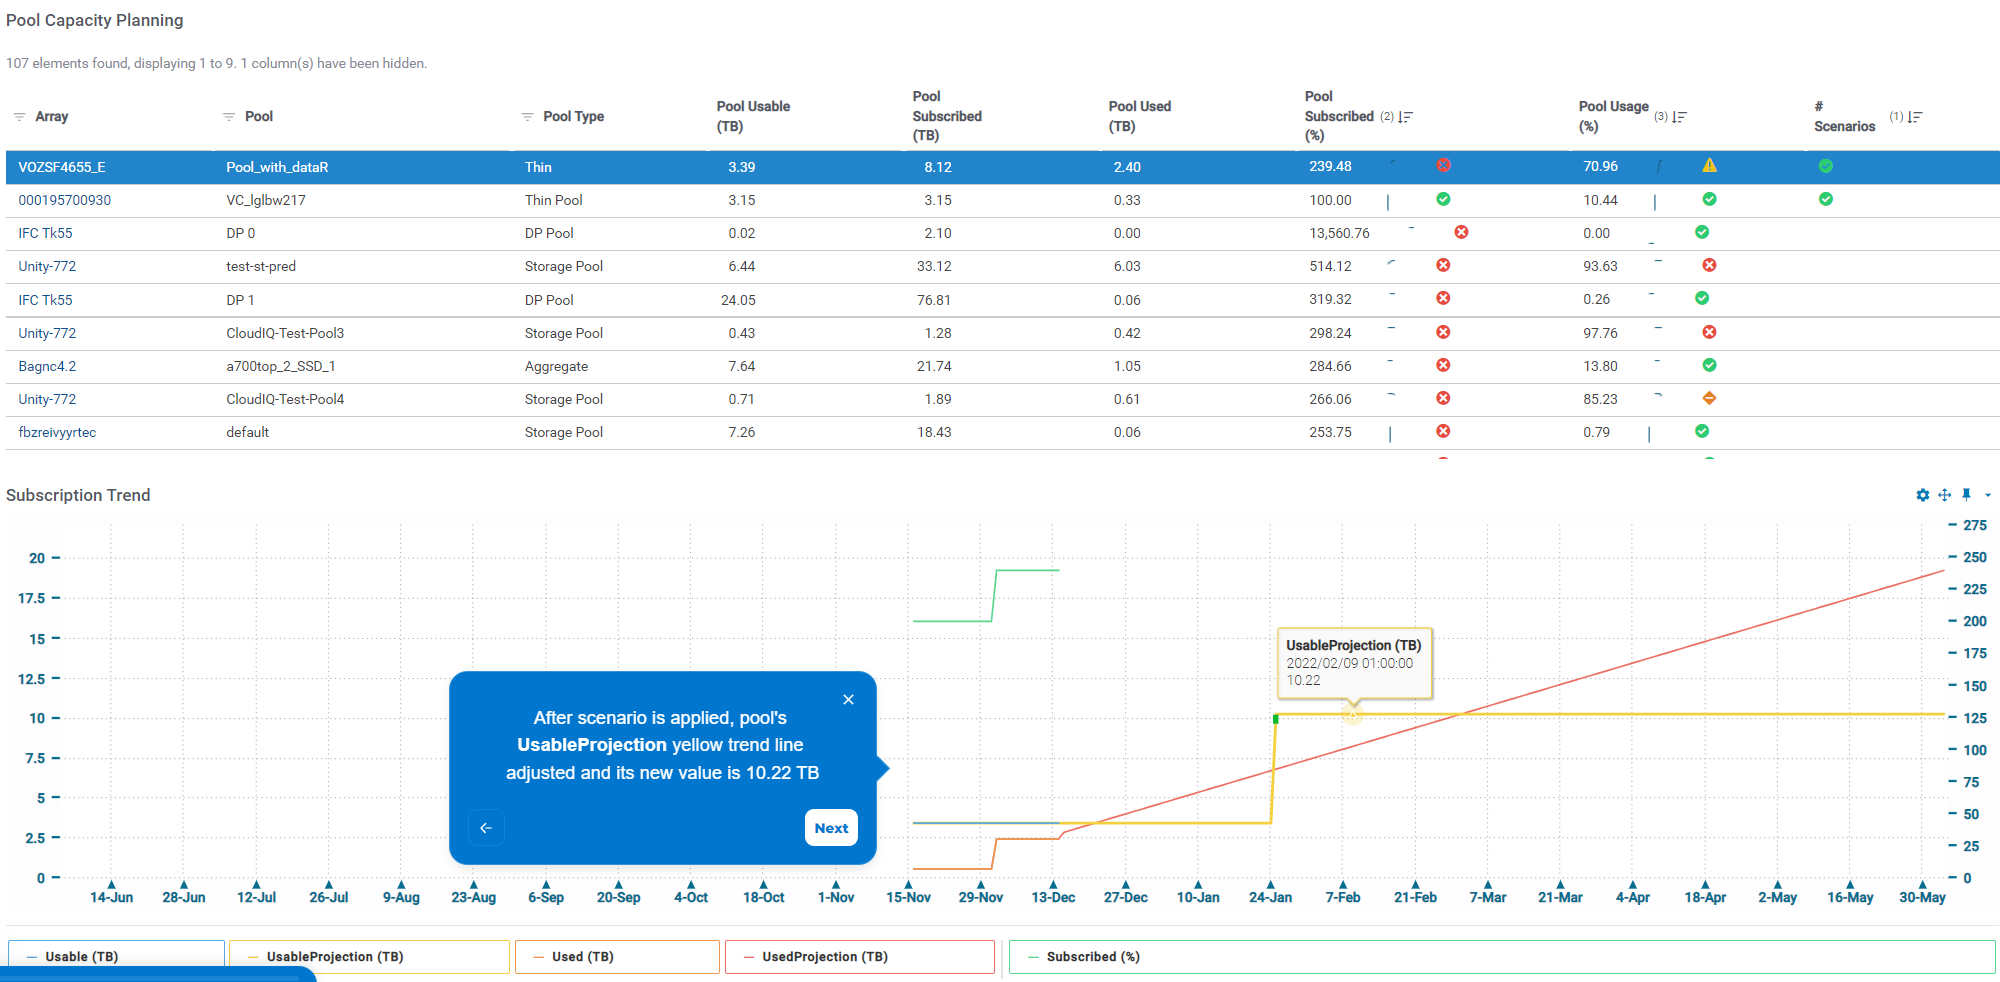
- Capacity Planning What-If Scenario
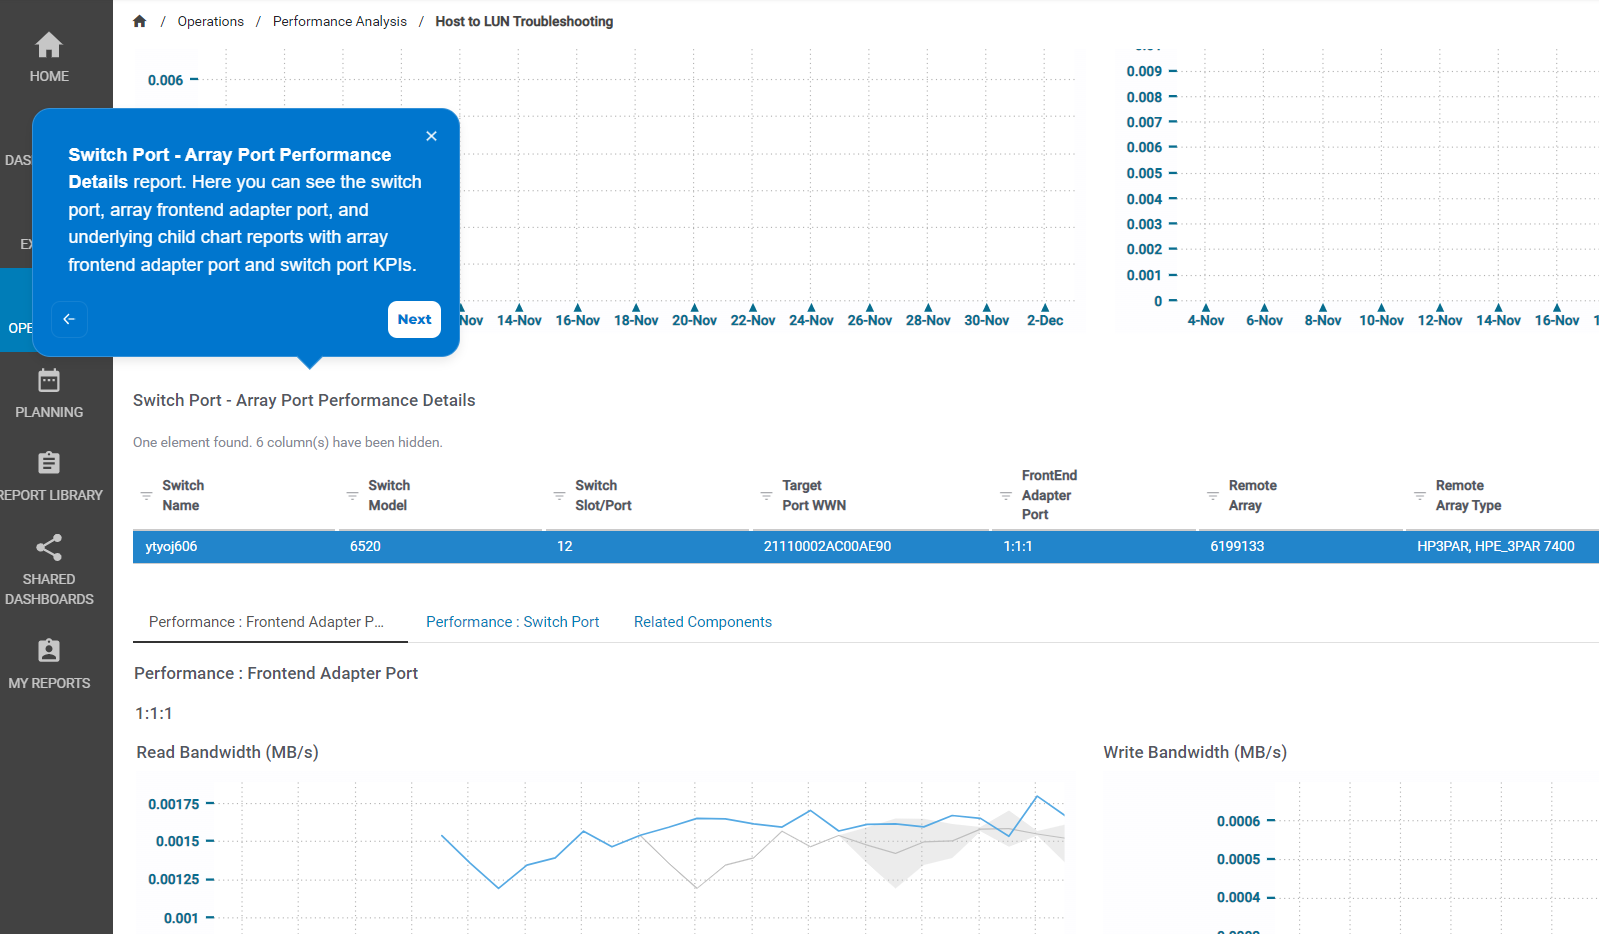
- Performance Analysis - Host to LUN Troubleshooting
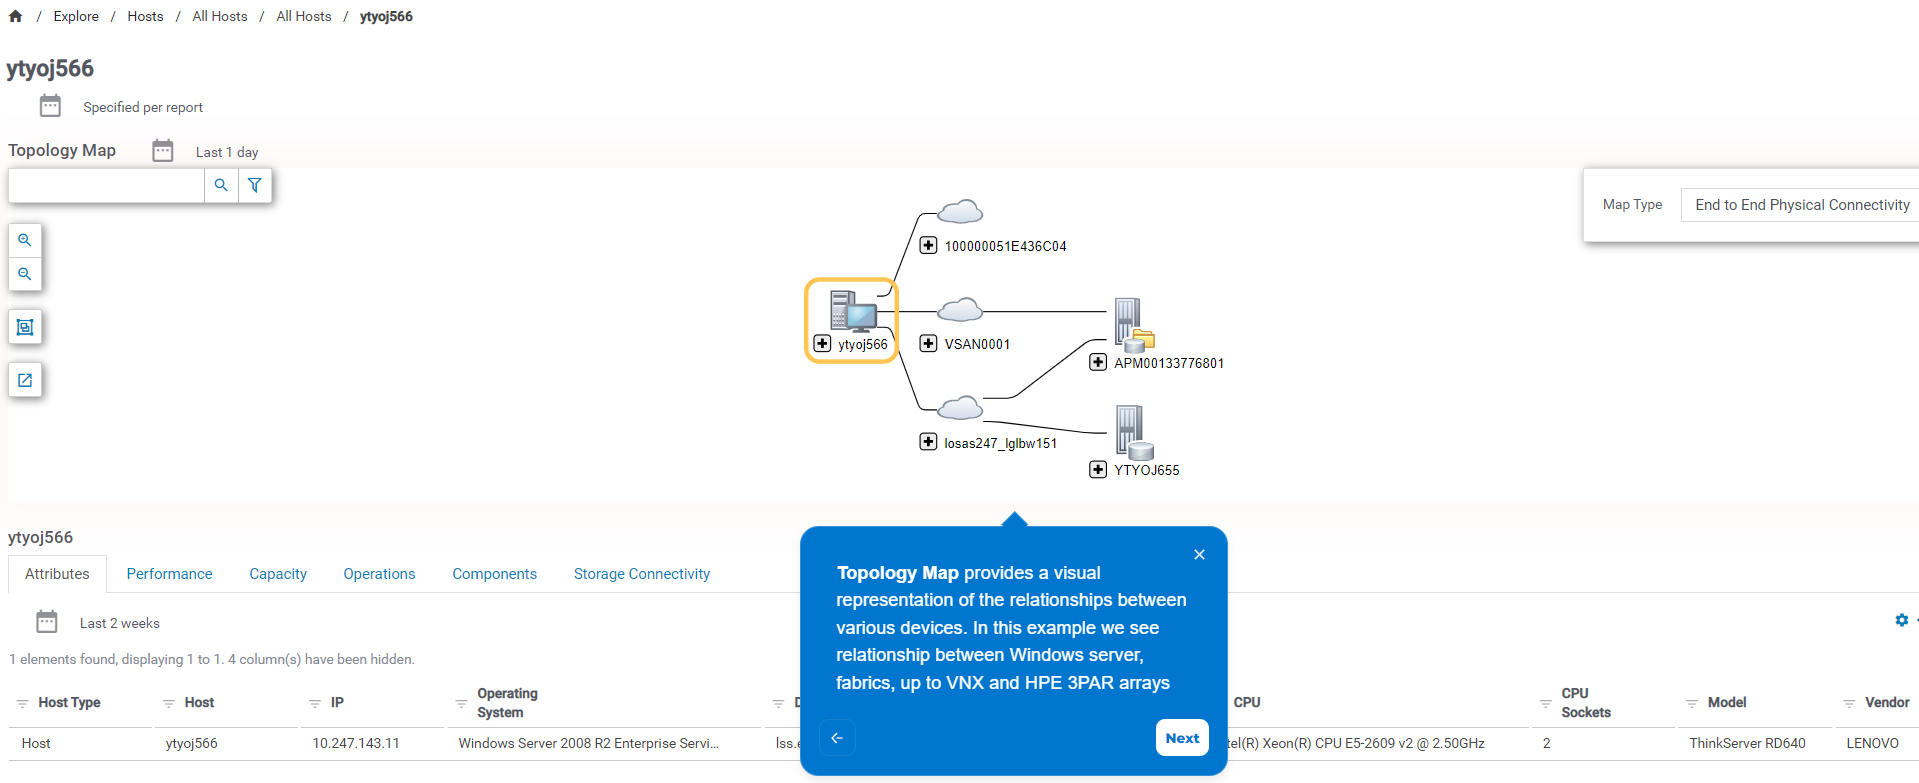
- Topology and End-To-End Relationships
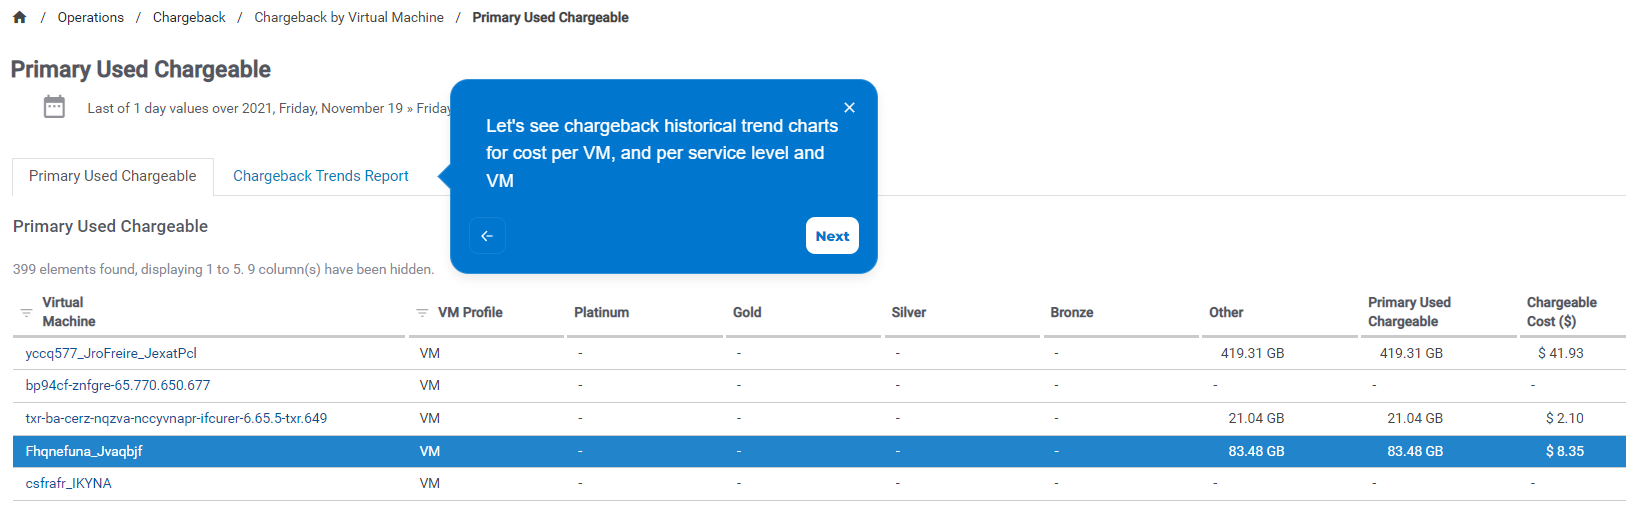
- Chargeback Report by VirtualMachine
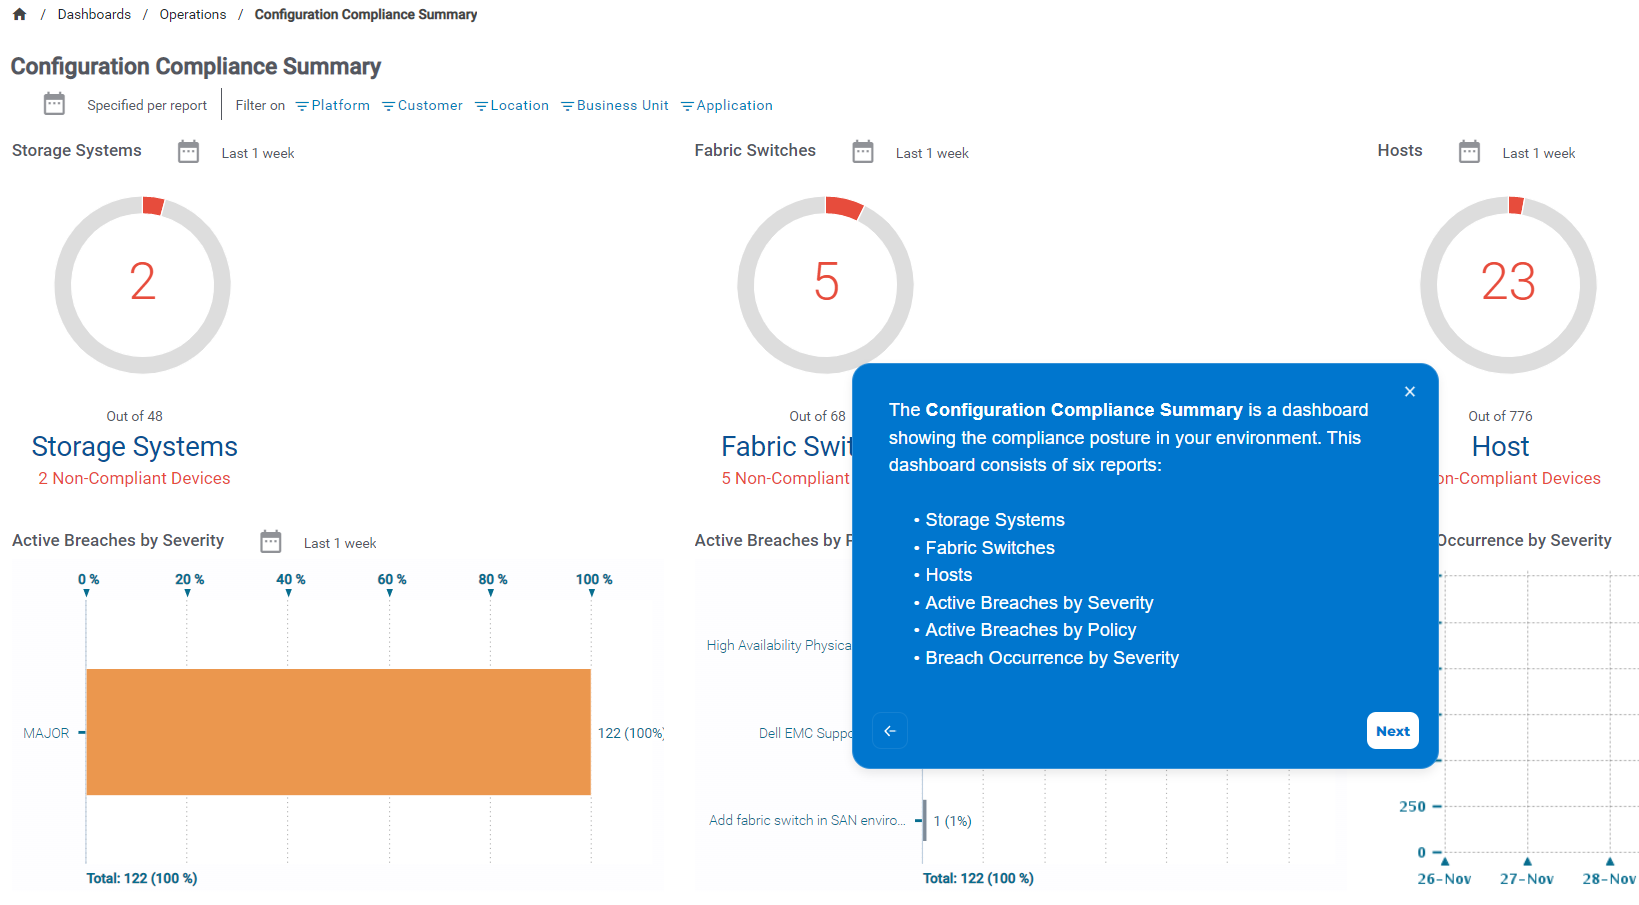
- Configuration Compliance Policies
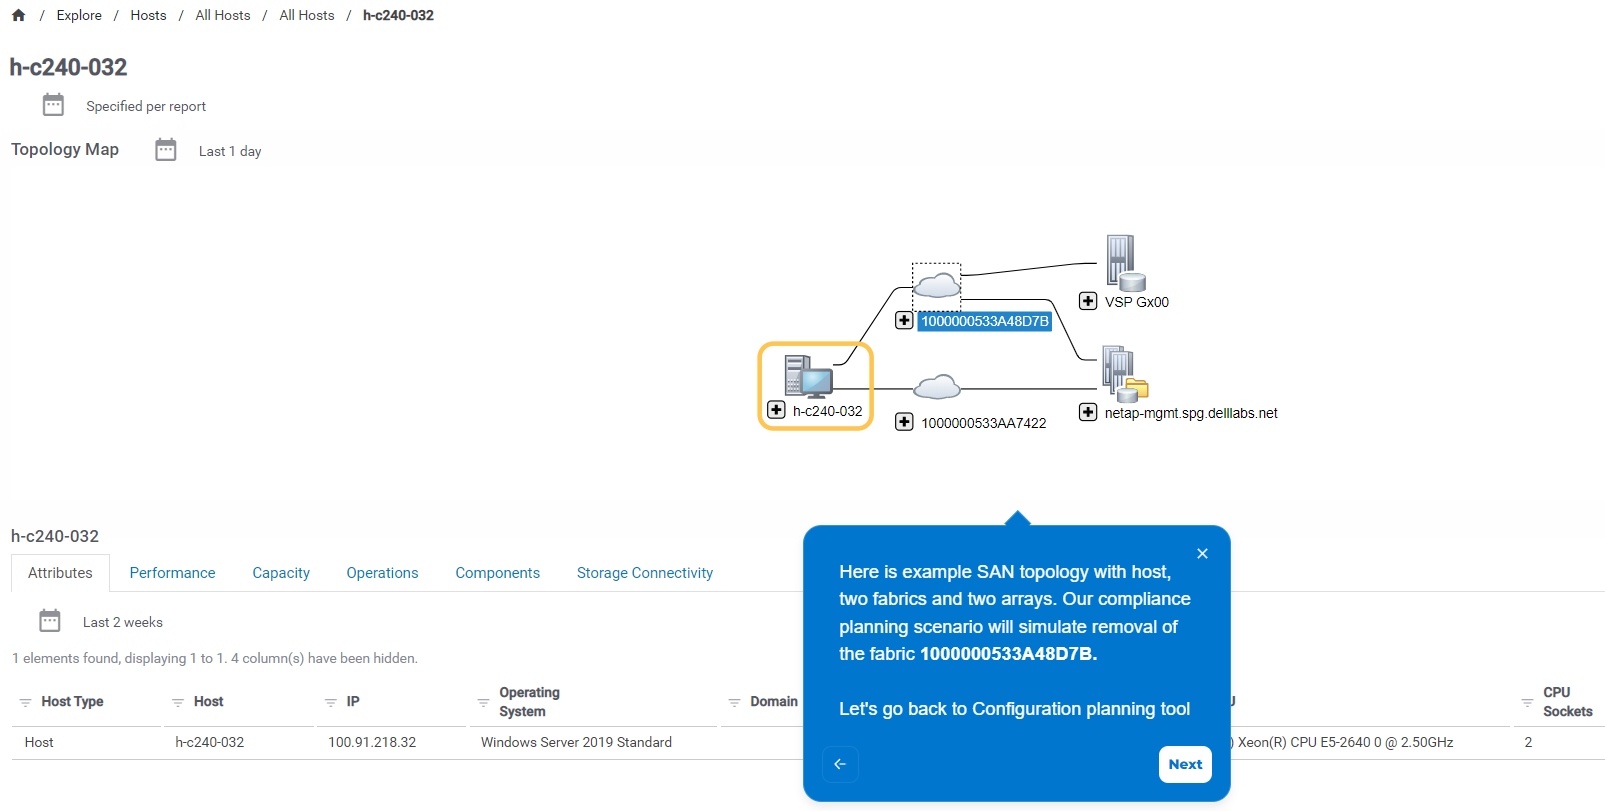
- Configuration Compliance What-if Analysis
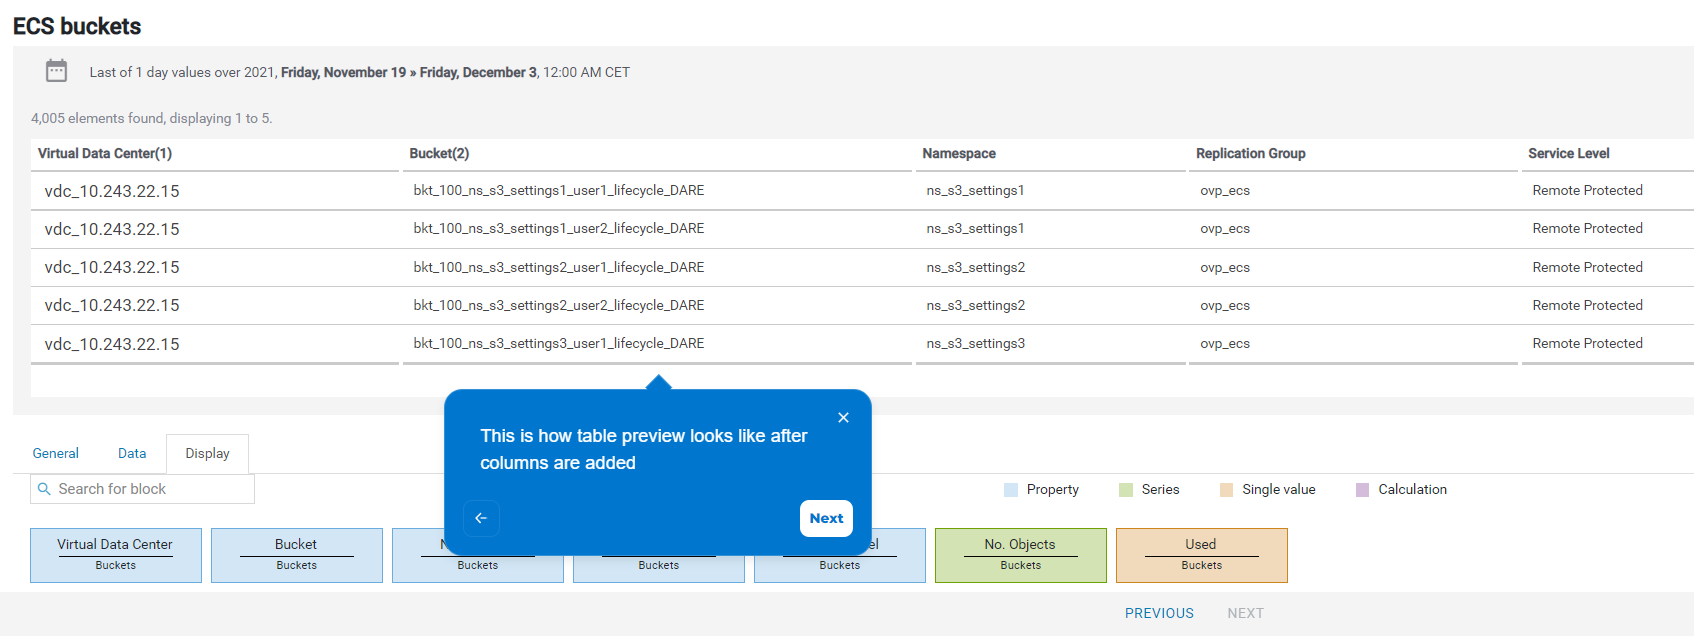
- Custom Report Wizard
Sample Screens from Interactive Demos
Here is a peek inside each of the eight demo modules:
1. Enterprise Capacity Dashboard
2. Capacity Planning What-If Scenario
3. Performance Analysis - Host to LUN Troubleshooting
4. Topology and End-To-End Relationships
5. Chargeback Report by VirtualMachine
6. Configuration Compliance Policies
7. Configuration Compliance What-if Analysis
8. Custom Report Wizard
Supported Platforms
The data that is available in this comprehensive eight module demo is from the following supported vendors and technologies:
|
|
Enjoy this demo and let us know how you like it!
Resources
Author: Dejan Stojanovic

Announcing: the New Dell SRM Hands on Lab
Thu, 07 Apr 2022 14:26:51 -0000
|Read Time: 0 minutes
We are happy to announce the release of the new SRM hands on lab:
- SRM 4.7.0.0 - Visualize, Analyze and Optimize Data Center Infrastructure with Dell SRM
This new SRM hands on lab is based on the latest SRM release (4.7.0.0), which introduced many new features, enhancements, and platform supports.
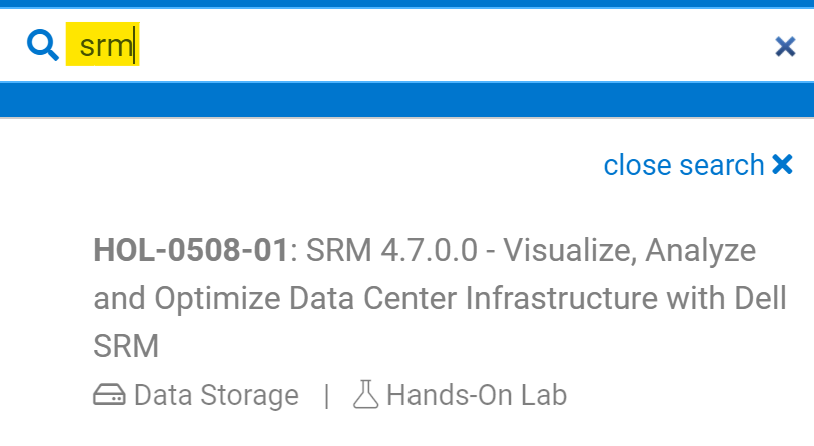
To find this lab, go to the demo center (https://democenter.delltechnologies.com) and enter “srm” in the search box. This link to the lab will appear:
Lab Info
The welcome screen on the lab looks like this. It includes a network diagram and a comprehensive lab guide:
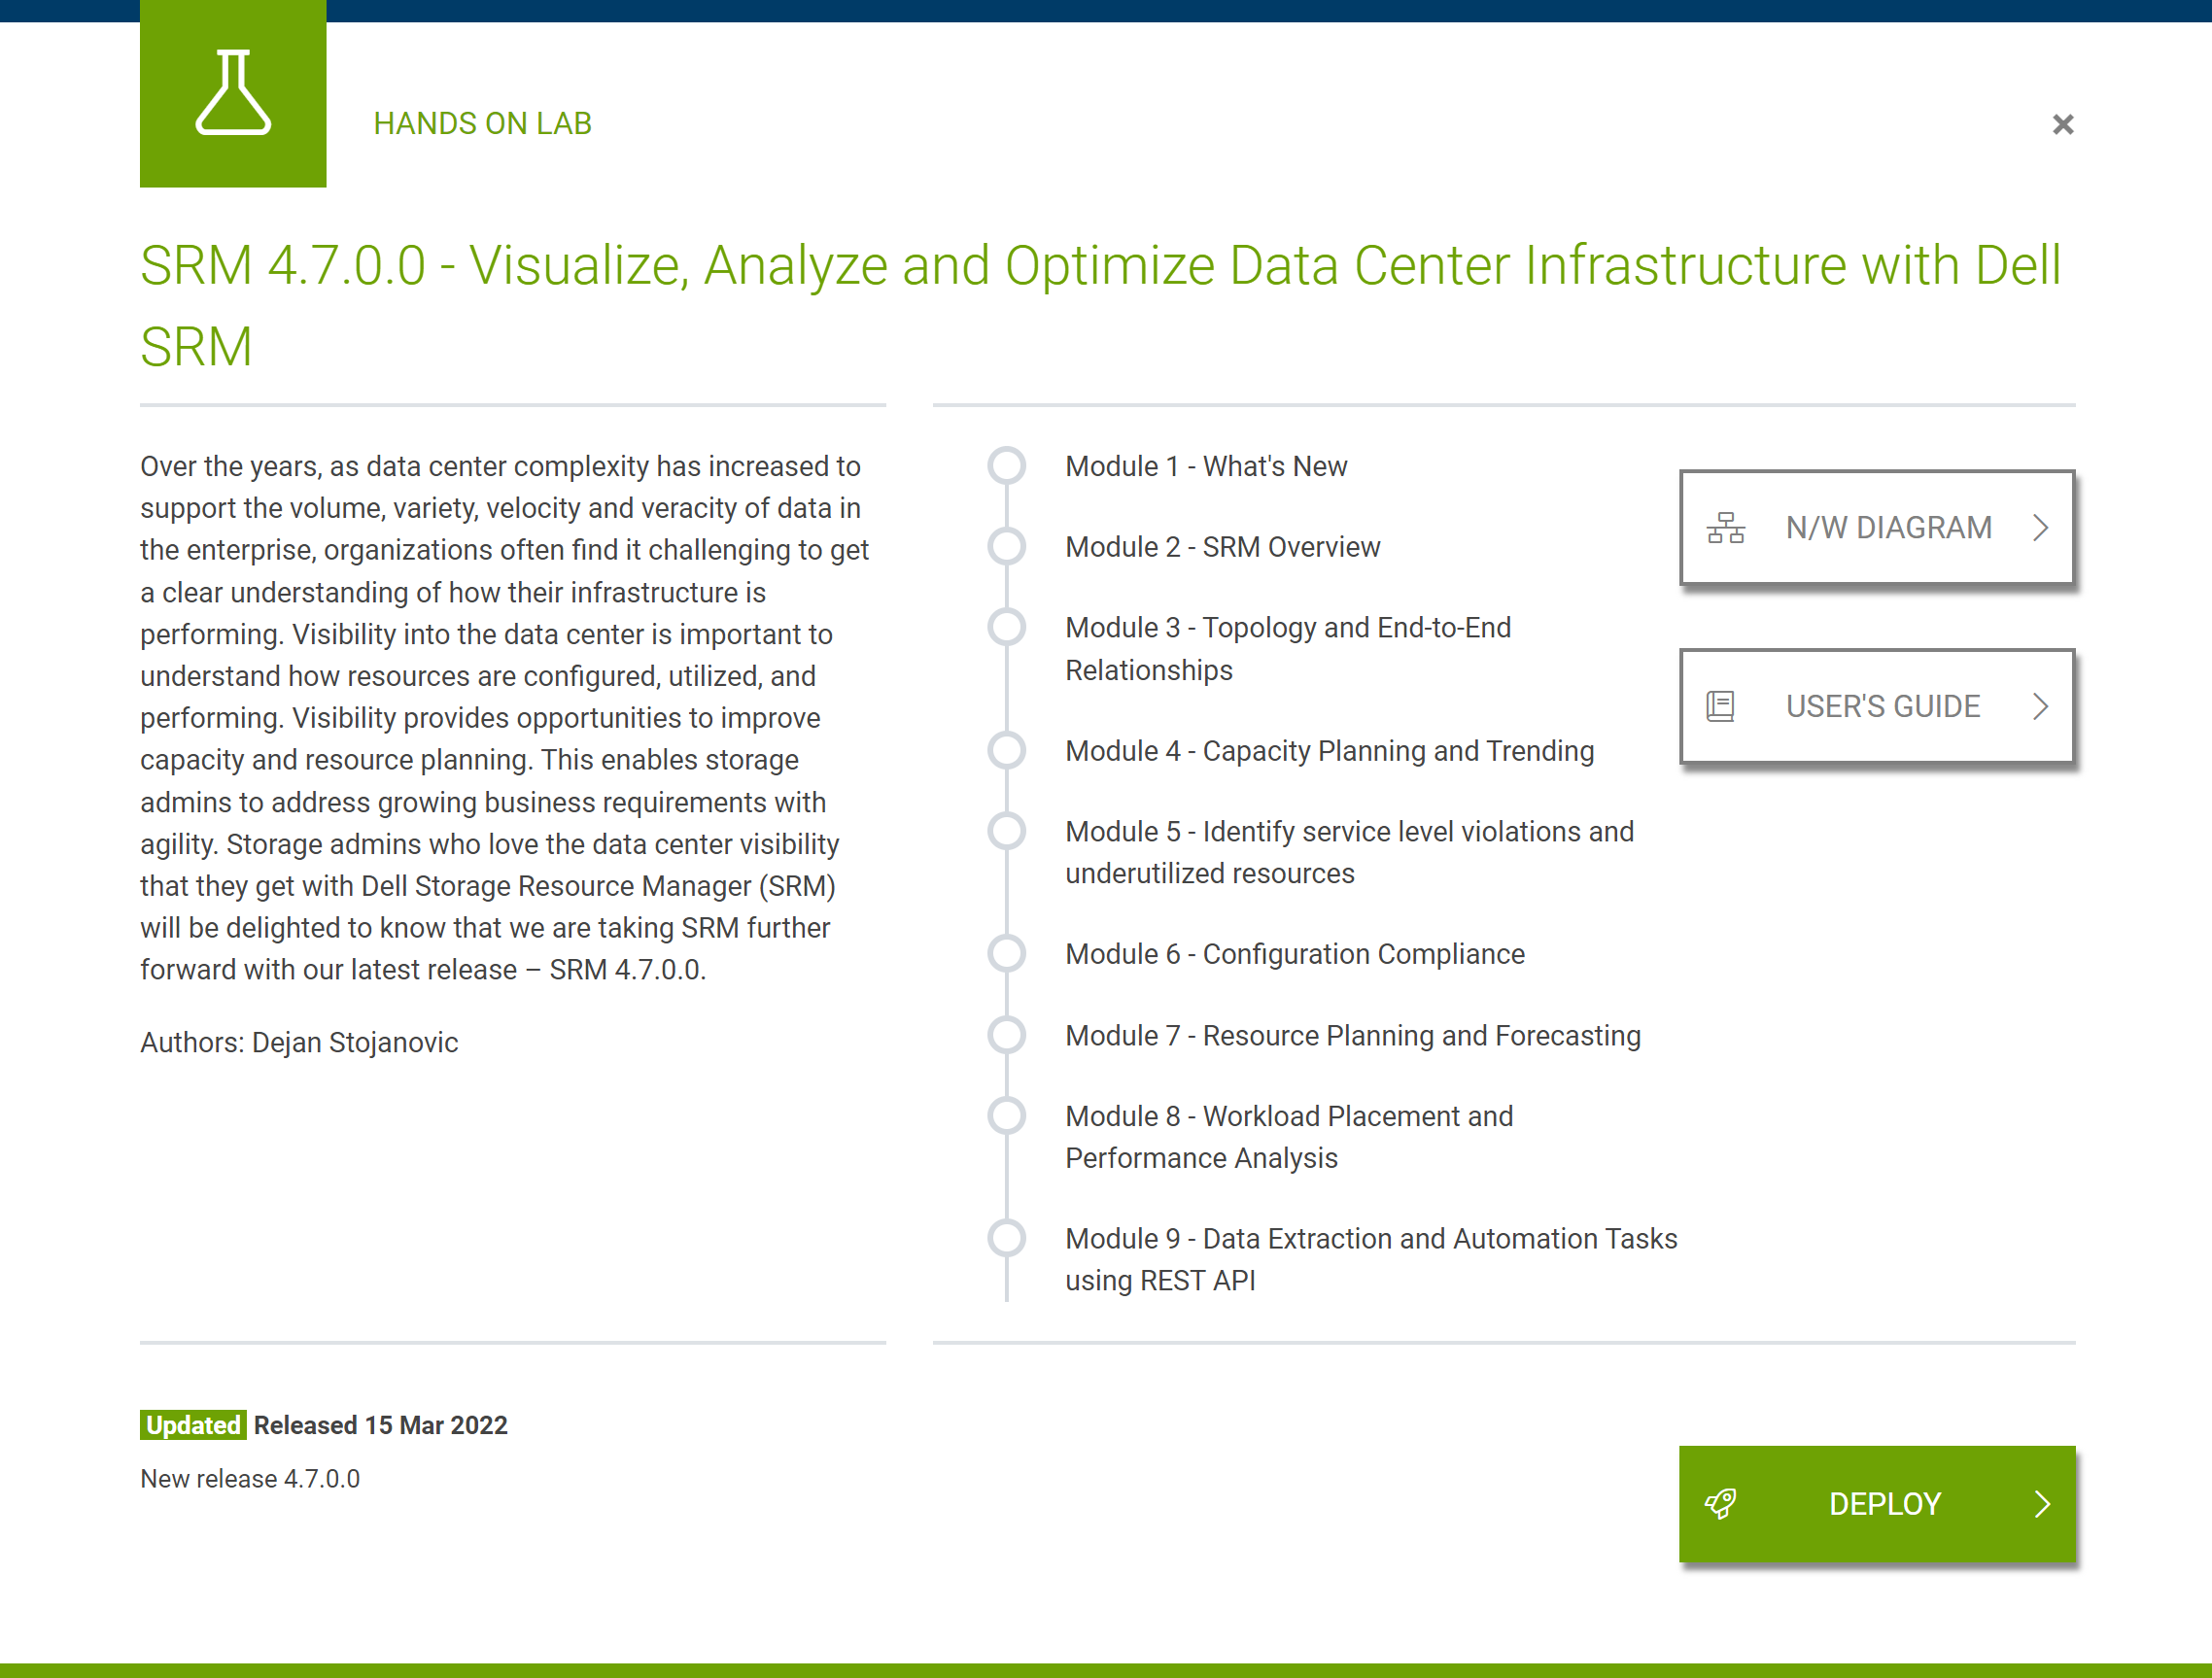
In the first module, called “What’s New”, the lab focuses on the following new features, enhancements, and newly supported platforms:
- New features dialog
- Dell VxRail support
- MS Azure support
- Huawei Oceanstor support
- IBM FlashSystem support
- Chargeback trends reports
- Correlate performance data with alerts
- New business groups and operations dashboards
- Webhook API for auto ticketing
- In-context User Feedback
The rest of the modules cover in-depth SRM use-cases listed below. Each module is independent so that you can focus on your area of interest:
- Configuration compliance
- Workload analysis
- Capacity planning
- Performance troubleshooting
- Chargeback reporting
and some of the main SRM features:
- Topology and end-to-end relationships
- Data extraction and automation tasks via REST API
Sample Reports
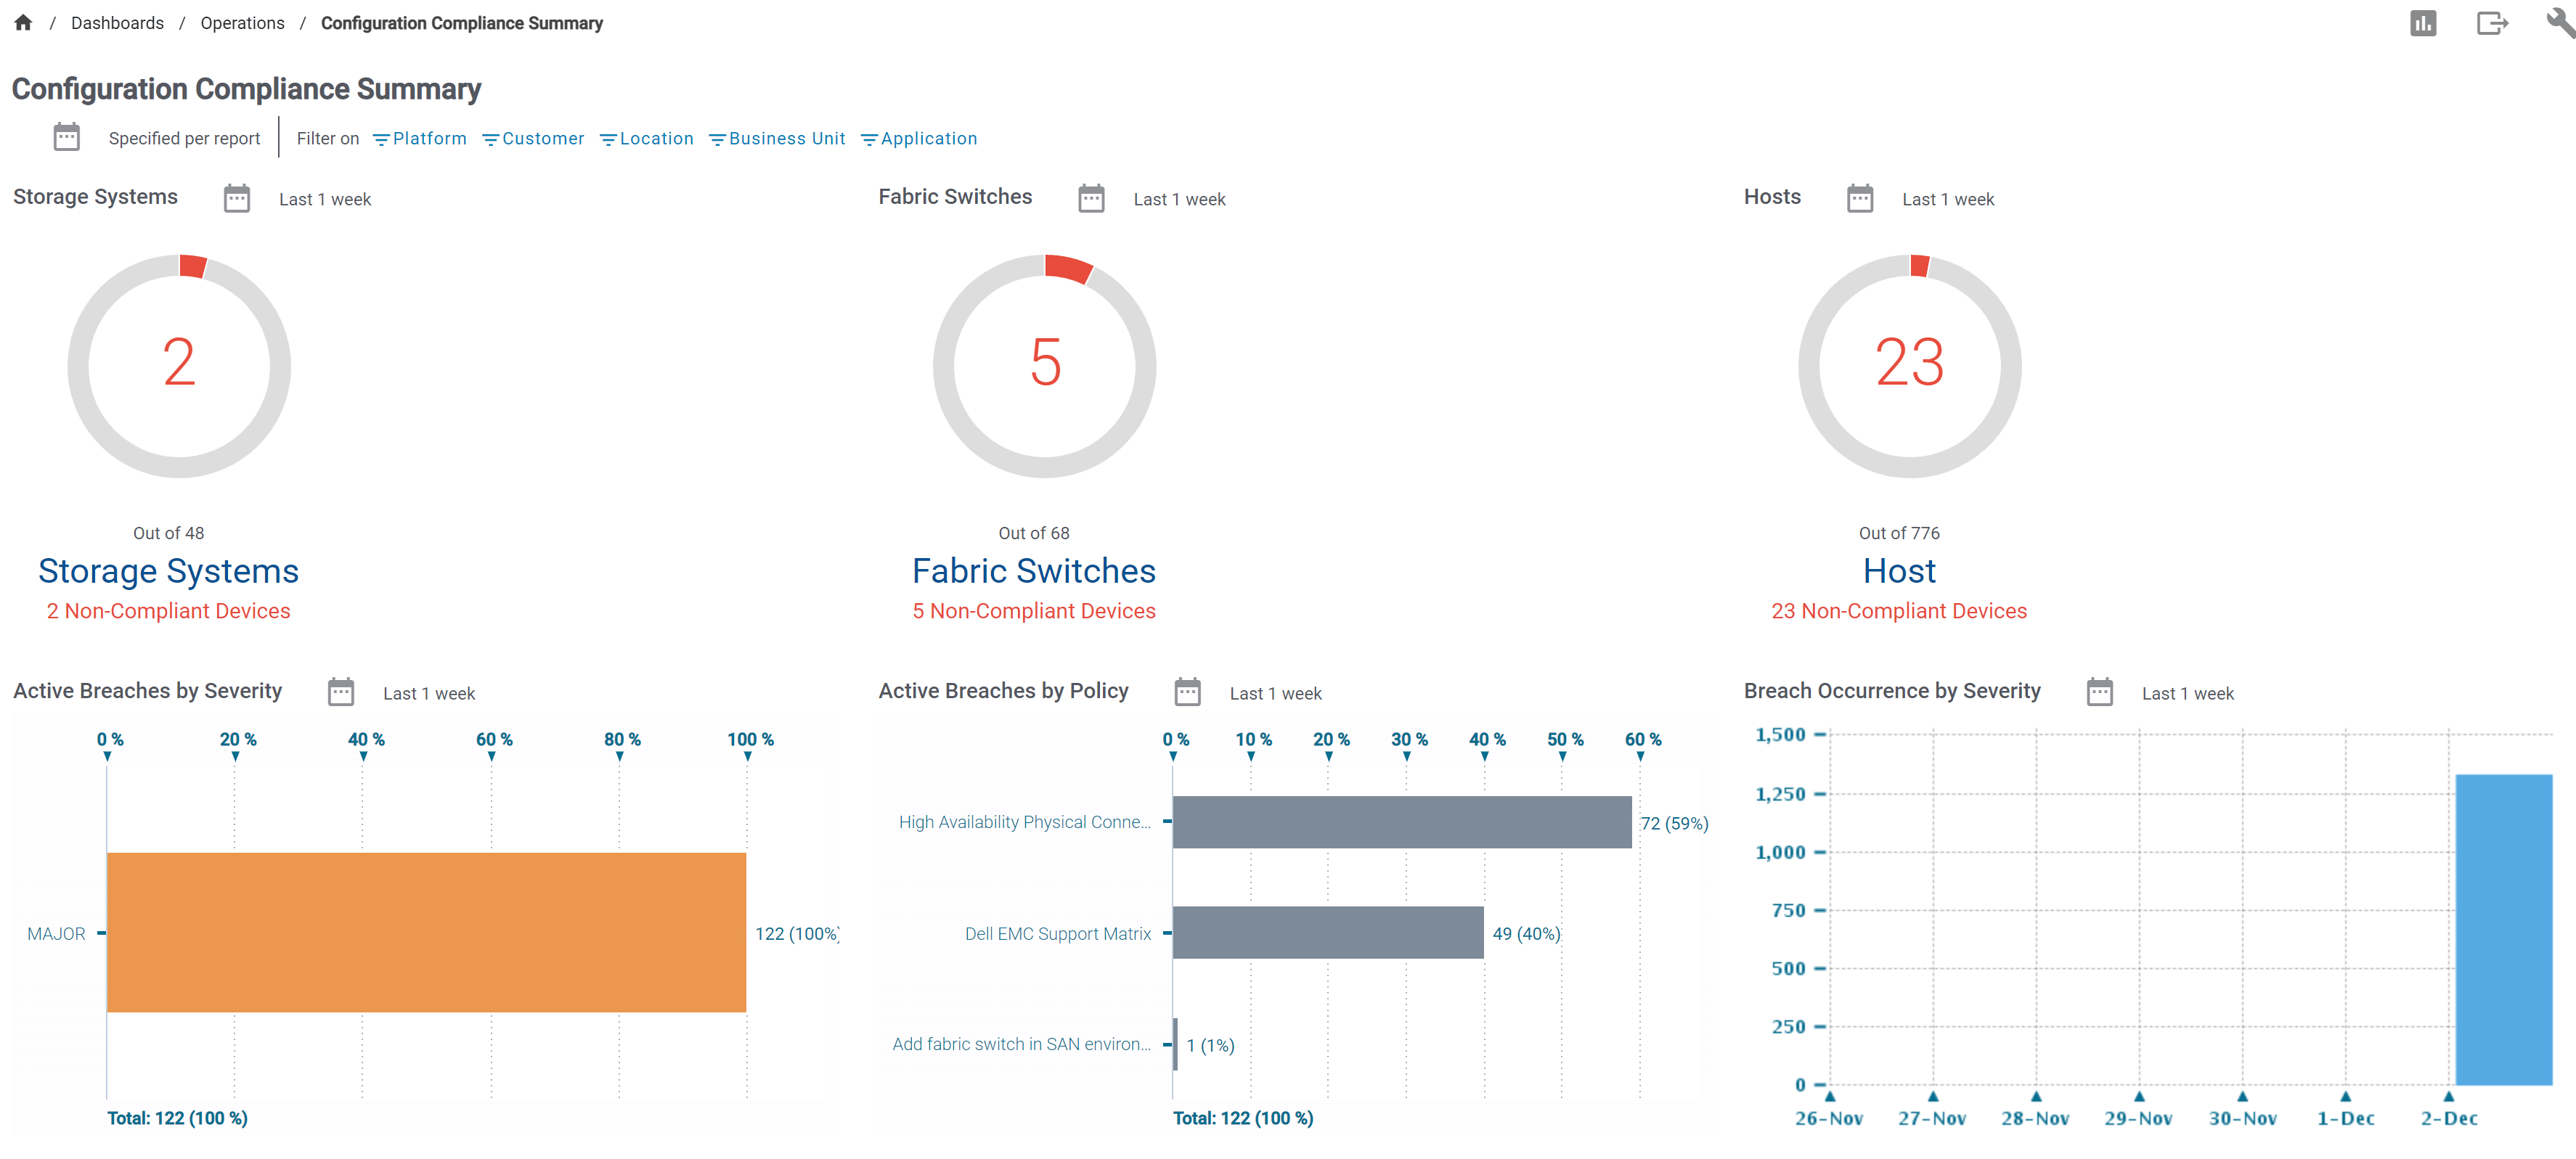
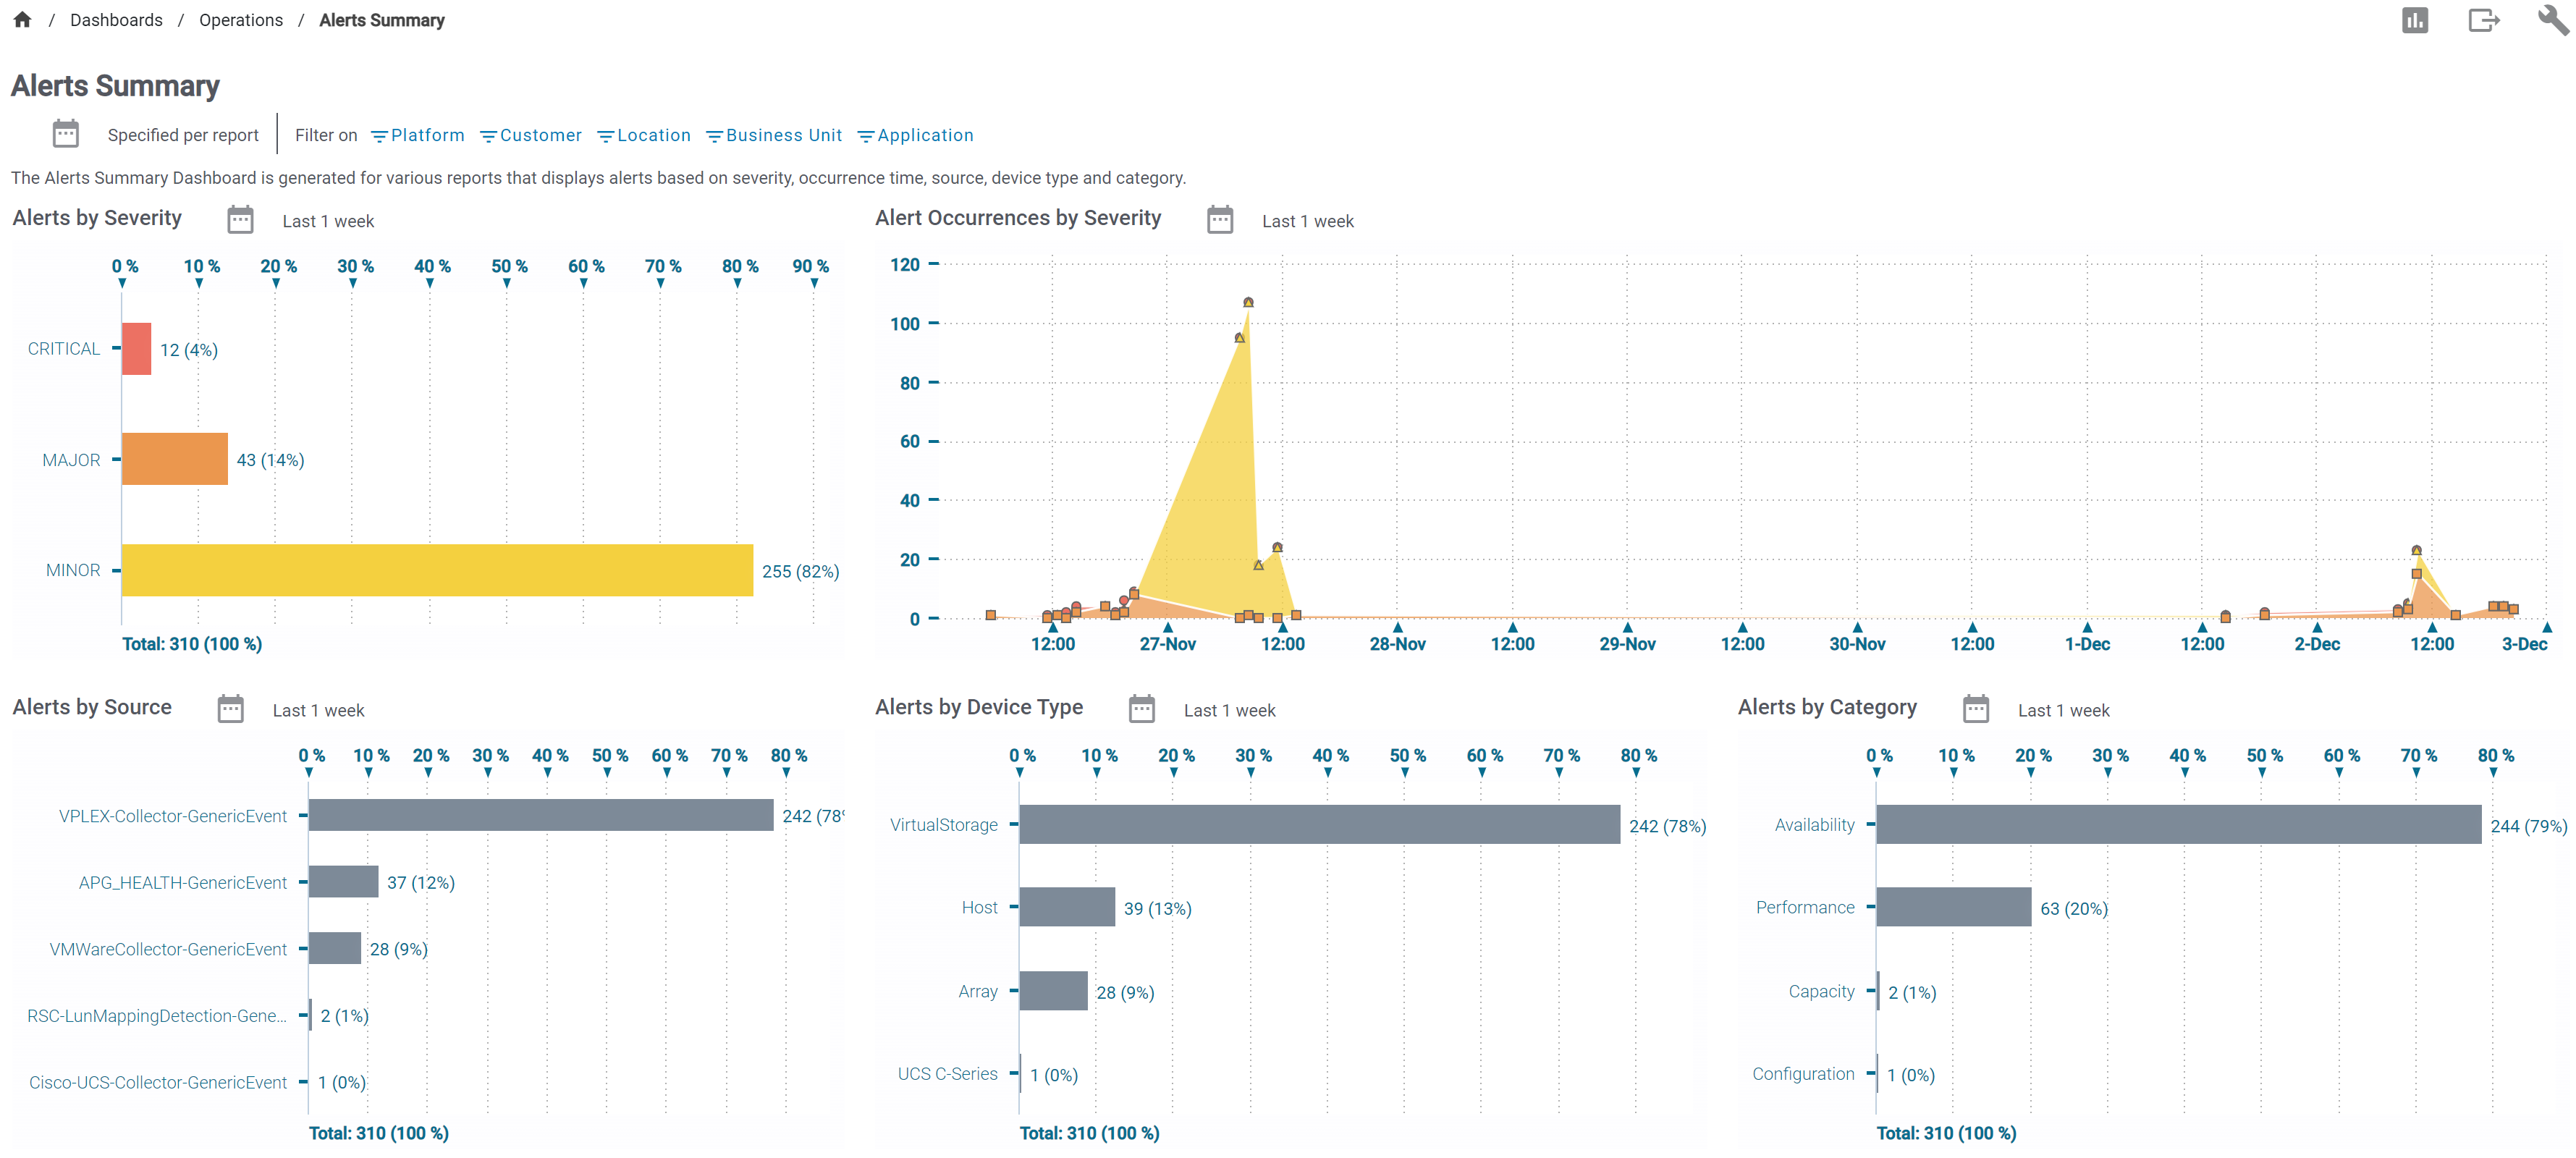
Check out some of the SRM dashboards available:
For configuration compliance:
For active alerts:
Supported Platforms
The lab includes a great variety of SRM reports containing data from supported vendors and technologies:
|
|
To wrap up
The SRM 4.7.0.0 hands on lab helps you experience SRM use-cases and features, by browsing through the powerful user interface and elaborating on data from multiple vendors and technologies.
Enjoy the SRM hands on lab! If you have any questions, please contact us at support@democenter.dell.com.
Resources
Author: Dejan Stojanovic