


Performance Evaluation of HPC Applications on a Dell PowerEdge R650-based VMware Virtualized Cluster
Overview
High Performance Computing (HPC) solves complex computational problems by doing parallel computations on multiple computers and performing research activities through computer modeling and simulations. Traditionally, HPC is deployed on bare-metal hardware, but due to advancements in virtualization technologies, it is now possible to run HPC workloads in virtualized environments. Virtualization in HPC provides more flexibility, improves resource utilization, and enables support for multiple tenants on the same infrastructure.
However, virtualization is an additional layer in the software stack and is often construed as impacting performance. This blog explains a performance study conducted by the Dell Technologies HPC and AI Innovation Lab in partnership with VMware. The study compares bare-metal and virtualized environments on multiple HPC workloads with Intel® Xeon® Scalable third-generation processor-based systems. Both the bare-metal and virtualized environments were deployed on the Dell HPC on Demand solution.
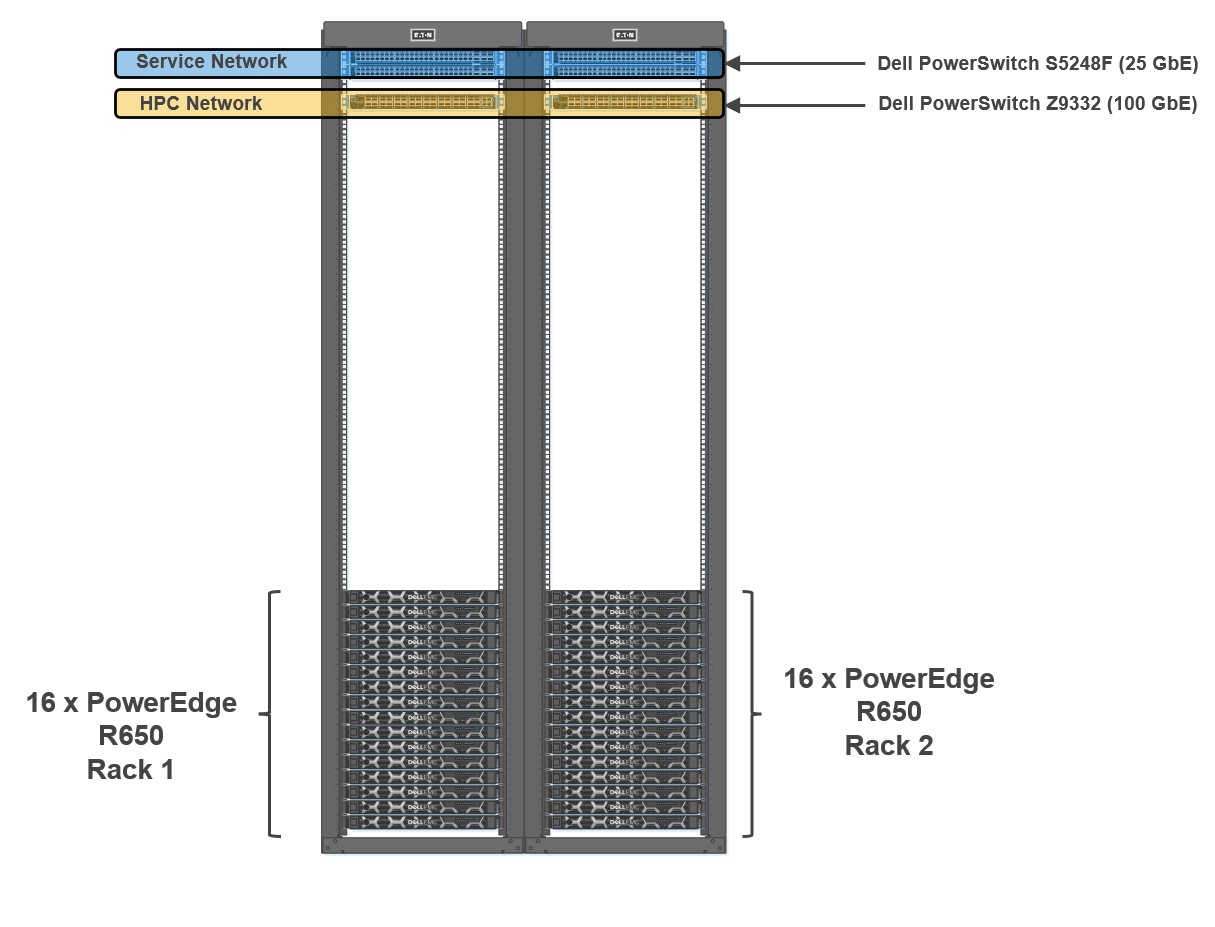
Figure 1: Cluster Architecture
To evaluate the performance of HPC applications and workloads, we built a 32-node HPC cluster using Dell PowerEdge R650 as compute nodes. Dell Power Edge R650 is a 1U dual socket server with Intel® Xeon® Scalable third-generation processors. The cluster was configured to use both bare-metal and virtual compute nodes (running VMware vSphere 7). Both bare-metal and virtualized nodes were attached to the same head node.
Figure 1 shows a representative network topology of this cluster. The cluster was connected to two separate physical networks. The compute nodes were spread across two sets of racks, and the cluster consisted of the following two networks:
- HPC Network: Dell PowerSwitch Z9332 switch connecting NVIDIA® Connect®-X6 100 GbE adapters to provide a low latency high bandwidth 100 GbE RDMA-based HPC network for the MPI-based HPC workload
- Services Network: A separate pair of Dell PowerSwitch S5248F-ON 25 GbE based top of rack (ToR) switches for hypervisor
The Virtual Machine (VM) configuration details for optimal performance settings were captured in an earlier blog. In addition to the settings noted in the previous blog, some additional BIOS tuning options such as Snoop Hold Off, SubNumaCluster (SNC) and LLC Prefetch settings were also tested. Snoop Hold Off (set to 2 K cycles), and SNC, helped performance across most of the tested applications and microbenchmarks for both the bare-metal and virtual nodes. Enabling SNC in the server BIOS and not configuring SNC correctly in the VM might result in performance degradation.
Bare-metal and virtualized HPC system configuration
Table 1 shows the system environment details used for the study.
Table 1: System configuration details for the bare-metal and virtual clusters
Machine function | Component |
Platform | PowerEdge R650 server |
Processor | Two Intel® Xeon® third Generation 6348 (28 cores @ 2.6 GHz) |
Number of cores | Bare-Metal: 56 cores Virtual: 52 vCPUs (four cores reserved for ESXi) |
Memory | Sixteen 32 GB DDR4 DIMMS @3200 MT/s Bare-Metal: All 512 GB used Virtual: 440 GB reserved for the VM
|
HPC Network NIC | 100 GbE NVIDIA Mellanox Connect-X6 |
Service Network NIC | 10/25 GbE NVIDIA Mellanox Connect-X5 |
HPC Network Switch | Dell PowerSwitch Z9332 with OS 10.5.2.3 |
Service Network Switch | Dell PowerSwitch S5248F-ON |
Operating system | Rocky Linux release 8.5 (Green Obsidian) |
Kernel | 4.18.0-348.12.2.el8_5.x86_64 |
Software – MPI | IntelMPI 2021.5.0 |
Software – Compilers | Intel OneAPI 2022.1.1 |
Software – OFED | OFED 5.4.3 (Mellanox FW 22.32.20.04) |
BIOS version | 1.5.5 (for both bare-metal and virtual nodes) |
Application and benchmark details
The following chart outlines the set of HPC applications used for this study from different domains like Computational Fluid Dynamics (CFD), Weather, and Life Sciences. Different benchmark datasets were used for each of the applications as detailed in Table 2.
Table 2: Application and benchmark dataset details
Application | Vertical Domain | Benchmark Dataset |
Weather and Environment | Conus 2.5KM, Maria 3KM | |
Manufacturing - Computational Fluid Dynamics (CFD) | ||
Life Sciences – Molecular Dynamics | ||
Molecular Dynamics | EAM metallic Solid Benchmark (1M, 3M and 8M Atoms) HECBIOSIM – 3M Atoms |
Performance results
All the application results shown here were run on both bare-metal and virtual environments using the same binary compiled with Intel Compiler and run with Intel MPI. Multiple runs were done to ensure consistency in the performance. Basic synthetic benchmarks like High Performance Linpack (HPL), Stream, and OSU MPI Benchmarks were run to ensure that the cluster was operating efficiently before running the HPC application benchmarks. For the study, all the benchmarks were run in a consistent, optimized, and stable environment across both the bare-metal and virtual compute nodes.
Intel® Xeon® Scalable third-generation processors (Ice Lake 6348) have 56 cores. Four cores were reserved for the virtualization hypervisor (ESXi) providing the remaining 52 cores to run benchmarks. All the results shown here consist of 56 core runs on bare-metal vs 52 core runs on virtual nodes.
To ensure better scaling and performance, multiple combinations of threads and MPI ranks were tried based on applications. The best results are used to show the relative speedup between both the bare-metal and virtual systems.
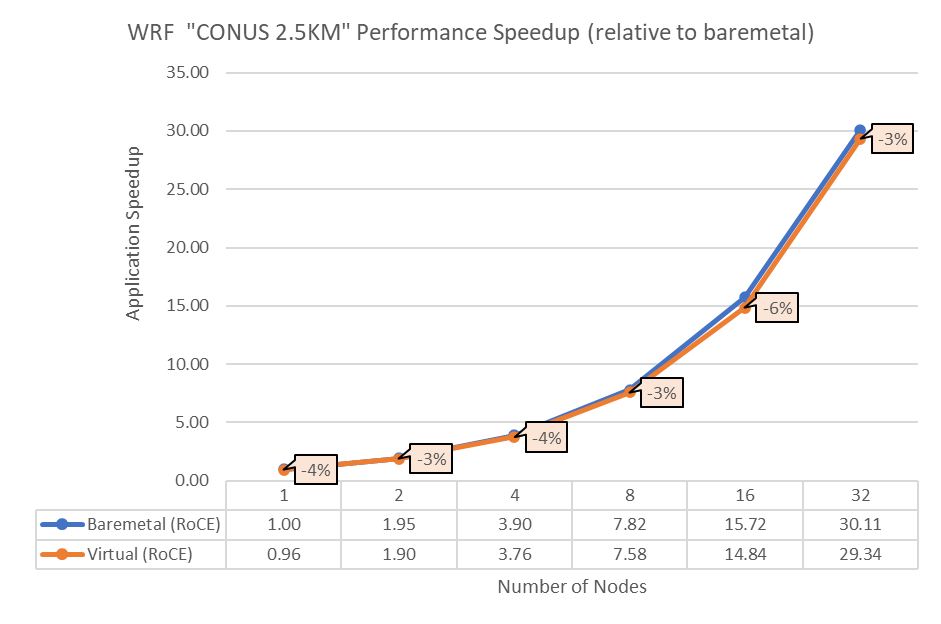
Figure 2: Performance comparison between bare-metal and virtual nodes for WRF
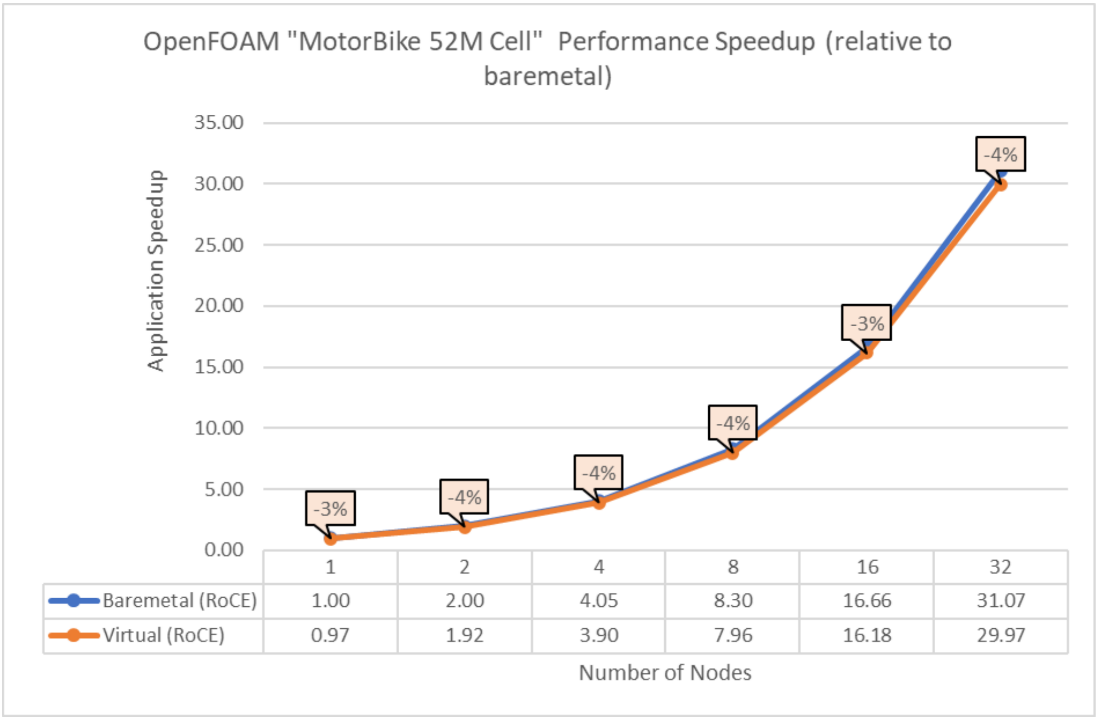
Figure 3: Performance comparison between bare-metal and virtual nodes for OpenFOAM
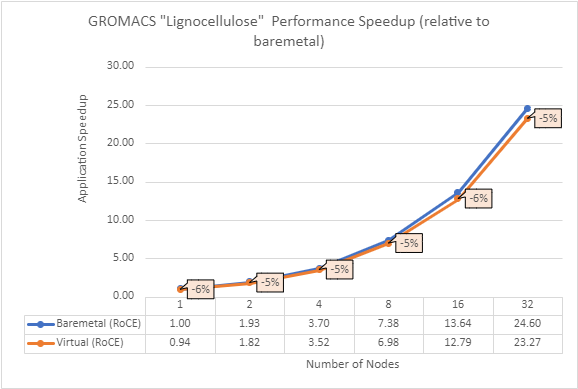
Figure 4: Performance comparison between bare-metal and virtual nodes for GROMACS
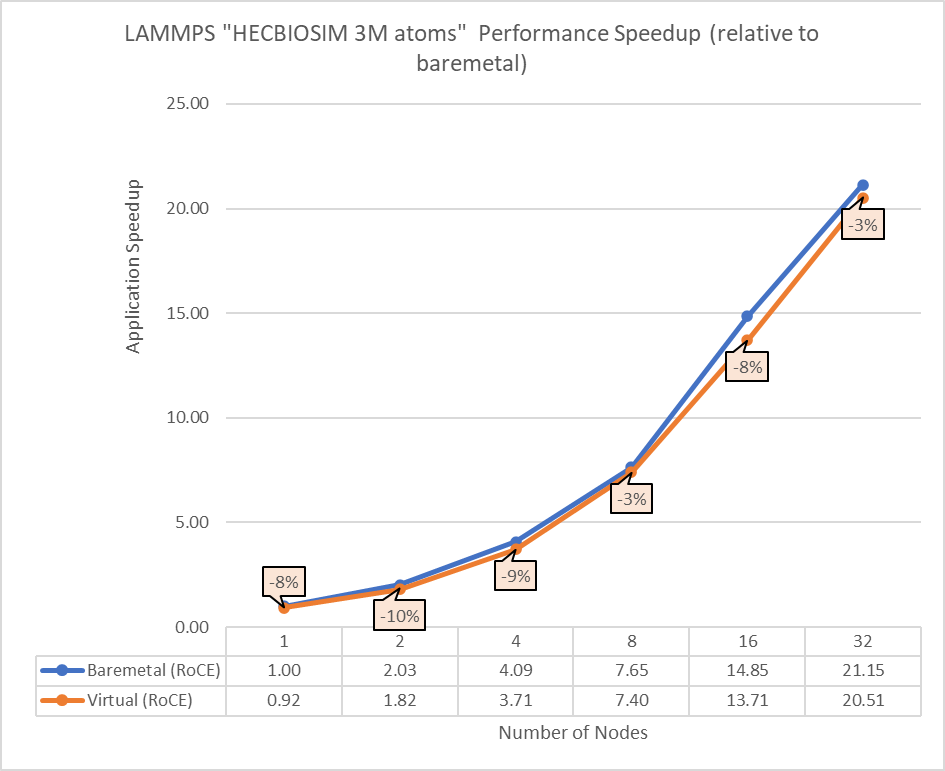
Figure 5: Performance comparison between bare-metal and virtual nodes for LAMMPS
The above results indicate that all the MPI applications running in a virtualized environment are close in performance to the bare-metal environment if proper tuning and optimizations are used. The performance delta, running from a single node up to 32 nodes, is within the 10% range for all the applications. This delta shows no major impact on scaling.
Concurrency test
In a virtualized multitenant HPC environment, the expectation is for multiple tenants to be running multiple concurrent instances of the same or different applications. To simulate this configuration, a concurrency test was conducted by making multiple copies of the same workload and running them in parallel. This test checks whether any performance degradation appears in comparison with the baseline run result. To do some meaningful concurrency tests, we expanded the virtual cluster to 48 nodes by converting 16 nodes of bare-metal to virtual. For the concurrency tests, the baseline is made with an 8-node run while no other workload was running across the 48-node virtual cluster. After that, six copies of the same workload were allowed to run simultaneously across the virtual cluster. Then the results are compared and depicted for all the applications.
The concurrency was tested in two ways. In the first test, all eight nodes running a single copy were placed in the same rack. In the second test, the nodes running a single job were spread across two racks to see if any performance difference was observed due to additional communication over the network.
Figures 6 to 13 capture the results of the concurrency test. As seen from the results there was no degradation observed in the performance.
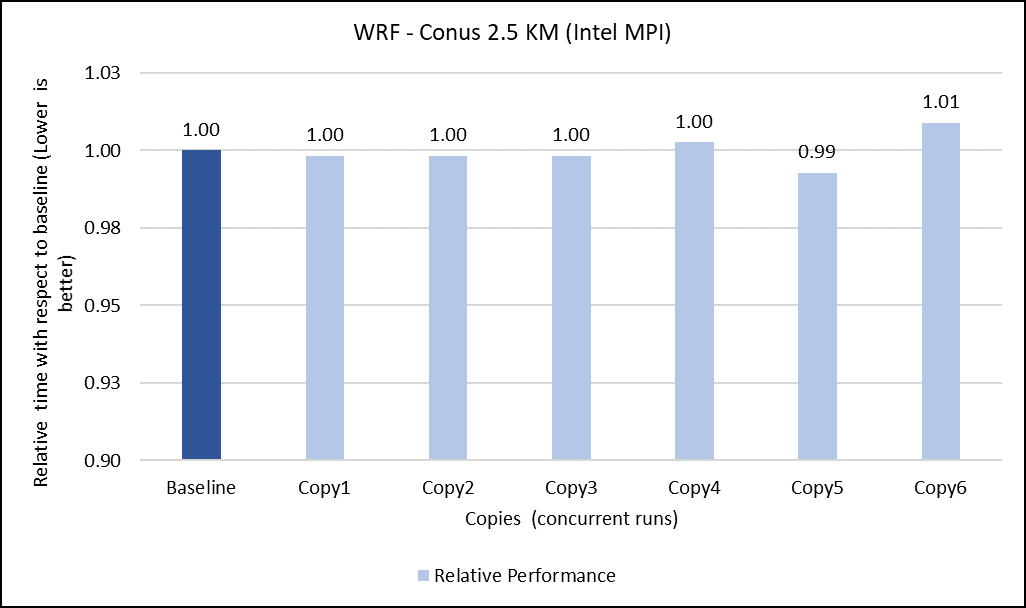
Figure 6: Concurrency Test 1 for WRF

Figure 7: Concurrency Test 2 for WRF
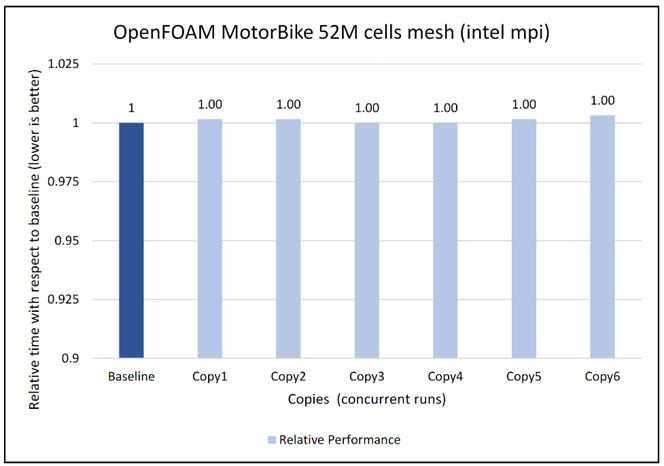
Figure 8: Concurrency Test 1 for Open FOAM
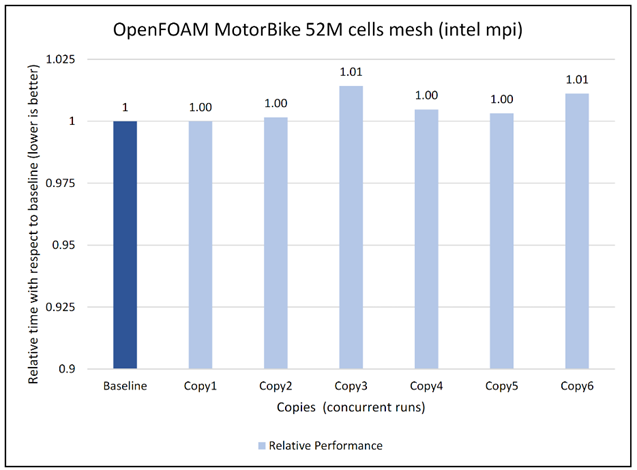
Figure 9: Concurrency Test 2 for Open FOAM
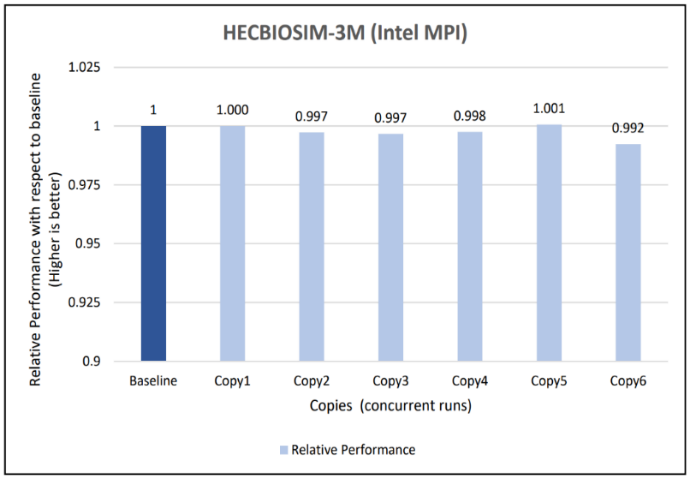
Figure 10: Concurrency Test 1 for GROMACS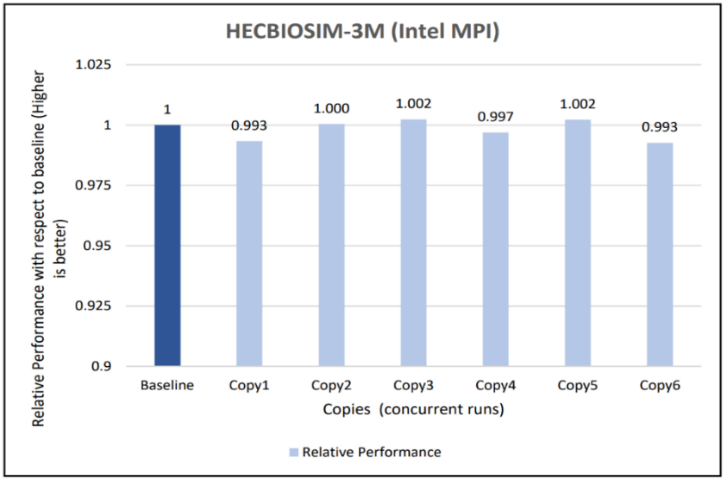
Figure 11: Concurrency Test 2 for GROMACS
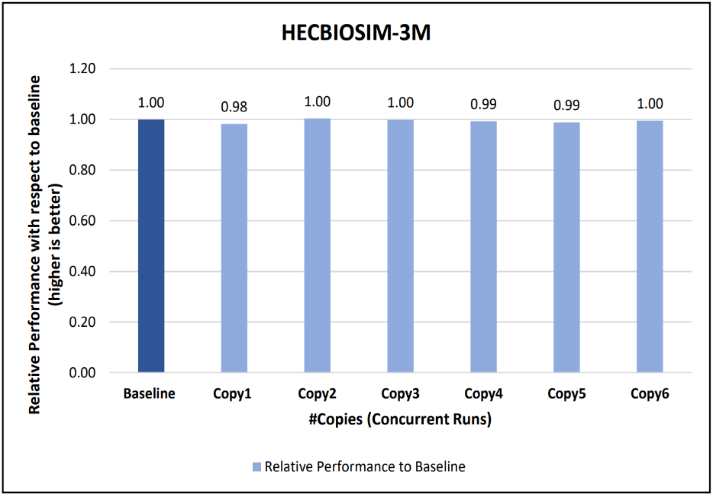
Figure 12: Concurrency Test 1 for LAMMPS 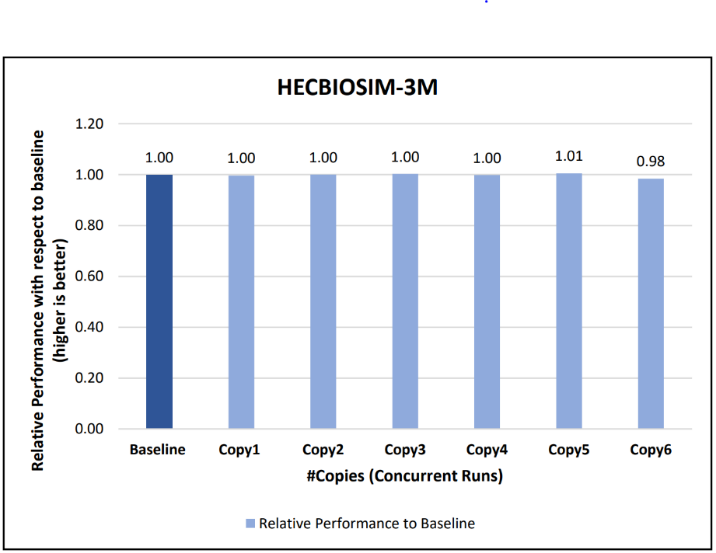
Figure 13: Concurrency Test 2 for LAMMPS
Another set of concurrency tests was conducted by running different applications (WRF, GROMACS, and Open FOAM) simultaneously in the virtual environment. In this test, two eight-node copies of each application run concurrently across the virtual cluster to determine if any performance variation occurs while running multiple parallel applications in the virtual nodes. There is no performance degradation observed in this scenario also, when compared to the individual application baseline run with no other workload running on the cluster.
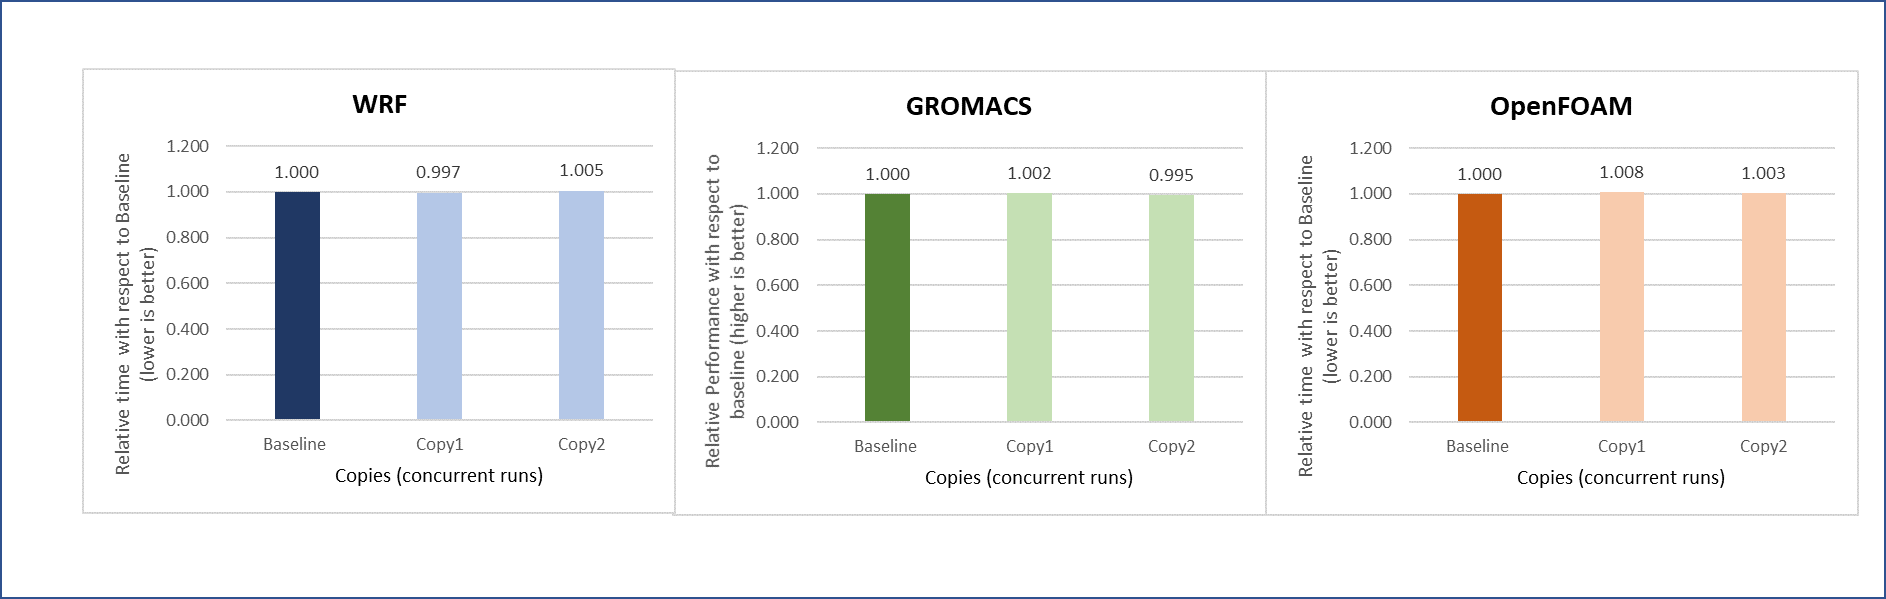
Figure 14: Concurrency test with multiple applications running in parallel
Intel Select Solution certification
In addition to the benchmark testing, this system has been certified as an Intel® Select Solution for Simulation and Modeling. Intel Select Solutions are workload-optimized configurations that Intel benchmark-tests and verifies for performance and reliability. These solutions can be deployed easily on premises and in the cloud, providing predictability and scalability.
All Intel Select Solutions are a tailored combination of Intel data center compute, memory, storage, and network technologies that deliver predictable, trusted, and compelling performance. Each solution offers assurance that the workload will work as expected, if not better. These solutions can save individual businesses from investing the resources that might otherwise be used to evaluate, select, and purchase the hardware components to gain that assurance themselves.
The Dell HPC On Demand solution is one of a select group of prevalidated, tested solutions that combine third-generation Intel® Xeon® Scalable processors and other Intel technologies into a proven architecture. These certified solutions can reduce the time and cost of building an HPC cluster, lowering hardware costs by taking advantage of a single system for both simulation and modeling workloads.
Conclusion
Running an HPC application necessitates careful consideration for achieving optimal performance. The main objective of the current study is to use appropriate tuning to bridge the performance gap between bare-metal and virtual systems. With the right settings on the tested HPC applications (see Overview), the performance difference between virtual and bare-metal nodes for the 32 node tests is less than 10%. It is therefore possible to successfully run different HPC workloads in a virtualized environment to leverage benefits of virtualization features. The concurrency testing helped to demonstrate that running multiple applications simultaneously in the virtual nodes does not degrade performance.
Resources
To learn more about our previous work on HPC virtualization on Cascade Lake, see the Performance study of a VMware vSphere 7 virtualized HPC cluster.
Acknowledgments
The authors thank Savitha Pareek from Dell Technologies, Yuankun Fu from VMware, Steven Pritchett, and Jonathan Sommers from R Systems for their contribution in the study.
Related Blog Posts

Performance study of a VMware vSphere 7 virtualized HPC cluster
Mon, 28 Mar 2022 16:35:13 -0000
|Read Time: 0 minutes
High Performance Computing (HPC) involves processing complex scientific and engineering problems at a high speed across a cluster of compute nodes. Performance is one of the most important features of HPC. While most HPC applications are run on bare metal servers, there has been a growing interest to run HPC applications in virtual environments. In addition to providing resiliency and redundancy for the virtual nodes, virtualization offers the flexibility to quickly instantiate a secure virtual HPC cluster.
Most people tend to run their HPC workloads on dedicated hardware, which is often composed of server compute nodes that are interconnected by high-speed networks to maximize their performance. Alternatively, virtualization abstracts the underlying hardware and adds a software layer that emulates this hardware. With this in mind, the engineers at the Dell Technologies HPC & AI Innovation Lab and VMware conducted a performance study to compare the performance of running and scaling HPC workloads on dedicated bare metal nodes to a vSphere 7-based virtualized infrastructure. The team also tuned the physical and virtual infrastructure to achieve optimal virtual performance and share these findings and recommendations.
Performance test details
Our team evaluated tightly coupled HPC applications or message passing interface (MPI) based workloads and observed promising results. These applications consist of parallel processes (MPI ranks) that leverage multiple cores and are architected to scale computation to multiple compute servers (or VMs) to solve the complex mathematical model or scientific simulation in a timely manner. Examples of tightly coupled HPC workloads include computational fluid dynamics (CFD) used to model airflow in automotive and airplane designs, weather research and forecasting models for predicting the weather, and reservoir simulation code for oil discovery.
To evaluate the performance of these tightly coupled HPC applications, we built 16-node HPC cluster using Dell PowerEdge R640 vSAN Ready nodes. Dell Power Edge R640 is a 1U dual socket server with Intel® Xeon® Scalable processors. The same cluster was configured as both a bare metal HPC cluster and as a virtual cluster running VMware vSphere.
Figure 1 shows a representative network topology of this cluster. The cluster was connected to two separate physical networks. We used the following components for this cluster:
- Dell PowerSwitch Z9332 switch connecting NVIDIA® Connect®-X6 100 GbE adapters to provide a low latency high bandwidth 100 GbE RDMA-based HPC network for the MPI-based HPC workload
- a separate pair of Dell PowerSwitch S5248 25 GbE based top of rack (ToR) switches for hypervisor management, VM access and VMware vSAN networks for the virtual cluster
The VM switches provided redundancy and were connected by a virtual link trucking interconnect (VLTi). A VMware vSAN cluster was created to host the VMDKs for the virtual machines. To maximize CPU utilization RDMA, we also leveraged support for vSAN. This provides direct memory access between the nodes participating in the vSAN cluster without involving the operating system or the CPU. RDMA offers low latency, high throughput, and high IOPs that are more difficult to achieve with traditional TCP-based networks. It also enables the HPC workloads to consume more CPU for their work without impacting the vSAN performance.
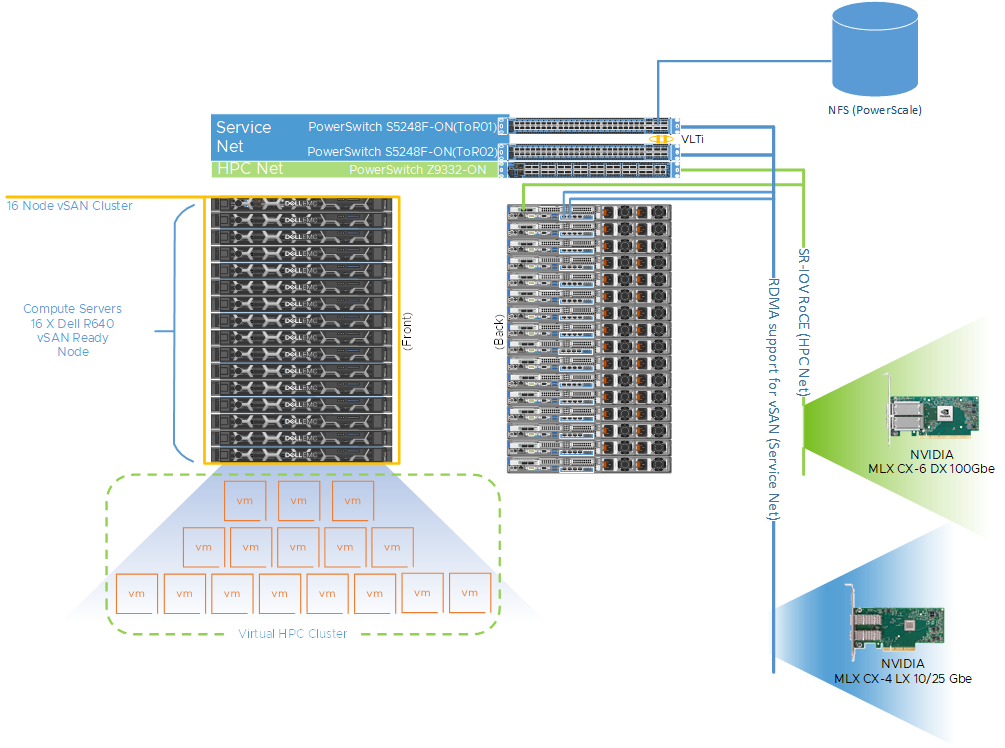
Figure 1: A 16-Node HPC cluster test bed
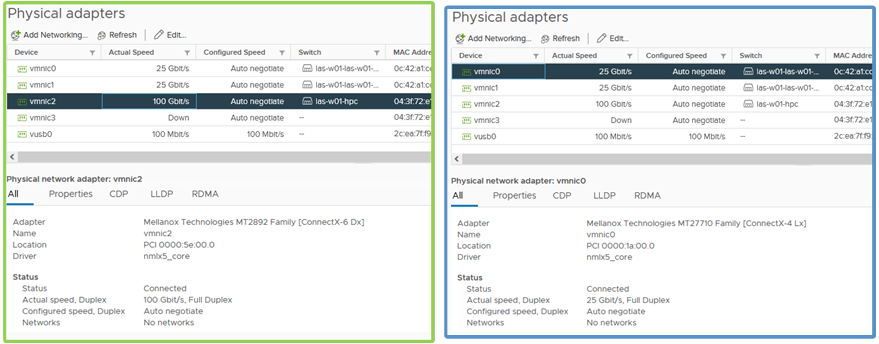
Figure 2: Physical adapter configuration for HPC network and service network
Table 1 describes the configuration details of the physical nodes and the network connectivity. For the virtual cluster, a single VM per node was provisioned for a total of 16 VMs or virtual compute nodes. Each VM was configured with 44 vCPU and 144 GB of memory, and the VM CPU and memory reservation were enabled and we set the VM latency sensitivity to high. Figure 1 also provides an example of how the hosts are cabled to each fabric. One port from each host is connected to the NVIDIA Mellanox ConnectX-6 adapter and to the Dell PowerSwitch Z9332 for the HPC network fabric. For the service network fabric, two ports are connected from the NVIDIA Mellanox ConnectX-4 adapter to the Dell PowerSwitch S5248 ToR switches.
Table 1: Configuration details for the bare metal and virtual clusters
Environment | Bare Metal | Virtual |
Server | PowerEdge R640 vSAN Ready Node | |
Processor | 2 x Intel Xeon 2nd Generation 6240R | |
Cores | All 48 cores used | 44 vCPU used |
Memory | 12 x 16GB @3200 MT/s | 144 GB reserved for the VM |
Operating System | CentOS 8.3 | Host OS: VMware vSphere 7.0u2 |
HPC Network NIC | 100 GbE NVIDIA Mellanox Connect-X6 | |
Service Network NIC | 10/25 GbE NVIDIA Mellanox Connect-X4 | |
HPC Network Switch | Dell PowerSwitch Z9332F-ON | |
Service Network Switch | Dell PowerSwitch S5248F-ON | |
Table 2 shows a range of different HPC applications across multiple vertical domains along with the benchmark datasets that were used for the performance comparison.
Table 2: Application and Benchmark Details
Application | Vertical Domain | Benchmark Dataset |
OpenFOAM | Manufacturing - Computational Fluid Dynamics (CFD) | |
Weather Research and Forecasting (WRF) | Weather and Environment | |
Large-scale Atomic/Molecular Massively Parallel Simulator (LAMMPS) | Molecular Dynamics | |
GROMACS | Life Sciences – Molecular Dynamics | HECBioSim Benchmarks – 3M Atoms |
Nanoscale Molecular Dynamics (NAMD) | Life Sciences – Molecular Dynamics | STMV – 1.06M Atoms |
Performance Results
Figures 3 through 7 show the performance, scalability, and difference in performance for five representative HPC applications in the CFD, weather, and science domains. Each of the applications was run to scale from 1 node through 16 nodes on a bare metal and a virtual cluster. All five applications demonstrate efficient speedup when computation is scaled out to multiple systems. The relative speedup for the application is plotted (the baseline is application performance on a bare metal single node).
The results indicate that MPI application performance running in a virtualized infrastructure (with proper tuning and following best practices for latency-sensitive applications in a virtual environment) is close to performance in a bare metal infrastructure. The single node performance delta ranges from no difference for WRF to a maximum of 8 percent difference observed with LAMMPS. Similarly, as the nodes are scaled, the performance observed on the virtual nodes is comparable to that on the bare-metal infrastructure with the largest delta being 10% when running LAMMPS on 16 nodes.
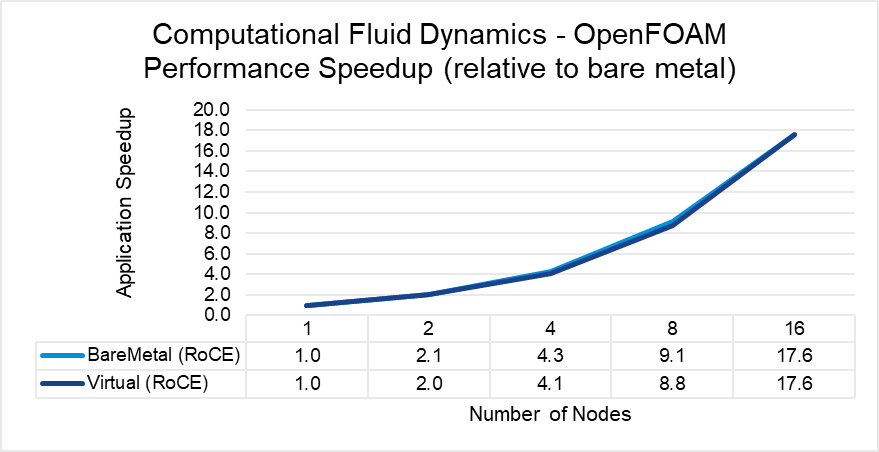
Figure 3: OpenFOAM performance comparison between virtual and bare-metal systems
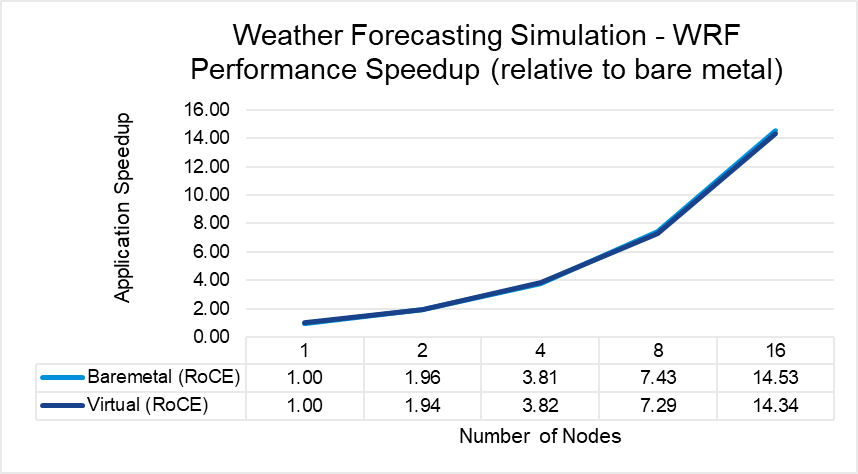
Figure 4: WRF performance comparison between virtual and bare-metal systems
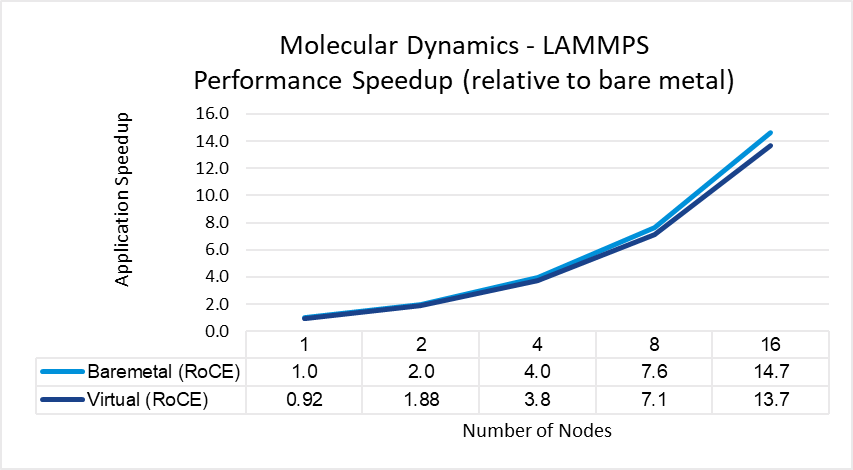
Figure 5: LAMMPS performance comparison between virtual and bare-metal systems
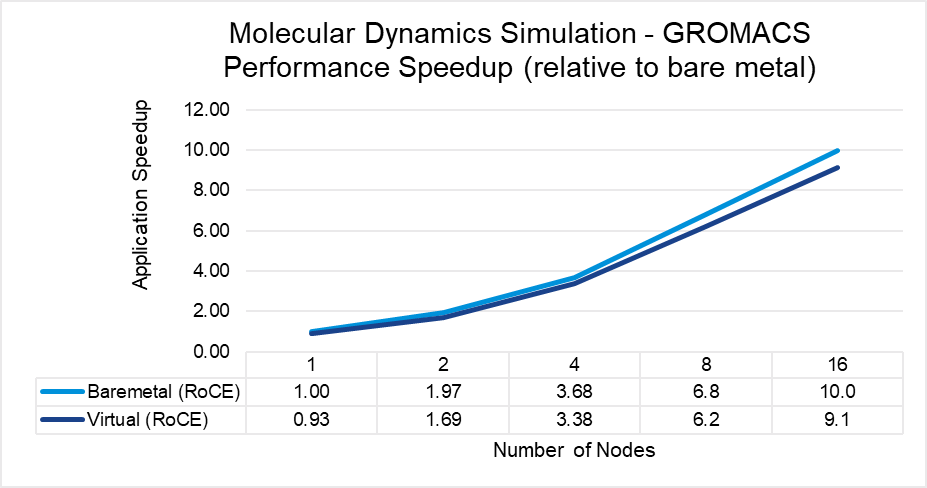
Figure 6: GROMACS performance comparison between virtual and bare-metal systems
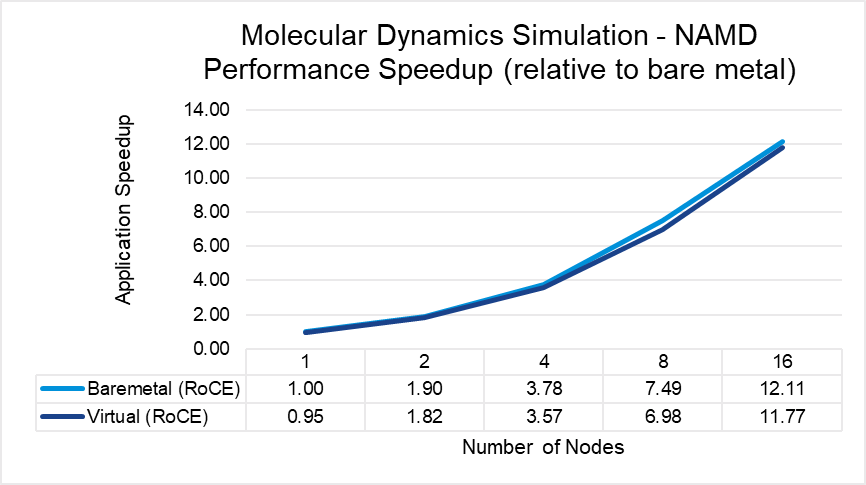
Figure 7: NAMD performance comparison between virtual and bare-metal systems
Tuning for Optimal Performance
One of the key elements of achieving a viable virtualized HPC solution is the tuning best practices that allow for optimal performance. We found a significant improvement was achieved after some minor tweaks were made from the out-of-box configuration. These improvements are a critical ingredient to ensuring customers can and will achieve results that enable not only the implementation of a virtual HPC environment, but also the adoption of a more cloud-ready eco-system that provides operational efficiencies and multi-workload support.
Table 3 outlines the parameters that we found to work best for MPI applications. Given the nature of MPI for parallel communication and its heavy reliance on a low-latency network, we suggest the implementation of the VM Latency Sensitivity setting available in vSphere 7.0. This setting allows users to optimize the scheduling delay for latency sensitive applications by 1) giving exclusive access to physical resources to reduce resource contention, 2) by-passing virtualization layers that are not providing value for these workloads, and 3) tuning virtualization layers to reduce any unnecessary overhead. We have also outlined the additional physical host and hypervisor tunings that complete these best practices below.
Table 3: Recommended performance turnings for tightly coupled HPC workloads
Settings | Value |
Physical Server |
|
BIOS Power Profile | Performance per watt (OS) |
BIOS Hyper-threading | On |
BIOS Node Interleaving | Off |
BIOS SR-IOV | On |
Hypervisor |
|
ESXi Power Policy | High Performance |
Virtual Machine |
|
VM Latency Sensitivity | High |
VM CPU Reservation | Enabled |
VM Memory Reservation | Enabled |
VM Sizing | Maximum VM size with CPU/memory reservation |
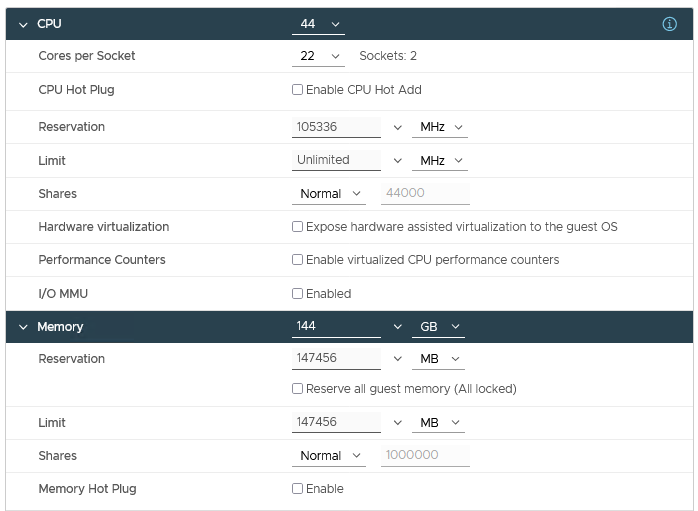
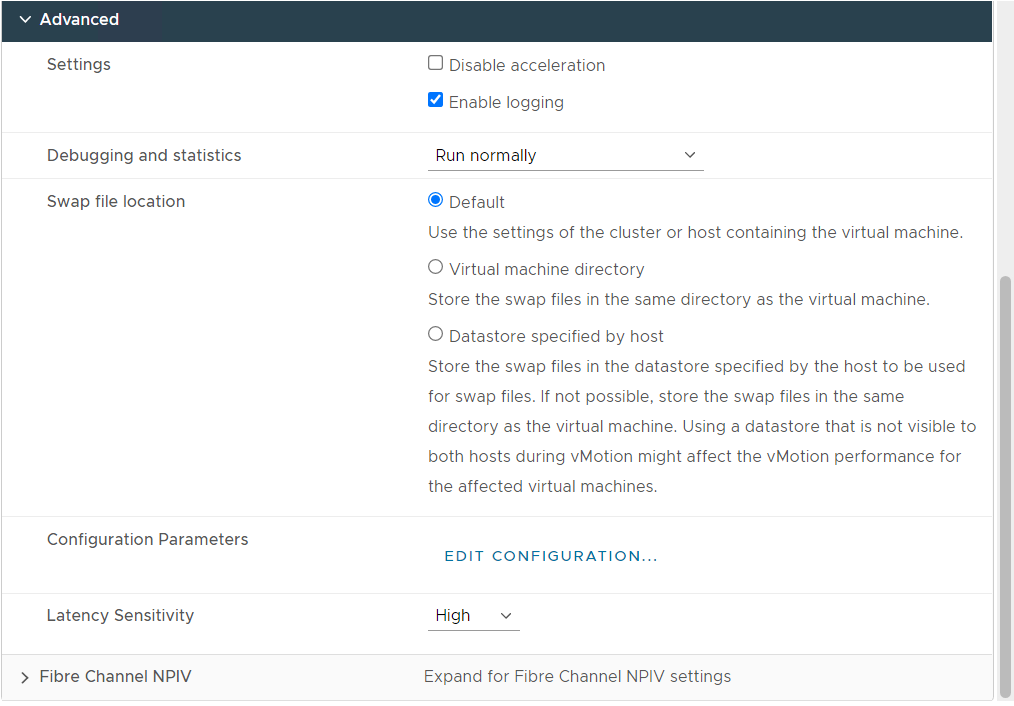
Figure 8: Virtual Machine Configuration with the recommended tuning settings
Figure 8 shows a snapshot of the recommended tuning settings as applied to the virtual machine used as the virtual nodes on the HPC cluster.
Conclusion
Achieving optimal performance is a key consideration for running an HPC application. While most HPC applications enjoy the performance benefits offered by a dedicated bare metal hardware, our results indicate that with appropriate tuning the performance gap between virtual and bare metal nodes has narrowed, making it feasible to run certain HPC applications in a virtualized environment. We also observed that these tested HPC applications demonstrate efficient speedups when computation is scaled out to multiple virtual nodes.
Additional resources
To learn more about our previous and ongoing work at the Dell Technologies HPC & AI Innovation Lab, see the High Performance Computing overview and the Dell Technologies Info Hub blog page for HPC solutions.
Acknowledgements
The authors thank Martin Hilgeman from Dell Technologies, Ramesh Radhakrishnan and Michael Cui from VMware, and Martin Feyereisen for their contribution in the study.

HPC Application Performance on Dell PowerEdge R750xa Servers with the AMD Instinct TM MI210 Accelerator
Fri, 12 Aug 2022 16:47:40 -0000
|Read Time: 0 minutes
Overview
The Dell PowerEdge R750xa server, powered by 3rd Generation Intel Xeon Scalable processors, is a 2U rack server that supports dual CPUs, with up to 32 DDR4 DIMMs at 3200 MT/s in eight channels per CPU. The PowerEdge R750xa server is designed to support up to four PCI Gen 4 accelerator cards and up to eight SAS/SATA SSD or NVMe drives.
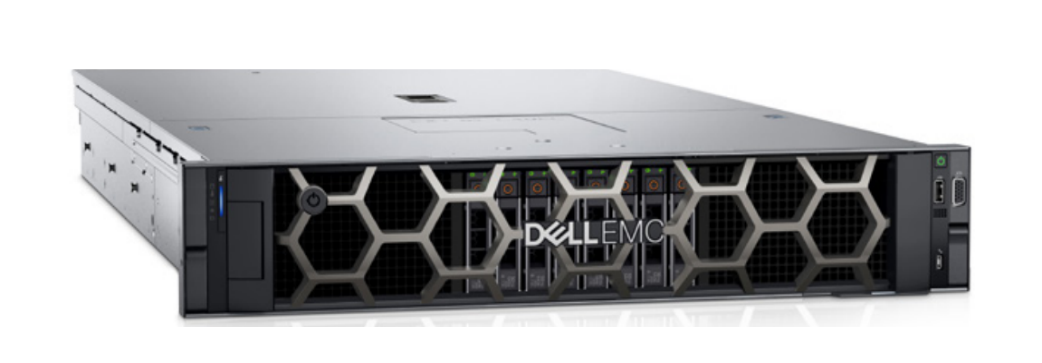
Figure 1: Front view of the PowerEdge R750xa server
The AMD Instinct™ MI210 PCIe accelerator is the latest GPU from AMD that is designed for a broad set of HPC and AI applications. It provides the following key features and technologies:
- Built with the 2nd Gen AMD CDNA architecture with new Matrix Cores delivering improvements on FP64 operations and enabling a broad range of mixed-precision capabilities
- 64 GB high-speed HBM2e memory bandwidth supporting highly data-intensive workloads
- 3rd Gen AMD Infinity Fabric™ technology bringing advanced platform connectivity and scalability enabling fully connected dual P2P GPU hives through AMD Infinity Fabric™ links
- Combined with the AMD ROCm™ 5 open software platform allowing researchers to tap the power of the AMD Instinct™ accelerator with optimized compilers, libraries, and runtime support
This blog provides the performance characteristics of a single PowerEdge R750xa server with the AMD Instinct MI210 accelerator. It compares the performance numbers of microbenchmarks (GEMM of FP64 and FP32 and bandwidth test), HPL, and LAMMPS for both the AMD Instinct MI210 accelerator and the previous generation AMD Instinct MI100 accelerator.
The following table provides configuration details for the PowerEdge R750xa system under test (SUT):
Table 1: SUT hardware and software configurations
Component | Description |
Processor | Dual Intel Xeon Gold 6338 |
Memory | 512 GB - 16 x 32 GiB@3200 MHz |
Local disk | 3.84 TB SATA-6GB SSD |
Operating system | Rocky Linux release 8.4 (Green Obsidian) |
GPU model | 4 x AMD MI210 (PCIe-64G) or 3 x AMD MI100 (PCIe-32G) |
GPU driver version | 5.13.20.5.1 |
ROCm version | 5.1.3 |
Processor Settings > Logical Processors | Disabled |
System profiles | Performance |
5.1.3 | |
5.1.3 | |
HPL | Compiled with ROCm v5.1.3 |
LAMMPS (KOKKOS) | Version: LAMMPS patch_4May2022 |
The following table provides the specifications of the AMD Instinct MI210 and MI100 GPUs:
Table 2: AMD Instinct MI100 and MI210 PCIe GPU specifications
GPU architecture | AMD Instinct MI210 | AMD Instinct MI100 |
Peak Engine Clock (MHz) | 1700 | 1502 |
Stream processors | 6656 | 7680 |
Peak FP64 (TFlops) | 22.63 | 11.5 |
Peak FP64 Tensor DGEMM (TFlops) | 45.25 | 11.5 |
Peak FP32 (TFlops) | 22.63 | 23.1 |
Peak FP32 Tensor SGEMM (TFlops) | 45.25 | 46.1 |
Memory size (GB) | 64 | 32 |
Memory Type | HBM2e | HBM2 |
Peak Memory Bandwidth (GB/s) | 1638 | 1228 |
Memory ECC support | Yes | Yes |
TDP (Watt) | 300 | 300 |
GEMM microbenchmarks
Generic Matrix-Matrix Multiplication (GEMM) is a multithreaded dense matrix multiplication benchmark that is used to measure the performance of a single GPU. The unique O(n3) computational complexity compared to the O(n2) memory requirement of GEMM makes it an ideal benchmark to measure GPU acceleration with high efficiency because achieving high efficiency depends on minimizing the redundant memory access.
For this test, we complied the rocblas-bench binary from https://github.com/ROCmSoftwarePlatform/rocBLAS to collect DGEMM (double-precision) and SGEMM (single-precision) performance numbers.
These results only reflect the performance of matrix multiplication, and results are measured in the form of peak TFLOPS that the accelerator can deliver. These numbers can be used to compare the peak compute performance capabilities of different accelerators. However, they might not represent real-world application performance.
Figure 2 presents the performance results measured for DGEMM and SGEMM on a single GPU:
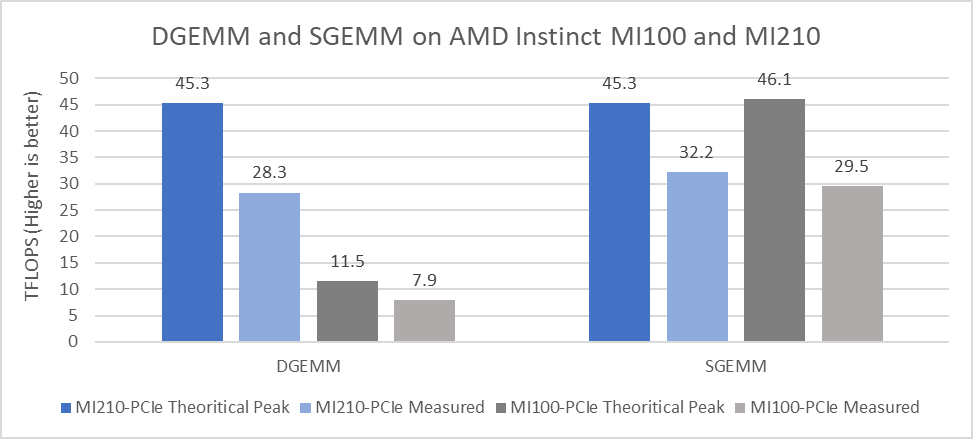
Figure 2: DGEMM and SGEMM numbers obtained on AMD Instinct MI210 and MI100 GPUs with the PowerEdge R750xa server
From the results we observed:
- The CDNA 2 architecture from AMD, which includes second-generation Matrix Cores and faster memory, provides significant improvement in the theoretical peak FP64 Tensor DGEMM value (45.3 TFLOPS). This result is 3.94 times better than the previous generation AMD Instinct MI100 GPU peak of 11.5 TFLOPS. The measured DGEMM value on the AMD Instinct MI250 GPU is 28.3 TFlops, which is 3.58 times better compared to the measured value of 7.9 TFlops on the AMD Instinct MI100 GPU.
- For FP32 Tensor operations in the SGEMM single-precision GEMM benchmark, the theoretical peak performance of the AMD Instinct MI210 GPU is 45.23 TFLOPS, and the measured performance value is 32.2 TFLOPS. An improvement of approximately nine percent was observed in the measured value of SGEMM compared to the AMD Instinct MI100 GPU.
GPU-to-GPU bandwidth test
This test captures the performance characteristics of buffer copying and kernel read/write operations. We collected results by using TransferBench, compiling the binary by following the procedure provided at https://github.com/ROCmSoftwarePlatform/rccl/tree/develop/tools/TransferBench. On the PowerEdge R750xa server, both the AMD Instinct MI100 and MI210 GPUs have the same GPU-to-GPU throughput, as shown in the following figure:
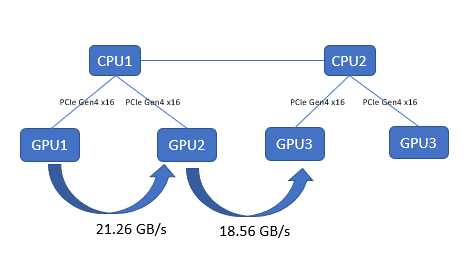
Figure 3: GPU-to-GPU bandwidth test with TransferBench on the PowerEdge R750xa server with AMD Instinct MI210 GPUs
High-Performance Linpack (HPL) Benchmark
HPL measures a system’s floating point computing power by solving a random system of linear equations in double precision (FP64) arithmetic. The peak FLOPS (Rpeak) is the highest number of floating-point operations that a computer can perform per second in theory.
It can be calculated using the following formula:
clock speed of the GPU × number of GPU cores × number of floating-point operations that the GPU performs per cycle
Measured performance is referred to as Rmax. The ratio of Rmax to Rpeak demonstrates the HPL efficiency, which is how close the measured performance is to the theoretical peak. Several factors influence efficiency including GPU core clock speed boost and the efficiency of the software libraries.
The results shown in the following figure are the Rmax values, which are measured HPL numbers on AMD Instinct MI210 and AMD MI100 GPUs. The HPL binary used to collect the result was compiled with ROCm 5.1.3.
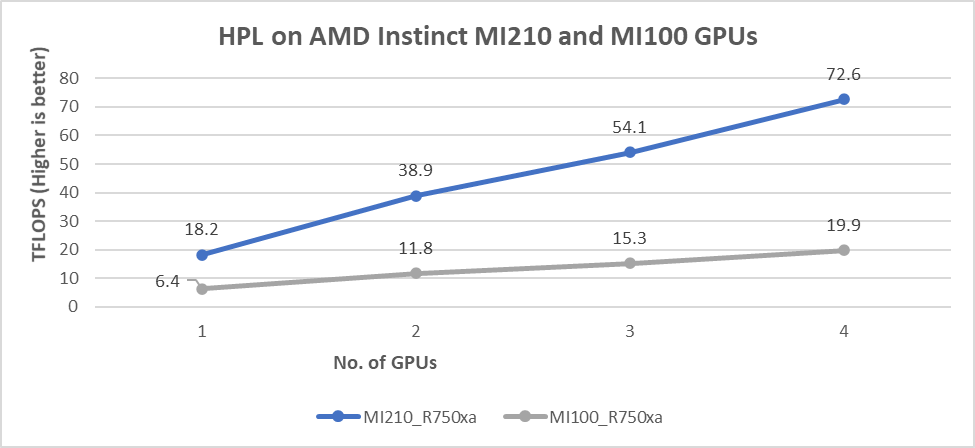
Figure 4: HPL performance on AMD Instinct MI210 and MI100 GPUs powered with R750xa servers
The following figure shows the power consumption during a single HPL test :
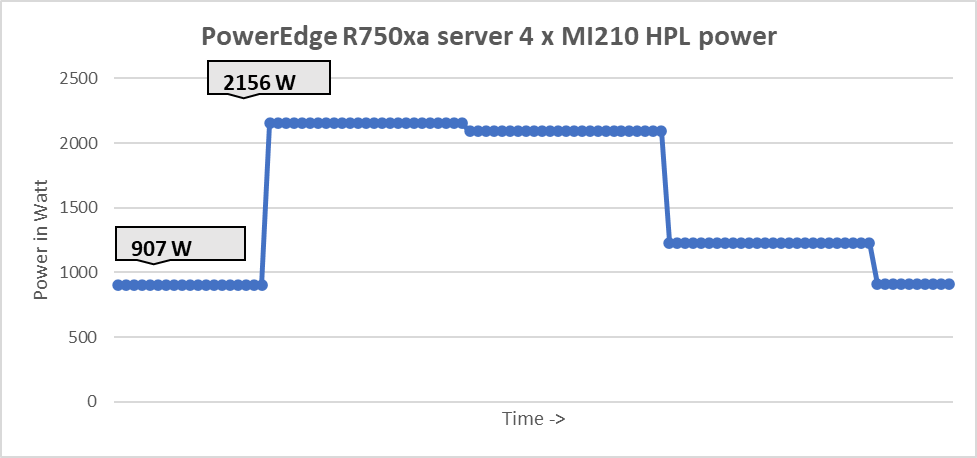
Figure 5: System power use during one HPL test across four GPUs
Our observations include:
- We observed a significant improvement in the HPL performance with the AMD Instinct MI210 GPU over the AMD Instinct MI100 GPU. The performance on a single test of the AMD Instinct MI210 GPU is 18.2 TFLOPS, which is over 2.8 times higher than the AMD Instinct MI100 number of 6.4 TFLOPS. This improvement is a result of the AMD CDNA2 architecture on the AMD Instinct MI210 GPU, which has been optimized for FP64 matrix and vector workloads.
- As shown in Figure 4, the AMD Instinct MI210 GPU provides almost linear scalability in the HPL values on single node multi-GPU runs. The AMD Instinct MI210 GPU shows better scalability compared to the previous generation AMD Instinct MI100 GPUs.
- Both AMD Instinct MI100 and MI210 GPUs have the same TDP of 300 W, with the AMD Instinct MI210 GPU delivering a 3.6 times better performance. The performance per watt value from a PowerEdge R750xa server is 3.6 times more.
LAMMPS Benchmark
LAMMPS is a molecular dynamics simulation code that is a GPU bandwidth-bounded application. We used the KOKKOS acceleration library implementation of LAMMPS to measure the performance of AMD Instinct MI210 GPUs.
The following figure compares the LAMMPS performance of the AMD Instinct MI210 and MI100 GPU with four different datasets:
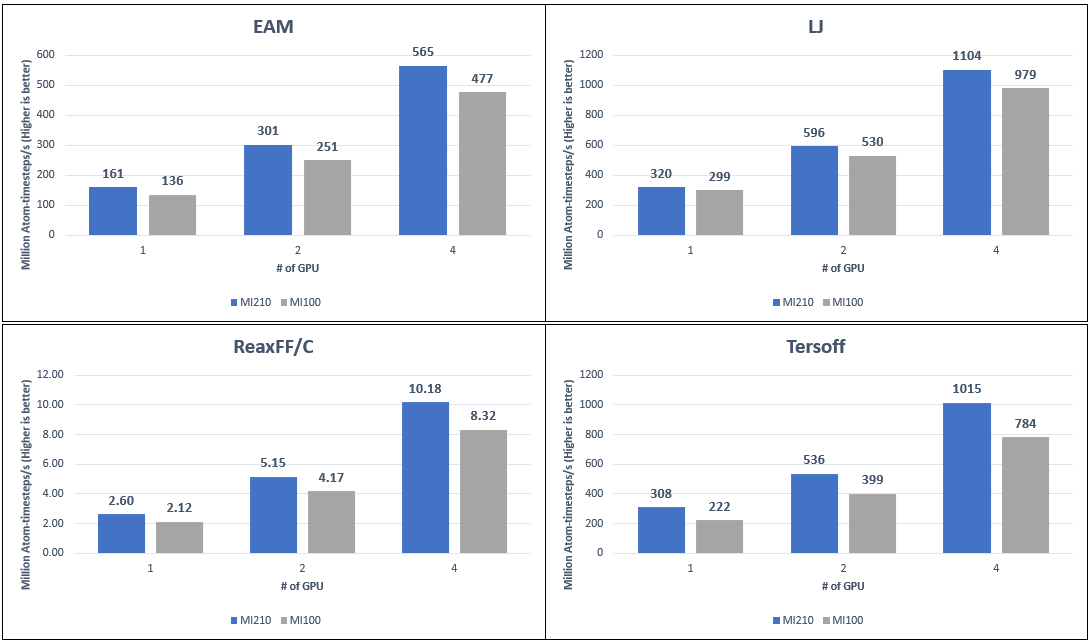
Figure 6: LAMMPS performance numbers on AMD Instinct MI210 and MI100 GPUs on PowerEdge R750xa servers with different datasets
Our observations include:
- We measure to an average 21 percent performance improvement on the AMD Instinct MI210 GPU compared to the AMD Instinct MI100 GPU with the PowerEdge R750xa server. Because MI100 and MI210 GPUs have different sizes of onboard GPU memory, the problem sizes of each LAMMPS dataset were adjusted to represent the best performance from each GPU.
- Datasets such as Tersoff, ReaxFF/C, and EAM on the AMD Instinct MI210 GPU show a 30 percent, 22 percent, and 18 percent improvement. This result is primarily because the AMD Instinct MI210 GPU comes with faster and larger memory HBM2e (64 GB) compared to the AMD Instinct MI100 GPU, which comes with HBM2 (32 GB) memory. For the LJ datasets, the improvement is less, but is still observed at 12 percent. This result is because single-precision calculations are used and the FP32 peak performance for the AMD Instinct MI210 and MI100 GPUs are at the same level.
Conclusion
The AMD Instinct MI210 GPU shows impressive performance improvement in FP64 workloads. These workloads benefit as AMD has doubled the width of their ALUs to a full 64 bits wide allowing FP64 operations to now run at full speed in the new CDNA 2 architecture. Applications and workloads that can take advantage of FP64 operations are expected to make the most of the aspect of the AMD Instinct MI210 GPU. The faster bandwidth of the HBM2e memory of the AMD Instinct MI210 GPU provides advantages for GPU memory-bounded applications.
The PowerEdge R750xa server with AMD Instinct MI210 GPUs is a powerful compute engine, which is well suited for HPC users who need accelerated compute solutions.
Next steps
In future work, we plan to describe benchmark results on additional HPC and deep learning applications, compare the AMD Infinity FabricTM Link(xGMI) bridges, and show AMD Instinct MI210 performance numbers on other Dell PowerEdge servers, such as the PowerEdge R7525 server.