


Dell PowerEdge R760 Delivers Record Breaking VMmark Results Using Intel® 5th Gen CPUs
Download PDFWed, 01 May 2024 15:49:37 -0000
|Read Time: 0 minutes
Overview
This Direct from Development (DfD) demonstrates VM deployment capability for virtualized environments using VMmark, a benchmark that measures the performance and scalability of virtualization platforms. The testing was done in Dell Performance Labs for PowerEdge R760 for 2-node systems, showing generational improvement over the previous generation. The testing was performed on a 4-node R760 SAN cluster. This 4-node score is the highest 4-node score achieved on VMmark 3.0 with Intel and the second highest overall VMmark 3 score. This 4-node score is also the highest VMmark 3.1.1 score and secured the second position in the “Top Overall Score” category in the VMmark 3.1.1 results using Intel 5th Generation Xeon® Processors. (Platinum 8592+). This testing was conducted in Dell Technologies Labs in February-March 2024.
Benchmarking overview: VMmark
The first version of VMmark was launched in 2007 as a single-host benchmark when organizations were in their infancy in terms of their virtualization maturity. VMmark 3.1.1, released in 2020, is the current release of the benchmark.
VMmark uses a unique tile-based implementation in which each “tile” consists of a collection of virtual machines running a set of diverse workloads. This tile-based approach is common across all versions of the VMmark benchmark. Since the initial release of VMmark, virtualization has become the norm for applications, and these applications have evolved. The workloads that are run in the VMmark tiles have also evolved to provide the closest to real-world metrics for users to assess their virtual environments.
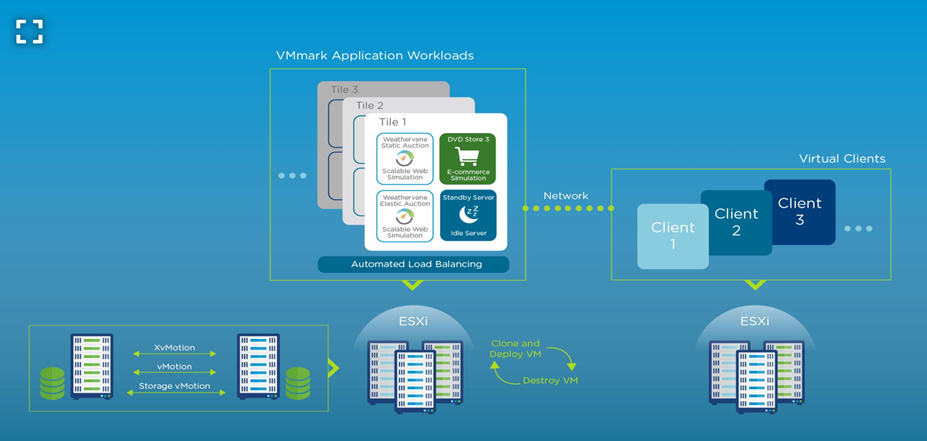
Figure 1. A web-scale multi-server virtualization platform benchmark
Solution architecture
For the purpose of generational testing, we tested Dell PowerEdge R750 powered by 3rd Gen Intel Processors and then compared it with Dell PowerEdge R760 powered by 4th Gen and 5th Gen Xeon Scalable processors respectively.
This solution includes the following components:
Component | Details | ||
SUTs | 2 x Dell PowerEdge R750 | 2 x Dell PowerEdge R760 | 2 x Dell PowerEdge R760 |
CPU | Intel Xeon Platinum 8380 Processor (Ice Lake) | Intel Xeon Platinum 8480+ Processor (Sapphire Rapids) | Intel Xeon Platinum 8592+ Processor (Emarald Rapids) |
Clients | 3 x Dell PowerEdge R740xd | 3 x Dell PowerEdge R740xd | 4 x Dell PowerEdge R7625 |
Storage | FC SAN used for Infrastructure Operations | FC SAN used for Infrastructure Operations | FC SAN used for Infrastructure Operations |
Network | Dell Z9432F-ON switch with Mellanox ConnectX-5 EN 25GbE Dual Port SFP28 Adapter | Dell Z9432F-ON switch with Intel Ethernet 100GbE 2P E810-C QSFP28 Adapter | Dell Z9432F-ON switch with Mellanox ConnectX-6 Dx Dual Port 100GbE QSFP56 Adapter |
OS | VMware ESXi 7.0 U2, Build 17630552 | VMware ESXi 8.0 GA, Build 20513097 | VMware ESXi 8.0 Update 2, Build 22380479 |
The metrics of the application workloads within each tile are computed and aggregated into a score for that tile. This aggregation is performed by first normalizing the different performance metrics (such as actions/minute and operations/minute) for a reference platform. Then, a geometric mean of the normalized scores is computed as the final score for the tile. The resulting per-tile scores are then summed to create the application workload portion of the final metric. The metrics for the infrastructure workloads are aggregated separately. The final benchmark score is computed as a weighted average: 80 percent to the application workload component and 20 percent to the infrastructure workload component.
Results
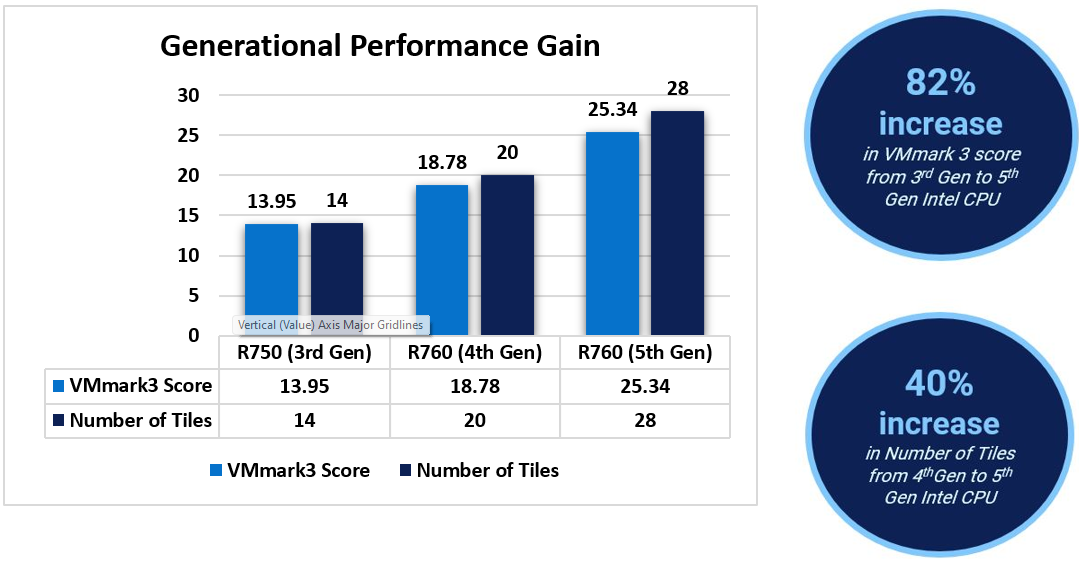
When comparing results from 3rd Gen Intel CPUs to 4th Gen and 5th Gen CPUs, we see a linear increment on the VMmark 3.1.1 score and on the Number of Tiles for each case. The percentage gain was up to 82% in the VMmark 3.1.1 score from 3rd to 5th generation. In addition, the number of tiles increased from 14 to 28, making a 2x increment in tiles from 3rd to 5th Gen CPUs[1].
World record with 4-node SAN
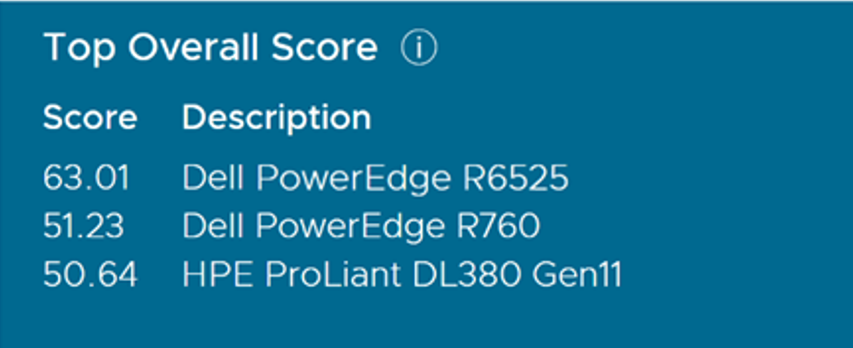
In addition to the above testing, Dell also tested the PowerEdge R760 with a 4-node SAN configuration and achieved a score of 51.23 @ 55 tiles. As of April 2, 2024, this 4-node score is the highest 4-node Intel score achieved on VMmark 3.1.1 and the 2nd highest overall VMMark 3.1.1 score.
This showcases the great performance and scalability of Dell PowerEdge R760 servers for virtualization use cases, especially when combined with high performance Dell storage. VMmark is an excellent indicator of today’s virtualized applications in the datacenter.
Component | Details |
SUTs | 4 x Dell PowerEdge R760 |
CPU | Intel Xeon Platinum 8592+ Processor (Emerald Rapids) |
Clients | 4 x Dell PowerEdge R7625 |
Storage | FC SAN used for Infrastructure Operations, using 1xConnectrix DS6620B, 32GB FC switch and Dell PowerMax 8000 |
Network | Dell Z9432F-ON switch with Mellanox ConnectX-6 Dx Dual Port 100GbE QSFP56 Adapter |
OS | VMware ESXi 8.0 Update 2, Build 22380479 |
The published results met all QoS thresholds and is compliant with VMmark 3.1.1 run and reporting rules. The following table shows the scores of the submitted test results. The results clearly showcase the Dell advantage over its competitors.
Conclusion
Virtualization is imminent for any enterprise application. Without virtualization, it is difficult to utilize the power of a modern server completely. In a virtualized environment, a software layer lets users create multiple independent VMs on a single physical server, to take full advantage of the hardware resources. vSAN-based solutions provide flexibility as you scale, reducing the initial and future cost of ownership. Add physical and virtual servers to the server pools to scale horizontally. Add virtual resources to the infrastructure to scale vertically. The PowerEdge R760 vSAN Ready Node is the recommended appliance for VDI deployments because it is leveraged for both “Density Optimized” and “Virtual Workstation” configurations. With the VMmark Score of 51.23 @ 55 tiles, different virtualization workloads can run optimally, providing a flexible solution for organizations of any size.
References
Dell Technologies documentation
The following Dell Technologies documentation provides other information related to this document. Access to these documents depends on your login credentials. If you do not have access to a document, contact your Dell Technologies representative.
VMware documentation
See the following VMware documentation.
- VMmark 3.x Results
- https://www.vmware.com/content/dam/digitalmarketing/vmware/en/pdf/vmmark/2021-06-29-DellEMC-PowerEdge-R750.pdf
- https://www.vmware.com/content/dam/digitalmarketing/vmware/en/pdf/vmmark/2023-01-17-Dell-PowerEdge-R760.pdf
- https://www.vmware.com/content/dam/digitalmarketing/vmware/en/pdf/vmmark/2024-02-20-Dell-PowerEdge-R760.pdf
[1] Based on the testing conducted in Dell Technologies Lab by Solutions and Performance Analysis team in February 2024.
Related Documents

Dell POC for Scalable and Heterogeneous Gen-AI Platform
Fri, 08 Mar 2024 18:35:58 -0000
|Read Time: 0 minutes

Introduction
As part of Dell’s ongoing efforts to help make industry leading AI workflows available to their clients, this paper outlines a scalable AI concept that can utilize heterogeneous hardware components. The featured Proof of Concept (PoC) showcases a Generative AI Large Language Model (LLM) in active production, capable of functioning across diverse hardware systems.
Currently, most AI offerings are highly customized and designed to operate with specific hardware, either a particular vendor's CPUs or a specialized hardware accelerator such as a GPU. Although the operational stacks in use vary across different operational environments, they maintain a core similarity and adapt to each specific hardware requirement.
Today, the conversation around Generative-AI LLMs often revolves around their training and the methods for enhancing their capabilities. However, the true value of AI comes to light when we deploy it in production. This PoC focuses on the application of generative AI models to generate useful results. Here, the term 'inferencing' is used to describe the process of extracting results from an AI application.
As companies transition AI projects from research to production, data privacy and security emerge as crucial considerations. Utilizing corporate IT-managed equipment and AI stacks, firms ensure the necessary safeguards are in place to protect sensitive corporate data. They effectively manage and control their AI applications, including security and data privacy, by deploying AI applications on industry-standard Dell servers within privately managed facilities.
Multiple PoC examples on Dell PowerEdge hardware, offering support for both Intel and AMD CPUs, as well as Nvidia and AMD GPU accelerators. These configurations showcase a broad range of performance options for production inferencing deployments. Following our previous Dell AI Proof of Concept,[1] which examined the use of distributed fine-tuning to personalize an AI application, this PoC can serve as the subsequent step, transforming a trained model into one that is ready for production use.
Designed to be industry-agnostic, this PoC provides an example of how we can create a general-purpose generative AI solution that can utilize a variety of hardware options to meet specific Gen-AI application requirements.
In this Proof of Concept, we investigate the ability to perform scale-out inferencing for production and to utilize a similar inferencing software stack across heterogeneous CPU and GPU systems to accommodate different production requirements. The PoC highlights the following:
- A single CPU based system can support multiple, simultaneous, real-time sessions
- GPU augmented clusters can support hundreds of simultaneous, real-time sessions
- A common AI inferencing software architecture is used across heterogenous hardware
| Futurum Group Comment: The novel aspect of this proof of concept is the ability to operate across different hardware types, including Intel and AMD CPUs along with support for both Nvidia and AMD GPUs. By utilizing a common inferencing framework, organizations are able to choose the most appropriate hardware deployment for each application’s requirements. This unique approach helps reduce the extensive customization required by AI practitioners, while also helping IT operations to standardize on common Dell servers, storage and networking components for their production AI deployments. |
Distributed Inferencing PoC Highlights
The inferencing examples include both single node CPU only systems, multi-node CPU clusters, along with single node and clusters of GPU augmented systems. Across this range of hardware options, the resulting generative AI application provides a broad range of performance, ranging from the ability to support several interactive query and response streams on a CPU, up to the highest performing example supporting thousands of queries utilizing a 3-node cluster with GPU cards to accelerate performance.
The objective of this PoC was to evaluate the scalability of production deployments of Generative-AI LLMs on various hardware configurations. Evaluations included deployment on CPU only, as well as GPU assisted configurations. Additionally, the ability to scale inferencing by distributing the workload across multiple nodes of a cluster were investigated. Various metrics were captured in order to characterize the performance and scaling, including the total throughput rate of various solutions, the latency or delay in obtaining results, along with the utilization rates of key hardware elements.
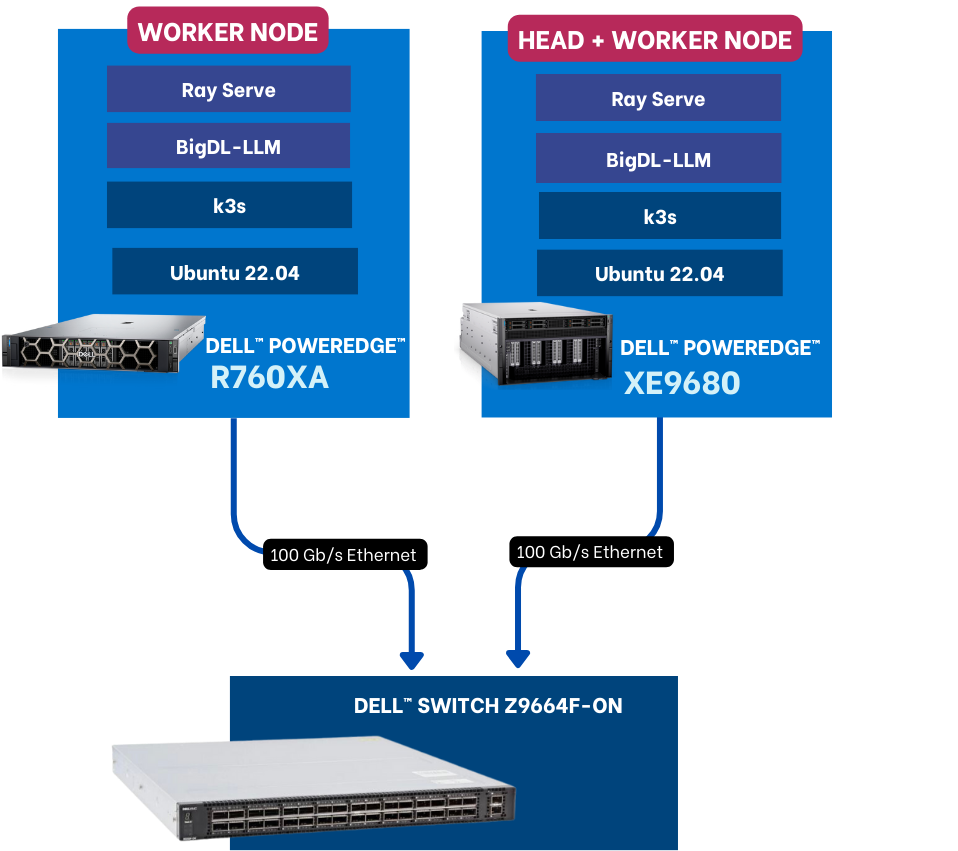
The examples included between one to three Dell PowerEdge servers with Broadcom NICs, with additional GPU acceleration provided in some cases by either AMD or Nvidia GPUs. Each cluster configuration was connected using Broadcom NICs to a Dell Ethernet switch for distributed inferencing. Each PoC uses one or more PowerEdge servers, with some examples also using GPUs. Dell PowerEdge Servers used included a Dell XE8545, a Dell XE9680 and a Dell R760XA. Each Dell PowerEdge system also included a Broadcom network interface (NIC) for all internode communications connected via a Dell PowerSwitch.
Shown in Figure 1 below is a 3-node example that includes the hardware and general software stack.
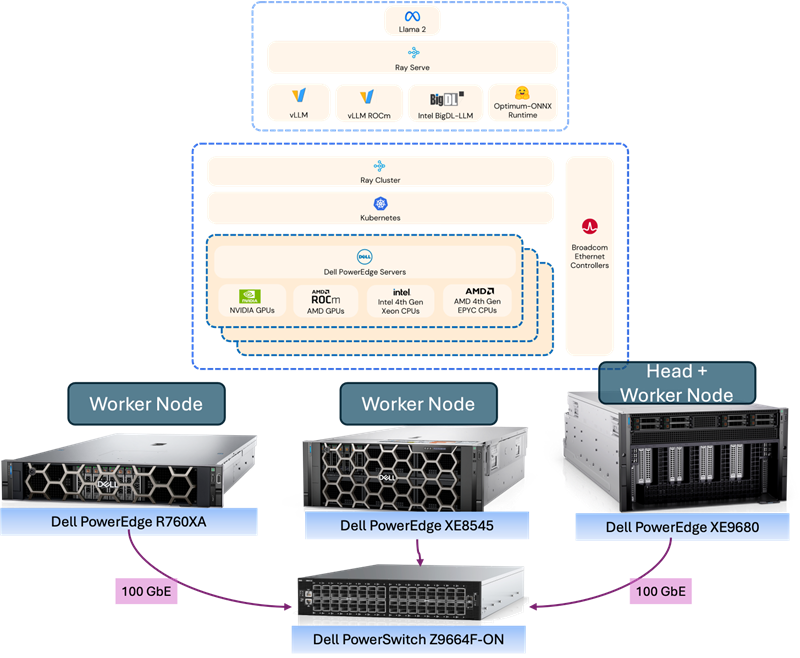
Figure 1: General, Scale-Out AI Inferencing Stack (Source: Scalers.AI)
There are several important aspects of the architecture utilized, enabling organizations to customize and deploy generative AI applications in their choice of colocation or on-premises data center. These include:
- Dell PowerEdge Sixteenth Gen Servers, with 4th generation CPUs and PCIe Gen 5 connectivity
- Broadcom NetXtreme BCM57508 NICs with up to 200 Gb/s per ethernet port
- Dell PowerSwitch Ethernet switches Z line support up to 400 Gb/s connectivity
This PoC demonstrating both heterogeneous and distributed inferencing of LLMs provides multiple advantages compared to typical inferencing solutions:
- Enhanced Scalability: Distributed inferencing enables the use of multiple nodes to scale the solution to the desired performance levels.
- Increased Throughput: By distributing the inferencing processes across multiple nodes, the overall throughput increases.
- Increased Performance: The speed of generated results may be an important consideration, by supporting both CPU and GPU inferencing, the appropriate hardware can be selected.
- Increased Efficiency: Providing a choice of using CPU or GPUs and the number of nodes enables organizations to align the solutions capabilities with their application requirements.
- Increased Reliability: With distributed inferencing, even if one node fails, the others can continue to function, ensuring that the LLM remains operational. This redundancy enhances the reliability of the system
Although each of the capabilities outlined above are related, certain considerations may be more important than others for specific deployments. Perhaps more importantly, this PoC demonstrates the ability to stand up multiple production deployments, using a consistent set of software that can support multiple deployment scenarios, ranging from a single user up to thousands of simultaneous requests. In this PoC, there are multiple hardware solution deployment examples, summarized as follows:
- CPU based inferencing using both AMD and Intel CPUs, scaled from 1 to 2 nodes
- GPU based inferencing using Nvidia and AMD GPUs, scaled from 1 to 3 nodes
For the GPU based configurations, a three node 12-GPU configuration achieved nearly 3,000 words per second in total output generation. For the scale-out configurations, inter-node communications were an important aspect of the solution. Each configuration utilized a Broadcom BCM-57508 Ethernet card enabling high-speed and low latency communications. Broadcom’s 57508 NICs allow data to be loaded directly into accelerators from storage and peers, without incurring extra CPU or memory overhead.
Futurum Group Comment: By using a scale out inferencing solution leveraging industry standard Dell servers, networking and optional GPU accelerators provides a highly adaptable reference that can be deployed as an edge solution where few inferencing sessions are required, up to enterprise deployments supporting hundreds of simultaneous inferencing outputs. |
Evaluating Solution Performance
In order to compare the performance of the different examples, it is important to understand some of the most important aspects of commonly used to measure LLM inferencing. These include the concept of a token, which typically consists of a group of characters, which are groupings of letters, with larger words comprised of multiple tokens. Currently, there is no standard token size utilized across LLM models, although each LLM typically utilizes common token sizes. Each of the PoCs utilize the same LLM and tokenizer, resulting in a common ratio of tokens to words across the examples. Another common metric is that of a request, which is essentially the input provided to the LLM and may also be called a query.
A common method of improving the overall efficiency of the system is to batch requests, or submit multiple requests simultaneously, which improves the total throughput. While batching requests increases total throughput, it comes at the cost of increasing the latency of individual requests. In practice, batch sizes and individual query response delays must be balanced to provide the response throughput and latencies that best meet a particular application’s needs.
Other factors to consider include the size of the base model utilized, typically expressed in billions of parameters, such as Mistral-7B (denoting 7 billion parameters), or in this instance, Llama2-70B, indicating that the base model utilized 70 billion parameters. Model parameter sizes are directly correlated to the necessary hardware requirements to run them.
Performance testing was performed to capture important aspects of each configuration, with the following metrics collected:
- Requests per Second (RPS): A measure of total throughput, or total requests processed per second
- Token Throughput: Designed to gauge the LLMs performance using token processing rate
- Request Latency: Reports the amount of delay (latency) for the complete response, measured in seconds, and for individual tokens, measured in milli-seconds.
- Hardware Metrics: These include CPU, GPU, Network and Memory utilization rates, which can help determine when resources are becoming overloaded, and further splitting or “sharding” of a model across additional resources is necessary.
Note: The full testing details are provided in the Appendix.
Testing evaluated the following aspects and use cases:
- Effects of scaling for interactive use cases, and batch use cases
- Scaling from 1 to 3 nodes, for GPU configurations, using 4, 8, 12 and 16 total GPUs
- Scaling from 1 to 3 nodes for CPU only configurations (using 112, 224 and 448 total CPU cores)
- For GPU configuration, the effect of moderate batch sizes (32) vs. large batching (256)
- Note: for CPU configurations, the batch size was always 1, meaning a single request per instance
We have broadly stated that two different use cases were tested, interactive and batch. An interactive use case may be considered an interactive chat agent, where a user is interacting with the inferencing results and expects to experience good performance. We subsequently define what constitutes “good performance” for an interactive user. An additional use case could be batch processing of large numbers of documents, or other scenarios where a user is not directly interacting with the inferencing application, and hence there is no requirement for “good interactive performance”.
As noted, for GPU configurations, two different batch sizes per instance were used, either 32 or 256. Interactive use of an LLM application may be uses such as chatbots, where small delays (i.e. low latency) is the primary consideration, and total throughput is a secondary consideration. Another use case is that of processing documents for analysis or summarization. In this instance, total throughput is the most important objective and the latency of any one process is inconsequential. For this case, the batch operation would be more appropriate, in order to maximize hardware utilization and total processing throughput.
Interactive Performance
For interactive performance, the rate of text generation should ideally match, or exceed the users reading or comprehension rate. Also, each additional word output should be created with relatively small delays. According to The Futurum Group’s analysis of reading rates, 200 words per minute can be considered a relatively fast rate for comprehending unseen, non-fiction text. Using this as a guideline results in a rate of 3.33 words per second.
- 200 wpm / 60 sec / minute = 3.33 words per second
Moreover, we will utilize a rate of 3.33 wps as the desired minimum generation rate for assessing the ability to meet the needs of a single interactive user. In terms of latency, 1 over 3.33, or 300 milliseconds would be considered an appropriate maximum delay threshold.
Note: For Figures 2 – 5, each utilizes two axes, the primary (left) vertical axis represents the throughput for the bars in words per second. The second (right) vertical axis represents the 95th percentile of latency results for each word generated.
In Figure 2 below, we show the total throughput of 3 different CPU configurations, along with the associated per word latency. As seen, a CPU only example can support over 40 words per second, significantly greater than the 3.33 word per second rate required for good interactive performance, while maintaining a latency of 152 ms., well under 300 ms.
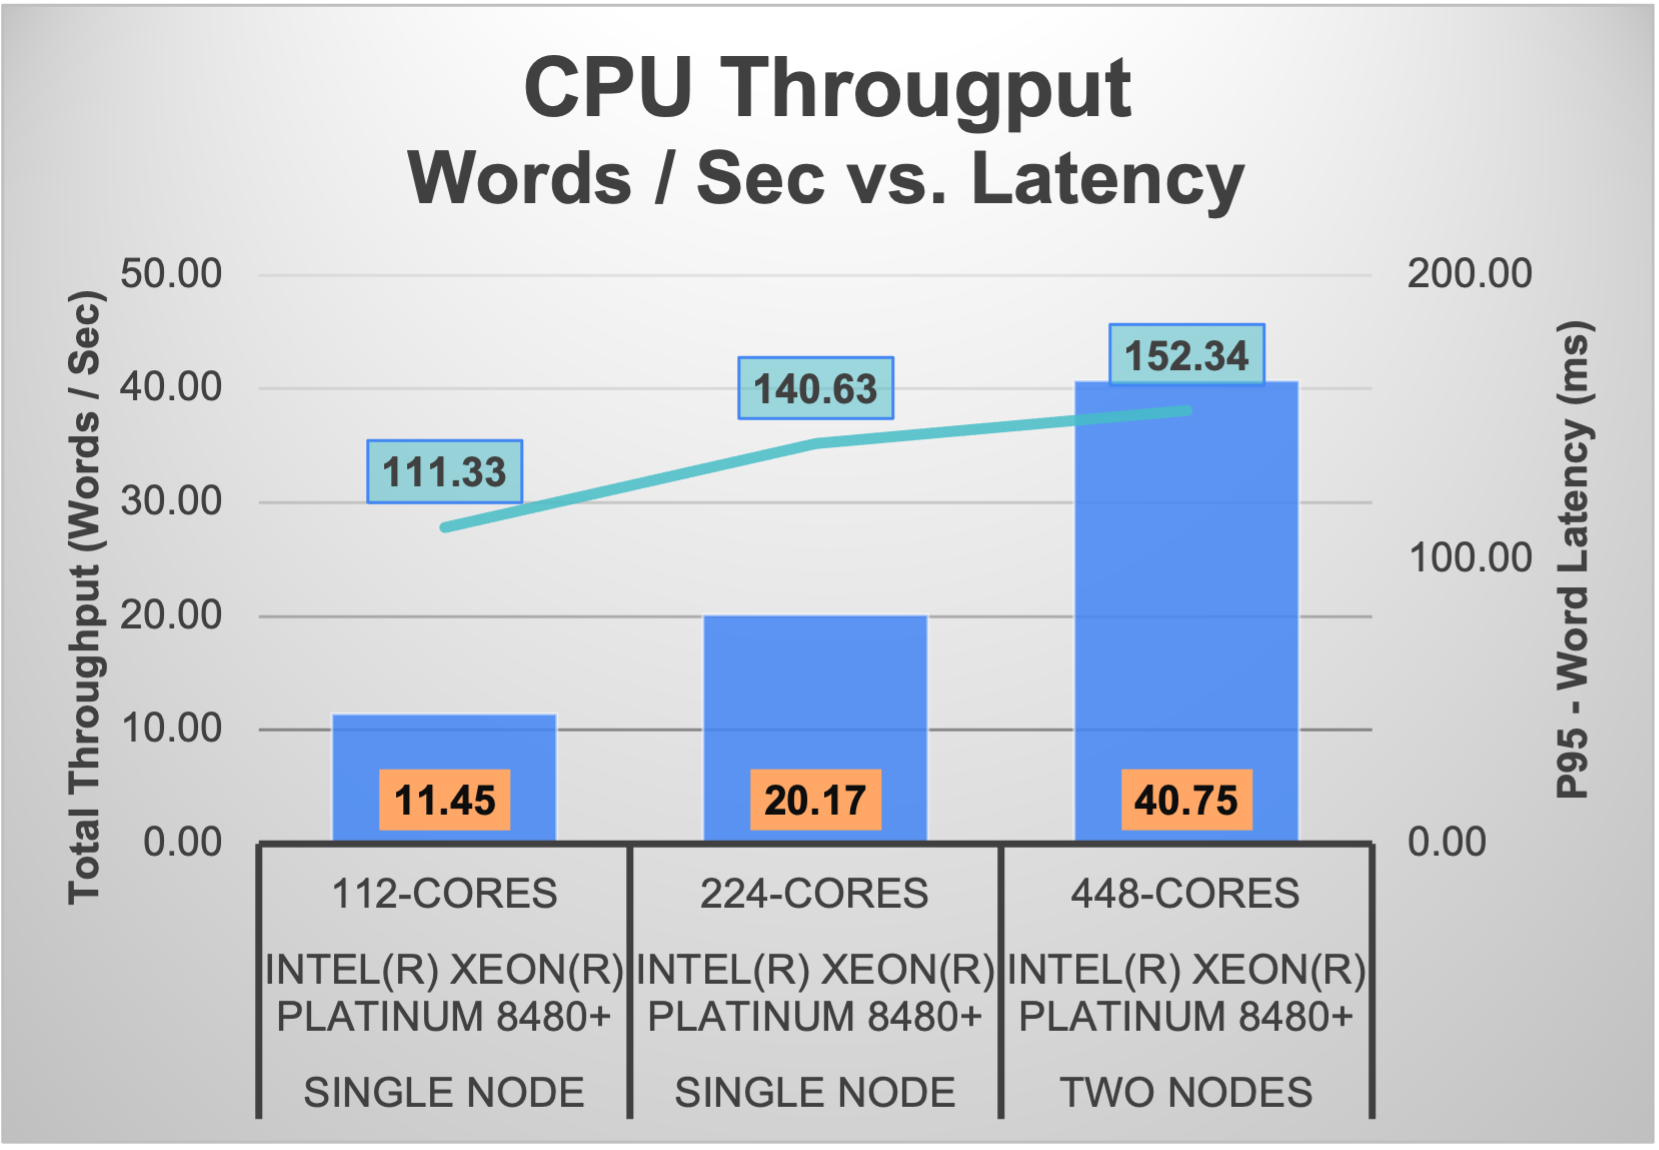
Figure 2: Interactive Inferencing Performance for CPUs (Source: Futurum Group)
Using a rate of 3.33 words / sec., we can see that two system, each with 224 CPU cores can support inferencing of up to 12 simultaneous sessions.
- Calculated as: 40 wps / 3.33 wps / session = 12 simultaneous sessions.
Futurum Group Comment: It is often expected that all generative AI applications require the use of GPUs in order to support real-time deployments. As evidenced by the testing performed, it can be seen that a single system can support multiple, simultaneous sessions, and by adding a second system, performance scales linearly, doubling from 20 words per second up to more than 40 words per second. Moreover, for smaller deployments, a single CPU based system supporting inferencing may be sufficient. |
In Figure 3 below, we show the total throughput of 4 different configurations, along with the associated per word latency. As seen, even at the rate of 1,246 words per second, latency remains at 100 ms., well below our 300 ms. threshold.

Figure 3: Interactive Inferencing Performance for GPUs (Source: Futurum Group)
Again, using 3.33 words / sec., each example can support a large number of interactive sessions:
- 1 node + 4 GPUs: 414 wps / 3.33 wps / session = 124 simultaneous sessions
- 2 nodes + 8 GPUs: 782 wps / 3.33 wps / session = 235 simultaneous sessions
- 2 nodes + 12 GPUs: 1,035 wps / 3.33 wps / session = 311 simultaneous sessions
- 3 nodes + 16 GPUs: 1,246 wps / 3.33 wps / session = 374 simultaneous sessions
Futurum Group Comment: Clearly, the GPU based results significantly exceed those of the CPU based deployment examples. In these examples, we can see that once again, performance scales well, although not quite linearly. Perhaps more importantly, as additional nodes are added, the latency does not increase above 100 ms., which is well below our established desired threshold. Additionally, the inferencing software stack was very similar to the CPU only stack, with the addition of Nvidia libraries in place of Intel CPU libraries. |
Batch Processing Performance
Inferencing of LLMs becomes memory bound as the model size increases. For larger models such as Llama2-70B, memory bandwidth, between either the CPU and main memory, or GPU and GPU memory is the primary bottleneck. By batching requests, multiple processes may be processed by the GPU or CPU without loading new data into memory, thereby improving the overall efficiency significantly.
Having an inference serving system that can operate at large batch sizes is critical for cost efficiency, and for large models like Llama2-70B the best cost/performance occurs at large batch sizes.
In Figure 4 below we show the throughput capabilities of the same hardware configuration used in Figure 3, but this time with a larger batch size of 256.

Figure 4: Batch Inferencing Performance for GPUs (Source: The Futurum Group)
For this example, we would not claim the ability to support interactive sessions. Rather the primary consideration is the total throughput rate, shown in words per second. By increasing the batch size by a factor of 4X (from 32 to 256), the total throughput more than doubles, along with a significant increase in the per word latency, making this deployment appropriate for offline, or non-interactive scenarios.
Futurum Group Comment: Utilizing the exact same inferencing software stack, and hardware deployment, we can show that for batch processing of AI, the PoC example is able to achieve rates up to nearly 3,000 words per second. |
Comparison of Batch vs. Interactive
As described previously, we utilized a total throughput rate of 200 words per minute, or 3.33 words per second, which yields a maximum delay of 300 ms per word as a level that would produce acceptable interactive performance. In Figure 4 below, we compare the throughput and associated latency of the “interactive” configuration to the “batch” configuration.

Figure 5: Comparison of Interactive vs. Batch Inferencing on GPUs (Source: The Futurum Group)
As seen above, while the total throughput, measured in words per second increases by 2.4X, the latency of individual word output slows substantially, by a factor of 6X. It should be noted that in both cases batching was utilized. The batch size of the “interactive” results was set to 32, while the batch size of the “batch” results utilized a setting of 256. The “interactive” label was applied to the lower results, due to the fact that the latency delay of 100 ms. was significantly below the threshold of 300 ms. for typical interactive use. In summary:
- Throughput increase of 2.4X (1,246 to 2,962) for total throughput, measured in words per second
- Per word delays increased 6X (100 ms. to 604 ms.) measured as latency in milli-seconds
These results highlight that total throughput can be improved, albeit at the expense of interactive performance, with individual words requiring over 600 ms (sixth tenths of a second) when the larger batch size of 256 was used. With this setting, the latency significantly exceeded the threshold of what is considered acceptable for interactive use, where a latency of 300 ms would be acceptable.
Highlights for IT Operations
While terms such as tokens per second, and token latency have relevancy to AI practitioners, these are not particularly useful terms for IT professionals or users attempting to interact with generative LLM models. Moreover, we have translated these terms into more meaningful terminology that can help IT operations correctly size the hardware requirements to match expected usage. In particular, for interactive sessions requiring a rate of 200 words per second, and maximum delay of 300 ms. per word, we can then translate a total word per second throughput, into simultaneous streams. By using a rate of 3.33 words per second as the minimum per interactive session, we can determine the number of interactive sessions supported at a certain throughput and latency levels.
Nodes | Total Cores | Words /sec. | Word. Lat. (ms) | # Sessions |
1 | 112 | 11.45 | 111 | 3.4 |
1 | 224 | 20.17 | 140 | 6.1 |
2 | 448 | 40.75 | 152 | 12.2 |
Table 1: Interactive Inferencing Sessions using CPUs (Source: The Futurum Group)
Nodes | Total GPUs | Words /sec. | Word. Lat. (ms) | # Sessions |
1 | 4 | 414 | 76 | 124 |
2 | 8 | 782 | 100 | 235 |
2 | 12 | 1035 | 100 | 310 |
3 | 16 | 1246 | 100 | 374 |
Table 2: Interactive Inferencing Sessions using GPUs (Source: The Futurum Group)
The ability to scale inferencing solutions is important, as outlined previously. Additionally, perhaps the most unique aspect of this PoC is the ability to support operating an AI inferencing stack across both CPU only and GPU enhanced hardware architectures, using an optimized inferencing stacks for each hardware type.
For environments requiring only a few simultaneous inferencing sessions, it is possible to meet these needs with CPU only deployments, even when using a larger LLM model such as Llama2-70B utilized during testing. A current Dell PowerEdge server with a 4th generation processor can support up to 3 simultaneous interactive inferencing sessions per server, with a 3-node CPU cluster able to support up to 12 simultaneous sessions, at a total rate of 40 words per second across all three systems.
Use cases that require higher throughput, or the ability to support a greater number of simultaneous inferencing sessions can utilize a single GPU based PowerEdge server with 4 GPUs, which was found to support up to 124 simultaneous interactive sessions. Scaling beyond this, a 3-node, 16 GPU system was able to support 373 simultaneous inferencing sessions at a rate of 200 words per minute, for a total throughput of 1,245 words per second.
Highlights for AI Practitioners
A key aspect of the PoC is the software stack that helps provide a platform for AI deployments, enabling scale-out infrastructure to significantly increase content creation rates. Importantly, this AI Platform as a Service architecture was built using Dell and Broadcom hardware components, coupled with cloud native components to enable containerized software platform with open licensing to reduce deployment friction and reduce cost.
At a high-level, the inferencing stack is comprised of Ray-Serve, under-pined by vLLM to improve memory utilization during inferencing, including Hugging Face Optimum libraries and ONNX. Additionally, specific libraries were used to further enhance performance, including ROCm for AMD CPUs and GPUs, BigDL for Intel CPUs and CUDA for Nvidia GPUs. Other AI frameworks include the use of PyTorch within each container, along with Kubernetes and KubeRay for distributed cluster management. Shown in Figure 5 is a high-level architecture of the inferencing stack used for all hardware deployments.
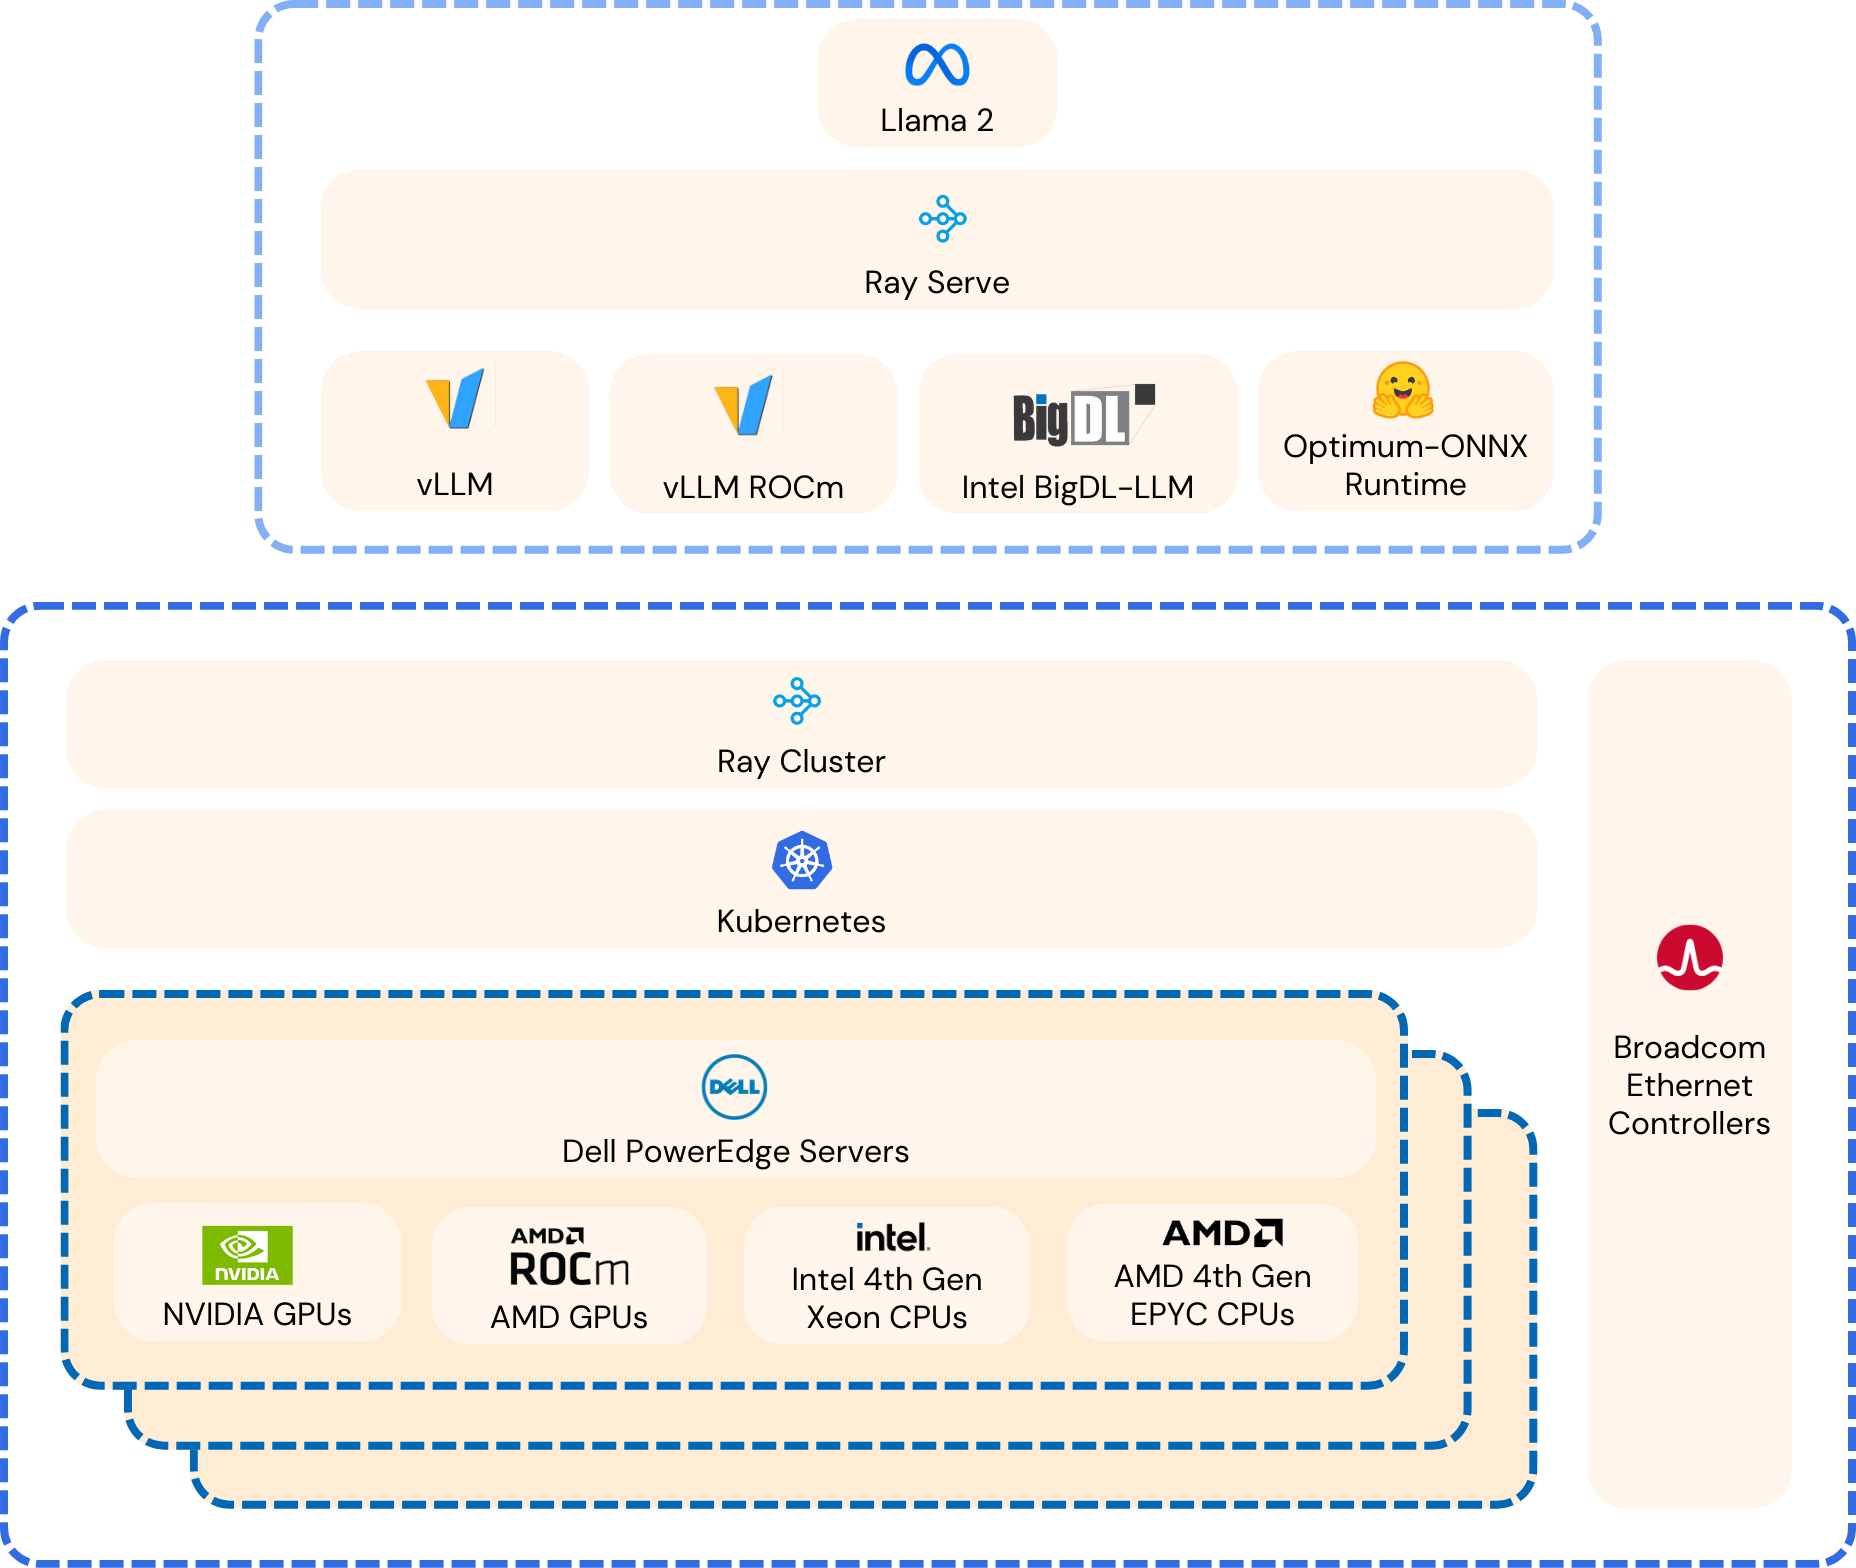
Figure 6: Distributed Inferencing Framework for Heterogeneous Hardware (Source: Scalers.AI)
Variations of the depicted inferencing framework were utilized for the four different hardware types, (AMD CPU, Intel CPU, AMD GPU and Nvidia GPU). The specifics of each of these are provided in the Appendix, in Figures A1-A4.
Note: It is important to recognize that while both Intel and AMD CPUs were verified and tested, only the Intel CPU results are presented here. This is for several reasons, including the fact that comparing CPU performance was not an objective of this PoC. If competing systems performance was provided, the focus would artificially become more about comparing CPU results than showcasing the ability to run across different CPU types. Similarly, while both AMD and Nvidia GPU inferencing was verified, only the Nvidia GPU results are presented, to maintain the focus on the PoC capabilities rather than comparing different GPU vendors performance.
Final Thoughts
As artificial intelligence, and in particular Generative-AI matures, companies are seeking ways to leverage this new technology to provide advantages for their firms, helping to improve efficiency and other measures of user satisfaction. GenAI based Large Language Models are quickly showing their ability to augment some applications focused both on empowering internal users with additional knowledge and insights, and is also becoming increasingly useful for assisting clients, via chatbots or other similar interfaces. However, organizations often have concerns about becoming tied to proprietary, or cloud-based solutions, due to their privacy concerns, lack of transparency or potential vendor lock in.
As part of Dell’s continuing efforts to democratize AI solutions, this proof-of-concept outlines specifically how organizations can build, deploy and operate production use of generative AI models using industry standard Dell servers. In particular, the scale-out PoC detailed in this paper showcases the ability to scale a solution efficiently from supporting a few simultaneous interactive users, up to a deployment supporting hundreds of simultaneous inferencing sessions simultaneously using as few as 3 Dell PowerEdge servers augmented by Nvidia GPUs. In an offline, or batch processing use, the same hardware example can support a throughput of nearly 3,000 words per second when processing multiple documents.
Critically, all the examples leverage a common AI framework, consisting of minimal K3s Kubernetes deployments, along with the Ray framework for distributed processing and vLLM to improve distributed inferencing performance. The outlined PoC utilizes the Hugging Face repository and libraries, along with hardware specific optimizations for each specific deployment of CPU or GPU type. By using a common framework, AI practitioners are better able to focus on enhancing the accuracy of the models and improved training methodologies, rather than trying to debug multiple solution stacks. Likewise, IT operations staff can utilize standard hardware, along with common IT technologies such as Kubernetes running on standard Linux distributions.
References
[1] Futurum Group Labs: Dell and Broadcom Release Scale-Out Training for Large Language Models
Appendix
Due to the fact that LLM inferencing is often memory bound, and due to the manner in which LLMs iteratively generate output, it is possible to optimize performance by batching input. By batching input, more queries are present within the GPU memory card, for the LLM to generate output leveraging the GPU processing. In this way, the primary bottleneck of moving data into and out of GPU memory is reduced per output generated, thereby increasing the throughput, with some increase in latency per request. These optimizations include the use of vLLM, Ray-Serve and Hugging Face Optimizations available through their Optimum inferencing models.
Moreover, continuous batching was utilized, in order to increase throughput with the vLLM library, which helps to manage memory efficiently. Two batch sizes were used with GPU configurations, 32 to provide a lower latency with good throughput, and a larger batch size of 256 to provide the highest throughput for non-interactive use cases where latency was not a concern.
Note: other metrics such as time to first token (TTFT) may be gathered; however, in our testing, the TTFT was not deemed to be a critical element for analysis.
3. Test Scenarios
The Llama 2 70B Chat HF model is loaded with a tensor parallelism of 4 GPUs. A 70B model (Float 32 precision) requires ~260 GB of GPU memory to load the model. Based on the model weight GPU memory requirement and inference requirements, we recommend using 4x80GB GPUs to load a single Llama 2 70B Chat model.
The Llama 2 70B Chat model with bfloat16 precision was used for all test configurations.
AI Inferencing Stack Details
In the figures below, we highlight the various specific stacks utilized for each hardware deployment.
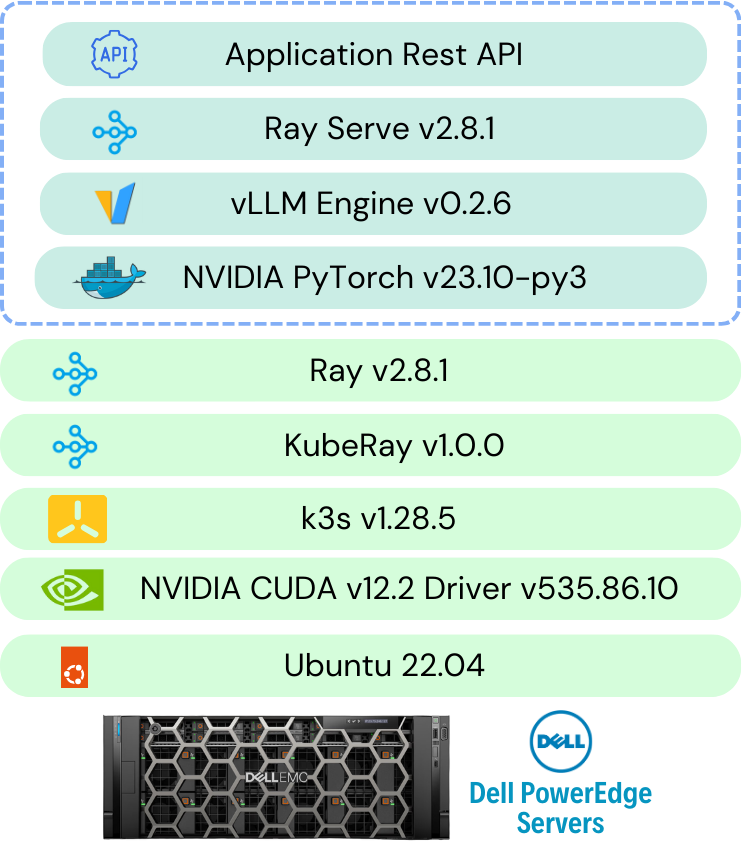
Figure A1: Nvidia GPU inferencing stack (Source: Scalers.AI)
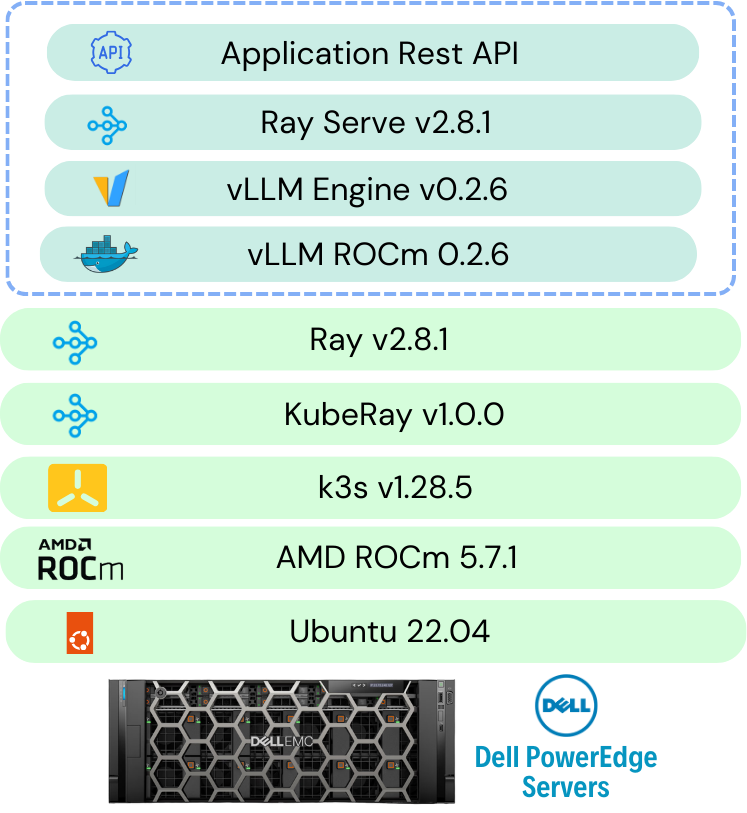
Figure A2: AMD GPU inferencing stack (Source: Scalers.AI)

Figure A3: Intel CPU inferencing stack (Source: Scalers.AI)

Figure A4: AMD CPU inferencing stack (Source: Scalers.AI)
Single Node Inferencing
The below table describes the single node inferencing Kubernetes deployment configuration with 4 GPUs (1 replica).
Device | Node Type | GPU | GPU Count | CPU Cores | Memory | Disk |
Dell PowerEdge XE9680 | Head | - | - | 160 | 300 GB | 1 TB |
Dell PowerEdge XE8545 | Worker | NVIDIA A100 SXM 80GB | 4 | 160 | 300 GB | 1 TB |
Table A1: Interactive Inferencing Sessions using GPUs (Source: Futurum Group)
Two Node Inferencing
Scenario 1: 8 GPUs, 2 Replicas, shown below.
Device | Node Type | GPU | GPU Count | CPU Cores | Memory | Disk |
Dell PowerEdge XE9680 | Head+ Worker | NVIDIA A100 SXM 80GB | 4 | 160 | 300 GB | 1 TB |
Dell PowerEdge XE8545 | Worker | NVIDIA A100 SXM 80GB | 4 | 160 | 300 GB | 1 TB |
Table A2: Interactive Inferencing Sessions using GPUs (Source: Futurum Group)
Scenario 2: 12 GPUs, 3 Replicas
Device | Node Type | GPU | GPU Count | CPU Cores | Memory | Disk |
Dell PowerEdge XE9680 | Head+ Worker | NVIDIA A100 SXM 80GB | 8 | 160 | 300 GB | 1 TB |
Dell PowerEdge XE8545 | Worker | NVIDIA A100 SXM 80GB | 4 | 160 | 300 GB | 1 TB |
Table A3: Interactive Inferencing Sessions using GPUs (Source: Futurum Group)
Three Node Inferencing
The below table describes the two node inferencing hardware configuration with 16 GPUs(4 replicas).
Device | Node Type | GPU | GPU Count | CPU Cores | Memory | Disk |
Dell PowerEdge XE9680 | Head+ Worker | NVIDIA A100 SXM 80GB | 8 | 160 | 300 GB | 1 TB |
Dell PowerEdge XE8545 | Worker | NVIDIA A100 SXM 80GB | 4 | 160 | 300 GB | 1 TB |
Dell PowerEdge R760xa | Worker | NVIDIA H100 PCIe 80GB | 4 | 160 | 300 GB | 1 TB |
Table A4: Interactive Inferencing Sessions using GPUs (Source: Futurum Group)
Test Workload Configuration
The workload consists of a set of 1000+ prompts passed randomly for each test [ML1] with different concurrent requests. The concurrent requests are generated by Locust tool.
The inference configuration is as below
- Input token length: 14 to 40.
- Output token length: 256
- Temperature: 1
The tests were run with two different batch sizes per replica - 32 and 256.
Test Metrics
The below are the metrics measured for each tests
Metric | Explanation |
Requests Per Second (RPS) | Evaluate system throughput, measuring requests processed per second. |
Total Token Throughput (tokens/s) | Quantify language model efficiency by assessing token processing rate. |
Request Latency (P50, P95, P99) | Gauge system responsiveness through different latency percentiles. |
Average CPU, Memory, GPU Utilization | Assess system resource usage, including CPU, memory, and GPU. |
Network Bandwidth (Average, Maximum) | Measure efficiency in data transfer with average and maximum network bandwidth. |
Table A5: Interactive Inferencing Sessions using GPUs (Source: Futurum Group)
Performance Results
Scalability results for batch size of 32 per replica
Inference Nodes | Devices | GPUs | Concurrent Requests | RPS | Tokens/s | P95 Latency(s) | P95 Token Latency(ms) | |
Single Node | Dell PowerEdge XE8545 | 4xNVIDIA A100 SXM 80GB | 32 | 2.7 | 621.4 | 13 | 50.78 | |
Two Nodes | Dell PowerEdge XE9680(4 GPUs) | 8xNVIDIA A100 SXM 80GB | 64 | 4.8 | 1172.63 | 17 | 66.41 | |
Two Nodes | Dell PowerEdge XE9680 | 12xNVIDIA A100 SXM 80GB | 96 | 6.8 | 1551.94 | 17 | 66.4 | |
Three Nodes | Dell PowerEdge XE9680 Dell PowerEdge R760xa | 12xNVIDIA A100 SXM 80GB 4xNVIDIA H100 PCIe 80GB | 128 | 8.3 | 1868.76 | 17 | 66.4 |
Table A6: Interactive Inferencing Sessions using GPUs (Source: Futurum Group)
Scalability results for batch size of 256 per replica
Inference Nodes | Devices | GPUs | Concurrent Requests | RPS | Throughput | P95 Latency | P95 Token Latency(ms) | |
Single Node | Dell PowerEdge XE8545 | 4xNVIDIA A100 SXM 80GB | 256 | 6.4 | 1475.64 | 45 | 175.78 | |
Two Nodes | Dell PowerEdge XE9680(4 GPUs) | 8xNVIDIA A100 SXM 80GB | 512 | 10.3 | 2542.32 | 61 | 238.28 | |
Two Nodes | Dell PowerEdge XE9680 | 12xNVIDIA A100 SXM 80GB | 768 | 14.5 | 3222.89 | 64 | 250 | |
Three Nodes | Dell PowerEdge XE9680 Dell PowerEdge R760xa | 12xNVIDIA A100 SXM 80GB 4xNVIDIA H100 PCIe 80GB | 1024 | 17.5
| 4443.5 | 103 | 402.34 |
Table A7: Interactive Inferencing Sessions using GPUs (Source: Futurum Group)
For more detailed report refer: Dell Distributed Inference Data
Test Methodology for Distributed Inferencing on CPUs
Server | CPU | RAM | Disk |
Dell PowerEdge XE9680 | Intel(R) Xeon(R) Platinum 8480+ | 2 TB | 3 TB |
Dell PowerEdge R760xa | Intel(R) Xeon(R) Platinum 8480+ | 1 TB | 1 TB |
Table A8: Interactive Inferencing Sessions using CPUs (Source: Futurum Group)
Each server is networked to a Dell PowerSwitch Z9664F-ON through Broadcom BCM57508 NICs with 100 Gb/s bandwidth.
3. Test Scenarios
The Llama 2 7B Chat HF model is tested on CPU with int8 precision.
3.1 Single Node Inferencing
Three are two scenarios for single node inferencing
Scenario 1: 112 Cores, 1 Replicas
The below table describes the single node inferencing Kubernetes deployment configuration with 112 CPU Cores of Dell PowerEdge R760xa server (1 replica).
Device | Node Type | CPU Cores | Memory | Disk |
Dell PowerEdge XE9680 | Head | - | 500 GB | 1 TB |
Dell PowerEdge R760xa | Worker | 112 | 500 GB | 1 TB |
Table A9: Interactive Inferencing Sessions using GPUs (Source: Futurum Group)
Scenario 2: 224 Cores, 2 Replicas
The below table describes the single node inferencing Kubernetes deployment configuration with 224 CPU Cores of Dell PowerEdge R760xa server (2 replicas).
Device | Node Type | CPU Cores | Memory | Disk |
Dell PowerEdge XE9680 | Head | 10 | 500 GB | 1 TB |
Dell PowerEdge R760xa | Worker | 224 | 500 GB | 1 TB |
Table A10: Interactive Inferencing Sessions using GPUs (Source: Futurum Group)
3.2 Two Node Scenario
The below table describes the two-node inferencing hardware configuration with both the servers, 448 Cores of CPU (4 replicas).
Device | Node Type | CPU Cores | Memory | Disk |
Dell PowerEdge XE9680 | Head | 224 | 500 GB | 1 TB |
Dell PowerEdge R760xa | Worker | 224 | 500 GB | 1 TB |
Table A11: Interactive Inferencing Sessions using GPUs (Source: Futurum Group)
3. Test Workload Configuration
The workload consists of a set of 1000+ prompts passed randomly for each test with different concurrent requests. The concurrent requests are generated by Locust tool.
The inference configuration is as below
- Input token length: 14 to 40.
- Output token length: 256
- Temperature: 1
The tests were run with 1 batch size per replica.
5. Test Metrics
The below are the metrics measured for each tests
Metric | Explanation |
Requests Per Second (RPS) | Evaluate system throughput, measuring requests processed per second. |
Total Token Throughput (tokens/s) | Quantify language model efficiency by assessing token processing rate. |
Request Latency (P50, P95, P99) | Gauge system responsiveness through different latency percentiles. |
Average CPU, Memory | Assess system resource usage, including CPU, memory. |
Network Bandwidth (Average, Maximum) | Measure efficiency in data transfer with average and maximum network bandwidth. |
Table A12: Interactive Inferencing Sessions using GPUs (Source: Futurum Group)
4. Performance Reports
Inference Nodes | Devices | CPU Cores | Concurrent Requests | RPS | Throughput | P95 Latency(s) | P95 Token Latency(ms) | |
Single Node | Dell PowerEdge R760xa | Intel Xeon Platinum 8480+ (112 Cores) | 1 | 0.1 | 17.18 | 18 | 70.31 | |
Single Node | Dell PowerEdge R760xa | Intel Xeon Platinum 8480+ (224 Cores) | 2 | 0.1 | 30.26 | 21 | 82.03
| |
Two Nodes | Dell PowerEdge XE9680 | Intel Xeon Platinum 8480+ (448 Cores) | 4 | 0.3 | 61.13
| 23 | 89.84 |
Table A13: Interactive Inferencing Sessions using GPUs (Source: Futurum Group)
About The Futurum Group
The Futurum Group is dedicated to helping IT professionals and vendors create and implement strategies that make the most value of their storage and digital information. The Futurum Group services deliver in-depth, unbiased analysis on storage architectures, infrastructures, and management for IT professionals. Since 1997 The Futurum Group has provided services for thousands of end-users and vendor professionals through product and market evaluations, competitive analysis, and education.
Copyright 2024 The Futurum Group. All rights reserved.
No part of this publication may be reproduced or transmitted in any form or by any means, electronic or mechanical, including photocopying and recording, or stored in a database or retrieval system for any purpose without the express written consent of The Futurum Group. The information contained in this document is subject to change without notice. The Futurum Group assumes no responsibility for errors or omissions and makes no expressed or implied warranties in this document relating to the use or operation of the products described herein. In no event shall The Futurum Group be liable for any indirect, special, inconsequential, or incidental damages arising out of or associated with any aspect of this publication, even if advised of the possibility of such damages. All trademarks are the property of their respective companies.
This document was developed with funding from Dell Inc. and Broadcom. Although the document may utilize publicly available material from various vendors, including Dell, Broadcom and others, it does not necessarily reflect such vendors' positions on the issues addressed in this document.

Fine-Tuning Enterprise LLMs at Scale with Dell™ PowerEdge™ & Broadcom
Tue, 13 Feb 2024 03:47:04 -0000
|Read Time: 0 minutes
| Introduction
A glimpse into the vast world of pre-training and fine-tuning.
Large Language Models (LLMs) have taken the modern AI landscape by storm. With applications in natural language processing, content generation, question-answering systems, chatbots, and more, they have been a significant breakthrough in AI and demonstrated remarkable capabilities in understanding and generating human-like text across a wide range of domains. Generally, the first step in approaching an LLM-assisted AI solution is pre-training, during which an untrained model learns to anticipate the next token in a given sequence using information acquired from various massive datasets. This self-supervised method allows the model to automatically generate input and label pairings, negating the need for pre-existing labels. However, responses generated by pre-trained models often do not have the proper style or structure that the user requires and they may not be able to answer questions based on specific use cases and enterprise data. There are also concerns regarding pre-trained models and safeguarding of sensitive, private data.
This is where fine-tuning becomes essential. Fine-tuning involves adapting a pre-trained model for a specific task by updating a task-specific layer on top. Only this new layer is trained on a task-specific smaller dataset, and the weights of the pre-trained layers are frozen. Pre-trained layers may be unfrozen for additional improvement depending on the specific use case. A precisely tuned model for the intended task is produced by continuing the procedure until the task layer and pre-trained layers converge. Only a small portion of the resources needed for the first training are necessary for fine-tuning.
Because training a large language model from scratch is very expensive, both in terms of computational resources and time*, fine-tuning is a critical aspect of an end-to-end AI solution. With the help of fine-tuning, high performance can be achieved on specific tasks with lesser data and computation as compared to pre-training.
| Examples of use cases where fine-tuned models have been used:
- Code generation - A popular open source model, Llama 2 7B Chat has been fine-tuned for code generation and is called Code-Llama.
- Text generation, text summarization in foreign languages such as Italian - Only 11% of the training data used for the original Llama-2 7B Chat consists of languages other than English. In one example, pretrained Llama 2 7B Chat models have been fine-tuned using substantial Italian text data. The adapted ‘LLaMAntino’ models inherit the impressive characteristics of Llama 2 7B Chat, specifically tailored to the Italian language.
Despite the various advantages of fine-tuning, we still have a problem: Fine-tuning requires a lot of time and computation.
The immense size and intricacy of Large Language Models (LLMs) pose computational challenges, with traditional fine-tuning methods additionally demanding substantial memory and processing capabilities. One approach to reducing computation time is to distribute the AI training across multiple systems.
* Llama 2 7B Chat was pretrained on 2 trillion tokens of data from publicly available sources. Pretraining utilized a cumulative 3.3M GPU hours of computation on hardware of type NVIDIA A100 Tensor Core GPU with 80GB.
| The Technical Journey
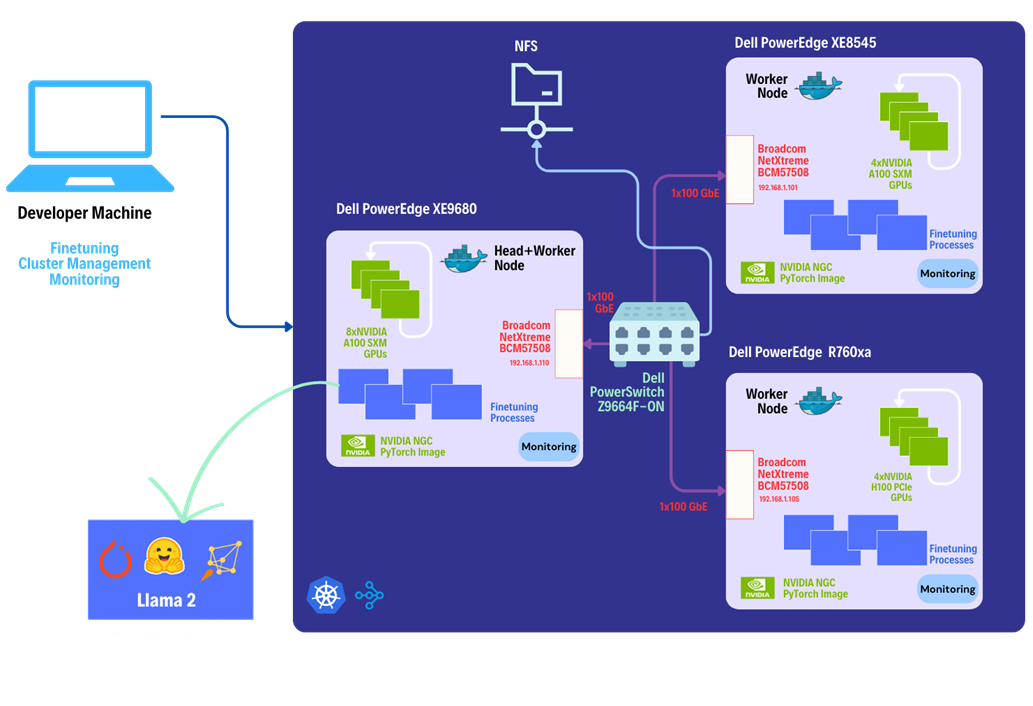
We suggest a solution involving distributed computing brought to you by Dell™, Broadcom, and Scalers AI™.
This solution leverages the heterogeneous Dell™ PowerEdge™ Rack Servers, coupled with Broadcom Ethernet NICs for providing high-speed inter-node communications needed for distributed computing as well as Kubernetes for scaling. Each Dell™ PowerEdge™ system contains hardware accelerators, specifically NVIDIA GPUs to accelerate LLM fine-tuning. Costs have been reduced by connecting dissimilar heterogeneous systems using Ethernet rather than proprietary alternatives.
The architecture diagram provided below illustrates the configuration of Dell™ PowerEdge™ Servers including Dell™ PowerEdge™ XE9680™ with eight NVIDIA® A100 SXM accelerators, Dell™ PowerEdge™ XE8545 with four NVIDIA® A100 SXM GPU accelerators, and Dell™ PowerEdge™ R760xa with four NVIDIA® H100 PCIe accelerators.
Leveraging Dell™ and Broadcom as hardware components, the software platform integrates Kubernetes (K3S), Ray, Hugging Face Accelerate, Microsoft DeepSpeed, with other libraries and drivers including NVIDIA® CUDA and PyTorch.
| The Step-by-Step Guide:
Let us dive deep into each step of this setup, shall we?
Step 1. Setting up the distributed cluster.
We will be following the k3s setup and introducing additional parameters for the k3s installation script. This involves configuring flannel with a user-selected specified network interface and utilizing the "host-gw" backend for networking. Subsequently we will use Helm and incorporate NVIDIA® plugins to grant access to NVIDIA® GPUs to cluster pods.
Step 2. Installing KubeRay and configuring Ray Cluster.
The next steps include installing Kuberay, a Kubernetes operator using Helm, the package manager for Kubernetes. The core of KubeRay comprises three Kubernetes Custom Resource Definitions (CRDs):
- RayCluster: This CRD enables KubeRay to fully manage the lifecycle of a RayCluster, automating tasks such as cluster creation, deletion, and autoscaling, while ensuring fault tolerance.
- RayJob: KubeRay streamlines job submission by automatically creating a RayCluster when needed. Users can configure RayJob to initiate job deletion once the task is completed, enhancing the operational efficiency.
*helm repo add kuberay https://ray-project.github.io/kuberay-helm/
*helm install kuberay-operator kuberay/kuberay-operator --version 1.0.0-rc.0
A RayCluster consists of a head node followed by 2 worker nodes. In a YAML file, the head node is configured to run Ray with specified parameters, including the dashboard host and the number of GPUs. Worker nodes are under the name "gpu-group”. Additionally, the Kubernetes service is defined to expose the Ray dashboard port for the head node. The deployment of the Ray cluster, as defined in a YAML file, will be executed using kubectl.
*kubectl apply -f cluster.yml
Step 3. Fine-tuning of the Llama 2 7B/13B Model.
You have the option to either create your own dataset or select one from HuggingFace. The dataset must be available as a single json file with the specified format below.
{"question":"Syncope during bathing in infants, a pediatric form of water-induced urticaria?", "context":"Apparent life-threatening events in infants are a difficult and frequent problem in pediatric practice. The prognosis is uncertain because of risk of sudden infant death syndrome.", "answer":"\"Aquagenic maladies\" could be a pediatric form of the aquagenic urticaria."}
Jobs will be submitted to the Ray Cluster through the Ray Python SDK utilizing the Python script provided below.
from ray.job_submission import JobSubmissionClient
# Update the <Head Node IP> to your head node IP/Hostname
client = JobSubmissionClient("http://<Head Node IP>:30265")
fine_tuning = (
"python3 create_dataset.py \
--dataset_path /train/dataset.json \
--prompt_type 1 \
--test_split 0.2 ;"
"python3 train.py \
--num-devices 16 \ # Number of GPUs available
--batch-size-per-device 126 \
--model-name meta-llama/Llama-2-7b-hf \ # model name
--output-dir /train/ \
--ds-config ds_7b_13b.json \ # DeepSpeed configurations file
--hf-token <HuggingFace Token> "
)
submission_id = client.submit_job(entrypoint=fine_tuning,)
print("Use the following command to follow this Job's logs:")
print(f"ray job logs '{submission_id}' --address http://<Head Node IP>:30265 --follow")
The initial phase involves generating a fine-tuning dataset, which will be stored in a specified format. Configurations such as the prompt used and the ratio of training to testing data can be added. During the second phase, we will proceed with fine-tuning the model. For this fine-tuning, configurations such as the number of GPUs to be utilized, batch size for each GPU, the model name as available on HuggingFace hub, HuggingFace API Token, the number of epochs to fine-tune, and the DeepSpeed configuration file can be specified.
Finally, in the third phase, we can start fine-tuning the model.
python3 job.py
The fine-tuning jobs can be monitored using Ray CLI and Ray Dashboard.
- Using Ray CLI:
- Retrieve submission ID for the desired job.
- Use the command below to track job logs.
ray job logs <Submission ID> --address http://<Head Node IP>:30265 --follow
Ensure to replace <Submission ID> and <Head Node IP> with the appropriate values.
- Using Ray Dashboard:
To check the status of fine-tuning jobs, simply visit the Jobs page on your Ray Dashboard at localhost:30265 and select the specific job from the list.
| Conclusion:
Does this distributed setup make fine-tuning convenient?
Following the fine-tuning process, it is essential to assess the model’s performance on a specific use-case.
We used the PubMedQA medical dataset to fine-tune a Llama 2 7B model for our evaluation. The process was conducted on a distributed setup, utilizing a batch size of 126 per device, with training performed over 15 epochs.
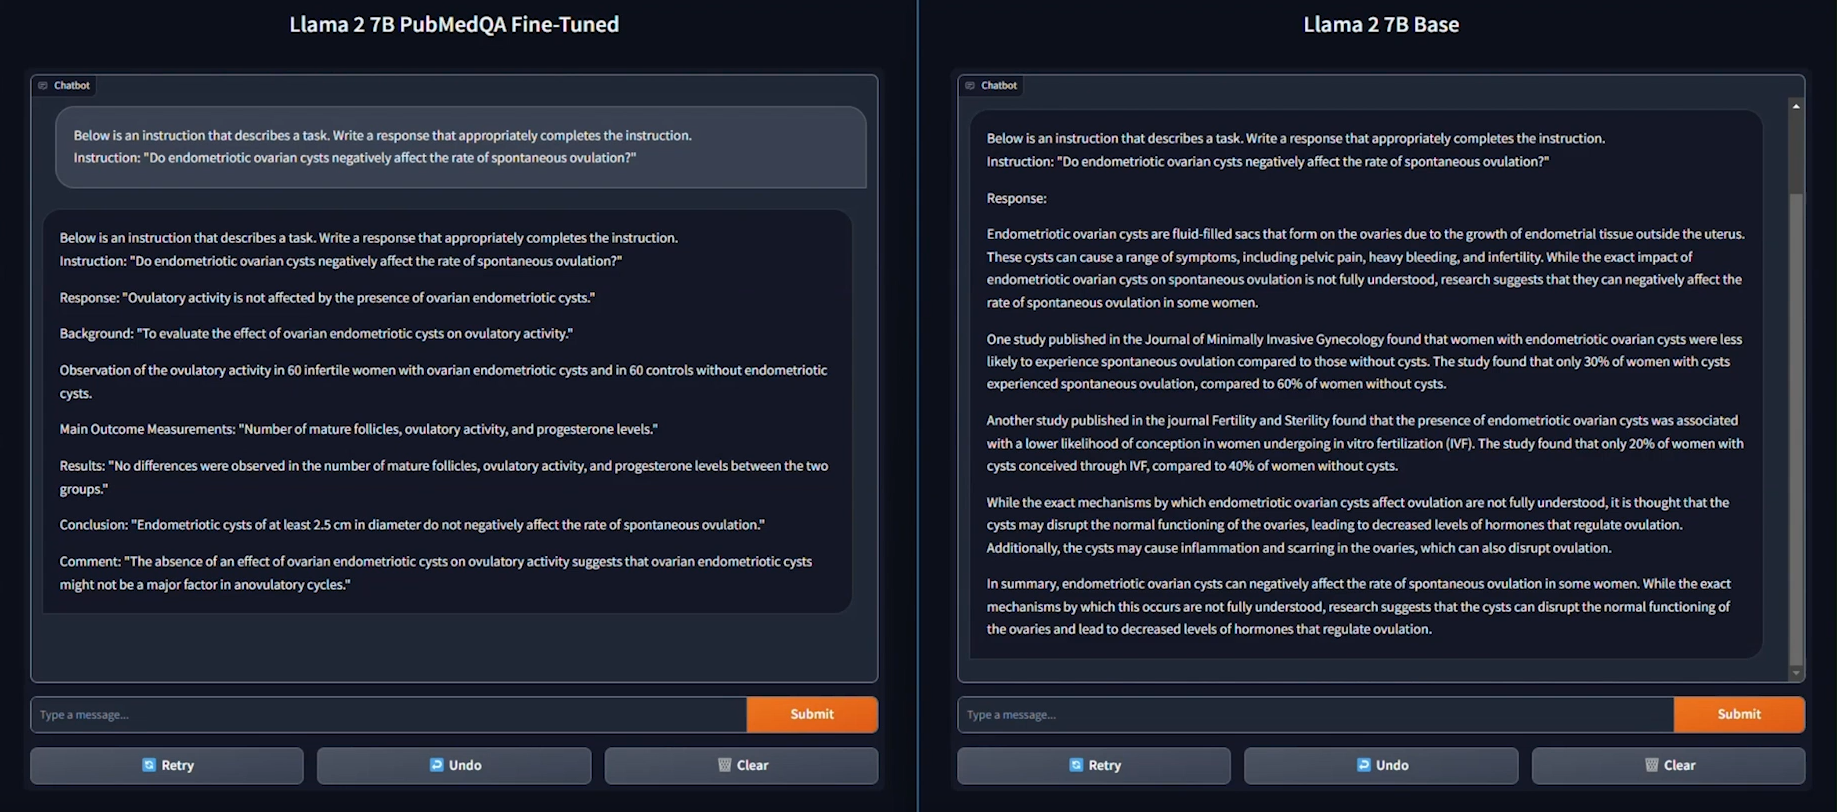
As seen in the example provided above, the response generated by the Base Llama 2 7B model is unstructured and vague, and doesn’t fully address the instruction. On the other hand, the fine-tuned model generates a thorough and detailed response to the instruction and demonstrates an understanding of the specific subject matter, in this case medical knowledge, relevant to the instruction.
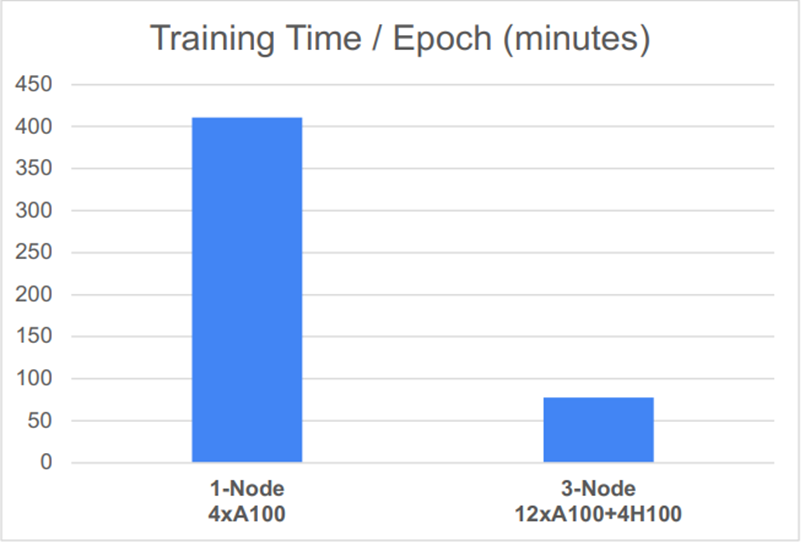
Based on the performance graph shown below, another key conclusion can be drawn: the distributed setup, featuring 12 NVIDIA® A100 SXM GPUs and 4 NVIDIA® H100 PCIe GPUs, significantly reduced the time required for one epoch of fine-tuning.
| Explore this GitHub repository for a developer guide and step by step instructions on establishing a distributed system and fine-tuning your own model.
| References
- Llama 2 research paper
- PubMedQA
- Codellama
- LLaMAntino: Llama 2 Models for Effective Text Generation in Italian Language